
Higher Education Energy Efficiency Partnership Program
BEST PRACTICES AWARDS
UC / CSU Sustainability Conference, June 2005
A program created by the UC/CSU/IOU Partnership
and under the auspices of the California Public Utilities Commission

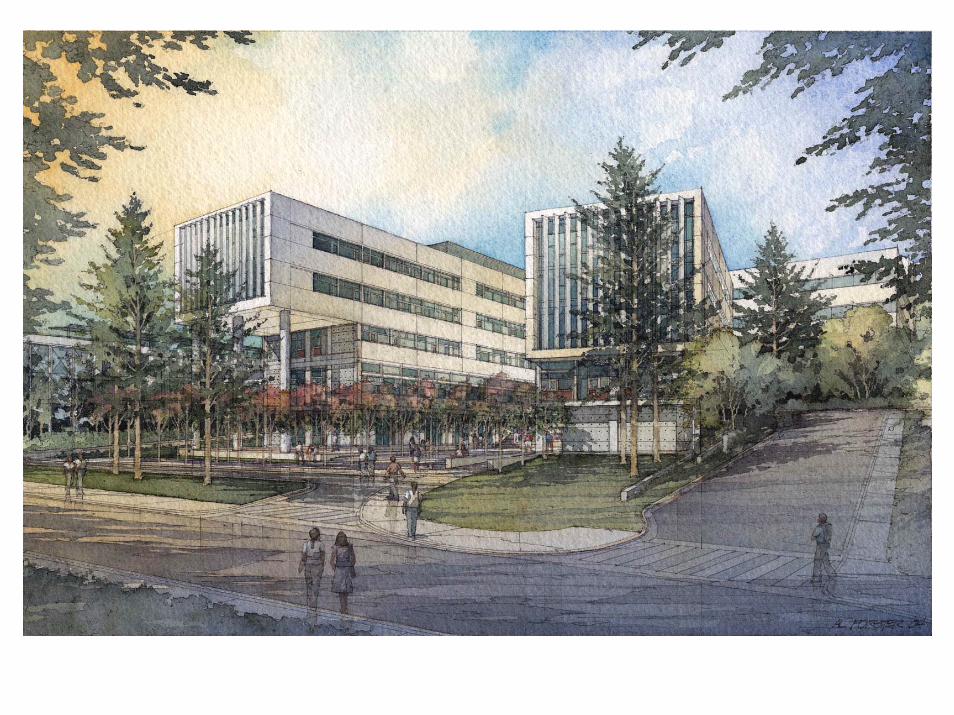
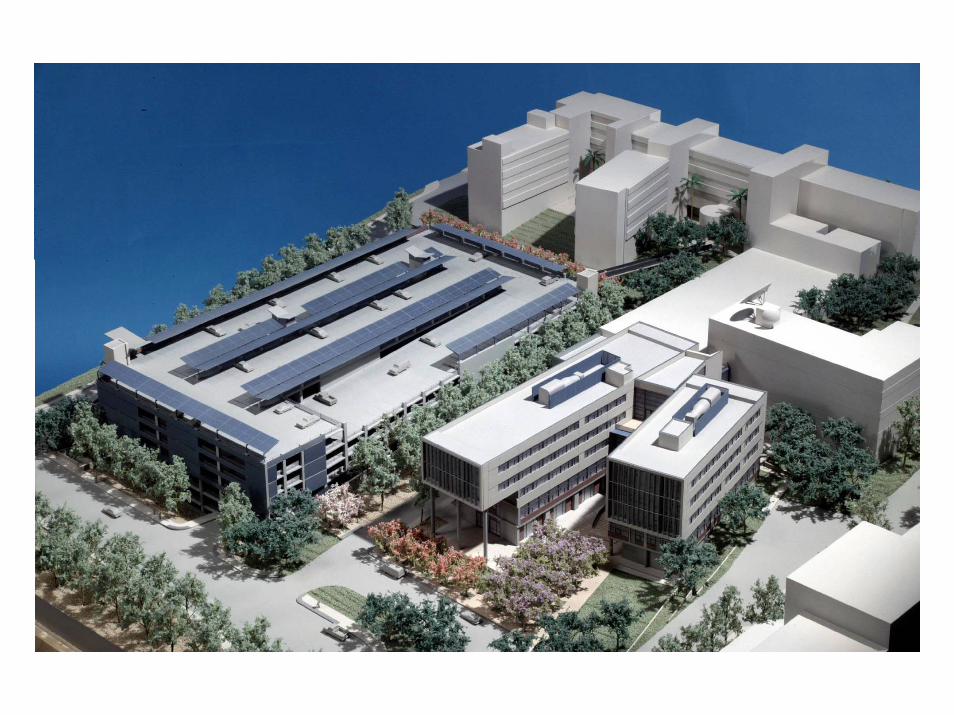
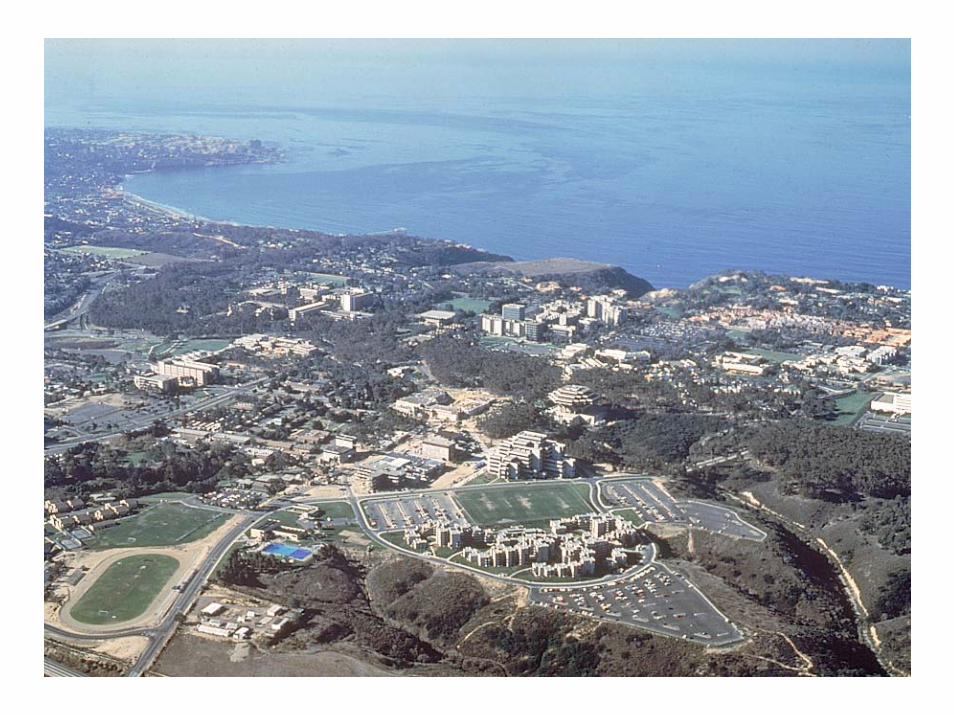
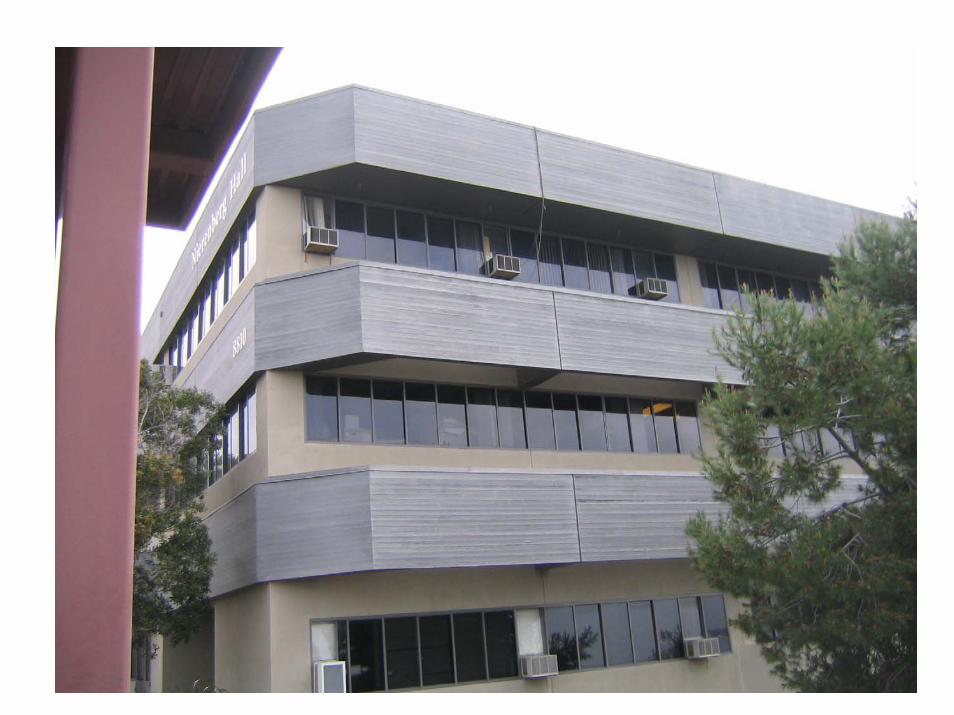
UC San Diego
Supercomputer Center
Craig Johnson, PE

Rumsey Engineers Inc
Peter Rumsey, Cindy Regnier
EHDD Architecture
Richard Feldman
NaturalWorks Engineering Consultants
Paul F. Linden, Guilherme Carrilho da Graça.
L B N L - Commercial Building Systems Group
Philip Haves

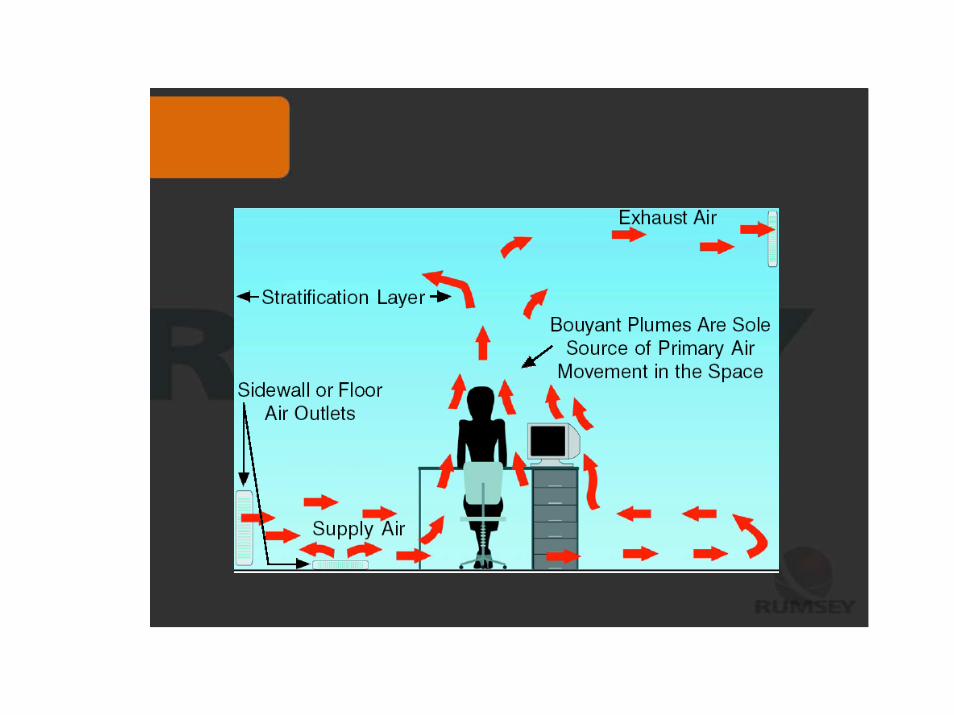
Displacement Ventilation with Hot Water Radiators


Engineering
• Creativity • Science

Engineering
• Creativity
• Every building is a new opportunity
• Science
• Prove it
Generic design objectives
• First, ensure that the HVAC system meets the needs of the building occupants
• Second, deliver this environment as efficiently as possible


Environmental Issues
• Fog• Airborne salt• Airborne particles• Santa Ana conditions• Solar loads (esp. in winter)

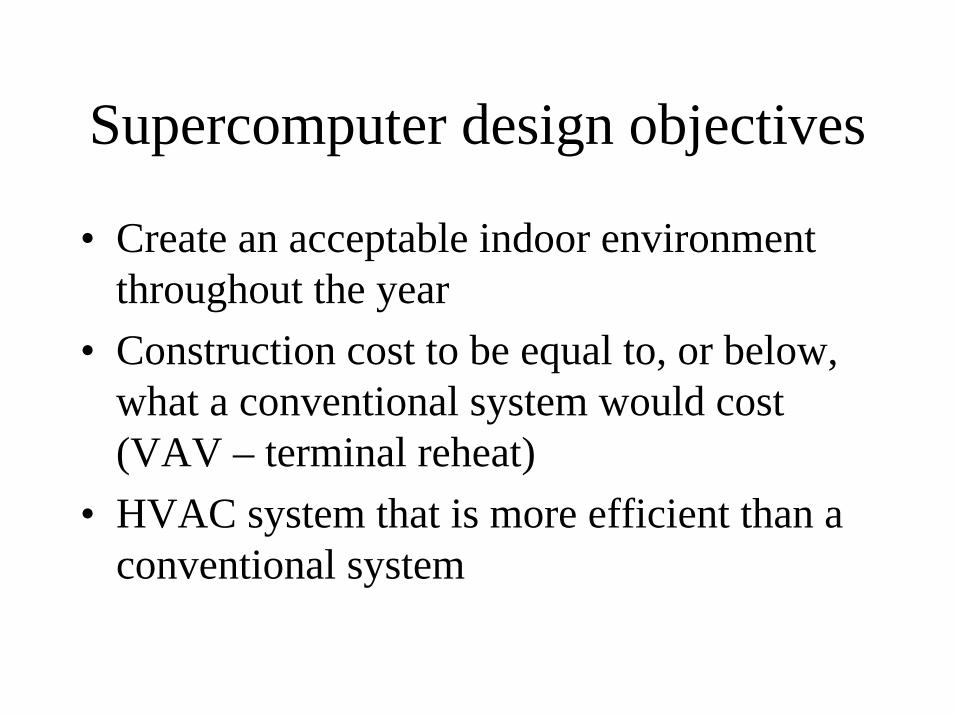
Supercomputer design objectives
• Create an acceptable indoor environment throughout the year
• Construction cost to be equal to, or below, what a conventional system would cost (VAV – terminal reheat)
• HVAC system that is more efficient than a conventional system

PMV = (0.303e–0.036M + 0.028) {(M – W) – 3.05 x 10–3 x [5733 – 6.99(M – W) – pa] – 0.42 x [(M – W) – 58.15] – 1.7 x 10⁻⁵ M(5867 – pa) – 0.0014M(34 – ta) – 3.96x10⁻⁸fcl x [(tcl + 273)4] – (tr + 273)4] – fclhc(tcl – ta)}
Significant design factors
• To produce simple and efficient designs we need to hire wiser designers (wisdom is more critical than knowledge)
• The mechanical engineering firm is accountable for indoor comfort levels
• The University needs to play a role in the selection of the mechanical consultant
San Diego Supercomputer CenterPerformance simulation of the indoor climate control system
Optimization of the shading design
NaturalWorks Engineering ConsultantsPaul F. Linden, Guilherme Carrilho da Graça.
L B N L - Commercial Building Systems Group
Philip Haves

Introduction
1- Site climate analysis
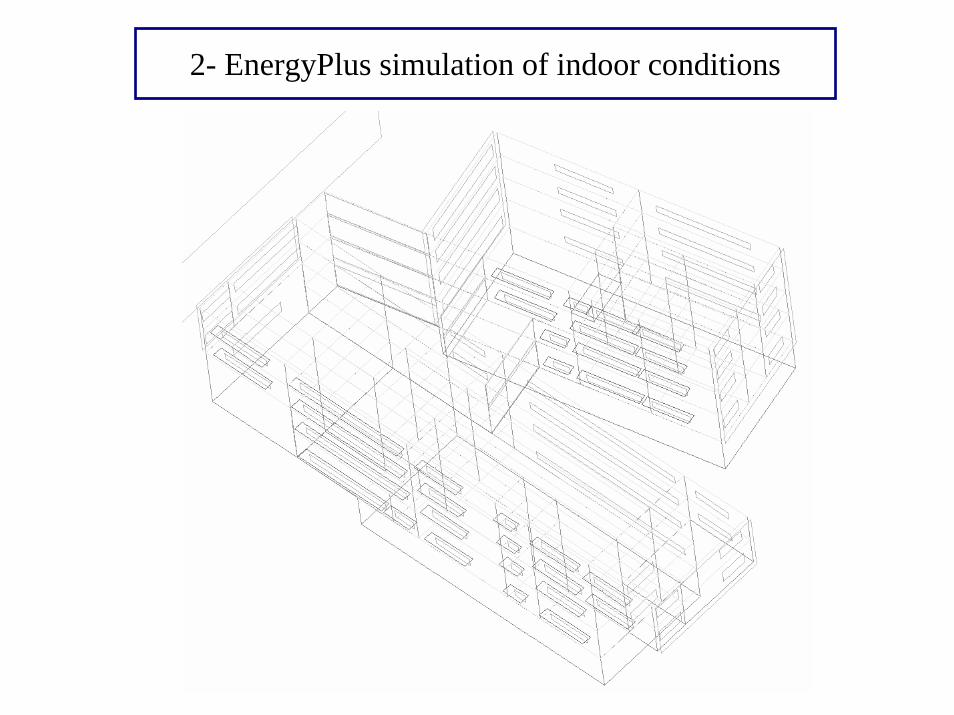
2- EnergyPlus simulation of indoor conditions
3- Analysis of external shading systems
Conclusions
Presentation Contents
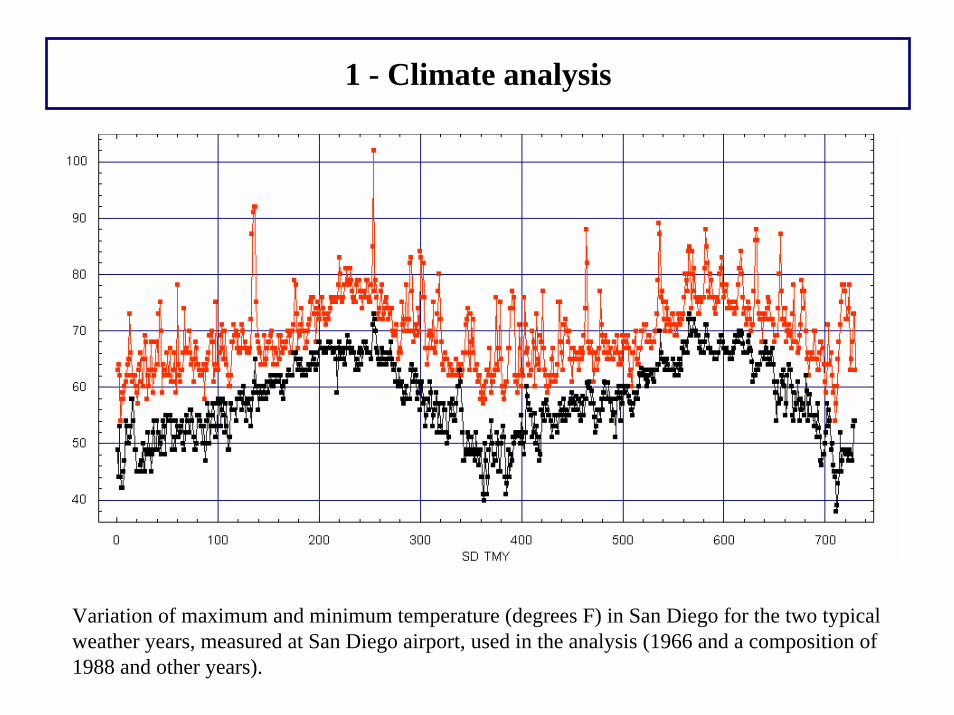
1 - Climate analysis
Variation of maximum and minimum temperature (degrees F) in San Diego for the two typical weather years, measured at San Diego airport, used in the analysis (1966 and a composition of 1988 and other years).
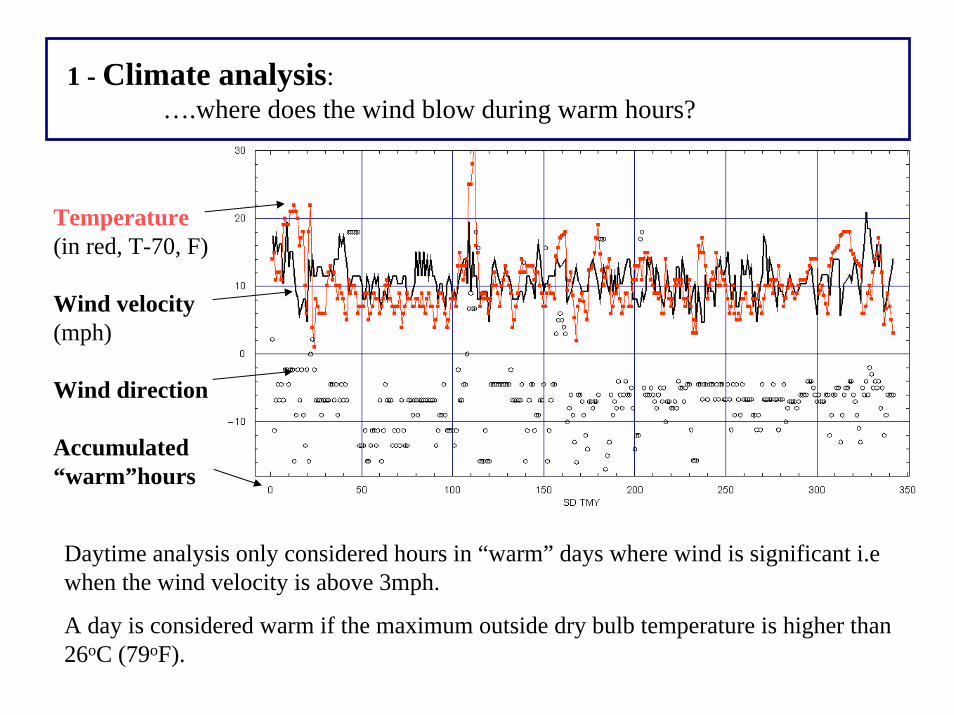
Temperature(in red, T-70, F)
Wind velocity (mph)
Wind direction
Accumulated “warm”hours
1 - Climate analysis: ….where does the wind blow during warm hours?
Daytime analysis only considered hours in “warm” days where wind is significant i.e when the wind velocity is above 3mph.
A day is considered warm if the maximum outside dry bulb temperature is higher than 26oC (79oF).
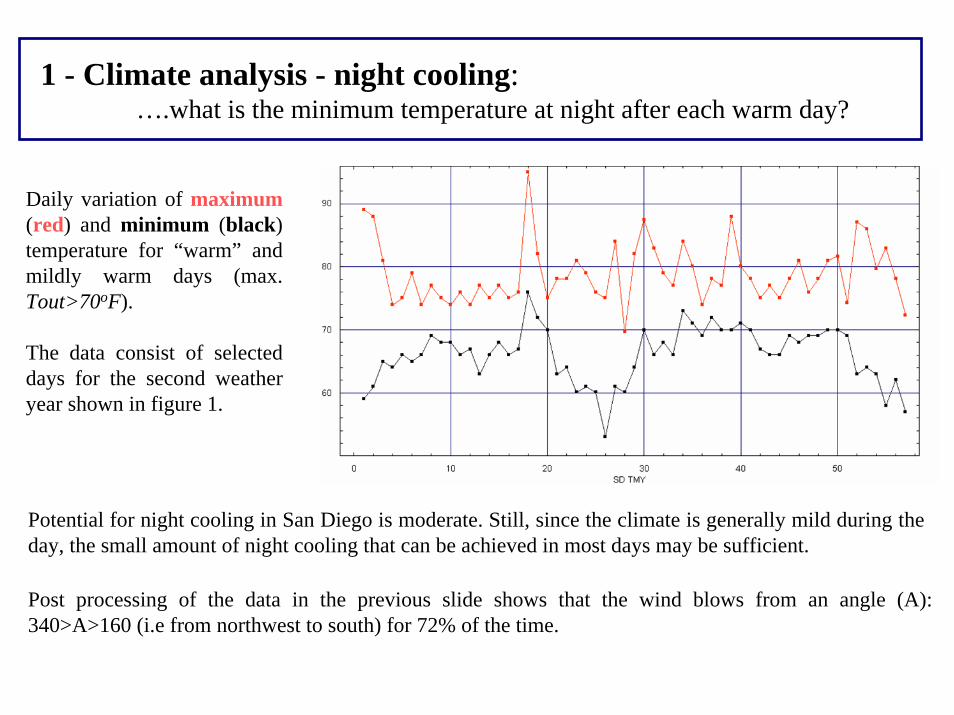
Daily variation of maximum(red) and minimum (black) temperature for “warm” and mildly warm days (max. Tout>70oF).
The data consist of selected days for the second weather year shown in figure 1.
1 - Climate analysis - night cooling: ….what is the minimum temperature at night after each warm day?
Potential for night cooling in San Diego is moderate. Still, since the climate is generally mild during the day, the small amount of night cooling that can be achieved in most days may be sufficient.
Post processing of the data in the previous slide shows that the wind blows from an angle (A): 340>A>160 (i.e from northwest to south) for 72% of the time.
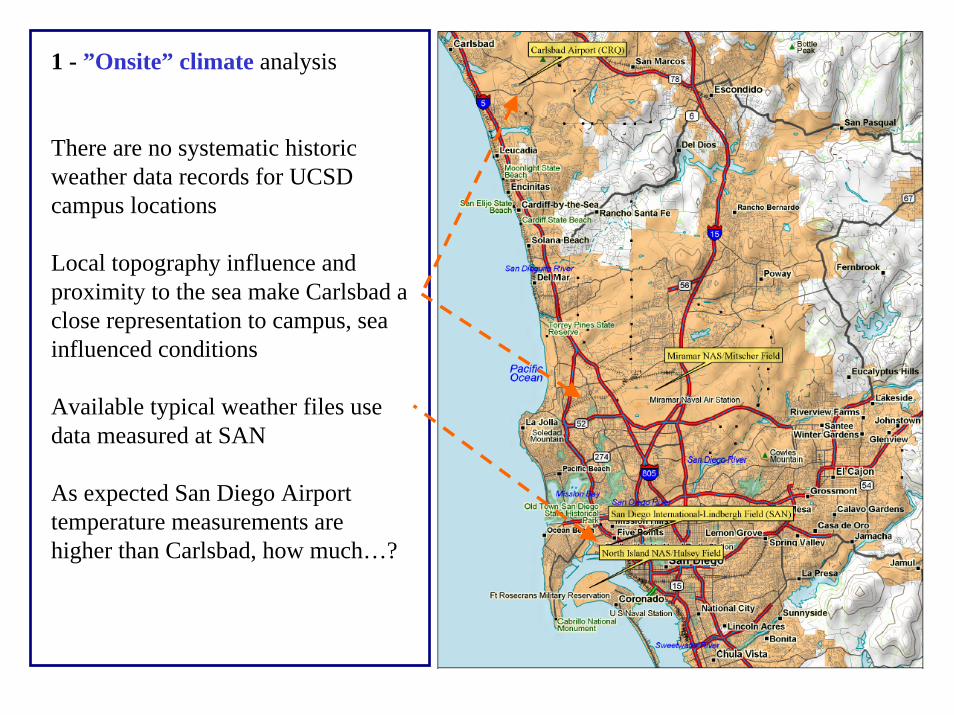
1 - ”Onsite” climate analysis
There are no systematic historic weather data records for UCSD campus locations
Local topography influence and proximity to the sea make Carlsbad a close representation to campus, sea influenced conditions
Available typical weather files use data measured at SAN
As expected San Diego Airport temperature measurements are higher than Carlsbad, how much…?

Data and method used in the analysis
Two typical weather data years, using data measured at the San Diego Airport (SAN): 1966 and a composition of1988 and other years (the year used changes on a monthly basis)
Five years of temperature and wind data measured in the Carlsbad weather station (1999, 2000, 2001, 2002 and 2003)
Steps taken:
1- A representative year for the Carlsbad (KCRQ) weather data was selected (conservatively we used one of the warmer years)
2- The two SAN and the representative KCRQ year where compared (analysis of maximum and minimum daily temperatures, running averages and degree hours above different temperatures)
3- A matching of degree hours above relevant cooling analysis temperatures (Tout above 26oC, 79oF) was obtained by decreasing the SAN 1988 dry bulb temperature
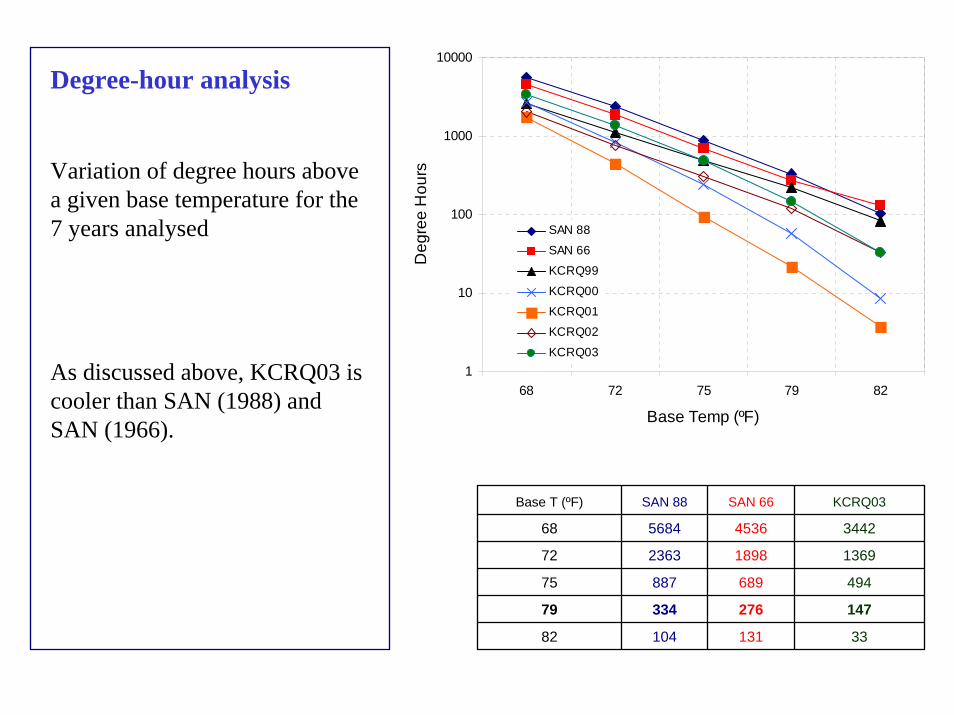
Degree-hour analysis
Variation of degree hours above a given base temperature for the 7 years analysed
As discussed above, KCRQ03 is cooler than SAN (1988) and SAN (1966).
1
10
100
1000
10000
68 72 75 79 82
Base Temp (ºF)D
egre
e H
ours
SAN 88
SAN 66
KCRQ99
KCRQ00
KCRQ01
KCRQ02
KCRQ03
Base T (ºF) SAN 88 SAN 66 KCRQ03
68 5684 4536 3442
72 2363 1898 1369
75 887 689 494
79 334 276 147
82 104 131 33

TMY adjustment
TMY (SAN 1988) and KCRQ03 maximum and minimum daily temperatures
Before adjustment
After adjustment
The typical colder climate of the site is approximately represented by the SAN 1988 data by using a negative offset in the air temperature, obtaining an adjust weather year:
Adjusted = SAN – 2.5 oF
40
45
50
55
60
65
70
75
80
85
90
J F M A M J J A S O N D
Days
Tem
pera
ture
(ºF)
KCRQ03minKCRQ03maxTMYminTMYmax
40
45
50
55
60
65
70
75
80
85
90
J F M A M J J A S O N D
Days
Tem
pera
ture
(ºF)
KCRQ03minKCRQ03maxTMYmin adjTMYmax adj
2- EnergyPlus simulation of indoor conditions

2- EnergyPlus Simulations
The proposed design was modelled using EnergyPlus (closely following design documentation and usage schedules)
The model has 77 independent thermal zones, and more than 700 surfaces
The geometry was “zoned” as shown in the next slides
Two weather files were used: SAN TMY 1988 and SAN TMY 1988 Adjusted to Carlsbad

2- EnergyPlus Simulations
In all zones, internal gains where set to approximately:
Occupants: one occupant every 100sft/10 m2 =>13 W/ m2
Lights: 10 W/ m2
Equipment: 33 W/ m2
Each occupant introduces a gain of 120W and uses a PC/Printer of 300WIn order to test the ability to support higher gains one of the single occupant offices tested was loaded with two occupants
In addition other design variations were tested:
Standard clear glazing (SG)No external insulation in the vertical envelope walls (NI)Optimized, smaller shading devices (SS)Lower gains: one occupant per office (in all closed offices) and half occupancy in the core zones (LG)
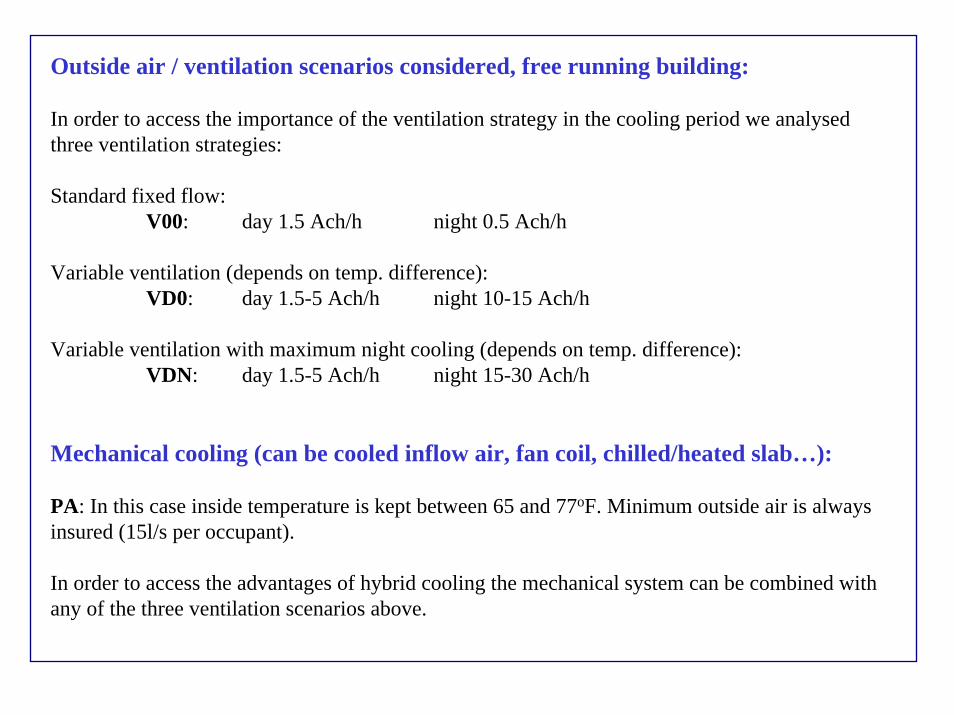
Outside air / ventilation scenarios considered, free running building:
In order to access the importance of the ventilation strategy in the cooling period we analysed three ventilation strategies:
Standard fixed flow:V00: day 1.5 Ach/h night 0.5 Ach/h
Variable ventilation (depends on temp. difference):VD0: day 1.5-5 Ach/h night 10-15 Ach/h
Variable ventilation with maximum night cooling (depends on temp. difference):VDN: day 1.5-5 Ach/h night 15-30 Ach/h
Mechanical cooling (can be cooled inflow air, fan coil, chilled/heated slab…):
PA: In this case inside temperature is kept between 65 and 77oF. Minimum outside air is always insured (15l/s per occupant).
In order to access the advantages of hybrid cooling the mechanical system can be combined with any of the three ventilation scenarios above.
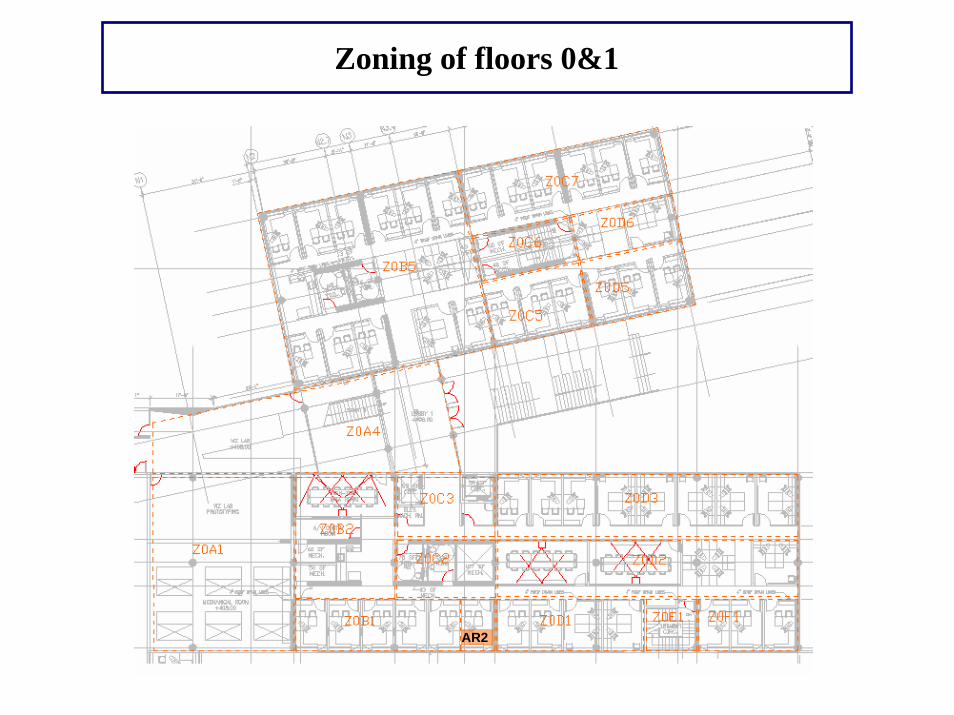
AR2
Zoning of floors 0&1
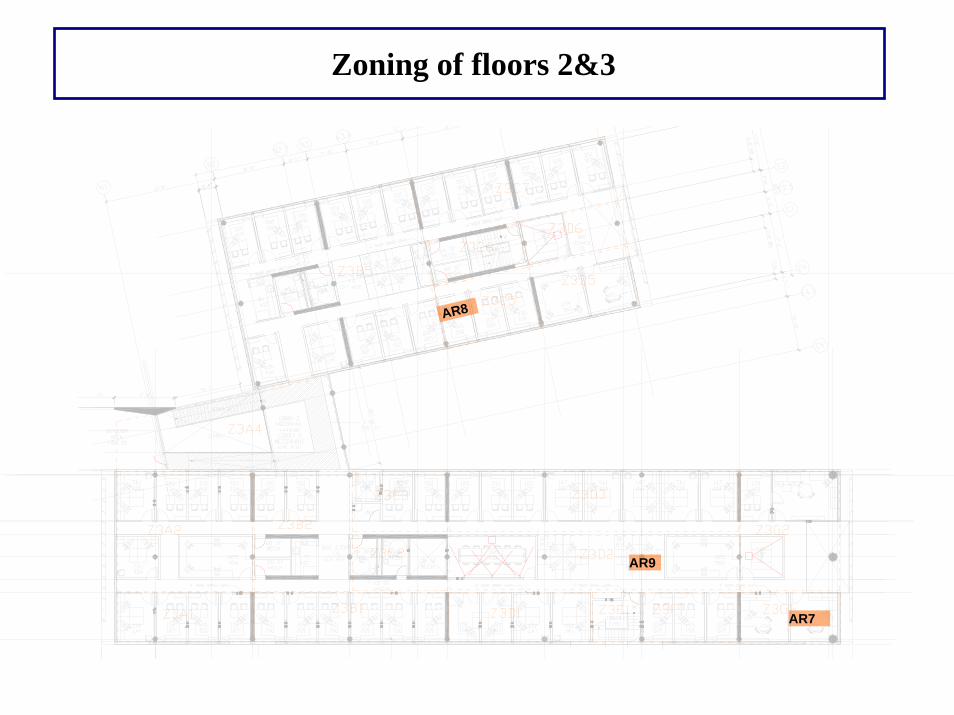
AR7
AR9
AR8
Zoning of floors 2&3

Zone AR02 SOUTH BUILDING, FLOOR 0
AR2
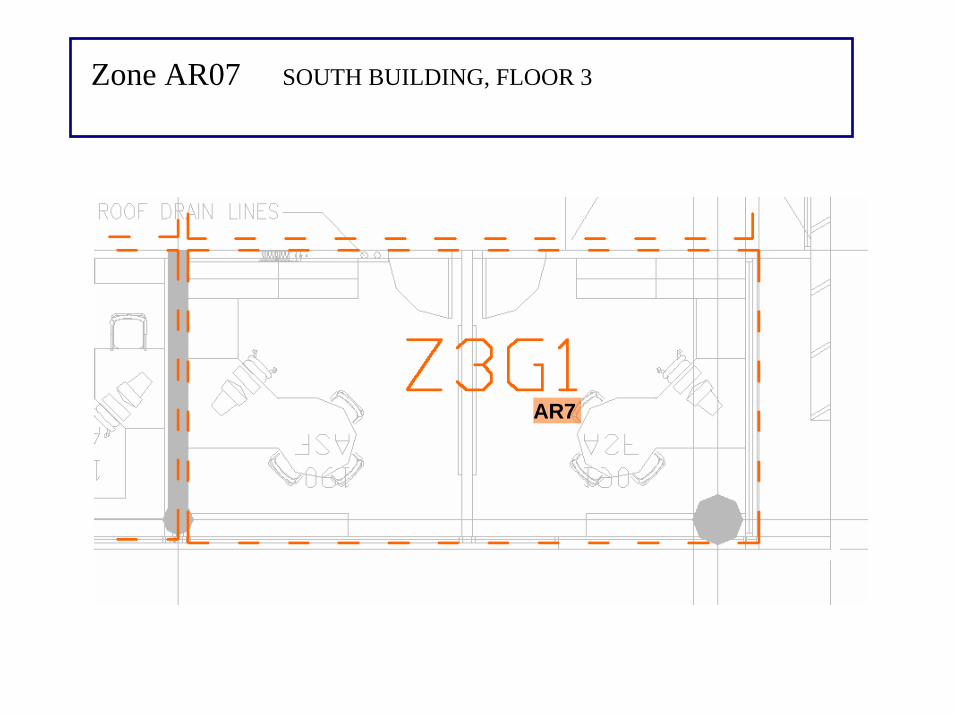
AR7
Zone AR07 SOUTH BUILDING, FLOOR 3

AR8
Zone AR08 NORTH BUILDING, FLOOR 3

AR9
Zone AR09 SOUTH BUILDING, FLOOR 3
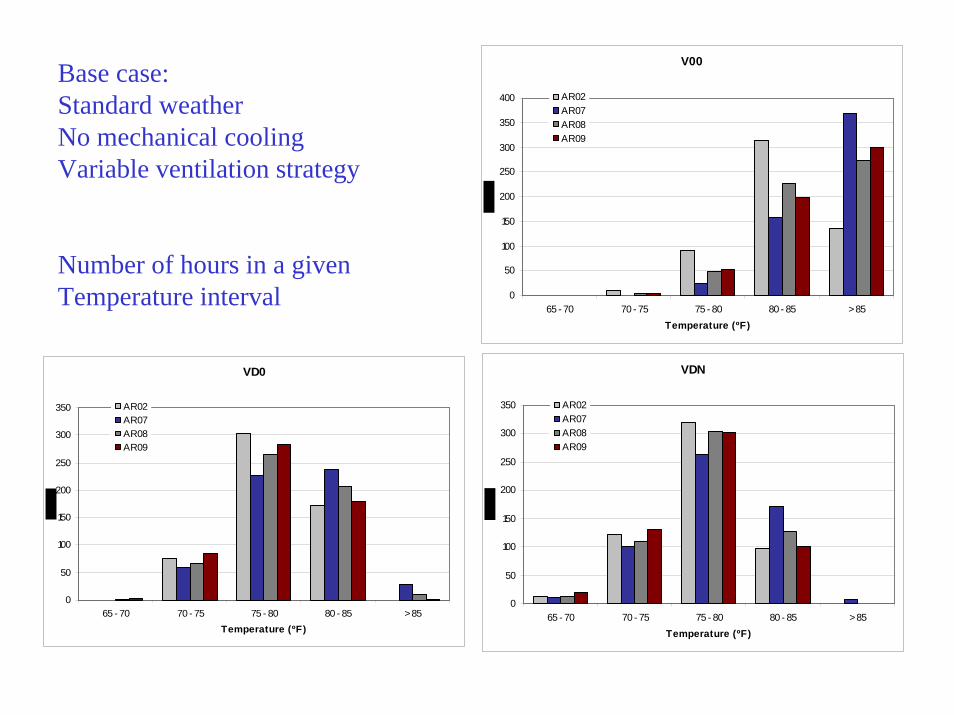
Base case:Standard weatherNo mechanical coolingVariable ventilation strategy
Number of hours in a given Temperature interval
V00
0
50
100
150
200
250
300
350
400
65 - 70 70 - 75 75 - 80 80 - 85 > 85Temperature (ºF)
AR02AR07AR08AR09
VD0
0
50
100
150
200
250
300
350
65 - 70 70 - 75 75 - 80 80 - 85 > 85Temperature (ºF)
AR02AR07AR08AR09
VDN
0
50
100
150
200
250
300
350
65 - 70 70 - 75 75 - 80 80 - 85 > 85Temperature (ºF)
AR02AR07AR08AR09
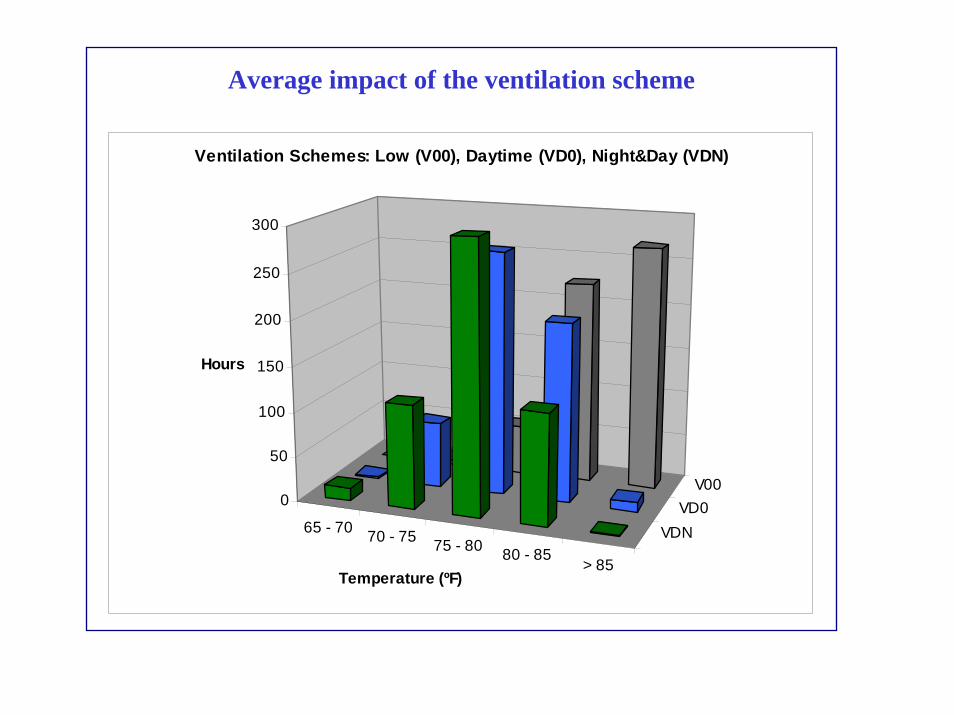
Average impact of the ventilation scheme
65 - 70 70 - 75 75 - 80 80 - 85> 85
VDNVD0
V000
50
100
150
200
250
300
Hours
Temperature (ºF)
Ventilation Schemes: Low (V00), Daytime (VD0), Night&Day (VDN)

Adjusted weatherNo mechanical coolingVariable ventilation strategy
Number of hours in a given Temperature interval
V00A
0
50
100
150
200
250
300
350
400
65 - 70 70 - 75 75 - 80 80 - 85 > 85Temperature (ºF)
AR02AR07AR08AR09
VD0A
0
50
100
150
200
250
300
350
65 - 70 70 - 75 75 - 80 80 - 85 > 85Temperature (ºF)
AR02AR07AR08AR09
VD0A
0
50
100
150
200
250
300
350
65 - 70 70 - 75 75 - 80 80 - 85 > 85Temperature (ºF)
AR02AR07AR08AR09

Impact of local weather
65 - 7070 - 75
75 - 8080 - 85
> 85
VDNA
VDN0
50
100
150
200
250
300
Hours
Temperature (ºF)
Ventilation analysis with adjusted weather

Impact of glazing system
65 - 7070 - 75
75 - 8080 - 85
> 85
NG
Base0
50
100
150
200
250
300
Hours
Temperature (ºF)
Normal Glazing (NG)

Impact of external wall insulation
65 - 7070 - 75
75 - 8080 - 85
> 85
NI
Base0
50
100
150
200
250
300
350
Hours
Temperature (ºF)
Exterior Walls: Non Insulated (NI)
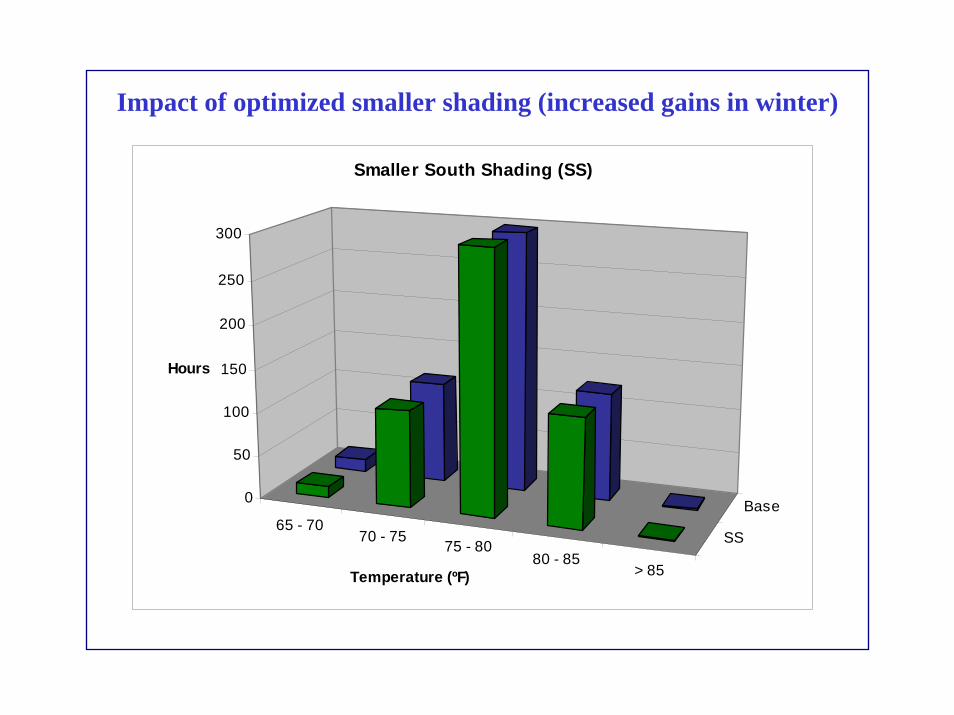
Impact of optimized smaller shading (increased gains in winter)
65 - 7070 - 75
75 - 8080 - 85
> 85
SS
Base0
50
100
150
200
250
300
Hours
Temperature (ºF)
Smaller South Shading (SS)

Impact of lower gains
65 - 7070 - 75
75 - 8080 - 85
> 85
LG
Base0
50
100
150
200
250
300
350
Hours
Temperature (ºF)
Lower Gains (LG)

Mechanical heating and coolingMaximum Cooling Load (normalized to the maximum zone load)
ZONE V00 PA VD0 PA VDN PA VDN PA LG VDN PA SS
AR02 1.00 (102W/m2) 0.99 0.95 0.73 0.95
AR07 0.91 0.95 0.83 0.68 0.84
AR08 0.70 0.69 0.65 0.48 0.65
AR09 0.72 0.72 0.65 0.53 0.65
0.370.260.370.430.72AR09
0.390.220.380.450.74AR08
0.520.360.510.621.00AR07
0.560.320.550.610.89AR02
VDN PA SS VDN PA LGVDN PAVD0 PAV00 PAZONE
Total Cooling Energy (normalized to the maximum zone load)
0.380.360.580.57AR09
0.490.240.660.54AR08
0.840.170.950.60AR07
1.000.501.00 (97W/m2)0.72AR02
V00 NI PAV00 PAV00 NI PAV00 PAZONE
Total Heating Energy (normalized)
Max. Heating Load (normalized)
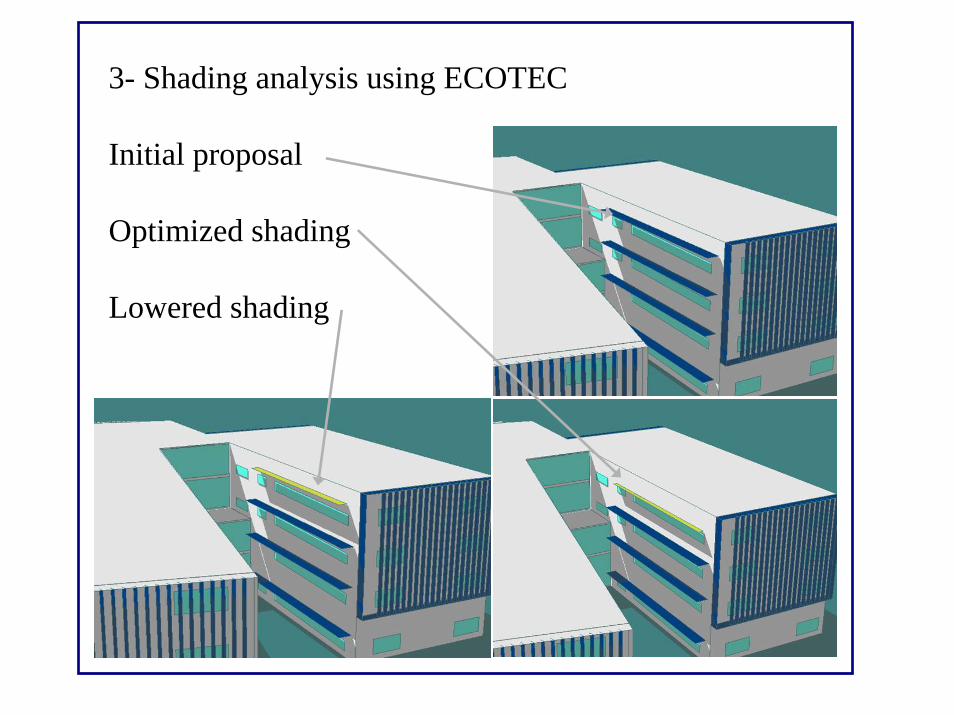
3- Shading analysis using ECOTEC
Initial proposal
Optimized shading
Lowered shading

BASE
Optimized BASE
Lowered shading
With day lighting reflector
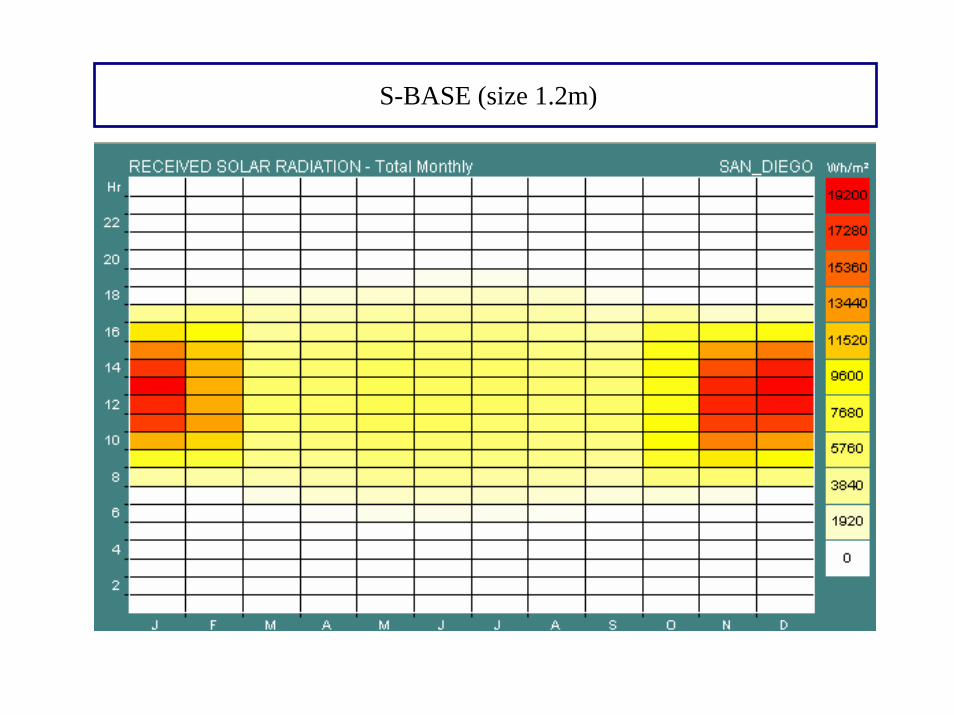
S-BASE (size 1.2m)

S-OPTIM BASE (0.75m)
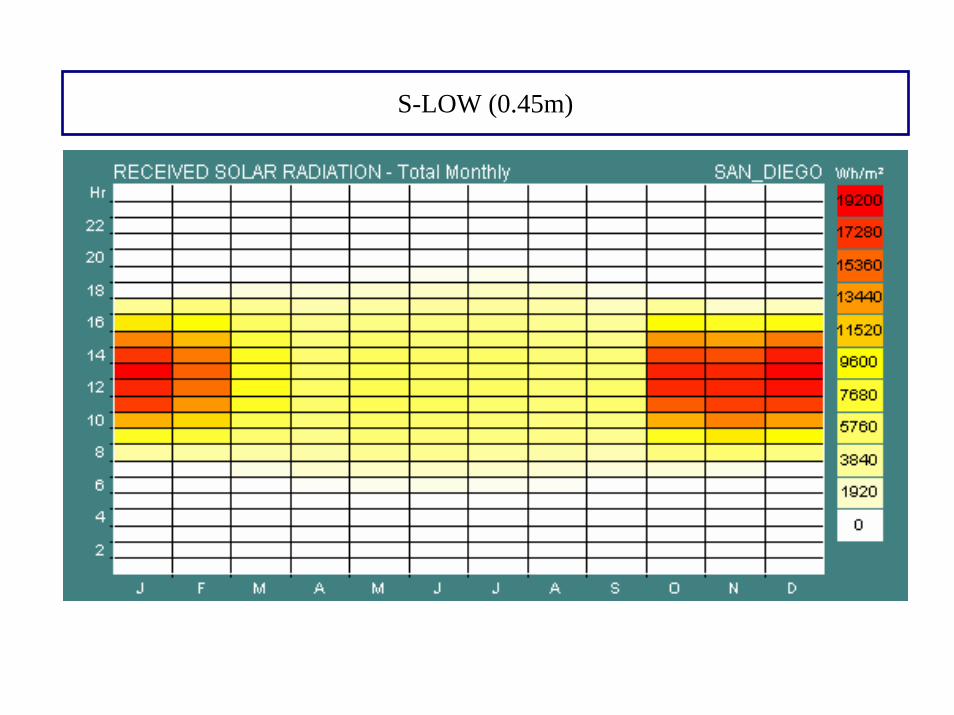
S-LOW (0.45m)
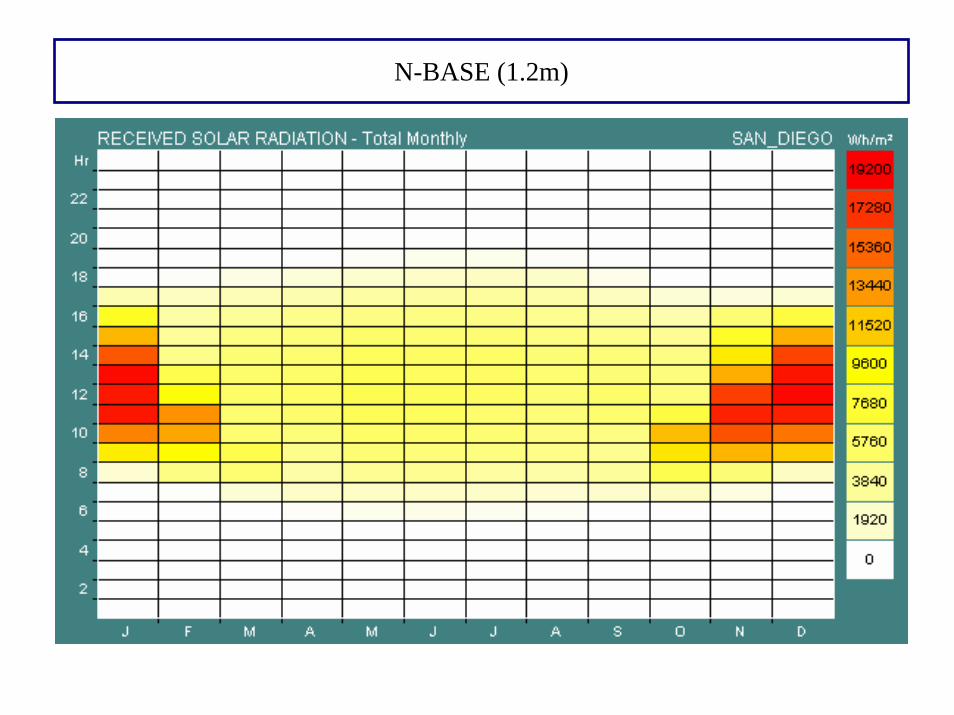
N-BASE (1.2m)
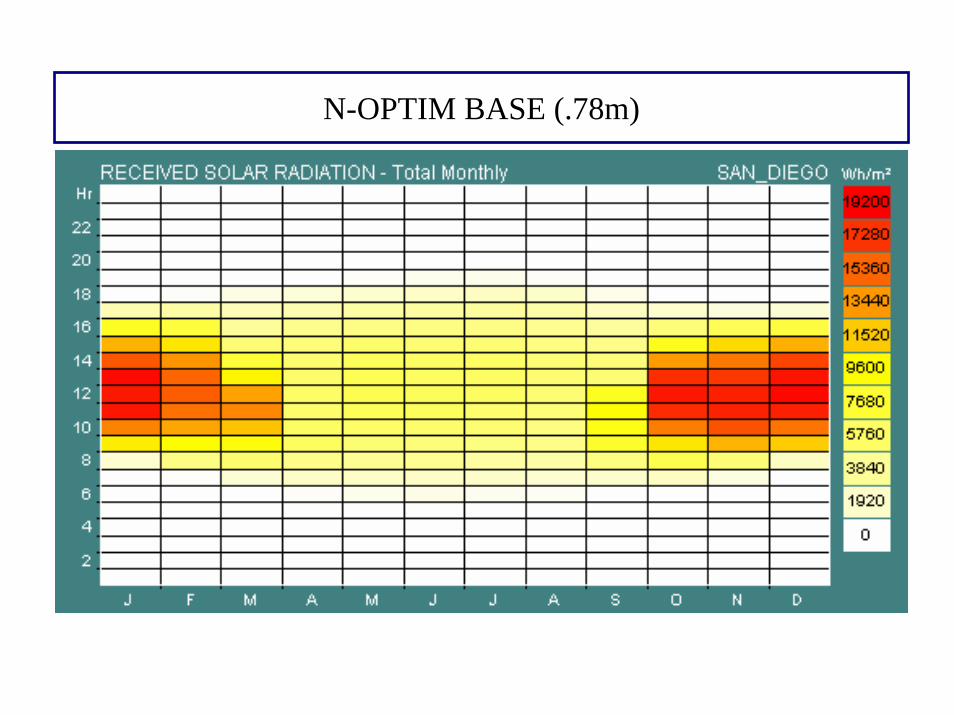
N-OPTIM BASE (.78m)
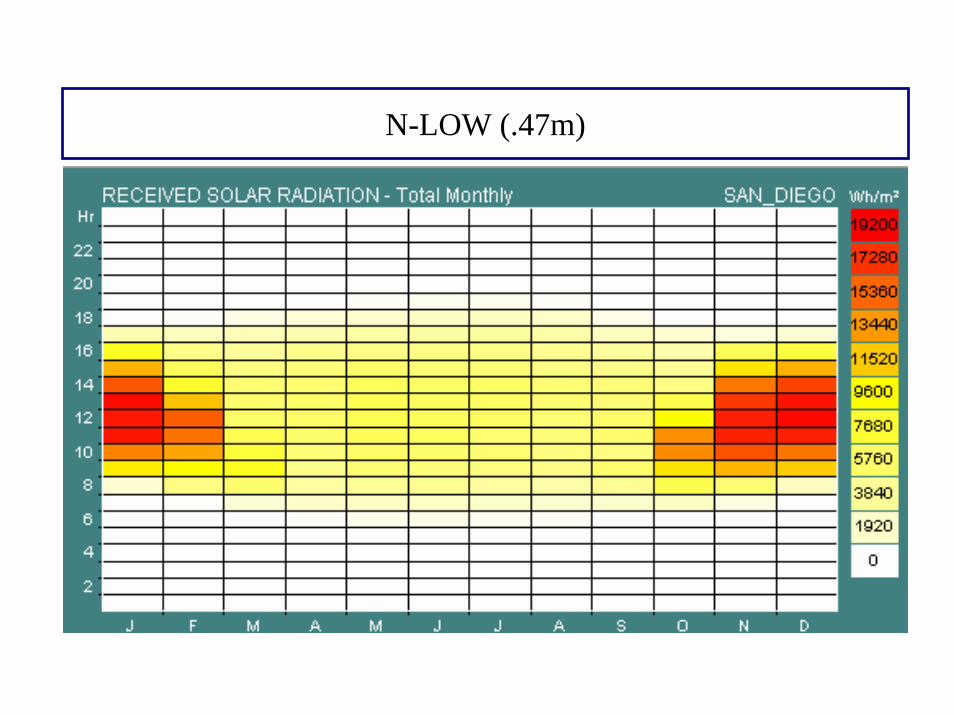
N-LOW (.47m)

Preliminary conclusions
The San Diego climate has significant potential for low energy climate control systems
In the current design phase it may still be possible to improve performance by placing higher load spaces in the North façade (why not the computer labs?)
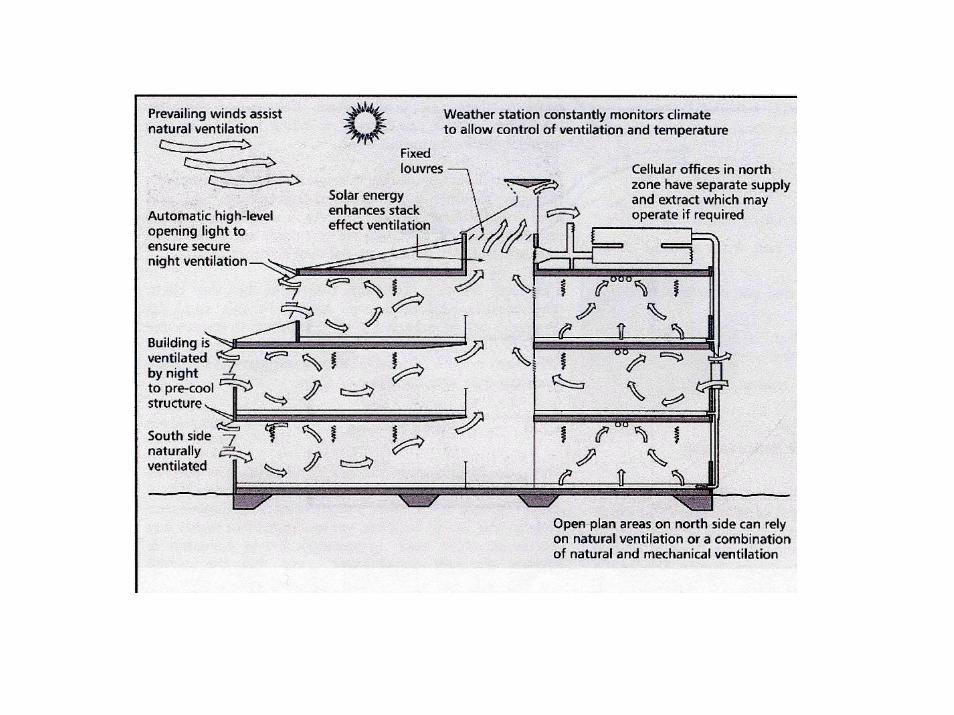
In most spaces the use of natural cooling by single sided displacement ventilation (both during the day and night) may provide sufficient cooling
Due to the mildness of the climate, “special glazing” or even thermal insulation in the vertical walls may not be necessary
The use of ducted forced air in the perimeter offices may not be an appropriate solution since large flow rates are needed in order to maximize natural cooling (easier to obtain with natural ventilation)

Building features
• Low capacity AHU (fan and coils)• Mist eliminators and filters in the AHU• No terminal boxes or controls in the
distribution system• Low sidewall diffusers with damper• Operable windows• Relief of all supply air
Building features (cont.)
• Local chilled water loop to manage point loads
• Sun shades
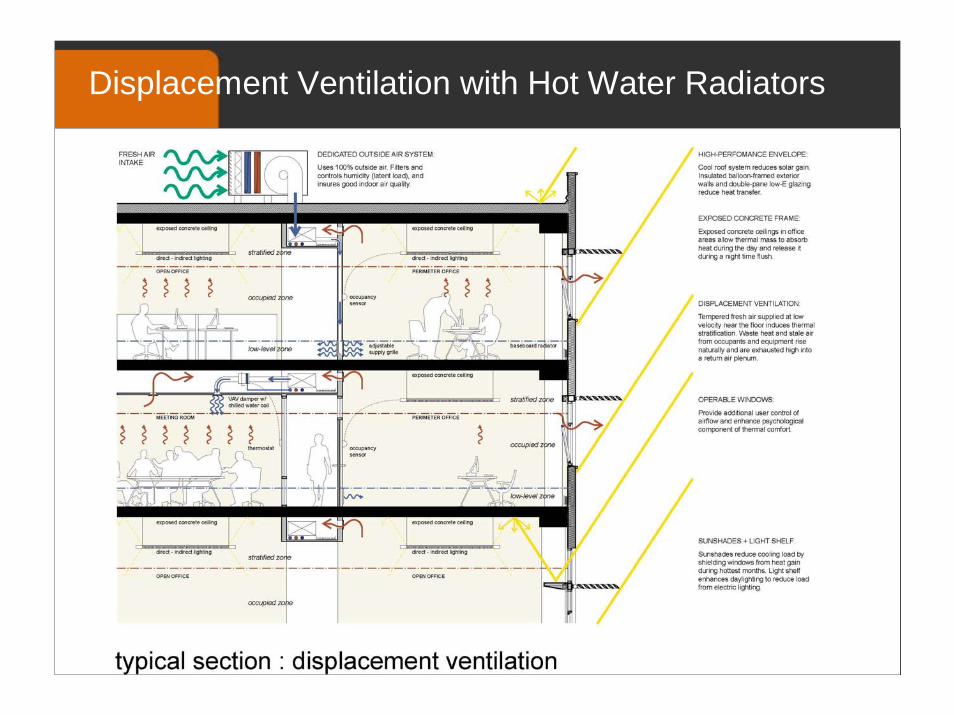
Displacement Ventilation with Hot Water Radiators

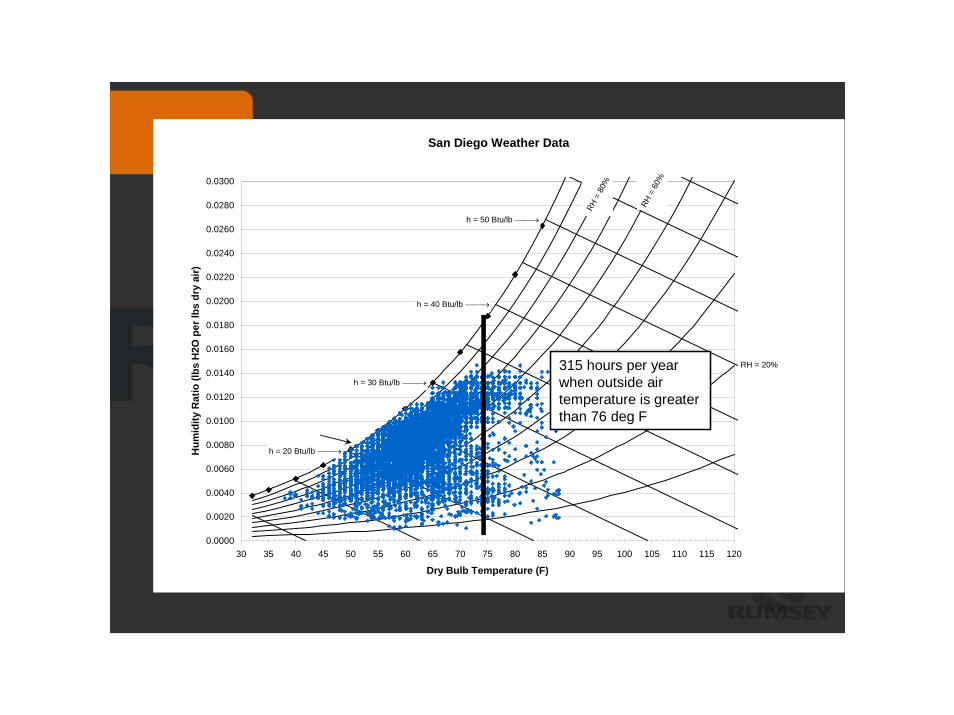
San Diego Weather Data
RH = 20%
RH =
60%
RH
= 80
%
h = 20 Btu/lb ⎯⎯→
h = 30 Btu/lb ⎯⎯→
h = 40 Btu/lb ⎯⎯→
h = 50 Btu/lb ⎯⎯→
0.0000
0.0020
0.0040
0.0060
0.0080
0.0100
0.0120
0.0140
0.0160
0.0180
0.0200
0.0220
0.0240
0.0260
0.0280
0.0300
30 35 40 45 50 55 60 65 70 75 80 85 90 95 100 105 110 115 120
Dry Bulb Temperature (F)
Hum
idity
Rat
io (l
bs H
2O p
er lb
s dr
y ai
r)
315 hours per year when outside air temperature is greater than 76 deg F
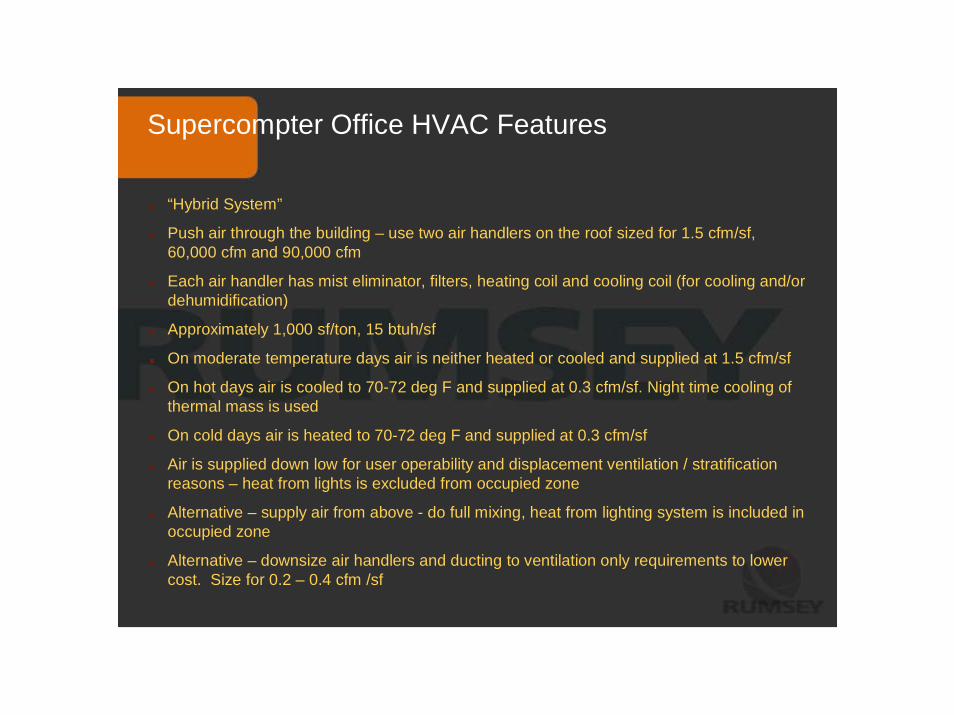
Supercompter Office HVAC Features
“Hybrid System”
Push air through the building – use two air handlers on the roof sized for 1.5 cfm/sf, 60,000 cfm and 90,000 cfm
Each air handler has mist eliminator, filters, heating coil and cooling coil (for cooling and/or dehumidification)
Approximately 1,000 sf/ton, 15 btuh/sf
On moderate temperature days air is neither heated or cooled and supplied at 1.5 cfm/sf
On hot days air is cooled to 70-72 deg F and supplied at 0.3 cfm/sf. Night time cooling of thermal mass is used
On cold days air is heated to 70-72 deg F and supplied at 0.3 cfm/sf
Air is supplied down low for user operability and displacement ventilation / stratification reasons – heat from lights is excluded from occupied zone
Alternative – supply air from above - do full mixing, heat from lighting system is included in occupied zone
Alternative – downsize air handlers and ducting to ventilation only requirements to lower cost. Size for 0.2 – 0.4 cfm /sf
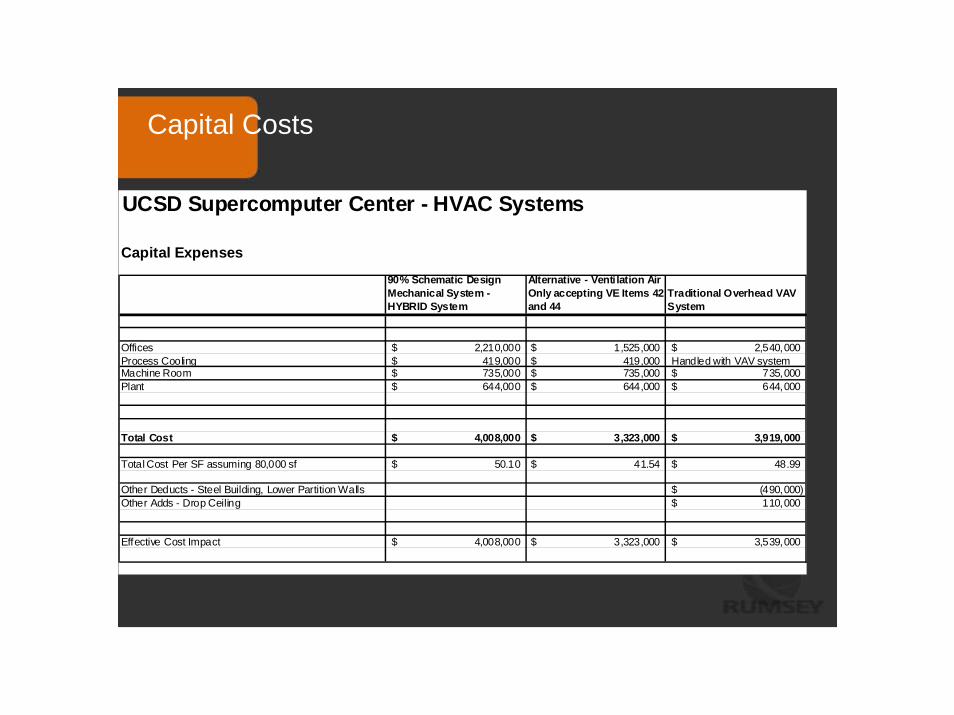
Capital Costs
UCSD Supercomputer Center - HVAC Systems
Capital Expenses
90% Schematic Design Mechanical System - HYBRID System
Alternative - Ventilation Air Only accepting VE Items 42 and 44
Traditional Overhead VAV System
Offices 2,210,000$ 1,525,000$ 2,540,000$ Process Cooling 419,000$ 419,000$ Handled with VAV systemMachine Room 735,000$ 735,000$ 735,000$ Plant 644,000$ 644,000$ 644,000$
Total Cost 4,008,000$ 3,323,000$ 3,919,000$
Total Cost Per SF assuming 80,000 sf 50.10$ 41.54$ 48.99$
Other Deducts - Steel Building, Lower Partition Walls (490,000)$ Other Adds - Drop Ceiling 110,000$
Effective Cost Impact 4,008,000$ 3,323,000$ 3,539,000$
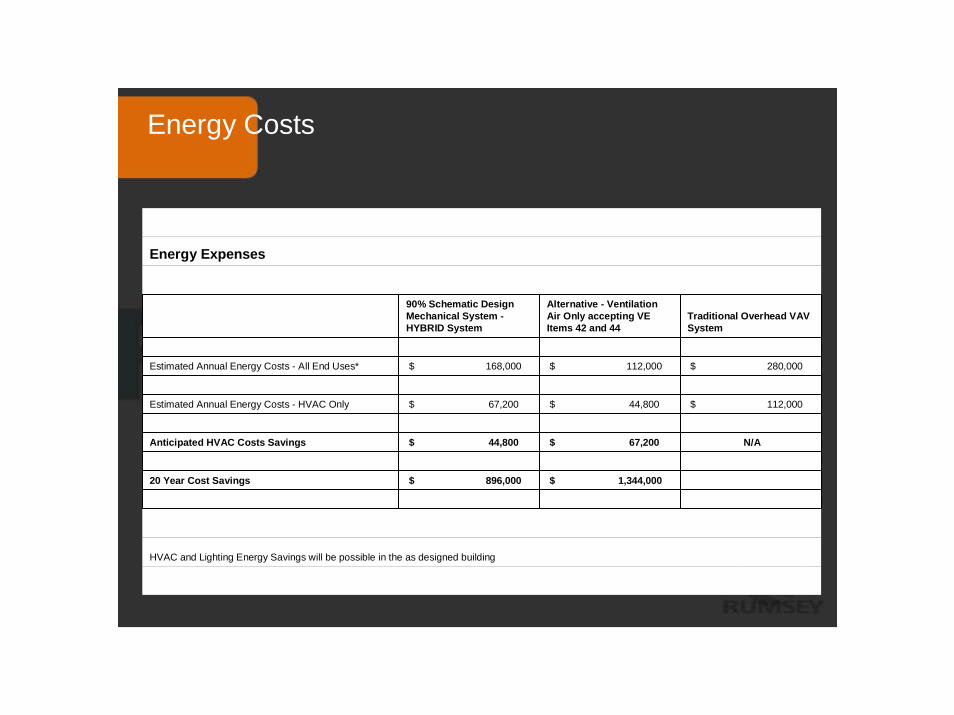
Energy Costs
HVAC and Lighting Energy Savings will be possible in the as designed building
$ 1,344,000 $ 896,000 20 Year Cost Savings
N/A $ 67,200 $ 44,800 Anticipated HVAC Costs Savings
$ 112,000 $ 44,800 $ 67,200 Estimated Annual Energy Costs - HVAC Only
$ 280,000 $ 112,000 $ 168,000 Estimated Annual Energy Costs - All End Uses*
Traditional Overhead VAV System
Alternative - Ventilation Air Only accepting VE Items 42 and 44
90% Schematic Design Mechanical System -HYBRID System
Energy Expenses

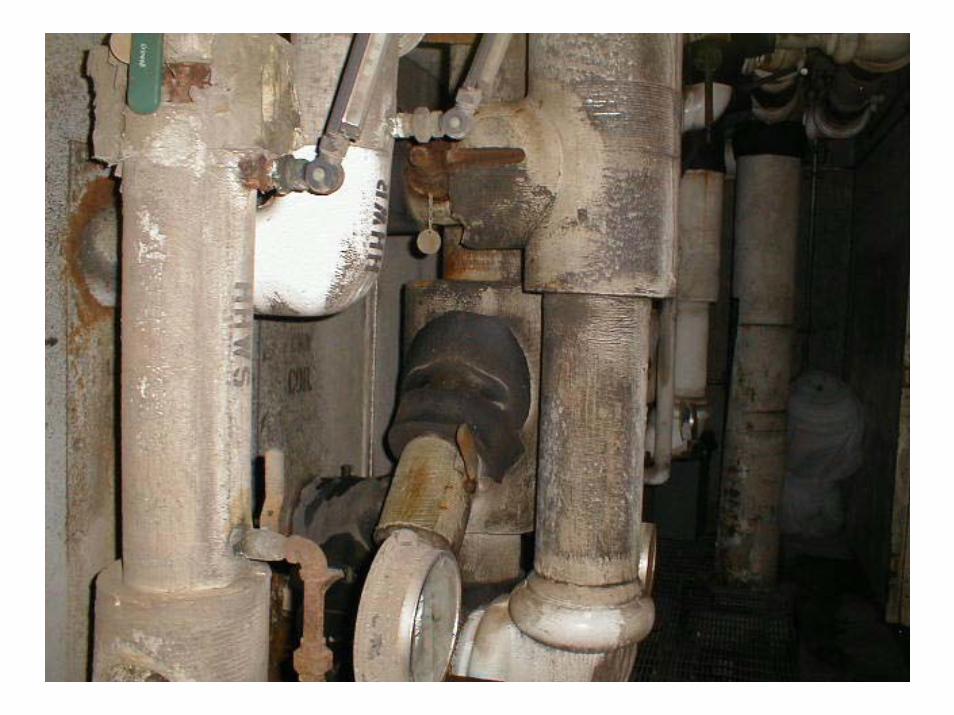
Why did this happen
• Culture in FD&C• FD&C staff engineers• Direct communication between FD&C
engineers and mechanical engineers• Interaction with operations staff

Risks to the design approach
• Setpoint changes• Load density• Increase in warm weather days• Accuracy of the model


