HIGH STRENGTH CAST ALUMINUM ALLOY DEVELOPMENT
by
Edward A. Druschitz
ROBIN D. FOLEY, COMMITTEE CHAIR
GREGG M. JANOWSKI
JAMES B. ANDREWS
DERRICK R. DEAN
GREGORY B. THOMPSON
A DISSERTATION
Submitted to the graduate faculty of The University of Alabama at Birmingham,
in partial fulfillment of the requirements for the degree of
Doctor of Philosophy
BIRMINGHAM, ALABAMA
2013

Copyright by
Edward A. Druschitz
2013
iii
CAST HIGH STRENGTH ALUMINUM ALLOY DEVELOPMENT
EDWARD A. DRUSCHITZ
MATERIALS ENGINEERING
ABSTRACT
The goal of this research was to understand how chemistry and processing affect
the resulting microstructure and mechanical properties of high strength cast aluminum
alloys. Two alloy systems were investigated including the Al-Cu-Ag and the Al-Zn-Mg-
Cu systems. Processing variables included solidification under pressure (SUP) and heat
treatment.
This research determined the range in properties that can be achieved in BAC
100TM
(Al-Cu micro-alloyed with Ag, Mn, Zr, and V) and generated sufficient property
data for design purposes. Tensile, stress corrosion cracking, and fatigue testing were
performed. CuAl2 and Al-Cu-Fe-Mn intermetallics were identified as the ductility
limiting flaws. A solution treatment of 75 hours or longer was needed to dissolve most of
the intermetallic CuAl2. The Al-Cu-Fe-Mn intermetallic was unaffected by heat
treatment. These results indicate that faster cooling rates, a reduction in copper
concentration and a reduction in iron concentration might increase the ductility of the
alloy by decreasing the size and amount of the intermetallics that form during
solidification.
Six experimental Al-Zn-Mg-Cu series alloys were produced. Zinc concentrations
of 8 and 12wt% and Zn/Mg ratios of 1.5 to 5.5 were tested. Copper was held constant at
0.9%. Heat treating of the alloys was optimized for maximum hardness. Al-Zn-Mg-Cu
samples were solution treated at 441°C (826°F) for 4 hours before ramping to 460°C

iv
(860°F) for 75 hours and then aged at 120°C (248°F) for 75 hours. X-ray diffraction
showed that the age hardening precipitates in most of these alloys was the T phase
(Mg32Zn31.9Al17.1). Tensile testing of the alloys showed that the best mechanical
properties were obtained in the lowest alloy condition. Chilled Al-8.2Zn-1.4Mg-0.9Cu
solidified under pressure resulted in an alloy with a yield strength of 468MPa (68ksi),
tensile strength of 525MPa (76ksi) and an elongation of 9%.
v
DEDICATION
First and foremost, I wish to dedicate this to my wife Amy Lauren Druschitz.
Without you I would not have completed the amazing feat of earning my doctorate, nor
would I have found my inspiration in life. You mean more to me than I could have ever
imagined, and without you I would not be where I am today. It is because of you I was
able to successfully manage the ups and downs, twists and turns in life that have brought
me to this point. I love you and look forward to spending the rest of our lives together.
Also, to my parents, Alan and Lori, who have always believed in me and pushed
me to catch my dreams. To my sister, Laurel and her husband Chase, who have always
supported me and been there for me when I needed someone to talk to.

vi
ACKNOWLEDGEMENTS
As I near the completion of this part of my life, I would like to acknowledge those
who have helped me during this journey. First, I would like to thank Dr. Foley for being
a better adviser then I deserved, you helped propel me forward in my research and were
always there for me when I needed advice.
To the casting group at UAB, John Griffin, Ricardo Aristizabal, Jeff Hamby,
Santosh Ghanti, Joe Jablonsky, and all the undergraduate assistants during my tenure.
Without all of you, none of this would have been possible, we were a great team. It has
been an honor to know all of you, and I consider all of you lifelong friends.
To my committee members: Dr. J. Barry Andrews, Dr. Derrick Dean, Dr. Gregg
Janowski, Dr. Gregory Thompson, and Mr. Tom Prucha. Thank you so much for your
invaluable input, advice, inspiration, and guidance.
I would also like to thank the unsung heroes of the materials engineering
department: Mrs. Cynthia Barham, Mrs. Robin Mize, and Mr. Vernon Merchant for all of
their support during my time here.
vii
TABLE OF CONTENTS
ABSTRACT .........................................................................................................................III
DEDICATION ..................................................................................................................... V
ACKNOWLEDGEMENTS ................................................................................................. VI
1. INTRODUCTION .......................................................................................................1
2. BACKGROUND AND LITERATURE REVIEW .........................................................2
2.1 Cast and wrought properties in aluminum alloys .......................................... 2
2.2 Alloying effects in cast aluminum alloys ........................................................ 4
2.3 Phase stability and heat treatment ................................................................. 6
2.3.1 Solution treating ................................................................................... 9
2.3.2 Aging ................................................................................................... 10
2.4 Al-Zn-Mg-Cu chemistries............................................................................. 11
2.5 Hydrogen, porosity, and the effect of solidification under pressure
(SUP)............................................................................................................ 13
3. SPECIFIC AIMS .......................................................................................................18
3.1 Objective 1: Improve the mechanical properties of BAC 100TM
................. 18
3.2 Objective 2: Determine chemistry, processing and heat treatment
effects on microstructure and properties of cast Al-Zn-Mg-Cu Alloys. ....... 18
3.3 Objective 3: Demonstrate that Al-Zn-Mg-Cu alloys can be cast to
near-net-shape using best practices. ............................................................ 19
4. EXPERIMENTAL METHODS ..................................................................................20

viii
4.1 Casting ......................................................................................................... 20
4.1.1 BAC 100TM
.......................................................................................... 25
4.1.2 Al-Zn-Mg-Cu alloys ............................................................................ 25
4.2 Heat treating ................................................................................................ 26
4.2.1 BAC 100TM
.......................................................................................... 26
4.2.2 Al-Zn-Mg-Cu alloys ............................................................................ 27
4.3 Testing .......................................................................................................... 27
4.3.1 Aging study ......................................................................................... 27
4.3.2 Tensile testing ..................................................................................... 28
4.3.3 Direct tension stress corrosion cracking ............................................ 29
4.3.4 Fatigue testing .................................................................................... 30
4.4 Characterization .......................................................................................... 30
4.4.1 Microstructural analysis ..................................................................... 30
4.4.2 Intermetallic measurement ................................................................. 31
4.4.3 Stereo microscope analysis ................................................................. 31
4.4.4 Scanning electron microscopy (SEM)................................................. 31
4.4.5 X-Ray diffraction................................................................................. 31
4.4.6 Differential scanning calorimetery ..................................................... 32
5. BAC 100TM
: A NEW HIGH STRENGTH, HIGH TOUGHNESS, CAST
ALUMINUM ALLOY ................................................................................................33
6. HIGH STRENGTH CAST ALUMINUM: SOLUTION TREATING AND
AGING STUDY .........................................................................................................66
7. HIGH STRENGTH CAST ALUMINUM: TENSILE PROPERTIES..........................99
8. OVERALL SUMMARY ............................................................................................126
9. GENERAL REFERENCES......................................................................................130

ix
LIST OF TABLES
Table Page
INTRODUCTION AND LITERATURE REVIEW
1. Composition ranges (wt%) of aluminum casting and wrought alloys [1]. .................... 3
2. Aluminum alloys and their mechanical properties (for cast alloys, properties
are from separately cast test bars) and liquidus and solidus [1]. .................................... 4
3. Chemistries of BAC 100TM
heats produced at UAB (values in wt%) ......................... 25
4. Target chemistries for each of 6 alloys. ....................................................................... 26
BAC 100TM
: A NEW HIGH STRENGTH, HIGH TOUGHNESS, CAST ALUMINUM
ALLOY
1. Nominal chemistry ranges (wt%) for 201 [2], A206 [2] and BAC 100TM
[1] .............. 36
2. Typical tensile properties for 201 [3] and A206 [4] ..................................................... 37
3. Chemistries for BAC 100TM
heats produced at UAB (values in wt%) ......................... 39
4. Tensile properties for high strength seat frame castings produced at UAB,
HIPed at Bodycote and heat treated at UAB ................................................................ 44
5. Tensile properties for high toughness seat frame castings produced at UAB,
HIPed at Bodycote and heat treated at UAB ................................................................ 45
6. Tensile properties for high toughness separately cast tensile bar produced at a
commercial foundry, HIPed at Bodycote and heat treated at UAB ............................. 46
7. Results of direct stress corrosion cracking tests ........................................................... 58
8. Fatigue properties for high toughness heat treatment ................................................... 59
x
HIGH STRENGTH CAST ALUMINUM: SOLUTION TREATING AND AGING
STUDY
1. Typical Al-Zn-Mg-Cu Alloys and their Mechanical Properties [2]. ............................ 69
2. Target chemistries for each of 6 pours and which two alloys were chosen for air
and SUP pouring. ......................................................................................................... 71
3. Actual chemical compositions for each alloy determined using spectrometer
analysis. ........................................................................................................................ 75
4. Thermal analysis results for each alloy. ........................................................................ 77
5. DSC results for “solution treating study” of as-cast samples with peak locations
in Celsius. ..................................................................................................................... 94
6. DSC results for “aging study” of previously solution treated samples with the
peak location in Celsius. ............................................................................................... 95
HIGH STRENGTH CAST ALUMINUM: TENSILE PROPERTIES
1. Target chemistries for each of 6 alloys. ...................................................................... 103
2. Actual chemical compositions for each alloy. ............................................................ 108
3. Average mechanical properties of Al-Zn-Mg-Cu tensile bars .................................... 110
xi
LIST OF FIGURES
Figure Page
INTRODUCTION AND LITERATURE REVIEW
1. The aluminum-copper binary phase diagram [4]. ...........................................................7
2. The aluminum, zinc, magnesium ternary liquidus projection [4]. ..................................9
3. Elongation versus zinc content (wt%). [2; 240]............................................................12
4. Strength versus zinc content (wt%). [2; 240] ................................................................13
5. Hydrogen solubility in aluminum verse temperature. [8] .............................................14
6. The effect of water pressure on air bubble size, as pressure increases from
0.1MPa (1 atmosphere) at the top to 1.0MPa (10 atmospheres) at the bottom
resulting in the bubble doubling in size. [10] ................................................................15
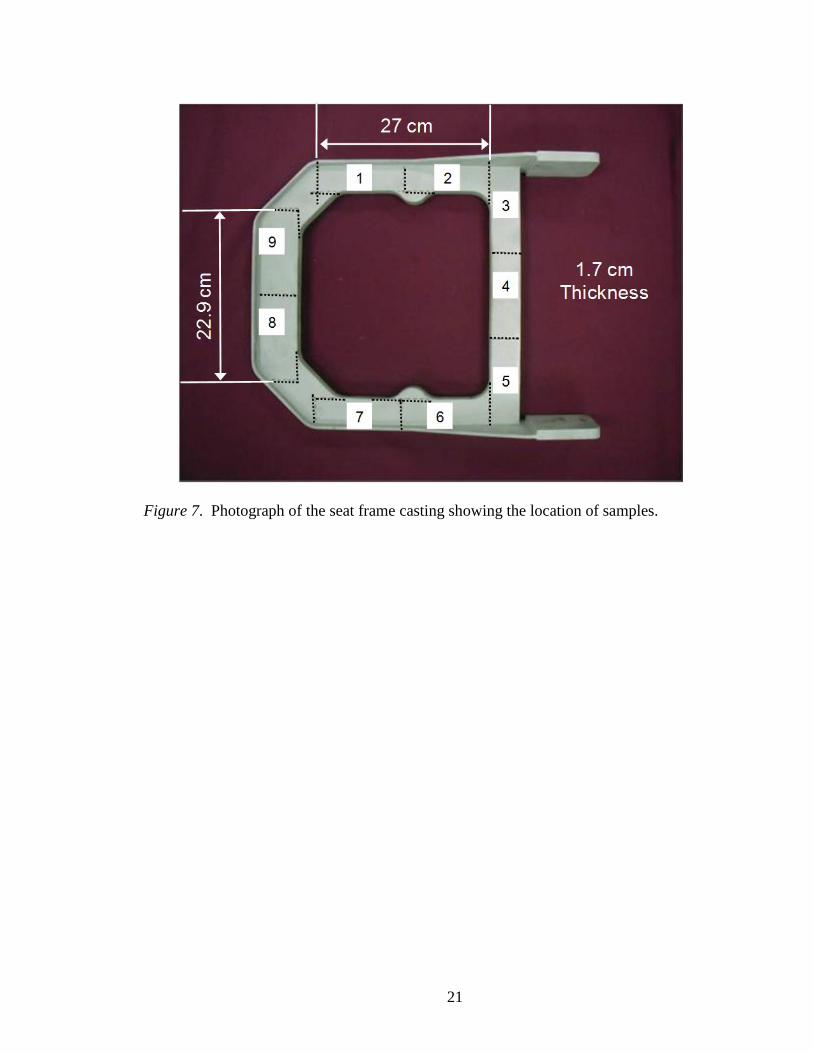
7. Photograph of the seat frame casting showing the location of samples. ......................21
8. Design and dimension of UAB wedge casting. ............................................................22
9. Bonded sand mold with plug-pour basin in place. ........................................................23
10. UAB pressure vessel. ..................................................................................................24
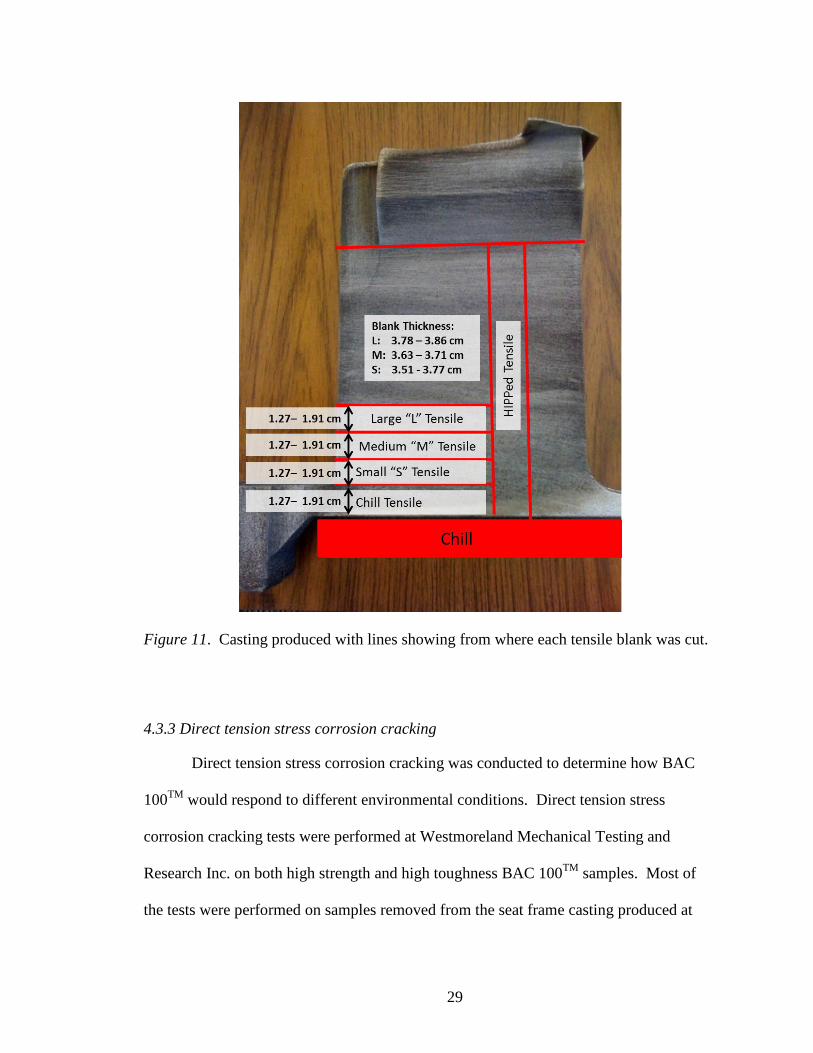
11. Casting produced with lines showing where each tensile blank was cut from. ..........29
BAC 100TM
: A NEW HIGH STRENGTH, HIGH TOUGHNESS, CAST ALUMINUM
ALLOY
1. Photograph of a seat frame casting showing the location of samples............................38
2. Light microscope images of polished samples from HIPed, seat frame castings
showing the presence of porosity. .................................................................................47

xii
3. SEM images of UAB produced seat frame tensile fracture showing oxidized
shrinkage porosity on the surface. (a) - Secondary electron image (topographic
contrast). (b) - Backscatter electron image (compositional contrast). ..........................48
4. SEM secondary electron image of oxidized shrinkage porosity on a tensile bar
fracture surface from a UAB produced seat casting (a). Energy dispersive X-
Ray spectrum from oxidized shrinkage porosity on a tensile bar fracture
surface from a UAB produced seat casting showing the presence of aluminum
and oxygen. ...................................................................................................................49
5. SEM secondary electron image of the fracture surface of a sample from a UAB
produced seat frame casting with low ductility (Strain to Failure = 0.7%). ..................50
6. SEM secondary electron image of the fracture surface of a sample from a UAB
produced seat frame casting with high ductility (strain to failure = 7.6%). ..................51
7. SEM backscatter electron images of the fracture surface of a UAB produced
seat frame castings. (a) Sample with 0.7% strain to failure. (b) Sample with
7.6% strain to failure. ....................................................................................................52
8. Representative SEM secondary electron image showing intermetallic phases in
a polished sample from a UAB produced seat frame casting. .......................................53
9. Energy dispersive X-Ray spectrum from from a UAB produced seat frame
casting for (a) globular intermetallic particle (CuAl2) and (b) needle shaped
intermetallic (Al-Cu-Fe-Mn). ........................................................................................54
10. Light microscope image of intermetallic phases in UAB produced seat frame
castings. .........................................................................................................................55
11. Strain to failure in UAB seat frame castings vs. (a) volume percent
intermetallic phase and (b) intermetallic size. Error bars are 95% confidence
intervals. ........................................................................................................................56
12. Volume percent of intermetallics as a function of solution treatment time. ................60
HIGH STRENGTH CAST ALUMINUM: SOLUTION TREATING AND AGING
STUDY
1. Model of the wedge casting ...........................................................................................72
2. Pressure vessel used in SUP research at UAB. ..............................................................73

xiii
3. Cooling curve for (a) alloy 4 (7.9Zn-4.9Mg-0.9Cu) and (b) alloy 3 (8.2Zn-
1.4Mg-0.9Cu) showing a long recolescence in alloy 4 (7.9Zn-4.9Mg-0.9Cu)
and no recolescence in alloy 3 (8.2Zn-1.4Mg-0.9Cu). ..................................................78
4. As-cast microstructure for (a) alloy 3-1MPa (8.2Zn-1.4Mg) and (b) alloy 4
(13.1Zn-7.3Mg) showing the resulting intermetallic phase. .........................................80
5. Hardness versus time for 120°C (248°F) aging. ............................................................82
6. Peak hardness versus (a) zinc and (b) magnesium content after aging at 120°C
(248°F)...........................................................................................................................83
7. Hardness versus aging time at 150°C (302°F) showing a steep drop off after 8
hours. .............................................................................................................................84
8. Peak hardness versus (a) zinc and (b) magnesium content after aging at 150°C
(302°F)...........................................................................................................................85
9. Representative backscatter scanning electron microscop image (compositional
contrast) of the intermetallics found in the samples. .....................................................87
10. EDS results for (a) both the aluminum matrix (red outline) and the
intermetallic (blue) and (b) the intermetallic containing iron and trace amounts
of nickel (possible inclusion). .......................................................................................88
11. Relative X-Ray intensity vs 2θ (background subtracted) for alloy 1 (7.9Zn-
4.9Mg) showing a match with the intermetallic T-Phase (Mg32Zn31.9Al17.1). ...............90
12. Zoomed relative X-Ray intensity vs 2θ (background subtracted) for alloy 1
(7.9Zn-4.9Mg) showing a match with the intermetallic T-Phase
(Mg32Zn31.9Al17.1). .........................................................................................................91
13. Relative X-Ray intensity vs 2θ (background subtracted) for for alloy 6
(12.4Zn-2Mg). ...............................................................................................................92
14. DSC curve for the “solution treatment study” of as-cast alloy 2 (8.1Zn-
2.1Mg). ..........................................................................................................................93
15. DSC curve for the “aging study” of solution treated alloy 2 (8.1Zn-2.1Mg). .............95
HIGH STRENGTH CAST ALUMINUM: TENSILE PROPERTIES
1. Schematic of double filtered, chilled, wedge casting ..................................................104
2. Pressure vessel used in SUP research at UAB. ............................................................105

xiv
3. Casting produced with lines showing where each tensile blank was cut from. ...........106
4. Tensile properties of samples 0.75 to 1.75 inches from the chill in the wedge
castings. .......................................................................................................................111
5. Tensile properties of samples next to the chill in the wedge castings. .......................111
6. Tensile properties of the HIPed samples in the wedge castings. ................................112
7. Effect of distance from chill on percent elongation of alloy 3-1MPa (8.2Zn-
1.4Mg) and 3-0.1MPa (7.9Zn-1.4Mg). .......................................................................113
8. Stereo microscope image of factured tensile surface from alloy 3-0.1MPa
(7.9Zn-1.4Mg), chill sample. Fracture surface is almost completely covered
with an oxide film. .......................................................................................................114
9. Stereo microscope image from alloy 3-0.1MPa (7.9Zn-1.4Mg), sample 2.0cm
from chill. Fracture surface has numerous oxide films on surface. ...........................115
10. Yield and ultimate tensile strength versus distance from chill in alloy 3-1MPa
(8.2Zn-1.4Mg) and 3-0.1MPa (7.9Zn-1.4Mg) wedge castings ...................................116
11. Effect of HIPing on yield strength of alloy 3-0.1MPa (7.9Zn-1.4Mg) and 3-
1MPa (8.2Zn-1.4Mg). .................................................................................................117
12. Effect of HIPing on ultimate tensile strength of alloy 3-0.1MPa (7.9Zn-
1.4Mg) and 3-1MPa (8.2Zn-1.4Mg). ..........................................................................118
13. Effect of HIPing on percent elongation of alloy 3-0.1MPa (7.9Zn-1.4Mg) and
3-1MPa (8.2Zn-1.4Mg). ..............................................................................................118
14. Effects of HIPing on alloys 3-0.1MPa (7.9Zn-1.4Mg) and 3-1MPa (8.2Zn-
1.4Mg). HIPing only marginally affected the porosity in the alloy previously
solidified under 10 atmospheres of pressure. ..............................................................119
15. Effect of fracture surface porosity and oxide films on percent elongation of
alloys 3-1MPa (8.2Zn-1.4Mg) and 3-0.1MPa (7.9Zn-1.4Mg) samples. .....................121
16. Microstructure of chill and HIPed sample in SUP alloy 3-1MPa (8.2Zn-
1.4Mg) casting. ............................................................................................................121
17. Average intermetallic size in SUP alloy 3-1MPa (8.2Zn-1.4Mg) casting. ...............122

1
1. INTRODUCTION
The need for high strength, lightweight, economical castings grows as the push
for more fuel efficient, crash-worthy vehicles increases. Lightweight materials are
promising, but they are typically more expensive and have lower strength and stiffness
than higher density alternatives, such as iron and steel.
Wrought aluminum alloys can provide excellent combinations of properties, but
are limited to simple shapes. To make a complex part, extensive machining or forming
operations is required, which is time consuming, restrictive and costly. Internal
passageways, required by most structural components, cannot be produced by this
method. Advanced aluminum casting alloys with improved mechanical and physical
properties can solve this problem.
Advanced, high strength, cast aluminum alloys have been studied extensively in
recent years [1-38]. These alloys have exceptionally high strength but relatively low
ductility. It has been hypothesized that the lack of ductility is a result of two micro-
structural features: (1) an interdendritic network of undissolved intermetallic particles and
(2) randomly dispersed microporosity [20-27]. The microstructural features are a result
of solidification characteristics typical of cast Al-Zn-Mg-Cu series alloys, which include
a long solidification range and segregation during solidification. These factors result in
the formation of brittle intermetallics and microporosity.
The objectives of the current research were to: (1) determine the properties of an
existing high strength, micro-alloyed Al-Cu-Mg-Ag alloy, BAC 100TM
, and (2) develop
an ultra-high strength, cast aluminum alloy with reasonable ductility (>8%) based on the
Al-Zn-Mg-Cu system.

2
2. BACKGROUND AND LITERATURE REVIEW
2.1 Cast and wrought properties in aluminum alloys
The most commonly used cast aluminum alloys are based on the Al-Si binary
alloy system and include A319 (Al-Si-Cu), A356 (Al-Si-Mg), and A357 (Al-Si-Mg).
Compositions of these alloys are shown in Table 1 [1]. The solidification range in these
alloys is approximately 60 to 90°C (140 to 194°F), and yield strengths range from 165 to
290MPa (24 to 42ksi) while elongations range from 2 to 8%, as shown in Table 2 [1].
Higher strength cast aluminum alloys are based on the Al-Cu binary system.
Higher strength cast aluminum alloys include A206 and 201, both Al-Cu-Mg alloys.
Silver was added to alloy 201 for increased strength. Alloy A206-T7 has both higher
yield strength (345MPa (50ksi)) and elongation (12%) than the Al-Si alloys. The
solidification range for this alloy is approximately 80°C (176°F), and it is commonly cast
by high quality aluminum foundries. Alloy 201-T7 has a higher yield strength than those
found in A206-T7 at 414MPa (60ksi), but the elongations are lower. The solidification
range is 115°C (239°F), making it is more challenging to cast. The addition of silver also
makes alloy 201 expensive.
Ultra-high strength wrought aluminums are based on the Al-Zn-Mg-Cu system.
The strengths of cast 201 and A206 are still well below those obtained in wrought Al-Zn-
Mg-Cu (Al-Zn-Mg-Cu) alloys, as shown in Table 2. These alloys achieve yields
strengths around 500MPa (72ksi) while maintaining elongations of 10-12%. The
downside to the Al-Zn-Mg-Cu series aluminum alloys is its poor stress corrosion
cracking resistance and generally poor fatigue strength.

3
Table 1
Composition ranges (wt%) of aluminum casting and wrought alloys [1]
Alloy Cu Mg Mn Fe
max Si Ti Ag V Zr Zn
201
4.0
to
5.2
0.15
to
0.55
0.2
to
0.5
0.15 0.10
max
0.15
to
0.35
0.4
to
1.0
- - -
A206
4.2
to
5.2
0.15
to
0.35
0.2
to
0.5
0.10 0.10
max
0.15
to
0.30
- - - -
BAC
100 TM
5.00
to
6.25
0.2
to
0.5
0.2
to
0.65
0.15 0.15
max
0.02
to
0.04
0.4
max
0.05
to
0.25
0.05
to
0.25
-
A319
3.0
to
4.0
0.10
max
0.50
max 1.00
5.5
to
6.5
0.25
max - - -
1.0
max
A356 0.20
max
0.25
to
0.45
0.10
max 0.20
6.5
to
7.5
0.20
max - - -
0.10
max
A357 0.20
max
0.40
to
0.70
0.10
max 0.20
6.5
to
7.5
0.10
to
0.20
- - - 0.10
max
Wrought
7042
1.3
to
1.9
2.0
to
2.8
0.20
to
0.40
0.20 0.20
max - - -
0.11
to
0.20
6.5
to
7.9
Wrought
7075
1.2
to
2.0
2.1
to
2.9
0.30
max 0.50 0.40 0.20 - - -
5.1
to
6.1
Wrought
2519
5.3
to
6.4
0.05
to
0.40
0.10
to
0.50
0.30 0.25
max
0.02
to
0.10
-
0.05
to
0.15
0.10
to
0.25
0.10
max

4
Table 2
Aluminum alloys and their mechanical properties (for cast alloys, properties are
from separately cast test bars) and liquidus and solidus [1]
Alloy Yield
MPa (ksi)
UTS
MPa (ksi)
Elongation
(%)
Liquidus
Temp. (TL)
±2°C (°F)
Solidus
Temp. (TS)
±2°C (°F)
201-T6 484(70) 435(63) 7 650 (1200) 535 (995)
201 – T7 414 (60) 462 (67) 4.5 650 (1200) 535 (995)
A206 – T7 347 (50) 436 (63) 12 650 (1202) 570 (1058)
A319 – T6 165 (24) 250 (36) 2.0 605 (1120) 515 (960)
A356 – T6 165 (24) 227 (33) 3.5 615 (1135) 555 (1035)
A357 – T62 290 (42) 360 (52) 8 615 (1135) 555 (1035)
Wrought
7042 – T7 503 (73) 583 (85) 12 629 (1164) 467 (873)
Wrought
7075 – T6 503 (73)
572 (83)
11 635 (1175) 477 (890)
Wrought
2519-T87 420 (61) 470 (68) >10%
Wrought Al-Cu alloys have high strength. Wrought 2519-T87 aluminum alloy is a
micro-alloyed aluminum-copper alloy with a yield strength of 420MPa (61ksi), UTS of
470MPa (68ksi), an elongation of greater than 10% [1], and good stress corrosion
resistance (Table 2). Applications for this alloy include defense (armor) and aerospace.
BAC 100TM
is an Al-Cu-Ag casting alloy with small additions of zirconium and
vanadium that is designed to replace wrought 2519 when complicated shapes are
required.
2.2 Alloying effects in cast aluminum alloys
Alloying elements play a crucial role in deciding the mechanical properties of
aluminum alloys. Al-Cu alloys such as 201, A206 and BAC 100TM
contain 4-6.25% Cu,
which increases strength and hardness and decreases elongation [2; 226]. The nominal
compositions of 201, A206, and BAC 100TM
are shown in Table 1. Strength is increased

5
by both solid solution strengthening and precipitation hardening. The maximum strength
is achieved between 4-6% Cu and is also dependent on other constituents [2; 226]. For
example, magnesium, added to Al-Cu alloys, has the primary benefit of increasing
strength after solution treatment and quenching. Magnesium and copper increase the
yield strength and decrease elongation in artificially aged alloys. Natural aging of these
alloys at room temperature results in an increase in both strength and ductility [2; 228].
Manganese is added to these alloys to increase strength but may also contribute to
intermetallic formation. Titanium is specifically added for grain refinement. BAC 100TM
has higher Cu and Mg additions than 201 and A206 to increase strength. Silver is also
added to increase strength and stress corrosion cracking resistance. Zirconium and
vanadium offer grain refinement in as-cast aluminum alloys. Zirconium also decreases
the quench sensitivity in aluminum alloys. Vanadium also functions as dispersion
strengthening agent, which improves the high temperature mechanical properties by
increasing the recrystallization temperature.
The Al-Zn-Cu-Mg wrought alloys are the highest strength aluminum alloys. Zinc
additions alone do not significantly increase strength [2; 238]. However, zinc increases
the solution potential of other alloying elements in aluminum so that intermetallics
formation can be reduced, increasing strength and ductility [2; 238]. The addition of
magnesium to the Al-Zn binary alloy results increase both ultimate and yield strength.
However, increasing free magnesium decreases elongation and increases the likelihood of
stress corrosion cracking [2; 239].
Some alloy additions to the Al-Zn-Mg system can have positive and negative
effects on the mechanical properties. Additions of copper to Al-Zn-Mg alloys increase

6
the resistance to stress corrosion cracking but increase quench sensitivity and decrease
the resistance to general corrosion [3]. It is believed that additions of copper greater than
1 wt% also increase the aging rate by increasing the amount of super-saturation, resulting
in the nucleation of S phase (CuMgAl2) [2; 239]. In both Al-Cu and Al-Zn-Mg-Cu
alloys, small amounts of iron can result in poor ductility. Iron combines with other
elements and results in insoluble, brittle intermetallic constituents that reduce ductility.
[2; 228]
Both the Al-Zn-Mg-Cu alloys and BAC 100TM
alloys achieve high strengths
through solid solution and precipitation hardening. To maintain strength and ductility in
these alloys, the formation of porosity and brittle intermetallics during solidification must
be minimized or eliminated. Porosity reduces ductility. Porosity can be minimized by
proper gating and risering, the use of chills, solidification under pressure (SUP), and Hot
Isostatic Pressing (HIPing). Large intermetallics reduce the strength of the alloys by
limiting the alloying available for precipitation hardening and reduce ductility by forming
an interconnected network of brittle phases. If the cooling rate is low, or if alloying
levels are high, the intermetallics are challenging to dissolve during solution treatment.
Intermetallics size can also be minimized by the use of chills.
2.3 Phase stability and heat treatment
Phase stability plays a crucial role in the development of advanced, high-strength
aluminum alloys. The simple aluminum-copper binary phase diagram (Figure 1 [4])
helps to illustrate the issues associated with intermetallic formation during solidification
in high strength aluminum casting alloys. To minimize intermetallic formation, alloys
must have compositions below the eutectic range (less than 6% for the binary aluminum-
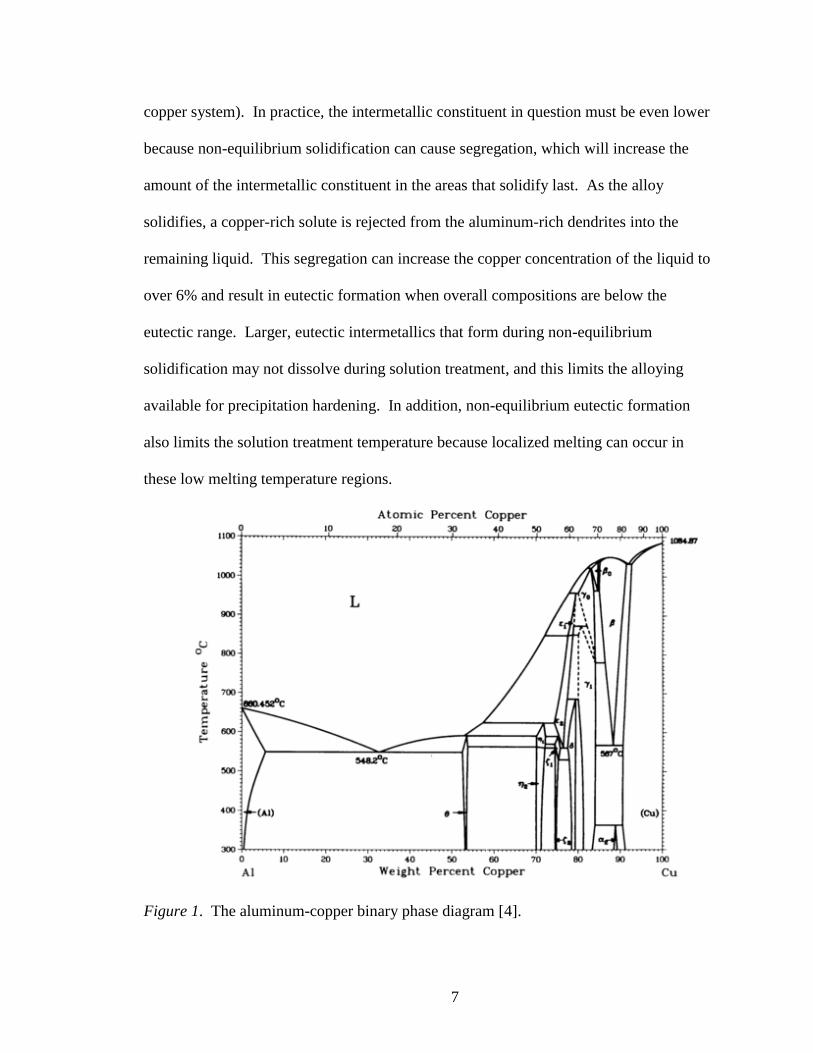
7
copper system). In practice, the intermetallic constituent in question must be even lower
because non-equilibrium solidification can cause segregation, which will increase the
amount of the intermetallic constituent in the areas that solidify last. As the alloy
solidifies, a copper-rich solute is rejected from the aluminum-rich dendrites into the
remaining liquid. This segregation can increase the copper concentration of the liquid to
over 6% and result in eutectic formation when overall compositions are below the
eutectic range. Larger, eutectic intermetallics that form during non-equilibrium
solidification may not dissolve during solution treatment, and this limits the alloying
available for precipitation hardening. In addition, non-equilibrium eutectic formation
also limits the solution treatment temperature because localized melting can occur in
these low melting temperature regions.
Figure 1. The aluminum-copper binary phase diagram [4].
8
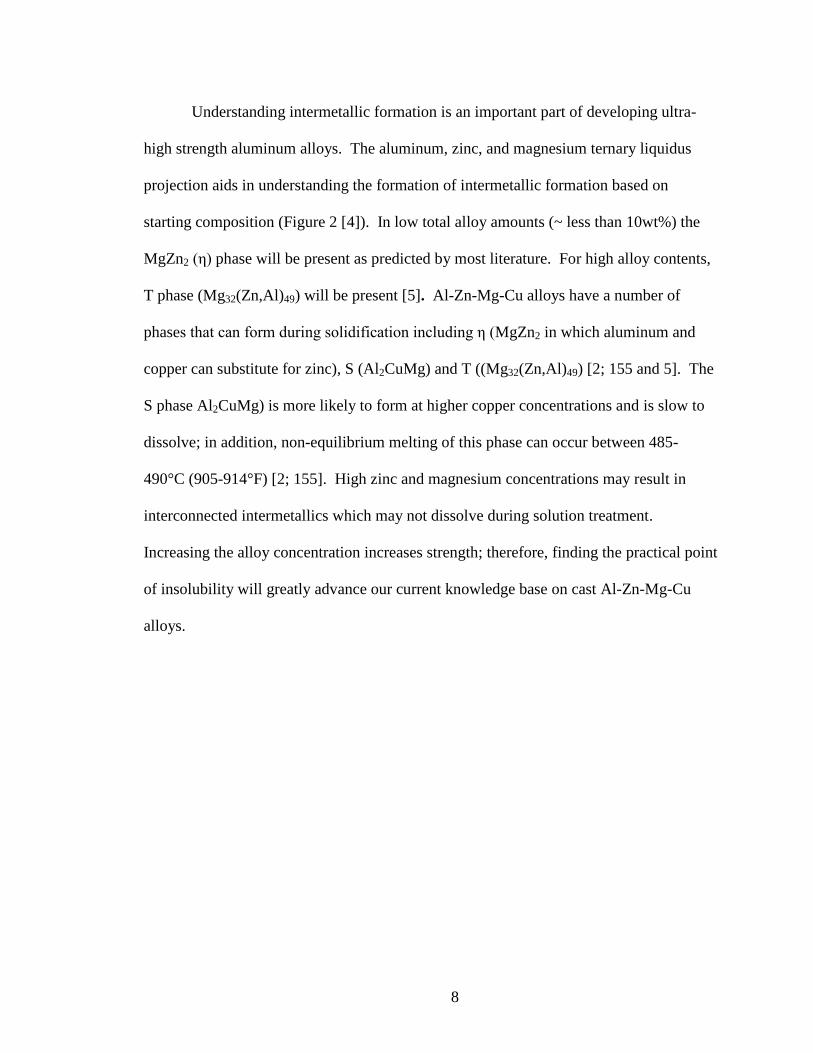
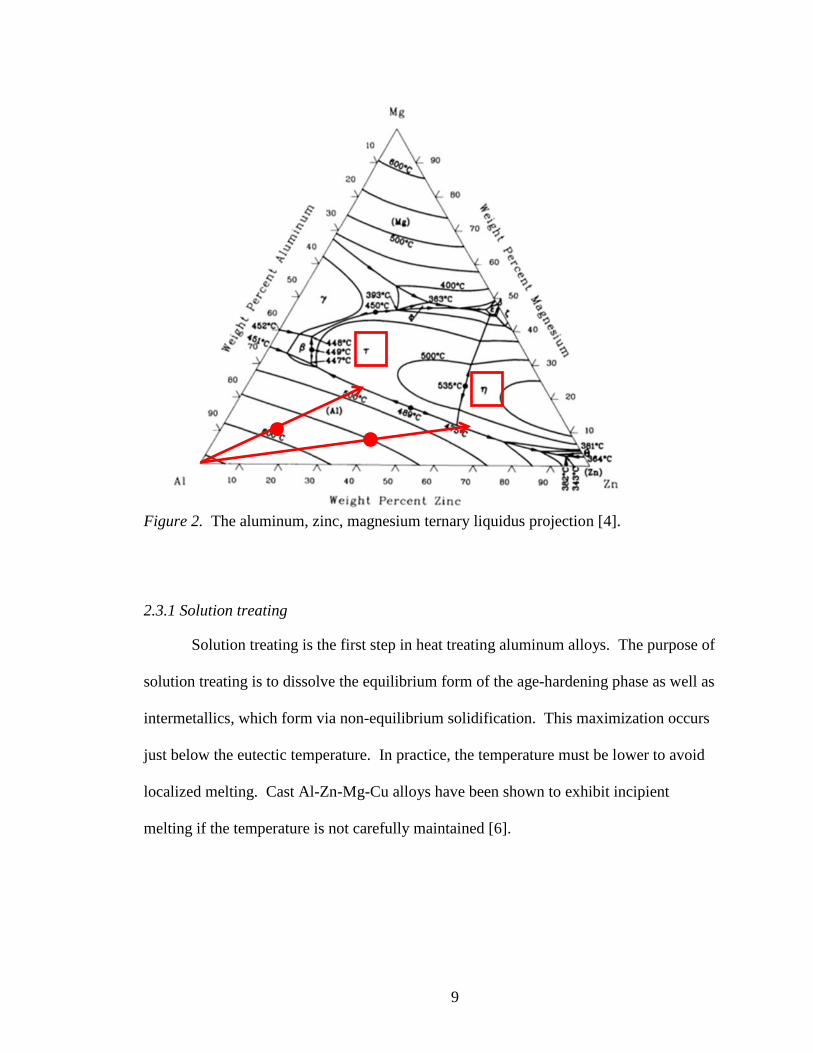
Understanding intermetallic formation is an important part of developing ultra-
high strength aluminum alloys. The aluminum, zinc, and magnesium ternary liquidus
projection aids in understanding the formation of intermetallic formation based on
starting composition (Figure 2 [4]). In low total alloy amounts (~ less than 10wt%) the
MgZn2 (η) phase will be present as predicted by most literature. For high alloy contents,
T phase (Mg32(Zn,Al)49) will be present [5]. Al-Zn-Mg-Cu alloys have a number of
phases that can form during solidification including η (MgZn2 in which aluminum and
copper can substitute for zinc), S (Al2CuMg) and T ((Mg32(Zn,Al)49) [2; 155 and 5]. The
S phase Al2CuMg) is more likely to form at higher copper concentrations and is slow to
dissolve; in addition, non-equilibrium melting of this phase can occur between 485-
490°C (905-914°F) [2; 155]. High zinc and magnesium concentrations may result in
interconnected intermetallics which may not dissolve during solution treatment.
Increasing the alloy concentration increases strength; therefore, finding the practical point
of insolubility will greatly advance our current knowledge base on cast Al-Zn-Mg-Cu
alloys.
9
Figure 2. The aluminum, zinc, magnesium ternary liquidus projection [4].
2.3.1 Solution treating
Solution treating is the first step in heat treating aluminum alloys. The purpose of
solution treating is to dissolve the equilibrium form of the age-hardening phase as well as
intermetallics, which form via non-equilibrium solidification. This maximization occurs
just below the eutectic temperature. In practice, the temperature must be lower to avoid
localized melting. Cast Al-Zn-Mg-Cu alloys have been shown to exhibit incipient
melting if the temperature is not carefully maintained [6].
10
2.3.2 Aging
Age hardening of aluminum alloys can be controlled to yield the desired
mechanical properties in aluminum alloys. Age hardening of Al-Cu alloys, such as BAC
100TM
, begins with the super saturation of the aluminum matrix (αSS) [4; 143]. The first
precipitates to form are coherent Guinier-Preston zones that are enriched with solute (GP-
1) [2; 143]. At temperatures above 100°C (212°F) the GP-1 zones disappear and are
replaced by a structure designated coherent GP-2 zones (θ”) [2; 143]. Next, the θ’ phase
forms which is semi-coherent with the solid solution lattice [2; 143]. Finally, the
equilibrium incoherent θ phase (CuAl2) forms and hardness decreases [2; 143]. The
structure sequence in aluminum-copper alloys is diagramed in equation 1.
( ) ( ) Equation 1 [2; 143]
Age hardening in the Al-Zn-Mg ternary alloys is more complicated that in binary
alloys. In Al-Zn-Mg-Cu series alloys, a number of precipitates can form. A low
temperature initial aging period results in the redistribution of solute atoms within the
solid solution lattice to form clusters of Guinier-Preston (GP) zones that are considerably
enriched in solute. This local redistribution results in distortions of the lattice planes,
increasing the material’s strength proportionally to the size and number of GP zones.
Above room temperature, GP zones with high Zn/Mg ratios transform into the transition
precipitates η’ and/or T’ [2; 145]. These metastable precipitates are partially coherent
with the {111} matrix plane [2; 145] and are precursors to the equilibrium precipitates η
(MgZn2) and T (Mg32(Zn,Al)49), which are shown in Equation 2. The η (MgZn2) phase is
more likely to form at lower magnesium and zinc concentrations.
11
( )
Equation 2 [2; 146]
( )
The possible transition routes are oversimplified in equation 2 as the transition phase η’
may actually form over a considerable composition range (Al+T and Al+η). Increasing
the aging time or temperature results in a more rapid transformation to the equilibrium η
(MgZn2) and/or T (Mg32(Zn,Al)49) phase(s). If the copper concentration is above 1 wt%,
then copper and aluminum can substitute for zinc in the η (MgZn2) phase to form S phase
(Al2CuMg) [2; 145-146]. If significant silicon is present in an Al-Zn-Mg-Cu alloy, then
Mg2Si can form at the grain boundaries. This phase cannot be dissolved during solution
treatment. In wrought alloys, it results in fracture during hot forming [3; 44].
2.4 Al-Zn-Mg-Cu chemistries
Recent studies of cast Al-Zn-Mg-Cu based alloys have shown that high yield
strength and ultimate strength are possible. However, the ductility is unacceptably low
and needs improvement before these alloys can be used commercially [6 and 7]. The
goal of this research was to maximize strength while maintaining a minimum of 8%
elongation. The effect of zinc on aluminum alloy containing 1.5% copper and 1% and
3% magnesium in 1.6mm (0.064in) thick sheet, which has been heat treated and aged is
shown in Figure 3 [2: 240]. This figure indicates that additions of 8-12wt% zinc should
result in 8% elongation since the curve appears to level off at about 10% elongation at
zinc concentrations above 7wt%.

12
Figure 3. Elongation versus zinc content (wt%). [2; 240]
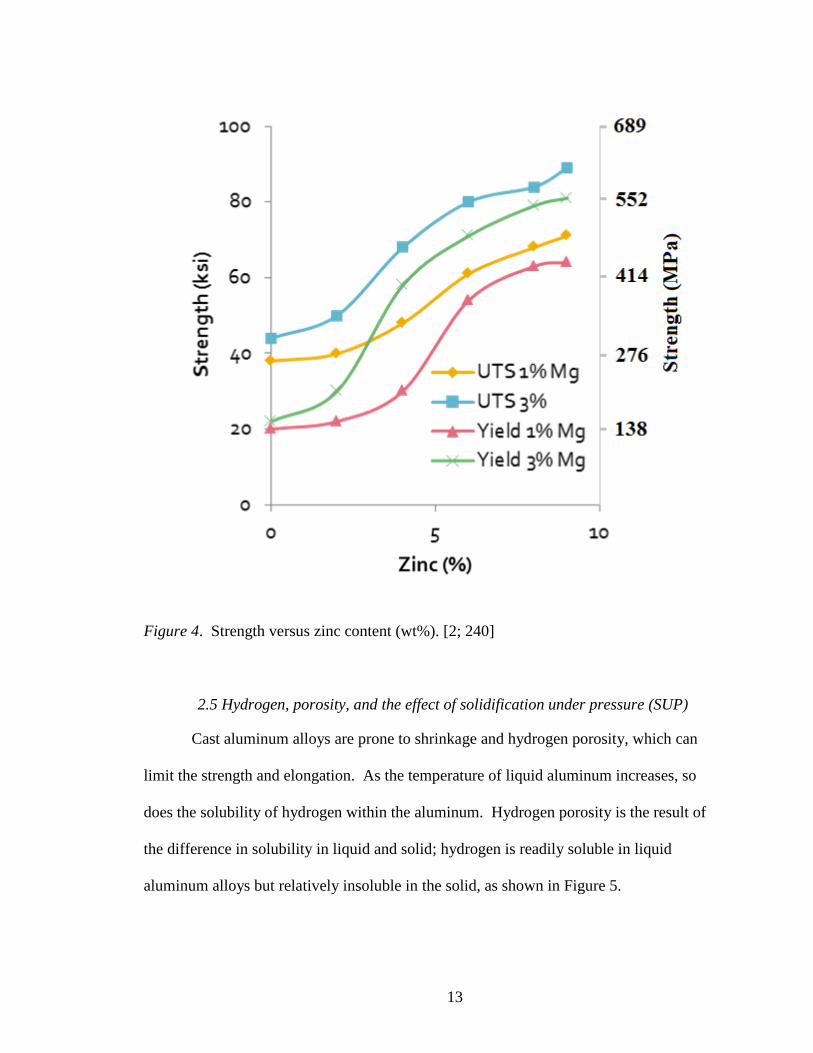
Maximizing yield and ultimate tensile strength requires high zinc and magnesium
alloy concentrations. Figure 4 shows the effects of zinc and magnesium concentration on
the tensile and yield strength of heat treated and aged 1.6mm (0.064in) thick sheet [2;
240]. As the zinc concentration increased from 0 to 9wt%, the yield and ultimate tensile
strength increased [2; 240]. Increasing magnesium from 1 to 3wt% increased the yield
and tensile strength [2; 240]. The η (MgZn2) phase is the primary strengthening
precipitate in Al-Zn-Mg-Cu series wrought alloys. The ratio of Zn/Mg in wt% to achieve
this precipitate without excess solute is 5.39, and the ratios achieved in this study ranged
from 0 to 9wt% [2; 240].
13
Figure 4. Strength versus zinc content (wt%). [2; 240]
2.5 Hydrogen, porosity, and the effect of solidification under pressure (SUP)
Cast aluminum alloys are prone to shrinkage and hydrogen porosity, which can
limit the strength and elongation. As the temperature of liquid aluminum increases, so
does the solubility of hydrogen within the aluminum. Hydrogen porosity is the result of
the difference in solubility in liquid and solid; hydrogen is readily soluble in liquid
aluminum alloys but relatively insoluble in the solid, as shown in Figure 5.
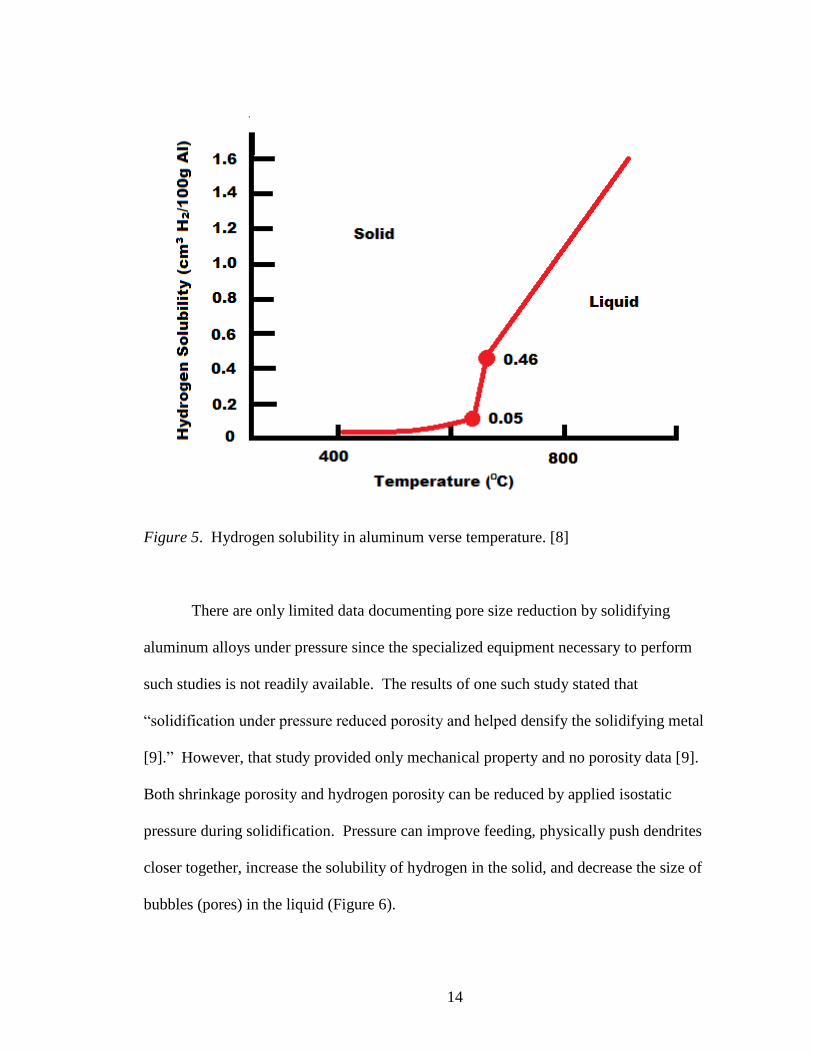
14
Figure 5. Hydrogen solubility in aluminum verse temperature. [8]
There are only limited data documenting pore size reduction by solidifying
aluminum alloys under pressure since the specialized equipment necessary to perform
such studies is not readily available. The results of one such study stated that
“solidification under pressure reduced porosity and helped densify the solidifying metal
[9].” However, that study provided only mechanical property and no porosity data [9].
Both shrinkage porosity and hydrogen porosity can be reduced by applied isostatic
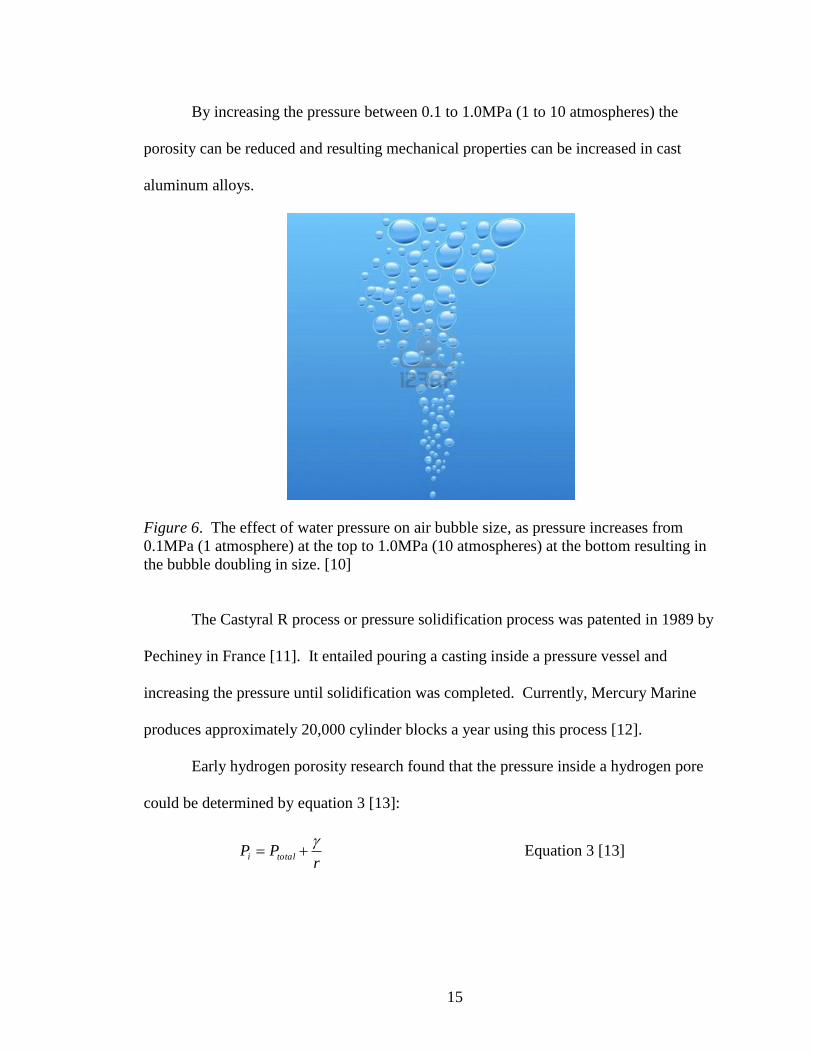
pressure during solidification. Pressure can improve feeding, physically push dendrites
closer together, increase the solubility of hydrogen in the solid, and decrease the size of
bubbles (pores) in the liquid (Figure 6).
15
By increasing the pressure between 0.1 to 1.0MPa (1 to 10 atmospheres) the
porosity can be reduced and resulting mechanical properties can be increased in cast
aluminum alloys.
Figure 6. The effect of water pressure on air bubble size, as pressure increases from
0.1MPa (1 atmosphere) at the top to 1.0MPa (10 atmospheres) at the bottom resulting in
the bubble doubling in size. [10]
The Castyral R process or pressure solidification process was patented in 1989 by
Pechiney in France [11]. It entailed pouring a casting inside a pressure vessel and
increasing the pressure until solidification was completed. Currently, Mercury Marine
produces approximately 20,000 cylinder blocks a year using this process [12].
Early hydrogen porosity research found that the pressure inside a hydrogen pore
could be determined by equation 3 [13]:
rPP totali
Equation 3 [13]

16
where Pi is the pressure inside the hydrogen bubble, Ptotal is equal to the pressure of the
atmosphere and metallostatic head, r is the radius of curvature of the pore, and γ is
surface tension. Taking into account metallostatic head pressure results in a revised
equation 1 (equation 4) [13]:
rPPP headatmH /2
Equation 4 [13]
where the pressure inside a hydrogen gas bubble (PH2) is equal to the sum of the
atmospheric pressure (Patm), the metallostatic head pressure (Phead), and /r. Sievert’s law
must also be obeyed and can be used to determine the hydrogen solubility as a function of
pressure using equation 5 [13]:
PKCS Equation 5 [13]
where Cs is the solid solubility of hydrogen, K is a constant, and P is the applied pressure.
In addition, Boyle’s law can be used to determine the volume of a hydrogen pore as
shown in equation 6 [13]:
PCVV
1 Equation 6 [13]
where Vv is the volume of voids, C is the volume of hydrogen available to form a void,
and P is the applied pressure.
17
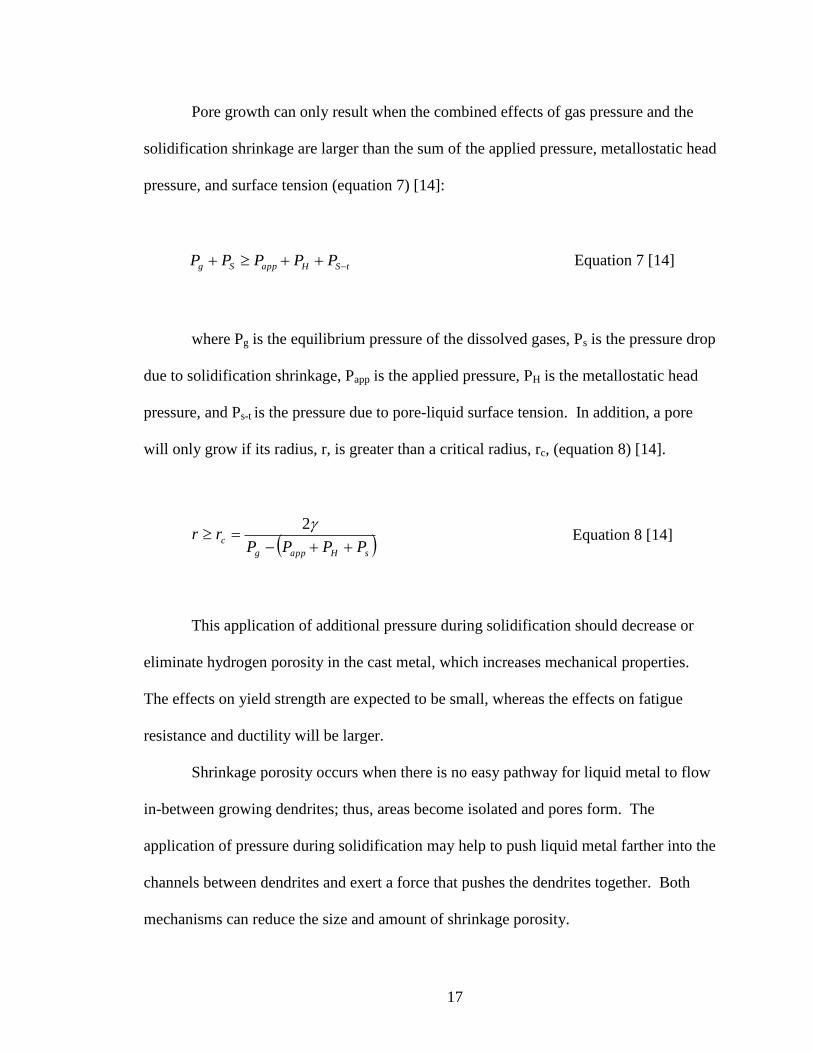
Pore growth can only result when the combined effects of gas pressure and the
solidification shrinkage are larger than the sum of the applied pressure, metallostatic head
pressure, and surface tension (equation 7) [14]:
tSHappSg PPPPP Equation 7 [14]
where Pg is the equilibrium pressure of the dissolved gases, Ps is the pressure drop
due to solidification shrinkage, Papp is the applied pressure, PH is the metallostatic head
pressure, and Ps-t is the pressure due to pore-liquid surface tension. In addition, a pore
will only grow if its radius, r, is greater than a critical radius, rc, (equation 8) [14].
sHappg
cPPPP
rr
2
Equation 8 [14]
This application of additional pressure during solidification should decrease or
eliminate hydrogen porosity in the cast metal, which increases mechanical properties.
The effects on yield strength are expected to be small, whereas the effects on fatigue
resistance and ductility will be larger.
Shrinkage porosity occurs when there is no easy pathway for liquid metal to flow
in-between growing dendrites; thus, areas become isolated and pores form. The
application of pressure during solidification may help to push liquid metal farther into the
channels between dendrites and exert a force that pushes the dendrites together. Both
mechanisms can reduce the size and amount of shrinkage porosity.

18
3. SPECIFIC AIMS
The objective of this dissertation research was to improve the properties of an
existing high strength, micro-alloyed Al-Cu-Ag alloy (BAC 100TM
) and develop an ultra-
high strength, cast aluminum alloy with reasonable ductility (>8%) based on the Al-Zn-
Mg-Cu system. Alloy and processing improvements are necessary to combine the
superior properties of wrought Al-Zn-Mg-Cu alloys, such as 7075, with near-net-shape
capabilities of casting. High strength, cast aluminum alloys will provide lower cost and
weight alternatives to current cast aluminum alloys for the automotive, aerospace, and
defense industries. Studying these alloys will increase the understanding between
mechanical properties, heat treatment conditions, and alloy chemistry. This information
can be used to further improve cast aluminum alloys for the high strength applications of
the future. Specifically, the following objectives were addressed:
3.1 Objective 1: Improve the mechanical properties of BAC 100 TM
Previous work has found that both strength and toughness of BAC 100TM
were
limited by intermetallic phases and porosity. The chemistry, heat treatment, and casting
process were re-evaluated to determine if these intermetallics and porosity could be
decreased.
3.2 Objective 2: Determine chemistry, processing and heat treatment effects on
microstructure and properties of cast Al-Zn-Mg-Cu Alloys.
Understanding how the base chemistry and processing (solidification under
pressure and solution treatment times and temperatures) affect the resulting

19
microstructure will advance the current understanding of cast Al-Zn-Mg-Cu alloys.
Chemistry and processing effects on porosity, intermetallics, and oxides is important
information which will impact future work on these alloys and lay a solid foundation of
information for future researchers.
Previous work has found that the ductility limiting factors in high strength cast
aluminum tended to be intermetallics [1-33]. As such, solution treatments must be
devised to break up and dissolve these intermetallics if elongation greater than 8%
(minimum for a structural material) is to be achieved. In addition, aging to less than peak
hardness can increase elongation while having a minimum effect on yield and ultimate
tensile strength. An understanding of these factors in greater detail will further aid in the
development of high strength cast aluminum. The tensile properties of promising
experimental Al-Zn-Cu-Mg alloy with varying compositions, processing, and heat
treatment conditions were determined.
3.3 Objective 3: Demonstrate that Al-Zn-Mg-Cu alloys can be cast to near-net-shape
using best practices.
Al-Zn-Mg-Cu alloys have large solidification ranges and are more difficult to cast
than conventional aluminum casting alloys. Recent developments in casting technology
make production of these alloys feasible. Using these technologies, a commercial part
was cast in Al-Zn-Mg-Cu alloy. Successful completion of this objective could open up
whole new generations of aluminum castings to replace wrought products.
20
4. EXPERIMENTAL METHODS
4.1 Casting
BAC 100 TM
castings were poured at both the University of Alabama at
Birmingham (UAB) and a commercial foundry. The commercial foundry cast keel
blocks and supplied machined tensile specimens to UAB. UAB produced a commercial
seat frame casting from which tensile specimens were removed from specific locations,
as shown in Figure 7. The seat frame castings were produced in chemically bonded sand
molds that contained two foam type filters in the runner system with a steel chill covering
the entire drag surface of the mold.
The experimental Al-Zn-Mg-Cu alloys were cast at UAB in a wedge-shaped
casting that produced smooth laminar filling and were properly chilled and risered to
produce a sound casting. The design and dimensions of the wedge casting are shown in
Figure 8. A plug-pour basin was used at UAB to reduce pouring rate variations and
entrained oxides for the wedge castings, as shown in Figure 9.
21
Figure 7. Photograph of the seat frame casting showing the location of samples.

22
Figure 8. Design and dimension of UAB wedge casting.

23
Figure 9. Bonded sand mold with plug-pour basin in place.
Experimental heats of BAC 100TM
and Al-Zn-Mg-Cu alloy weighing 9.5kg (21lb)
were crucible melted in a resistance furnace. A master alloy containing low iron and
copper (Al-0.9Cu-0.08Fe) was used as the base alloy. From this base alloy, additions
were made to result in the desired chemistry. Each heat was degassed for between 20-60
minutes with argon rotary degassing. A reduced pressure test sample was taken after
degassing for each heat and checked to ensure proper degassing. Grain refinement
additions of 0.02wt% Ti were added. Copper chilled chemistry samples were taken for
each heat. Chemistry was determined by optical emission spectrometer (OES) and
inductively coupled plasma (ICP) analysis by NSL Analytical, Cleveland, OH.
The pressure vessel at UAB was used for the experimental alloy wedge castings.
The pressure vessel was 1.2 meters in diameter and 1.8 meters in height, which provided
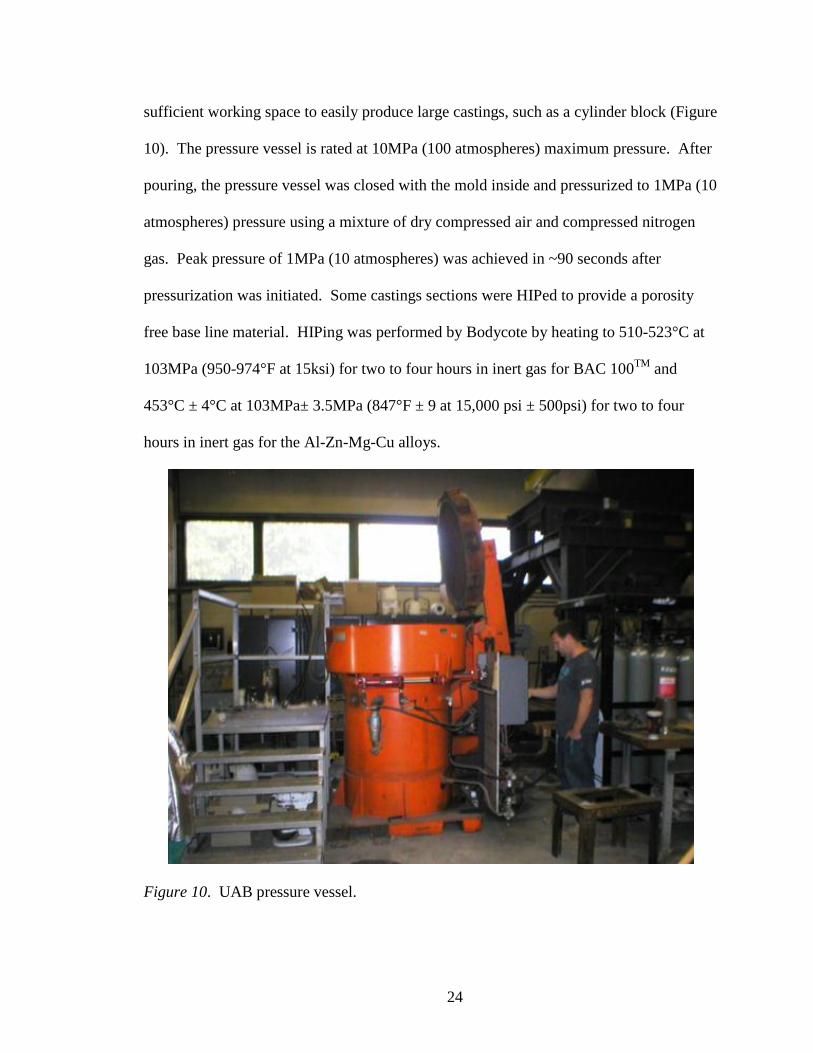
24
sufficient working space to easily produce large castings, such as a cylinder block (Figure
10). The pressure vessel is rated at 10MPa (100 atmospheres) maximum pressure. After
pouring, the pressure vessel was closed with the mold inside and pressurized to 1MPa (10
atmospheres) pressure using a mixture of dry compressed air and compressed nitrogen
gas. Peak pressure of 1MPa (10 atmospheres) was achieved in ~90 seconds after
pressurization was initiated. Some castings sections were HIPed to provide a porosity
free base line material. HIPing was performed by Bodycote by heating to 510-523°C at
103MPa (950-974°F at 15ksi) for two to four hours in inert gas for BAC 100TM
and
453°C ± 4°C at 103MPa± 3.5MPa (847°F ± 9 at 15,000 psi ± 500psi) for two to four
hours in inert gas for the Al-Zn-Mg-Cu alloys.
Figure 10. UAB pressure vessel.
25
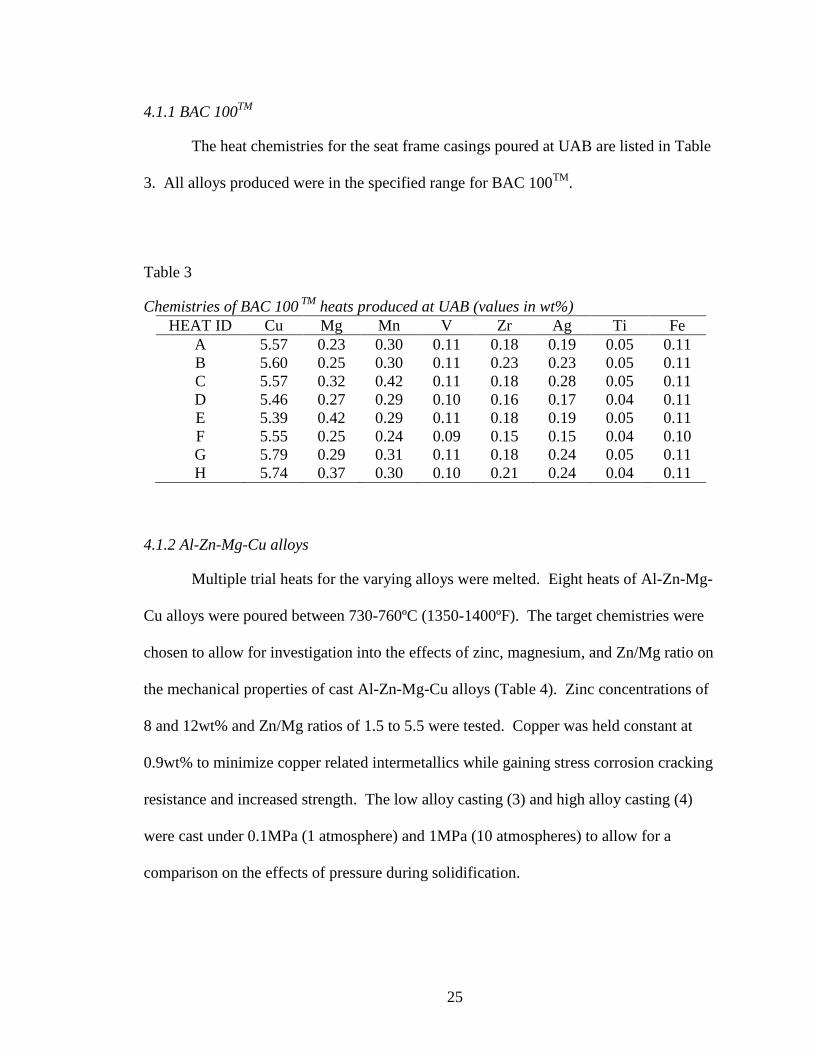
4.1.1 BAC 100TM
The heat chemistries for the seat frame casings poured at UAB are listed in Table
3. All alloys produced were in the specified range for BAC 100TM
.
Table 3
Chemistries of BAC 100 TM
heats produced at UAB (values in wt%)
HEAT ID Cu Mg Mn V Zr Ag Ti Fe
A 5.57 0.23 0.30 0.11 0.18 0.19 0.05 0.11
B 5.60 0.25 0.30 0.11 0.23 0.23 0.05 0.11
C 5.57 0.32 0.42 0.11 0.18 0.28 0.05 0.11
D 5.46 0.27 0.29 0.10 0.16 0.17 0.04 0.11
E 5.39 0.42 0.29 0.11 0.18 0.19 0.05 0.11
F 5.55 0.25 0.24 0.09 0.15 0.15 0.04 0.10
G 5.79 0.29 0.31 0.11 0.18 0.24 0.05 0.11
H 5.74 0.37 0.30 0.10 0.21 0.24 0.04 0.11
4.1.2 Al-Zn-Mg-Cu alloys
Multiple trial heats for the varying alloys were melted. Eight heats of Al-Zn-Mg-
Cu alloys were poured between 730-760ºC (1350-1400ºF). The target chemistries were
chosen to allow for investigation into the effects of zinc, magnesium, and Zn/Mg ratio on
the mechanical properties of cast Al-Zn-Mg-Cu alloys (Table 4). Zinc concentrations of
8 and 12wt% and Zn/Mg ratios of 1.5 to 5.5 were tested. Copper was held constant at
0.9wt% to minimize copper related intermetallics while gaining stress corrosion cracking
resistance and increased strength. The low alloy casting (3) and high alloy casting (4)
were cast under 0.1MPa (1 atmosphere) and 1MPa (10 atmospheres) to allow for a
comparison on the effects of pressure during solidification.

26
Table 4
Target Chemistries for each of 6 alloys
Alloy Zn Mg Zn:Mg Cu Fe
1 8 5.3 1.5 0.9 <0.08
2 8 2.3 3.5 0.9 <0.08
3 * 8 1.5 5.5 0.9 <0.08
4 * 12 8 1.5 0.9 <0.08
5 12 3.4 3.5 0.9 <0.08
6 12 2.2 5.5 0.9 <0.08
7075 5.1-6.1 2.1-2.9 1.8-2.9 1.2-2.0
*Denotes cast under pressure and in air.
4.2 Heat treating
Heat treating studies were conducted on all of the experimental alloys. Samples
were heat treated at UAB in a recirculating air furnace with a thermocouple attached to
the samples to accurately control specimen temperature. Solution treatment studies were
conducted with the goal of reducing and eliminating intermetallic particles. After each
set period of time at a given temperature, a designated sample was removed from the
furnace, quenched in warm water, and metallographically prepared.
4.2.1 BAC 100TM
BAC 100TM
was studied with the goal of producing a new “high-strength” cast
aluminum with other desirable properties. The heat treatment included solution treating
at 510-515ºC (950-960ºF) for two hours to reduce segregation and avoid partial melting
followed by heating to 530-535ºC (986-995ºF) and holding for 15-100 hours. After
solution treatment, the samples were quenched in warm water. Two artificial aging
treatments were investigated. To produce “high strength” material, artificial aging was

27
performed at 163ºC (325ºF) for 36 hours and to produce “high toughness” material,
artificial aging was performed at 163ºC (325ºF) for 12 hours.
4.2.2 Al-Zn-Mg-Cu alloys
Al-Zn-Mg-Cu alloys were also studied with the goal of producing ultra-high
strength cast aluminum. Heat treatment was conducted using a recirculating air furnace
and with thermocouples attached to the specimens to accurately control temperature.
Two different solution treatments were evaluated based on previous work in wrought Al-
Zn-Mg-Cu series alloys and scandium containing Al-Zn-Mg-Cu series cast alloys and
previous experience working with BAC 100TM
: (1) Samples were solution treated at
441°C (826ºF) for four hours followed by 460ºC (860ºF) for 0 to 100 hours and (2) 460ºC
(860ºF) for four hours followed by 480ºC (896ºF) for 0 to 100 hours [6 and 7]. Samples
were removed at 0, 1, 2, 4, 8, 12, 25, 50, 75, and 100 hours during solution treatment.
Samples were naturally aged at room temperature for greater than 24 hours then
artificially aged at 120ºC (248ºF) and 150ºC (302ºF) for 0 to 120 hours. The goal of
solution treatment was to minimize intermetallics and second phase particles, while aging
was conducted for maximum strength (hardness).
4.3 Testing
4.3.1 Aging study
Aging studies were conducted to better understand these cast aluminum alloys.
Aging studies were conducted for varying times and temperatures before measuring
hardness with a NewAge HB3000B Brinell Hardness tester at 500kg load and a 10mm
diameter steel ball. One indention was made for each time, temperature, and alloy
28
combination. The indention was measured three times by a digital reader before rotating
the sample 90 degrees and measuring another three times; all six measurements were
averaged and the resulting hardness was recorded.
4.3.2 Tensile testing
Tensile testing was conducted to determine the mechanical properties of all
experimental alloys. Tensile bars that were 9mm diameter x 36mm gage length were
tested in accordance with ASTM E8/B557 (2011, 2010) on an MTS 810 servo hydraulic
tension / compression tester using an extensometer [15-16]. These data were used to
determine mechanical properties, such as 0.2% offset yield strength, ultimate tensile
strength, and elongation to fracture. Samples were removed from the four locations at
distances ranging from 0.8cm (0.3in) to 6.6cm (2.6in) from the chill (Figure 12). As the
distance from the chill increased, the cooling rate in the samples decreased. Samples for
HIPing were removed from a section rotated 90 degrees from the chilled and SUP tensile
samples. The center of the HIPed tensile bars were at a distance more than 5cm (2in)
from the chill so the cooling rate in these regions was lower than seen in the thickest SUP
samples. From each wedge casting, two specimens were removed from locations
adjacent, 2.9cm (1.1in), 4.8cm (1.9in), and 6.7cm (2.6in) from the chill and four HIPed
samples were analyzed.
29
Figure 11. Casting produced with lines showing from where each tensile blank was cut.
4.3.3 Direct tension stress corrosion cracking
Direct tension stress corrosion cracking was conducted to determine how BAC
100TM
would respond to different environmental conditions. Direct tension stress
corrosion cracking tests were performed at Westmoreland Mechanical Testing and
Research Inc. on both high strength and high toughness BAC 100TM
samples. Most of
the tests were performed on samples removed from the seat frame casting produced at
30
UAB, and a few were done on the test samples produced at a commercial foundry.
Testing was performed in accordance with ASTM G49-85 (2011) [17]. The test
specimens were 0.3175cm (0.1250in) in diameter. The high toughness samples were
tested at 170MPa (25ksi), 200MPa (29ksi), 234MPa (34ksi), and 260MPa (38ksi) while
high strength samples were tested at 240MPa (35ksi) and 280MPa (41ksi). The goal for
each test was for the sample to survive 20 days.
4.3.4 Fatigue testing
Fatigue life testing was conducted to aid designers in the use of the BAC100TM
alloy. Fatigue testing, in accordance with ASTM 466-07 (2007) [18], was performed by
Westmoreland Mechanical Testing and Research, Inc. on high toughness material
sectioned from the BAC 100TM
seat frame and tensile blank castings. The tests were
performed at room temperature on servo-hydraulic fatigue machines employing a 30
hertz sinusoidal waveform. The R-ratio was 0.10 and run-out was defined as 1,000,000
cycles. Samples were tested at 210MPa (30ksi), 290MPa (42ksi) (target minimum yield
strength), and 340MPa (50ksi). The goals were >1,000,000 at 210MPa (30ksi), >100,000
at 290MPa (42ksi), and >10,000 cycles at 340MPa (50ksi).
4.4 Characterization
4.4.1 Microstructural analysis
Microstructural analysis was conducted on selected tensile samples using optical
microscopy. Samples approximately parallel to and just below the tensile fracture
surfaces were removed and polished. Intermetallic size was measured using Image Pro
PlusTM
[19] image processing software.
31
4.4.2 Intermetallic measurement
Intermetallic measurements were made by taking optical images of the
microstructure at a magnification of 500x. Image analysis was conducted by utilizing
color thresholding to separate the second phase particles from the matrix to determine
their volume percent and feret length.
4.4.3 Stereo microscope analysis
Tensile fracture surfaces were analyzed using stereo microscopy. Tensile fracture
surfaces were examined with a Zeiss Stemi 6 stereo microscope. The volume percent of
oxides on the fracture surface were measured.
4.4.4 Scanning electron microscopy (SEM)
Scanning Electron Microscopy was utilized to further analyze the microstructure.
SEM analysis of the tensile bar fracture surfaces and metallography samples were
conducted at UAB. For the BAC 100TM
analysis, a Philips 515 SEM equipped with a
Quantex Super Quantum energy dispersive x-ray detector (EDS) was used. For the Al-
Zn-Mg-Cu analysis an FEI-FEG 650 SEM equipped with an EDAX TEAM SDD 30mm2
energy dispersive x-ray detector (EDS) was used. Secondary and backscattered electron
imaging were used to examine the samples. With EDS analysis, the entrained oxides and
elements present in the intermetallic particles were identified. Projected fracture surface
porosity measurements were also performed on the tensile fracture surfaces.
4.4.5 X-Ray diffraction
X-ray diffraction was used to identify the phases present in the solution treated
and aged Al-Zn-Mg-Cu alloys. XRD was performed using a Siemens D-500
32
Diffractometer with Cu radiation and graphite monochromator on polished specimens.
Scans were performed at 40kV and 30mA between 2θ of 20° and 90°, utilizing a step size
of 0.05° and a dwell time of 60 seconds. The total scan time for each sample was 24
hours.
4.4.6 Differential scanning calorimetery
Differential scanning calorimetery was used to understand the heat treatment
processes. Both solution treatment and aging Differential Scanning Calorimeter (DSC)
tests were conducted on the experimental cast Al-Zn-Mg-Cu alloys. The DSC used was a
TA Instruments DSC Q100. The method for the solution treating study was to heat the
sample from room temperature at 20ºC/min (36°F/min) to 500ºC (932°F) then cool back
to room temperature at the same rate. For the aging study, samples were solution treated
and then heated at a rate of 5ºC/min (9°F/min) to 200ºC (392°F). Sample size for DSC
was dictated by the DSC equipment capacity and was less than 3.5mm diameter and 2mm
in length. The results were analyzed using TA Instruments Universal Analysis 2000
program. Points of inflection, peak positions, and area under the peaks were all
determined.

33
5. BAC 100TM
: A NEW HIGH STRENGTH, HIGH TOUGHNESS, CAST
ALUMINUM ALLOY
by
EDWARD DRUSCHITZ, ROBIN FOLEY, JOHN GRIFFIN, AND ALAN
DRUSCHITZ
In preparation for AFS Transaction
Format adapted for dissertation
34
Abstract
The purpose of this research was to determine the range in properties that can be
achieved in BAC 100TM
(Al-Cu micro-alloyed with Ag, Mn, Zr, and V) and generate
sufficient property data for design purposes. Tensile, stress corrosion cracking, and
fatigue testing were all performed. BAC 100TM
castings were solidified conventionally
and under 1MPa (10atm) pressure to aid in the reduction of porosity associated with long
freezing range alloys. All samples were also HIPed. CuAl2 and an Al-Cu-Fe-Mn
intermetallic were identified as the ductility limiting flaws. A solution treatment of 75
hours or longer was needed to dissolve most of the intermetallic CuAl2. These results
indicate that copper concentrations in BAC 100TM
should be minimized within
specification to increase ductility by reducing the copper available for intermetallic
formation.
Keywords: cast high strength aluminum alloy, tensile properties, fatigue properties, stress
corrosion cracking.

35
Introduction
The need for high strength, lightweight, economical castings grows as the push
for more fuel efficient, crash-worthy vehicles increases. Lightweight materials are
promising, but they are typically more expensive and have lower strength and stiffness
than their higher density alternatives (iron and steel). Medium strength cast aluminum is
widely used in automotive safety-critical applications, such as brake calipers, steering
knuckles and lower control arms in addition to aerospace applications. High strength cast
aluminum alloys are of interest because they offer the design flexibility of castings,
which include hollow features and the minimization of secondary operations.
The most commonly used high-strength cast aluminum alloys are A206, an Al-Cu
alloy, and 201, an Al-Cu-Ag alloy. BAC 100TM
is a new, micro-alloyed, high strength,
aluminum-copper alloy1. It is similar to A206 with higher copper concentration and the
addition of zirconium, vanadium, and silver. Further work is needed to increase the
strength and ductility of BAC 100TM
. The nominal chemistry ranges and typical tensile
properties for 201 and A 206 are listed in Tables 1 and 2 [1-6].
Strength and elongation are a function of alloying and age-hardening. Al-Cu
alloys such as A206, 201, and BAC 100TM
typically contain 4-6% Cu, as shown in Table
1. Copper increases strength and hardness but decreases elongation. Strength is
increased by both solid solution strengthening and precipitation hardening. Maximum
strength is dependent upon both copper and other constituents [6; 143]. Natural aging of
these alloys at room temperature results in both an increase in strength and ductility while
artificial aging increases strength but typically lowers ductility [6; 143]. Age hardening
of Al-Cu alloys begins with a super saturated aluminum matrix (α-SS). The first
36
precipitate to form is Guinier-Preston zones that are enriched with solute (GP-1). Next,
GP-2 zones (θ”) form followed by the incoherent tetragonal structure (θ’ phase) and
finally θ phase (CuAl2) [4; 143].
Alloying can increase mechanical properties. Alloys may be added to increase
strength, elongation, and stress corrosion cracking. Magnesium is added to Al-Cu alloys
to increase strength after solution treatment and quenching. Manganese additions
increase strength by dispersoid strengthening and improve the resistance to stress
corrosion cracking. However, manganese may contribute to intermetallic formation and
reduced ductility [6; 228]. Titanium, vanadium and zirconium result in grain refinement
and increased strength. Silver increases strength and stress corrosion cracking resistance.
The purpose of this research was to improve the properties BAC 100TM
. Tensile,
stress corrosion cracking and fatigue testing were all performed.
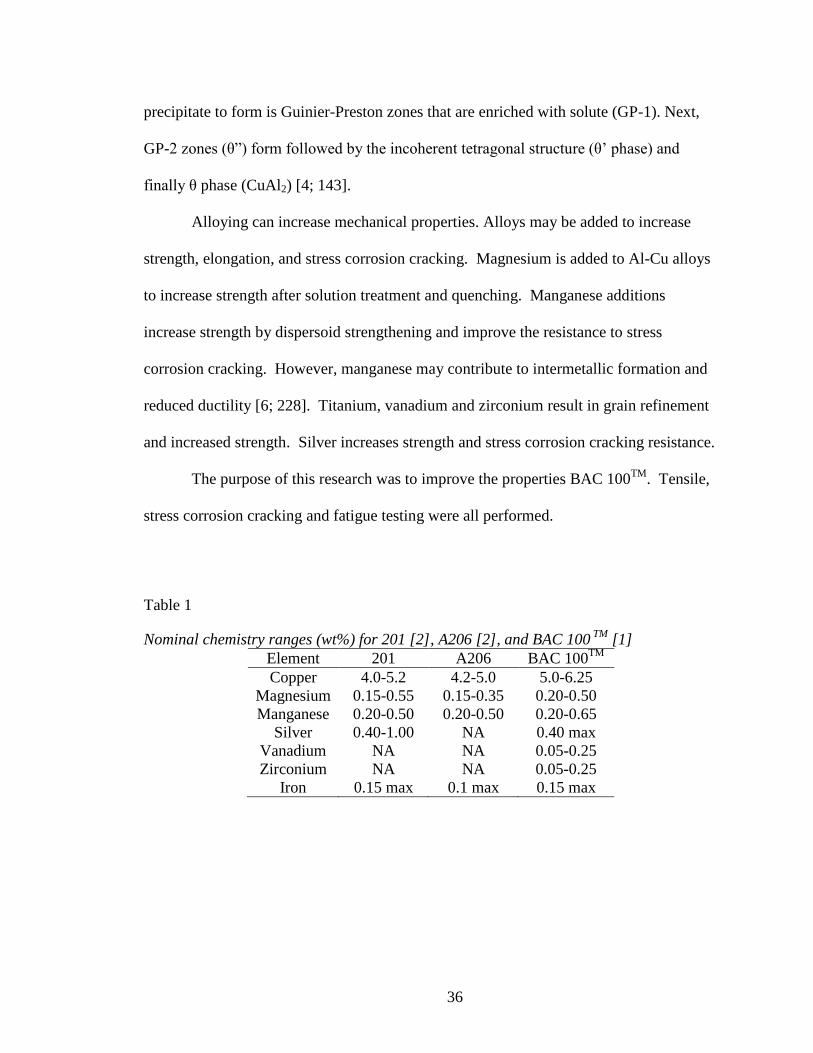
Table 1
Nominal chemistry ranges (wt%) for 201 [2], A206 [2], and BAC 100 TM
[1]
Element 201 A206 BAC 100TM
Copper 4.0-5.2 4.2-5.0 5.0-6.25
Magnesium 0.15-0.55 0.15-0.35 0.20-0.50
Manganese 0.20-0.50 0.20-0.50 0.20-0.65
Silver 0.40-1.00 NA 0.40 max
Vanadium NA NA 0.05-0.25
Zirconium NA NA 0.05-0.25
Iron 0.15 max 0.1 max 0.15 max
37
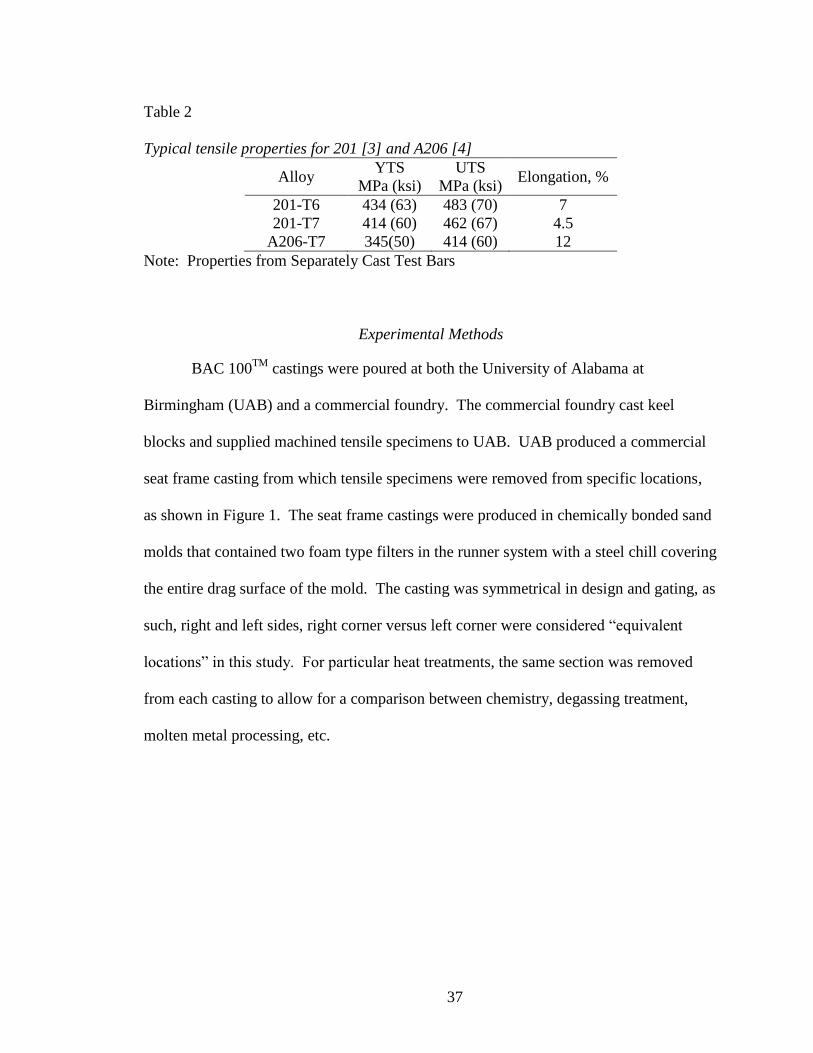
Table 2
Typical tensile properties for 201 [3] and A206 [4]
Alloy YTS
MPa (ksi)
UTS
MPa (ksi) Elongation, %
201-T6 434 (63) 483 (70) 7
201-T7 414 (60) 462 (67) 4.5
A206-T7 345(50) 414 (60) 12
Note: Properties from Separately Cast Test Bars
Experimental Methods
BAC 100TM
castings were poured at both the University of Alabama at
Birmingham (UAB) and a commercial foundry. The commercial foundry cast keel
blocks and supplied machined tensile specimens to UAB. UAB produced a commercial
seat frame casting from which tensile specimens were removed from specific locations,
as shown in Figure 1. The seat frame castings were produced in chemically bonded sand
molds that contained two foam type filters in the runner system with a steel chill covering
the entire drag surface of the mold. The casting was symmetrical in design and gating, as
such, right and left sides, right corner versus left corner were considered “equivalent
locations” in this study. For particular heat treatments, the same section was removed
from each casting to allow for a comparison between chemistry, degassing treatment,
molten metal processing, etc.
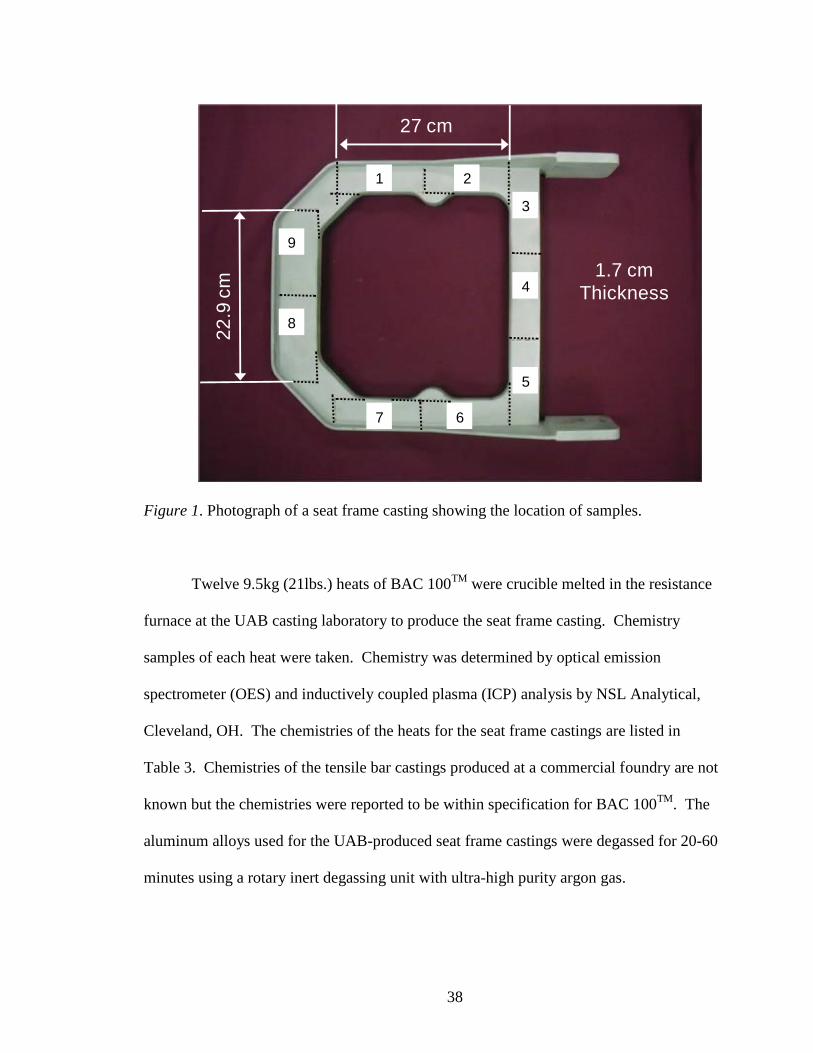
38
Figure 1. Photograph of a seat frame casting showing the location of samples.
Twelve 9.5kg (21lbs.) heats of BAC 100TM
were crucible melted in the resistance
furnace at the UAB casting laboratory to produce the seat frame casting. Chemistry
samples of each heat were taken. Chemistry was determined by optical emission
spectrometer (OES) and inductively coupled plasma (ICP) analysis by NSL Analytical,
Cleveland, OH. The chemistries of the heats for the seat frame castings are listed in
Table 3. Chemistries of the tensile bar castings produced at a commercial foundry are not
known but the chemistries were reported to be within specification for BAC 100TM
. The
aluminum alloys used for the UAB-produced seat frame castings were degassed for 20-60
minutes using a rotary inert degassing unit with ultra-high purity argon gas.
1 2
3
4
5
67
8
9
27 cm
22
.9 c
m
1.7 cm
Thickness

39
Table 3
Chemistries for BAC 100 TM
heats produced at UAB (values in wt%)
HEAT
ID Cu Mg Mn V Zr Ag Ti Fe
A 5.57 0.23 0.30 0.11 0.18 0.19 0.05 0.11
B 5.60 0.25 0.30 0.11 0.23 0.23 0.05 0.11
C 5.57 0.32 0.42 0.11 0.18 0.28 0.05 0.11
D 5.46 0.27 0.29 0.10 0.16 0.17 0.04 0.11
E 5.39 0.42 0.29 0.11 0.18 0.19 0.05 0.11
F 5.55 0.25 0.24 0.09 0.15 0.15 0.04 0.10
G 5.79 0.29 0.31 0.11 0.18 0.24 0.05 0.11
H 5.74 0.37 0.30 0.10 0.21 0.24 0.04 0.11
Both the UAB seat frame castings and the commercially produced tensile bar
castings were HIPed. HIPing was conducted at Bodycote by heating to 510-523°C at
103MPa (950-974°F at 15ksi) for two to four hours in inert gas.
Samples were heat treated at UAB in an air circulating furnace with a
thermocouple attached to the samples to accurately control specimen temperature. The
heat treatment was solution treating at 510-515°C (950-960°F) for two hours to reduce
segregation and avoid partial melting followed by heating to 530-535°C (986-995°F) and
holding for 15-24 hours. After solution treatment, the samples were quenched in warm
water. Two artificial aging treatments were investigated. To produce “high strength”
material, artificial aging was performed at 163°C (325°F) for 36 hours and to produce
“high toughness” material, artificial aging was performed at 163°C (325°F) for 12 hours.
Tensile bars that were 9mm diameter x 36mm gage length were tested in
accordance with ASTM E8/B557 (2011, 2010) on an MTS 810 servo hydraulic tension /
compression tester using an extensometer [7 and 8].
Direct tension stress corrosion cracking tests were performed at Westmoreland
Mechanical Testing and Research Inc. on both high strength and high toughness samples.

40
Most of the tests were performed on samples removed from the seat frame casting
produced at UAB, and a few were done on the test samples casting produced at a
commercial foundry. Testing was performed in accordance with ASTM G49-85 (2011)
[9]. In accordance with ASTM G44-99 (2005) and ASTM G47-98 (2011), the goal for a
material undergoing direct tension stress corrosion testing would be 20 days, as that is
indicative of one lifetime of service [10 and 11]. As such, different stress levels were
tested to determine at what level the materials would pass the 20 day minimum. The test
specimens were 0.32cm (0.125in) in diameter. High toughness samples were tested at
170MPa (25ksi), 200MPa (29ksi), 234MPa (34ksi), and 260MPa (38ksi) while high
strength samples were tested at 240MPa (35ksi) and 280MPa (41ksi).
Fatigue testing, in accordance with ASTM 466-07 (2007) [12], was performed by
Westmoreland Mechanical Testing and Research, Inc. on high toughness material
sectioned from seat frame castings. The tests were performed at room temperature on
servo-hydraulic fatigue machines employing a 30 hertz sinusoidal waveform. The R-
ratio was 0.10 and run-out was defined as 1,000,000 cycles. Samples were tested at
210MPa (30ksi), 290MPa (42ksi), and 340MPa (50ksi). The goals were >1,000,000
cycles at 207MPa (30ksi), >100,000 cycles at 290MPa (42ksi), and >10,000 cycles at
345MPa (50ksi). Test goals for the material were chosen by the sponsors of this project
in accordance with the future goals and usage of this material. The main goal was to
achieve a material / heat treatment combination with a fatigue life equal to or greater than
6061-T6 at 241MPa (35ksi) with 200,000 cycles [13].
Metallography specimens were prepared using standard metallographic
techniques. Samples were removed from just below the tensile fracture surfaces. Optical
41
microscopy was performed on each sample, images taken at 500X magnification, and the
volume percent of intermetallic phases measured on representative samples. Fifty 500X
images were recorded from each sample and the volume percent and size of the
intermetallic phases was measured using Image Pro PlusTM
image analysis software.
Color thresholding was used to identify the intermetallic particles and record size, shape,
length, and count [14].
Scanning Electron Microscopy (SEM) analysis of the samples was conducted.
SEM analysis of tensile bar fracture surfaces and metallography samples was conducted
at UAB using a Phillips 515 SEM equipped with a Quantex Super Quanta energy
dispersive x-ray detector (EDS). Secondary and backscattered electron imaging were
used to examine the fracture surfaces. EDS analysis allowed the determination of the
elements present in the intermetallic particles and identification of entrained oxides.
After a preliminary study, microstructural analysis indicated that intermetallics
were reducing the ductility of the BAC 100TM
samples. Therefore, a solution treatment
study was conducted to determine the appropriate time-at-temperature to minimize the
total amount of intermetallics. A two-part heat treatment was used. The first part
consisted of 516°C (960°F) for three hours followed by 529°C (985°F) for 25-100 hours.
The effect of solution time on intermetallic dissolution was measured using
microstructural analysis. Fifty 500X images were recorded from each sample and the
volume percent and size of the intermetallic phases was measured using Image Pro
PlusTM
image analysis software [14].

42
Results and Discussion
Tensile Properties
Mechanical properties were determined for cast BAC 100TM
. Tensile properties
for the HIPed, high strength, seat frame castings produced at UAB had the highest overall
strength but lowest overall strain to failure, as shown in Table 4. The average 0.2%
offset yield strength was 392MPa (57ksi), the average ultimate strength was 429MPa
(62ksi), and the average strain to failure was 2.6%. The yield and ultimate strength
exceeded the values for A206-T7 measured on separately cast test bars, while the strain
to failure was significantly lower. The strain to failure also varied widely in these
samples (0.82 to 5%) with a standard deviation of 1.09%.
Additional mechanical properties were determined for cast BAC 100TM
with a
different heat treatment. Tensile properties for the HIPed, high toughness, seat frame
castings produced at UAB had lower strength but a higher average strain to failure, as
shown in Table 5. The average yield strength of the high toughness castings was
332MPa (48ksi), the average ultimate strength was 394MPa (57ksi), and the strain to
failure was higher than the high strength castings, with an average value of 3.4% (ranged
from 0.8 to 7.6%). The average strength levels were slightly below those of A206-T7
measured on separately cast test bars, while the strain to failure was lower. The strain to
failure in the high toughness seat frame castings was higher than in the high strength, but
there was still a very wide range in ductility.
Mechanical properties were also determined for BAC 100TM
samples cast at a
commercial foundry. Tensile properties for the HIPed, high toughness separately cast
tensile bar castings produced at a commercial foundry had the highest average strain to
43
failure with an ultimate strength higher than that of high toughness castings produced at
UAB, as shown in Table 6. The average yield strength was 301MPa (44ksi), the average
ultimate strength was 407MPa (59ksi), and the average strain to failure was 6.4% (ranged
from 4.1 to 9.3%). The yield and ultimate strength were lower than was seen in the high
toughness, seat frame castings while the strain to failure was higher. The range in the
strain to failure was also significantly reduced in the separately cast tensile bar castings.

44
Table 4
Tensile properties for high strength seat frame castings produced at UAB,
HIPed at Bodycote and heat treated at UAB
Cu
(wt%)
Mg
(wt%)
Ag
(wt%) Location
0.2%
Yield
Strength
MPa (ksi)
UTS
MPa
(ksi)
Strain at
Failure
(%)
5.57 0.23 0.19
L8 373 (54) 442 (64) 5.02
L8 379 (55) 429 (62) 3.33
L8 366 (53) 409 (59) 2.57
L9 356 (52) 421 (61) 3.96
L9 376 (55) 435 (63) 4.31
L9 359 (52) 427 (62) 4.82
5.55 0.25 0.15
L9 413 (60) 443 (64) 2.45
L9 380 (55) 431 (62) 2.47
L9 394 (57) 416 (60) 1.60
L8 403 (58) 434 (63) 2.55
5.79 0.29 0.24
L3 410 (59) 418 (61) 0.82
L8 411 (60) 460 (67) 3.62
L9 407 (59) 442 (64) 2.14
5.60 0.25 0.23
L8 394 (57) 446 (65) 3.91
L8 377 (55) 415 (60) 2.23
L9 404 (59) 443 (64) 2.74
5.57 0.32 0.28
L8 422 (61) 452 (66) 2.12
L8 426 (62) 439 (64) 1.16
L8 419 (61) 438 (64) 1.40
L9 416 (60) 459 (67) 3.20
L9 424 (61) 449 (65) 1.77
5.46 0.27 0.17
L8 368 (53) 409 (59) 2.99
L8 374 (54) 413 (60) 2.59
L8 364 (53) 389 (56) 1.53
L9 373 (54) 415 (60) 2.45
L9 389 (56) 408 (59) 1.44
L9 377 (55) 412 (60) 2.40
5.39 0.42 0.19
L3 407 (59) 445 (64) 2.65
L8 410 (59) 452 (66) 3.25
L9 386 (56) 387 (56) 0.82
Average 392 (57) 429 (62) 2.61
Stdev 21 (3) 19 (3) 1.09

45
Table 5
Tensile properties for high toughness seat frame castings produced at UAB,
HIPed at Bodycote and heat treated at UAB
Cu
(wt%)
Mg
(wt%)
Ag
(wt%) Location
0.2%
Yield
Strength
MPa (ksi)
UTS
MPa
(ksi)
Strain at
Failure
(%)
5.57 0.23 0.19
L1 333 (48) 418 (61) 4.1
L1 316 (46) 406 (59) 5.2
L7 309 (45) 381 (55) 3.3
5.55 0.25 0.15
L1 328 (48) 365 (53) 1.6
L1 304 (44) 372 (54) 3.7
L7 327 (47) 371 (54) 2.0
L1 325 (47) 362 (53) 1.4
L1 324 (47) 369 (54) 2.0
L2 334 (48) 422 (61) 5.7
L7 336 (49) 390 (57) 2.9
5.79 0.29 0.24
L1 346 (50) 388 (56) 1.6
L1 336 (49) 418 (61) 5.0
L6 351 (51) 392 (57) 1.4
L7 336 (49) 384 (56) 2.2
5.74 0.37 0.24 L2 359 (52) 406 (59) 2.7
5.60 0.25 0.23 L1 317 (46) 400 (58) 4.3
L7 324 (47) 387 (56) 3.2
5.57 0.32 0.28
L1 348 (50) 348 (50) 0.7
L1 338 (49) 397 (58) 2.8
L2 346 (50) 401 (58) 2.6
L6 337 (49) 401 (58) 3.3
L7 341 (49) 407 (59) 3.1
5.46 0.27 0.17
L1 330 (48) 394 (57) 2.7
L1 316 (46) 375 (54) 3.2
L7 317 (46) 364 (53) 4.7
5.39 0.42 0.19
L1 345 (50) 444 (64) 6.2
L1 330 (48) 419 (61) 5.5
L2 336 (49) 443 (64) 7.6
L7 339 (49) 416 (60) 4.3
Average 332 (48) 394 (57) 3.4
Stdev 13 (2) 24 (3) 1.6

46
Table 6
Tensile properties for high toughness separately cast tensile bar produced at a
commercial foundry, HIPed at Bodycote and heat treated at UAB
Sample
Location
0.2%
Yield
Strength
MPa (ksi)
UTS
MPa
(ksi)
Strain at
Failure
(%)
Heat 1
301 (44) 421 (61) 7.7
297 (43) 392 (57) 4.5
303 (44) 385 (56) 4.1
302 (44) 400 (58) 4.9
Heat 2
299 (43) 387 (56) 4.5
312 (45) 411 (60) 5.5
314 (46) 441 (64) 9.3
293 (43) 405 (59) 6.4
Heat 3 301 (44) 407 (59) 5.7
295 (43) 388 (56) 4.3
Heat 4 297 (43) 406 (59) 6.7
291 (42) 416 (60) 7.8
Heat 5 296 (43) 417 (60) 8.8
304 (44) 419 (60) 8.9
Average 300 (44) 407 (59) 6.4
Stdev 7 (1) 16 (2) 1.9
Mechanical properties varied depending on heat treament and where the samples
were cast. The seperately cast and HIPed tensile bars from a commercial foundry had the
best overall properties. The tensile properties included a yield strength of 300MPa
(44ksi), UTS of 407MPa (59ksi), and an average strain to failure of 6.4%. These tensile
bars also had the lowest standard deviation for both yield and ultimate strength. The
strain to failure standard deviation was similar to that of the other two data sets.
BAC 100TM
mechanical properties compared well to 201-T6. When compared to
201-T6, 201-T7, and A206-T7, BAC 100TM
was close in strength but low in strain to
failure / elongation [3 and 4]. The elongation of the commercially cast and HIPed tensile
samples had better overall elongation than 201-T7, 6.4 compared to 4.5% but were lower
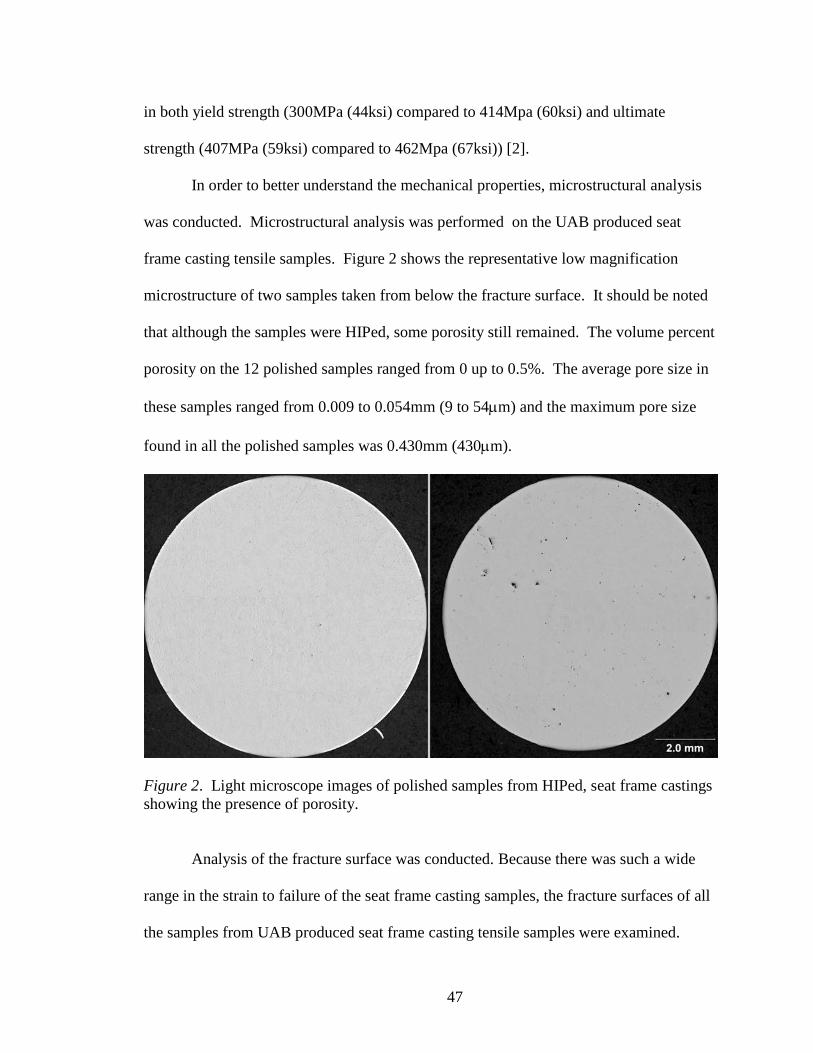
47
in both yield strength (300MPa (44ksi) compared to 414Mpa (60ksi) and ultimate
strength (407MPa (59ksi) compared to 462Mpa (67ksi)) [2].
In order to better understand the mechanical properties, microstructural analysis
was conducted. Microstructural analysis was performed on the UAB produced seat
frame casting tensile samples. Figure 2 shows the representative low magnification
microstructure of two samples taken from below the fracture surface. It should be noted
that although the samples were HIPed, some porosity still remained. The volume percent
porosity on the 12 polished samples ranged from 0 up to 0.5%. The average pore size in
these samples ranged from 0.009 to 0.054mm (9 to 54m) and the maximum pore size
found in all the polished samples was 0.430mm (430m).
Figure 2. Light microscope images of polished samples from HIPed, seat frame castings
showing the presence of porosity.
Analysis of the fracture surface was conducted. Because there was such a wide
range in the strain to failure of the seat frame casting samples, the fracture surfaces of all
the samples from UAB produced seat frame casting tensile samples were examined.

48
Appromately 50% of the tensile fracture surfaces had visible defects on the surface.
Porosity measurements performed on a polished sample tend to underestimate the effect
of dispersed porosity on tensile elongation because the fracture preferentially follows the
flaws in the sample. An SEM image of a tensile fracture surface containing a typical
defect is shown in Figure 3. The left image is a secondary electron image (topographic
contrast) while the right image is a backscatter electron image (compositional contrast).
Note the large defect on the fracture surface; closer examination of this defect showed
that it was oxidized shrinkage porosity, as shown in Figure 4. Dispersed porosity would
be expected to both reduce the ductility and increase the variability in the measured
ductility of the samples so these defects may explain the wide variation in the strain to
failure seen in the UAB seat frames as compared to the commercial keel block castings.
(a) (b)
Figure 3. SEM images of UAB produced seat frame tensile fracture showing oxidized
shrinkage porosity on the surface. (a) - Secondary electron image (topographic contrast).
(b) - Backscatter electron image (compositional contrast).
Shrink / oxide –
3.3% of fracture
surface
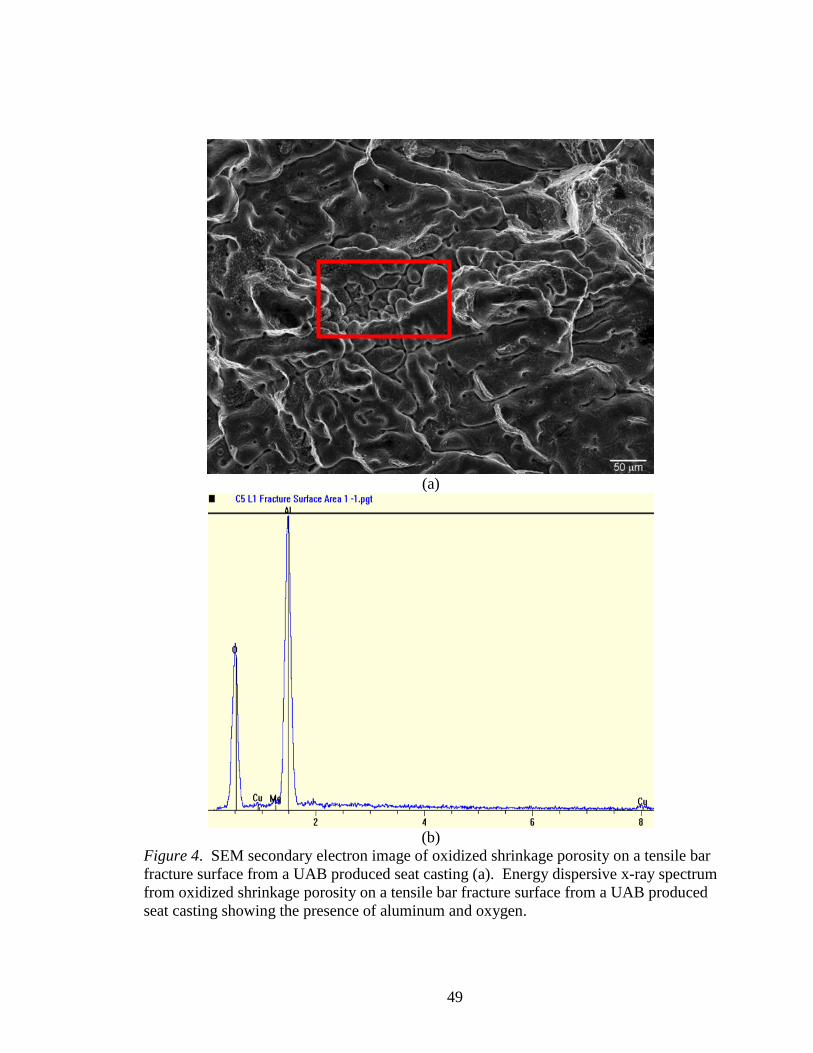
49
(a)
(b)
Figure 4. SEM secondary electron image of oxidized shrinkage porosity on a tensile bar
fracture surface from a UAB produced seat casting (a). Energy dispersive x-ray spectrum
from oxidized shrinkage porosity on a tensile bar fracture surface from a UAB produced
seat casting showing the presence of aluminum and oxygen.
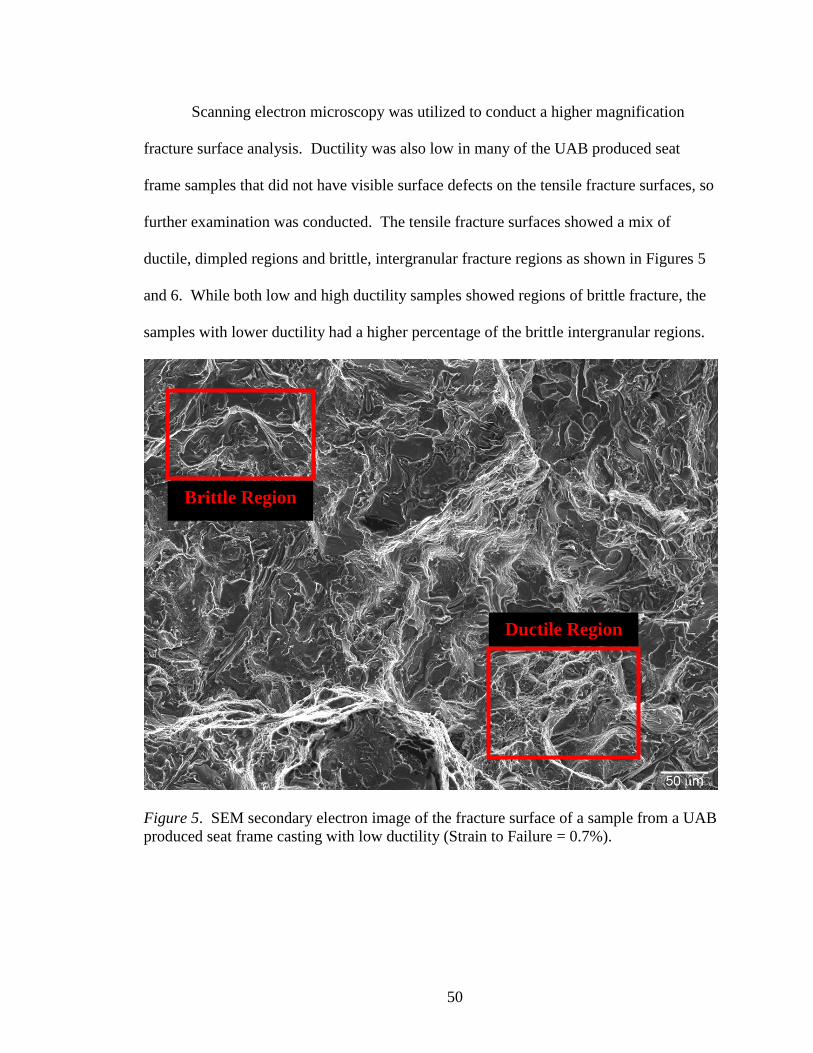
50
Scanning electron microscopy was utilized to conduct a higher magnification
fracture surface analysis. Ductility was also low in many of the UAB produced seat
frame samples that did not have visible surface defects on the tensile fracture surfaces, so
further examination was conducted. The tensile fracture surfaces showed a mix of
ductile, dimpled regions and brittle, intergranular fracture regions as shown in Figures 5
and 6. While both low and high ductility samples showed regions of brittle fracture, the
samples with lower ductility had a higher percentage of the brittle intergranular regions.
Figure 5. SEM secondary electron image of the fracture surface of a sample from a UAB
produced seat frame casting with low ductility (Strain to Failure = 0.7%).
Brittle Region
Ductile Region
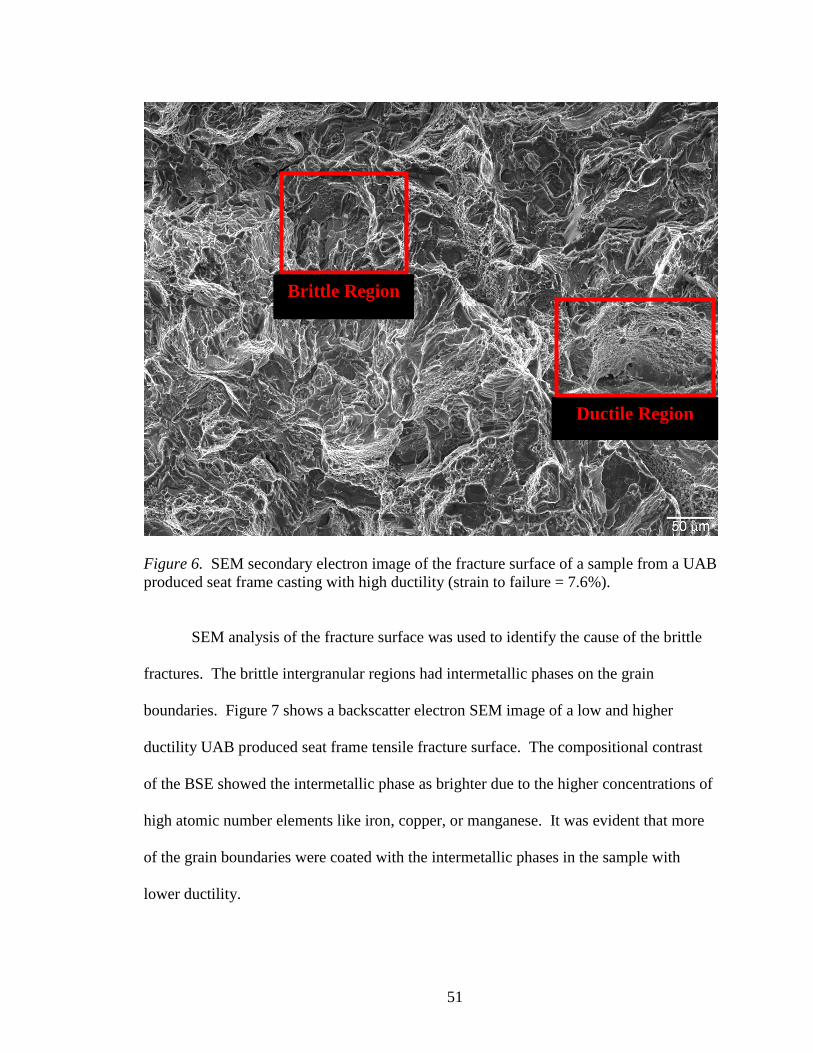
51
Figure 6. SEM secondary electron image of the fracture surface of a sample from a UAB
produced seat frame casting with high ductility (strain to failure = 7.6%).
SEM analysis of the fracture surface was used to identify the cause of the brittle
fractures. The brittle intergranular regions had intermetallic phases on the grain
boundaries. Figure 7 shows a backscatter electron SEM image of a low and higher
ductility UAB produced seat frame tensile fracture surface. The compositional contrast
of the BSE showed the intermetallic phase as brighter due to the higher concentrations of
high atomic number elements like iron, copper, or manganese. It was evident that more
of the grain boundaries were coated with the intermetallic phases in the sample with
lower ductility.
Brittle Region
Ductile Region
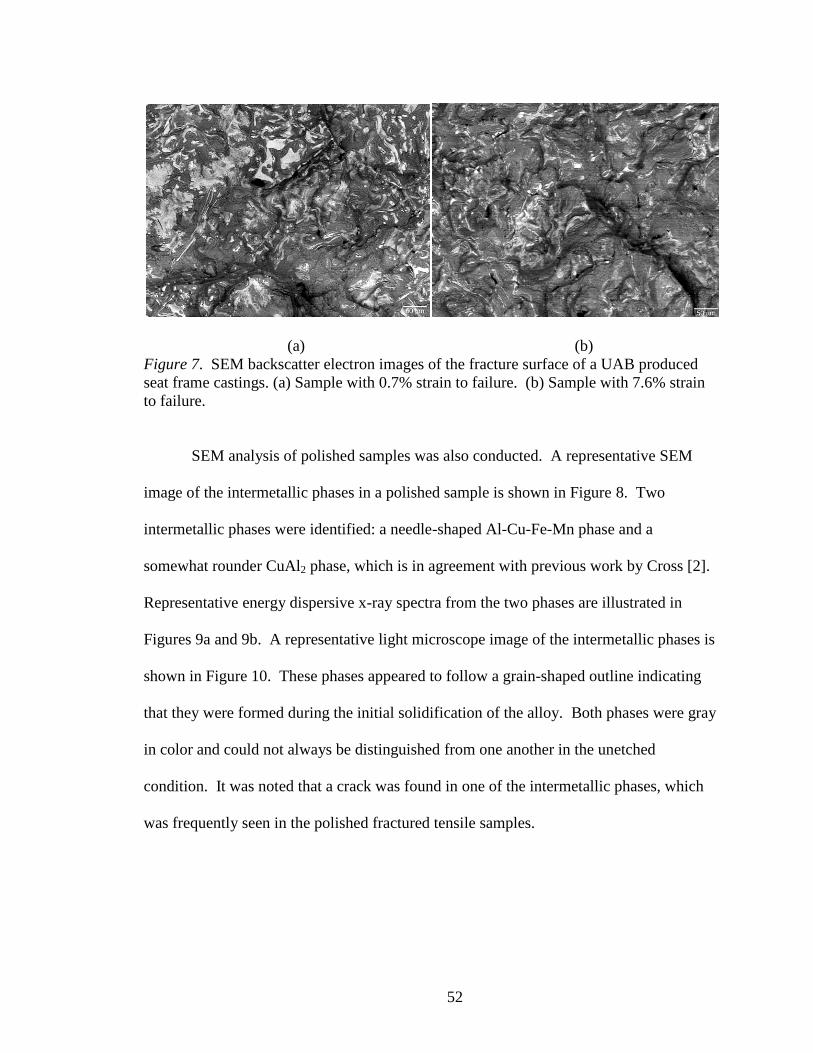
52
(a) (b)
Figure 7. SEM backscatter electron images of the fracture surface of a UAB produced
seat frame castings. (a) Sample with 0.7% strain to failure. (b) Sample with 7.6% strain
to failure.
SEM analysis of polished samples was also conducted. A representative SEM
image of the intermetallic phases in a polished sample is shown in Figure 8. Two
intermetallic phases were identified: a needle-shaped Al-Cu-Fe-Mn phase and a
somewhat rounder CuAl2 phase, which is in agreement with previous work by Cross [2].
Representative energy dispersive x-ray spectra from the two phases are illustrated in
Figures 9a and 9b. A representative light microscope image of the intermetallic phases is
shown in Figure 10. These phases appeared to follow a grain-shaped outline indicating
that they were formed during the initial solidification of the alloy. Both phases were gray
in color and could not always be distinguished from one another in the unetched
condition. It was noted that a crack was found in one of the intermetallic phases, which
was frequently seen in the polished fractured tensile samples.

53
Figure 8. Representative SEM secondary electron image showing intermetallic phases in
a polished sample from a UAB produced seat frame casting.
CuAl2
Al-Cu-Fe-Mn Intermetallic

54
(a)
(b)
Figure 9. Energy dispersive x-ray spectrum from a UAB produced seat frame casting for
(a) globular intermetallic particle (CuAl2) and (b) needle shaped intermetallic (Al-Cu-Fe-
Mn).

55
Figure 10. Light microscope image of intermetallic phases in UAB produced seat frame
castings.
Optical and SEM microscopy aided in the understanding of the brittle fracture
undergone by BAC 100TM
. The results indicate that the variability and low values of
ductility in the BAC 100TM
castings seat frame castings without tensile surface defects
was primarily due to the formation of brittle intermetallic phases during the solidification
of the alloys. Graphs of the strain to failure versus volume percent intermetallic and
intermetallic phase size are shown in Figures 11a and 11b. The strain to failure increased
with decreasing intermetallic amount and size. There was no correlation between the
fracture surface porosity and the volume percent porosity with the ductility of these
samples.
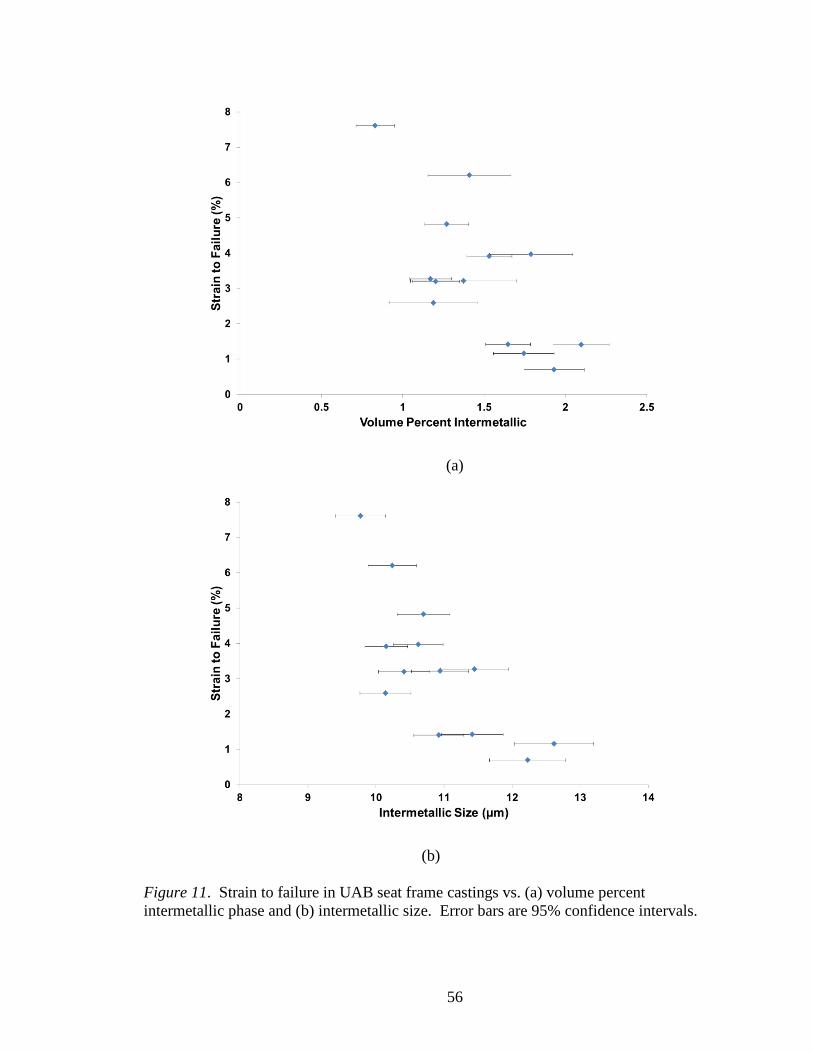
56
(a)
(b)
Figure 11. Strain to failure in UAB seat frame castings vs. (a) volume percent
intermetallic phase and (b) intermetallic size. Error bars are 95% confidence intervals.

57
Direct tension stress corrosion cracking tests
Direct tension stress corrosion cracking tests were utilized to understand how BAC
100TM
would respond to different environmental conditions typical of military vehicles.
Results of the direct tension stress corrosion cracking (SCC) tests are shown in Table 7.
None of the high strength samples passed the stress corrosion tests (survived 20 days) and
the test duration varied widely at each stress level. In the high toughness samples, at least
one of the tests performed at each stress level passed the SCC test but the test duration
did not increase with increasing applied stress. The results also varied widely in the high
toughness samples. In both the high strength and low toughness samples, the test
duration varied widely from one to 20 days. The wide range in SCC test duration may be
associated with the wide range in ductility (tensile strain to failure) seen in these samples.
Samples with low ductility may have lower SCC durations. A206 and A201in the T6
condition did not pass the ASTM specs for direct tension stress corrosion cracking,
however, they did pass in the T4 temper. Similarly, the high strength heat treatment of
BAC 100TM
did not result in a material that could pass the 20 day test goal. However,
after the “high toughness” heat treatment some samples of BAC 100TM
were able to pass
the 20 day goal set for this experiment.

58
Table 7
Results of direct stress corrosion cracking tests
Heat
Treatment
Stress
MPa (ksi)
Test Duration
(days)
High
Toughness
170 (25)
20
7
1
200 (29)
20
1
20
234 (34)
1
1
20
260 (38)
1
3
20
High
Strength
240 (35)
5
15
5
280 (41)
2
1
15
Fatigue testing
Fatigue testing of BAC 100TM
was conducted to aid in the design criteria for
components made of this alloy. The fatigue properties of the high toughness material
were excellent, as shown in Table 8. Samples tested at 210MPa (30ksi) (63% of the
average yield for the high toughness seat frame castings) resulted in two run outs at one
million cycles and one early failure at a defect in the test bar radius at 258,014 cycles.
All of the samples tested at 290MPa (42ksi) (87% of yield) exceeded the goal of
>100,000 cycles to failure. At this stress, there were two run-outs at one million cycles
and one failure at a defect in the test bar gage at 173,873 cycles. At 340MPa (50ksi)
(102% of yield), both samples tested exceeded the goal of >10,000 cycles to failure.
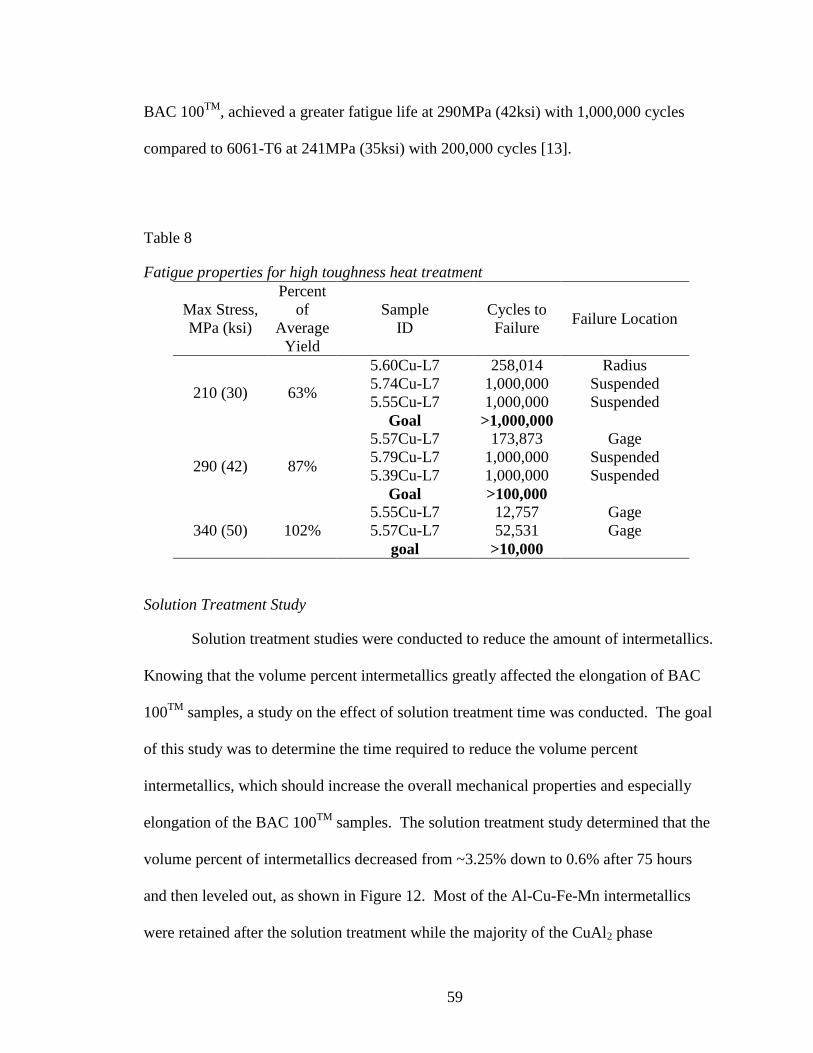
59
BAC 100TM
, achieved a greater fatigue life at 290MPa (42ksi) with 1,000,000 cycles
compared to 6061-T6 at 241MPa (35ksi) with 200,000 cycles [13].
Table 8
Fatigue properties for high toughness heat treatment
Max Stress,
MPa (ksi)
Percent
of
Average
Yield
Sample
ID
Cycles to
Failure Failure Location
210 (30) 63%
5.60Cu-L7 258,014 Radius
5.74Cu-L7 1,000,000 Suspended
5.55Cu-L7 1,000,000 Suspended
Goal >1,000,000
290 (42) 87%
5.57Cu-L7 173,873 Gage
5.79Cu-L7 1,000,000 Suspended
5.39Cu-L7 1,000,000 Suspended
Goal >100,000
340 (50) 102%
5.55Cu-L7 12,757 Gage
5.57Cu-L7 52,531 Gage
goal >10,000
Solution Treatment Study
Solution treatment studies were conducted to reduce the amount of intermetallics.
Knowing that the volume percent intermetallics greatly affected the elongation of BAC
100TM
samples, a study on the effect of solution treatment time was conducted. The goal
of this study was to determine the time required to reduce the volume percent
intermetallics, which should increase the overall mechanical properties and especially
elongation of the BAC 100TM
samples. The solution treatment study determined that the
volume percent of intermetallics decreased from ~3.25% down to 0.6% after 75 hours
and then leveled out, as shown in Figure 12. Most of the Al-Cu-Fe-Mn intermetallics
were retained after the solution treatment while the majority of the CuAl2 phase
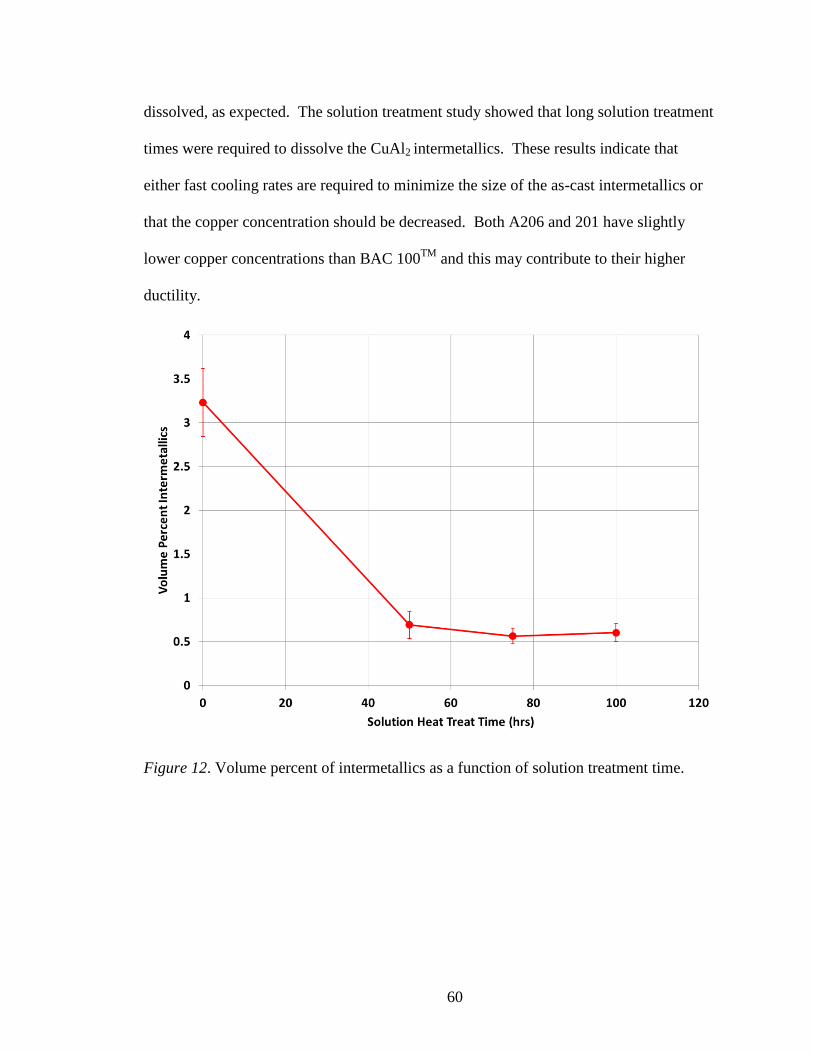
60
dissolved, as expected. The solution treatment study showed that long solution treatment
times were required to dissolve the CuAl2 intermetallics. These results indicate that
either fast cooling rates are required to minimize the size of the as-cast intermetallics or
that the copper concentration should be decreased. Both A206 and 201 have slightly
lower copper concentrations than BAC 100TM
and this may contribute to their higher
ductility.
Figure 12. Volume percent of intermetallics as a function of solution treatment time.
61
Summary
An average yield strength of 393MPa (57ksi), a UTS of 429MPa (62ksi), and an
average strain to failure of 2.6% were achieved in the high strength seat frame
castings. The strain to failure varied widely from 0.8 to 5%.
In the high toughness seat frame castings, the average yield strength was 332MPa
(48ksi), ultimate strength was 394MPa (57ksi), and strain to failure was 3.4%.
The strain to failure ranged from 0.8 to 7.6% in the high toughness seat frame
castings.
Tensile properties for high toughness separately cast tensile bar castings produced
at a commercial foundry resulted in an average yield strength of 301MPa (44ksi),
a UTS of 407MPa (59ksi), and a strain to failure of 6.4%. There was less
variation in the strain to failure in these castings which ranged from 4.1 to 9.3%.
The stress corrosion cracking test results varied widely and none of the high
strength castings achieved the goal of 20 days while at least one of each high
toughness sample lasted for the desired 20 day test duration. The wide variation
in ductility seen in the samples may account for the variation in the stress
corrosion cracking results.
Fatigue testing at 87 and 102% of the average yield strength of the high toughness
seat frame castings gave fatigue test durations of greater than 100,000 and 10,000
cycles respectively. Samples tested at 63% of the average yield for the high
toughness seat frame castings resulted in two run outs at one million cycles and
one early failure at a defect in the test bar radius at 258,014 cycles.
62
HIPing did not completely eliminate the porosity in the seat frame samples used
in the tensile, stress corrosion cracking, and fatigue testing. This porosity likely
decreased the resulting properties in the stress corrosion and fatigue samples and
increased the variability in the results.
In samples without visible tensile fracture surface defects, low ductility was
attributed to intermetallic phases that formed during solidification of the castings
and did not dissolve during heat treatment.
o Two different intermetallics were identified, including CuAl2 and an Al-
Cu-Fe-Mn intermetallic.
o Solution treatment times up to 75 hours were necessary to dissolve most of
the intermetallic CuAl2 that formed.
Faster cooling rates or a reduction in copper concentration might increase the
ductility of the alloy by decreasing the size of the intermetallics that form during
solidification.
Acknowledgements
The authors would like to thank Joe Jablonsky, Ricardo Aristizbal, and Grant
Ethridge for their aid in casting and microstructural analysis.
“Research was sponsored by the U.S. Army Contracting Command Joint
Munitions & Lethality Contracting Center, Picatinny, NJ on behalf of Benet Laboratories,
and was accomplished under Cooperative Agreement Number W15QKN-10-2-0001.
The views and conclusions contained in this document are those of the authors and
should not be interpreted as representing the official policies, either expressed or implied,

63
of Benet Laboratories or the U.S. Government. The U.S. Government is authorized to
reproduce and distribute reprints for Government purposes notwithstanding any copyright
notation heron.”
64
REFERENCES
1. Druschitz, Alan. “High strength, high toughness, weldable, ballistic quality, castable
aluminum alloy, heat treatment for same and articles produced from same.” US patent
Application 20070102071. 2007. Print.
2. Cross, Carl. “Improved Ballistic Properties for Welded 2519 Aluminum – Final
Report.” ONR Sponsored Research Project #N00014-00-1-0625. Montana Tech of
the University of Montana. Butte, MT (2003). Print.
3. Montgomery, Jonathan and Chin, Ernest. “Protecting the Future Force: A New
Generation of Metallic Armors Leads the Way.” AMPTIAC Quarterly, Vol. 8, No. 4,
pp. 14-20 (2004). Print
4. Davis, Joseph. ed. ASM Specialty Handbook: Aluminum and Aluminum Alloys.
Materials Park: ASM International. 1993. 706-711. Print.
5. AMS-A-21180A. “Aluminum Alloy Castings, High Strength, Area Meca.”
Warrendale: SAE International. 2005. 23. Print.
6. Hatch, John. ed. Aluminum: Properties and Physical Metallurgy, Metals Park:
American Society for Metals. 1984. 143 and 228. Print.
7. ASTM International. “ASTM E8-04 Standard Test Methods for Tension Testing of
Metallic Materials.” West Conshocken: ASTM International. 2011. Print.
8. ASTM International. “ASTM B557-02 Standard Test Methods of Tension Testing
Wrought and Cast Aluminum and Magnesium Alloy Products.” West
Conshohocken: ASTM International. 2010. Print.
9. ASTM International. “ASTM G49-85 Standard Practice for Preparation and Use of
Direct Tension Stress-Corrosion Test Specimens.” West Conshohocken: ASTM
International. 2000. Print.
10. ASTM International “ASTM G44-99 Standard Practice for Exposure of Metals and
Alloys by Alternate Immersion in Neutral 3.5% Sodium Chloride Solution.” West
Conshohocken: ASTM International. 2005. Print.
11. ASTM International “ASTM G47-98 Standard Test Method for Determining
Susceptibility to Stress-Corrosion Cracking of 2XXX and 7XXX Aluminum Alloy
Products.” West Conshohocken: ASTM International. 2011. Print.
12. ASTM International. “ASTM 466-07 Standard Practice for Conducting Force
Controlled Constant Amplitude Axial Fatigue Tests of Metallic Materials.” West
Conshohocken: ASTM International. 2007. Print.

65
13. Yahr, G.T., “Fatigue Design Curves for 6061-T6 Aluminum,” Oak Ridge National
Lab: Engineering Technology Division, Contract # DE-AC05-840R21400. Oak ridge,
TN (1993). Print.
14. Image-Pro Plus [image analysis software]. Rockville: Media Cybernetics INC. 2012.
66
6. HIGH STRENGTH CAST ALUMINUM: SOLUTION TREATING AND
AGING STUDY
by
EDWARD DRUSCHITZ, ROBIN FOLEY, AND JOHN GRIFFIN
In preparation for AFS Transactions
Format adapted for dissertation

67
Abstract
The wrought Al-Zn-Mg-Cu series alloys are among the highest strength
aluminum alloys. Casting these alloys typically results in two microstructural defects: (1)
intermetallics and (2) microporosity. In this paper, six experimental Al-Zn-Mg-Cu alloys
were cast under 1MPa (10 atmospheres) of pressure. Zinc concentrations of 8 and
12wt% and Zn/Mg ratios of 1.5 to 5.5 were tested. Copper was held constant at 0.9%.
Heat treating of the alloys was optimized for maximum hardness. Experimental Al-Zn-
Mg-Cu samples were solution treated at 441°C (826°F) for four hours before ramping to
460°C (860°F) for 75 hours and then aged at 120°C (248°F) for 75 hours. X-ray
diffraction showed that the age hardening precipitates in most of these alloys was the T
phase (Mg32Zn31.9Al17.1). DSC confirmed that lower alloy contents resulted in easier
intermetallic dissolution during solution treatment and that precipitation began at higher
temperatures during aging.
Keywords: cast high strength aluminum, cast Al-Zn-Mg-Cu, solution treating, and aging.

68
Introduction
The objective of the proposed research was to develop an alloy and process
combination to produce stronger and more ductile lightweight aluminum castings without
the use of expensive alloying elements such as silver and scandium. Understanding the
relationships between chemistry, processing, and microstructure for Al-Zn-Mg-Cu alloys,
is a major step towards improving the viability of producing ultra-high strength
aluminum castings. One specific goal of this research was reducing ductility limiting
flaws including intermetallics and microporosity.
Advanced ultra-high strength aluminum alloys have been studied extensively in
recent years [1-25]. These alloys have had exceptionally high strength but relatively low
ductility. It has been hypothesized that the lack of ductility is a result of two micro-
structural features: (1) an interdendritic network of intermetallic particles and (2)
randomly dispersed micro-porosity. The microstructural features are a result of their
solidification characteristics which include a long solidification range and simultaneous
nucleation throughout the casting. This results in significant segregation of alloying
elements and prevents adequate feeding during solidification.
The Al-Zn-Cu-Mg wrought alloys are the highest strength aluminum alloys. Table
1 shows the tensile properties of two common wrought 7xxx series alloys along with
those of A206 and 201, two common high strength Al-Cu casting alloys [12]. The
strengths of the casting alloys are significantly lower than those of the wrought alloys.
Zinc provides solid solution strengthening. Zinc also increases the solution
potential of other alloying elements in aluminum [13; 238]. By tying up free zinc, the
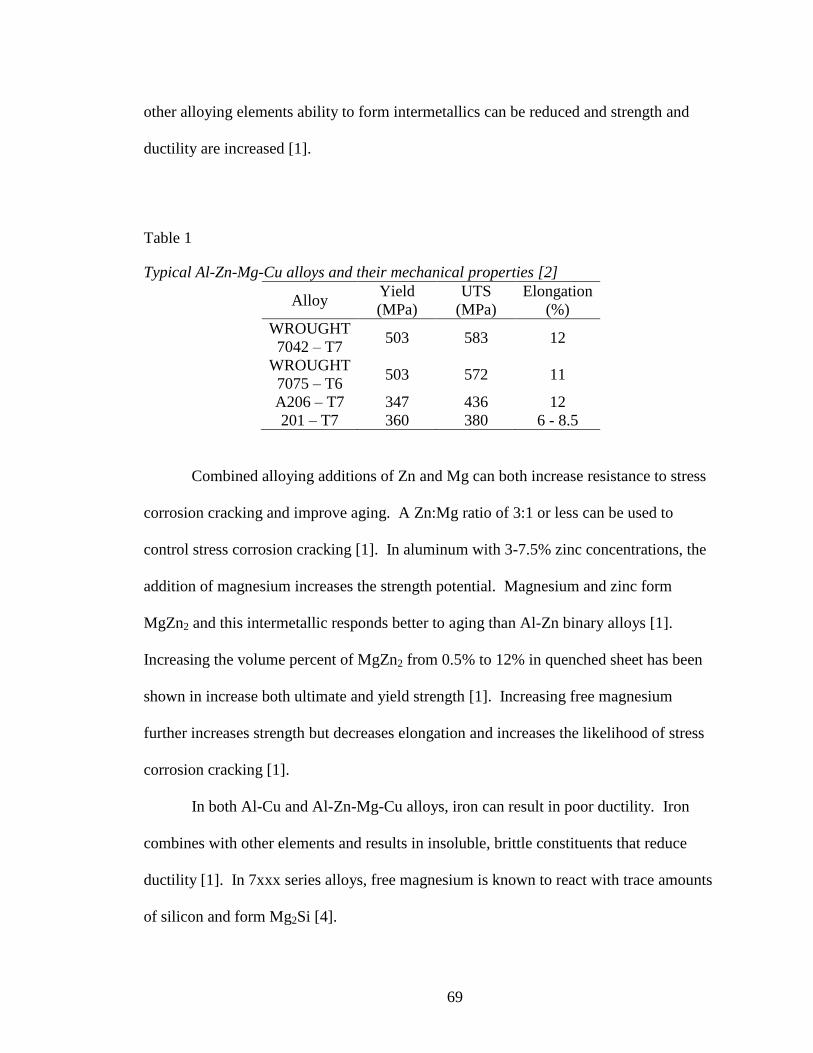
69
other alloying elements ability to form intermetallics can be reduced and strength and
ductility are increased [1].
Table 1
Typical Al-Zn-Mg-Cu alloys and their mechanical properties [2]
Alloy Yield
(MPa)
UTS
(MPa)
Elongation
(%)
WROUGHT
7042 – T7 503 583 12
WROUGHT
7075 – T6 503 572 11
A206 – T7 347 436 12
201 – T7 360 380 6 - 8.5
Combined alloying additions of Zn and Mg can both increase resistance to stress
corrosion cracking and improve aging. A Zn:Mg ratio of 3:1 or less can be used to
control stress corrosion cracking [1]. In aluminum with 3-7.5% zinc concentrations, the
addition of magnesium increases the strength potential. Magnesium and zinc form
MgZn2 and this intermetallic responds better to aging than Al-Zn binary alloys [1].
Increasing the volume percent of MgZn2 from 0.5% to 12% in quenched sheet has been
shown in increase both ultimate and yield strength [1]. Increasing free magnesium
further increases strength but decreases elongation and increases the likelihood of stress
corrosion cracking [1].
In both Al-Cu and Al-Zn-Mg-Cu alloys, iron can result in poor ductility. Iron
combines with other elements and results in insoluble, brittle constituents that reduce
ductility [1]. In 7xxx series alloys, free magnesium is known to react with trace amounts
of silicon and form Mg2Si [4].

70
In Al-Zn-Mg alloys, at low total alloy amounts (~ less than 10wt %), the MgZn2
(η) phase will be present as predicted by most literature. For high alloy contents, T phase
(Mg32(Zn,Al)49) will be present. High zinc and magnesium contents may result in
interconnected intermetallics, which may not dissolve during solution treatment.
Additions of copper to Al-Zn-Mg alloys increase the quench sensitivity but decrease the
resistance to stress corrosion cracking. It is believed that copper also increases the aging
rate by increasing the amount of supersaturation, resulting in the nucleation of CuMgAl21.
Increasing the alloy content increases strength; therefore, finding the practical point of
insolubility will greatly advance our current knowledge base on cast Al-Zn-Mg-Cu
alloys.
Experimental Procedure
Al-Zn-Mg-Cu alloys weighing 9.5kg (21lb) were crucible melted in a resistance
furnace. A master alloy produced at Belmont Metals Inc. containing low iron and copper
(Al-0.9wt% Cu-0.08wt% Fe) was used as the base alloy. From this base alloy, additions
were made to produce the desired chemistry (Table 2). Zinc concentrations of 8 and
12wt% and Zn/Mg ratios of 1.5 to 5.5 were tested. Copper was held constant at 0.9% to
minimize copper related intermetallics while gaining stress corrosion cracking resistance
and increased strength.
Each heat was degassed for between 20-60 minutes with argon rotary degassing.
A reduced pressure test sample was taken after degassing for each heat and checked to
ensure proper degassing. Grain refinement additions of 0.02wt% Ti were added. Copper
chilled chemistry samples were taken for each heat. Chemistry was determined by
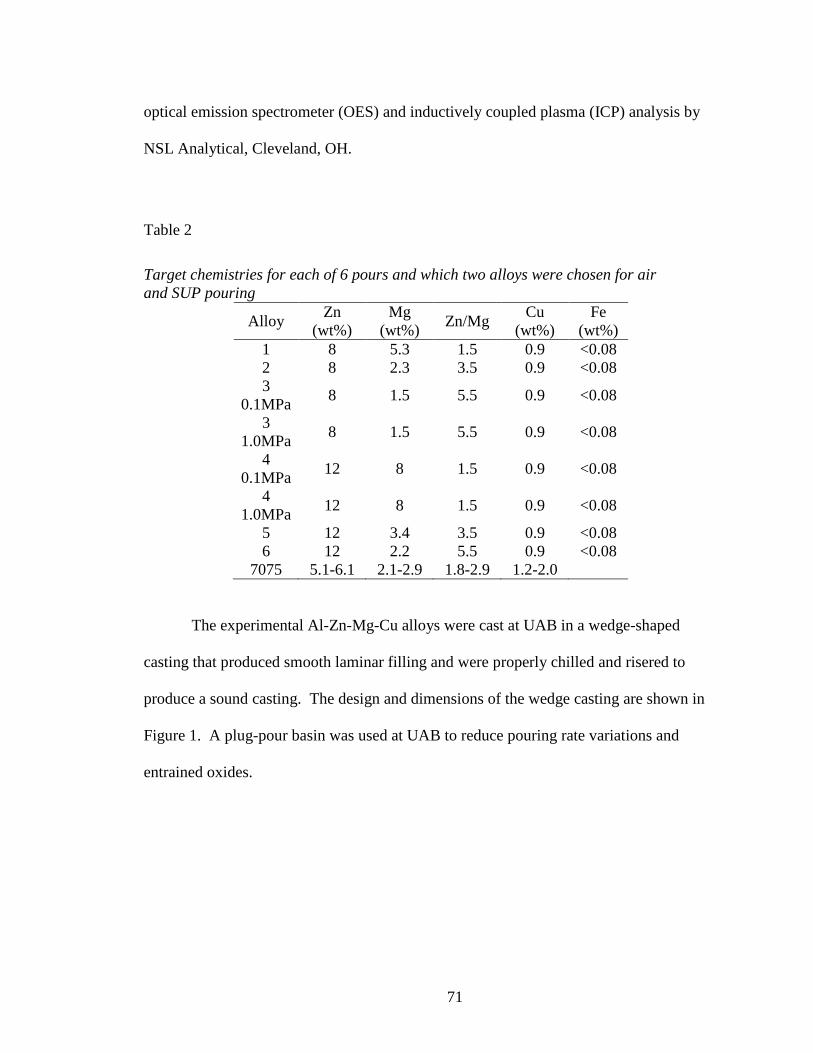
71
optical emission spectrometer (OES) and inductively coupled plasma (ICP) analysis by
NSL Analytical, Cleveland, OH.
Table 2
Target chemistries for each of 6 pours and which two alloys were chosen for air
and SUP pouring
Alloy Zn
(wt%)
Mg
(wt%) Zn/Mg
Cu
(wt%)
Fe
(wt%)
1 8 5.3 1.5 0.9 <0.08
2 8 2.3 3.5 0.9 <0.08
3
0.1MPa 8 1.5 5.5 0.9 <0.08
3
1.0MPa 8 1.5 5.5 0.9 <0.08
4
0.1MPa 12 8 1.5 0.9 <0.08
4
1.0MPa 12 8 1.5 0.9 <0.08
5 12 3.4 3.5 0.9 <0.08
6 12 2.2 5.5 0.9 <0.08
7075 5.1-6.1 2.1-2.9 1.8-2.9 1.2-2.0
The experimental Al-Zn-Mg-Cu alloys were cast at UAB in a wedge-shaped
casting that produced smooth laminar filling and were properly chilled and risered to
produce a sound casting. The design and dimensions of the wedge casting are shown in
Figure 1. A plug-pour basin was used at UAB to reduce pouring rate variations and
entrained oxides.

72
Figure 1. Model of the wedge casting.
The pressure vessel at UAB was used for most pours and was 1.2m in diameter
and 1.8m in height, which provided sufficient working space to easily produce large
cylinder block castings (Figure 2). This system can achieve 10MPa (100 atmospheres)
max pressure. After pouring, the pressure vessel was closed with the mold inside and
pressurized to 1MPa (10 atmospheres) pressure using a mixture of dry compressed air
and compressed nitrogen gas. Peak pressure of 1MPa was achieved in ~90 seconds after
pressurization was initiated. Analysis of cooling curves from the casting showed that the
samples closest to the chill solidified prior to the application of pressure. The highest and
lowest alloying compositions were also poured in air to allow for the comparison of air to
SUP. Samples from all of the wedges were HIPed and Brinell hardness blanks were
removed from below the riser.
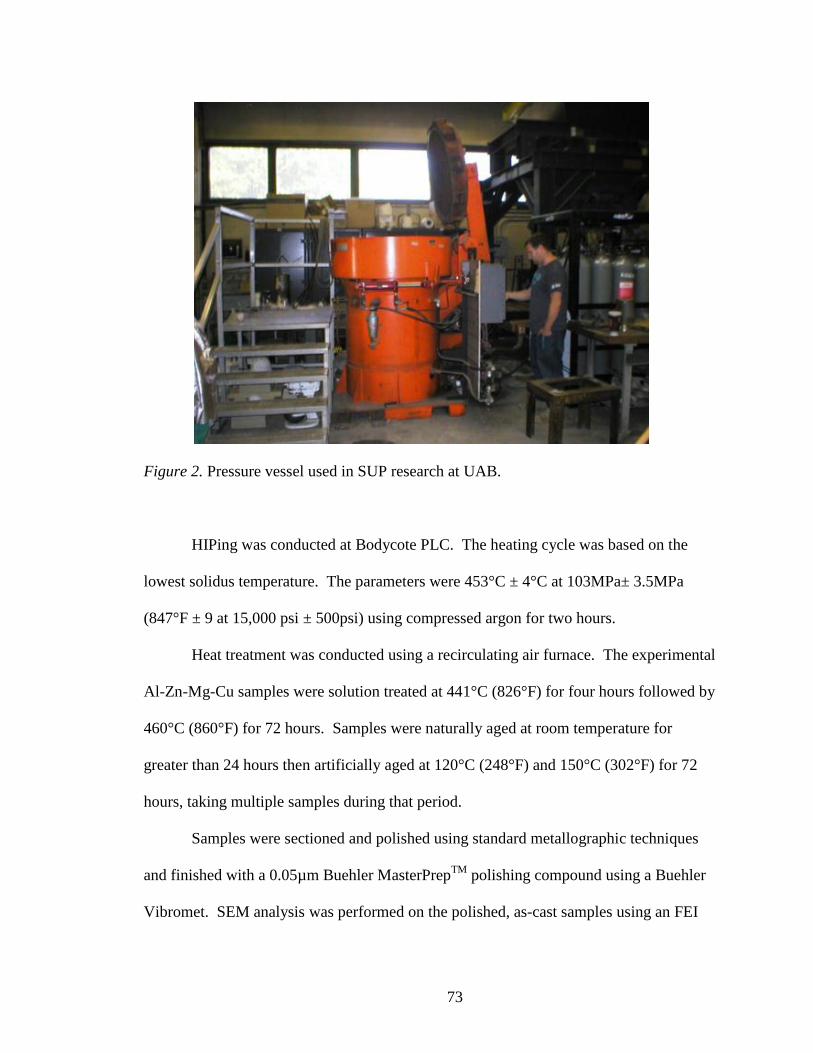
73
Figure 2. Pressure vessel used in SUP research at UAB.
HIPing was conducted at Bodycote PLC. The heating cycle was based on the
lowest solidus temperature. The parameters were 453°C ± 4°C at 103MPa± 3.5MPa
(847°F ± 9 at 15,000 psi ± 500psi) using compressed argon for two hours.
Heat treatment was conducted using a recirculating air furnace. The experimental
Al-Zn-Mg-Cu samples were solution treated at 441°C (826°F) for four hours followed by
460°C (860°F) for 72 hours. Samples were naturally aged at room temperature for
greater than 24 hours then artificially aged at 120°C (248°F) and 150°C (302°F) for 72
hours, taking multiple samples during that period.
Samples were sectioned and polished using standard metallographic techniques
and finished with a 0.05µm Buehler MasterPrepTM
polishing compound using a Buehler
Vibromet. SEM analysis was performed on the polished, as-cast samples using an FEI
74
FEG-650 Scanning Electron Microscope 9 (SEM) equipped with an EDAX TEAM SDD
30mm2 energy dispersive x-ray detector (EDS). Both secondary electron imaging and
EDS analysis of the polished samples was performed to characterize the as-cast
intermetallics.
X-ray diffraction (XRD) was performed on polished samples that were solution
treated for 441°C (826°F) for four hours followed by 460°C (860°F) for 72 hours. They
were naturally aged at room temperature for greater than 24 hours then artificially aged at
120°C (248°F) for 72 hours. XRD was performed using a Siemens D-500 Diffractometer
with Cu radiation and graphite monochromater. Scans were performed at 40kV and
30mA between 2θ of 20° and 90°, utilizing a step size of 0.05° and a dwell time of 60
seconds. The total scan time for each sample was about 24 hours.
Differential Scanning Calorimeter (DSC) was conducted on samples in the as-cast
and solution treated condition. The solution treatment used was an initial step of 441°C
(826°F) for four hours followed by 460°C (860°F) for 72 hours. The DSC used was a TA
Instruments DSC Q100. The “solution treatment” study was conducted by taking as-cast
samples and heating from room temperature at 20°C/min (36°F/min) to 500°C (932°F).
To simulate the aging treatment, solution treated samples were heated at 5°C/min
(9°F/min) to 200°C (392°F). Sample size for DSC was dictated by the aluminum pans
and was less than 3.5mm diameter and 2mm in length. After running DSC, the results
were analyzed using TA Instruments Universal Analysis 2000 program. Points of
inflection and peak positions were all determined.
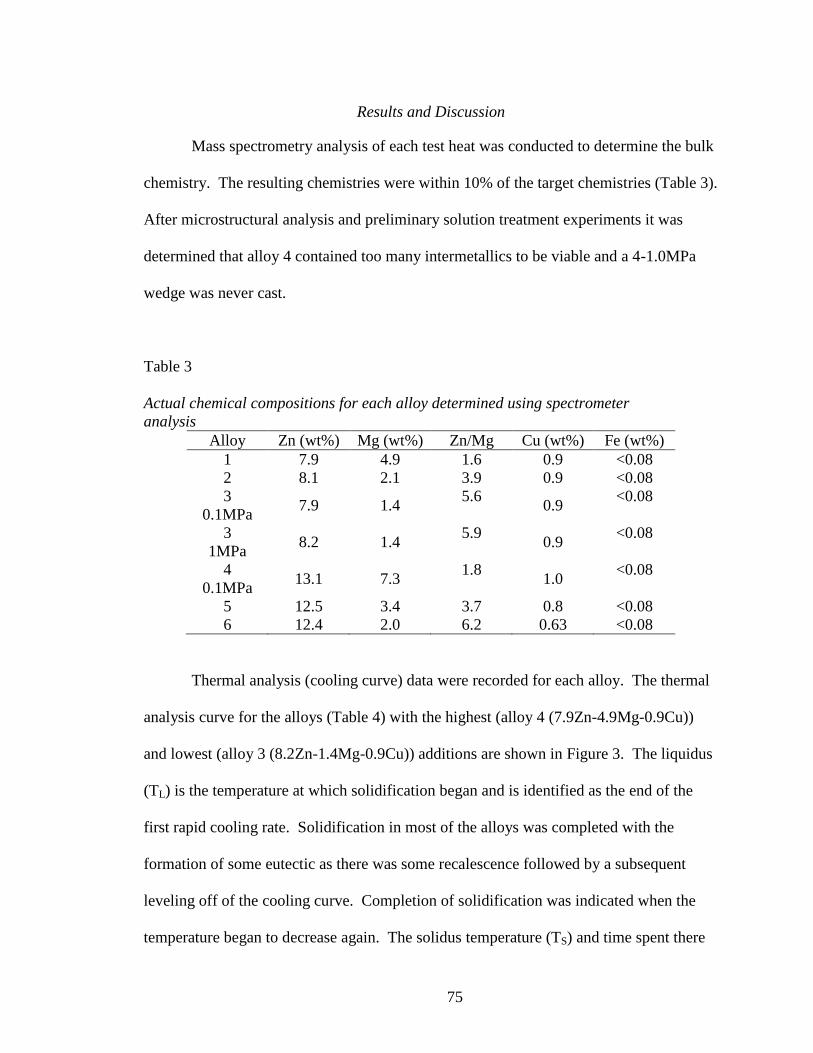
75
Results and Discussion
Mass spectrometry analysis of each test heat was conducted to determine the bulk
chemistry. The resulting chemistries were within 10% of the target chemistries (Table 3).
After microstructural analysis and preliminary solution treatment experiments it was
determined that alloy 4 contained too many intermetallics to be viable and a 4-1.0MPa
wedge was never cast.
Table 3
Actual chemical compositions for each alloy determined using spectrometer
analysis
Alloy Zn (wt%) Mg (wt%) Zn/Mg Cu (wt%) Fe (wt%)
1 7.9 4.9 1.6 0.9 <0.08
2 8.1 2.1 3.9 0.9 <0.08
3
0.1MPa 7.9 1.4
5.6 0.9
<0.08
3
1MPa 8.2 1.4
5.9 0.9
<0.08
4
0.1MPa 13.1 7.3
1.8 1.0
<0.08
5 12.5 3.4 3.7 0.8 <0.08
6 12.4 2.0 6.2 0.63 <0.08
Thermal analysis (cooling curve) data were recorded for each alloy. The thermal
analysis curve for the alloys (Table 4) with the highest (alloy 4 (7.9Zn-4.9Mg-0.9Cu))
and lowest (alloy 3 (8.2Zn-1.4Mg-0.9Cu)) additions are shown in Figure 3. The liquidus
(TL) is the temperature at which solidification began and is identified as the end of the
first rapid cooling rate. Solidification in most of the alloys was completed with the
formation of some eutectic as there was some recalescence followed by a subsequent
leveling off of the cooling curve. Completion of solidification was indicated when the
temperature began to decrease again. The solidus temperature (TS) and time spent there
76
are indicative of the amount of intermetallics formed. High volume fractions of as-cast
intermetallic phases are undesirable as they will be difficult to dissolve during the
solution treating phase and will lower strength and ductility. The eutectic forms because
the bulk composition in the last to solidify area is within the eutectic region due to
segregation that occurs during solidification.
Comparison between solidus and liquidus temperatures and the materials
composition were conducted. The solidus and liquidus temperature were approximately
constant with zinc concentration. As magnesium increased from 2 to 7.3wt%, the
liquidus temperature decreased from 637 to 590°C (1179 to 1094°F) while the solidus
temperature increased from 457 to 473°C (855 to 883°F) leading to an increase in the
solidification range from 147 to 180°C (223 to 324°F). The largest solidification range
was seen at the lowest alloy additions of 8.2Zn-1.4Mg (alloy 3) at about 180°C (324°F)
while the smallest was seen at the highest alloy additions of 13.1Zn-7.3Mg (alloy 4) at
117°C (211°F)
Alloy composition was found to affect the time spent at both the solidus and
liquidus. The three alloys with the high zinc concentration had longer times at TS when
compared to the low zinc alloys. Also, the time spent at TS decreased with decreasing
magnesium concentration at constant zinc concentrations. Alloy 3 (lowest alloy
concentration) had the shortest time spent at TS (0±2 seconds) while alloy 4 (highest alloy
concentration) had the longest time spent at TS at 89 seconds.

77
Table 4
Thermal analysis results for each alloy
ALLOY Zn
(wt%)
Mg
(wt%)
Cu
(wt%)
TL±2°
°C
(°F)
TS
(±2°C)
(°F)
Solidification Range
TL-TS°C
(°F)
Time at
Solidus
(sec)
1 7.9 4.9 0.9 618
(1144)
472
(882)
146 (262) 30
2 8.1 2.1 0.9 629
(1164)
467
(873)
162 (291) 10
3 8.2 1.4 0.9 637
(1179)
457
(855)
180 (324) 2
4 13.1 7.3 1.0 590
(1094)
473
(883)
117 (211) 89
5 12.5 3.4 0.8 626
(1159)
466
(871)
160 (288) 26
6 12.4 2.0 0.6 624
(1155)
463
(865)
161 (290) 16

78
(a)
(b)
Figure 3. Cooling curve for (a) alloy 4 (7.9Zn-4.9Mg-0.9Cu) and (b) alloy 3 (8.2Zn-
1.4Mg-0.9Cu) showing a long recolescence in alloy 4 (7.9Zn-4.9Mg-0.9Cu) and no
recolescence in alloy 3 (8.2Zn-1.4Mg-0.9Cu).
Liquidus (TL)
Solidus (TS)
End of Solidus
Solidification
Time
Time at TS

79
SEM images of the microstructures for the different alloys were recorded.
Representative SEM images of the as-cast microstructure of the alloy with lowest
alloying additions (alloy 3-1MPa (8.2Zn-1.4Mg)) and the highest alloying additions (as-
cast alloy 4 (13.1Zn-7.3Mg)) are shown in Figures 4a and 4b. The image magnification
of alloy 4 (13.1Zn-7.3Mg) is higher to show the eutectic-like structure. All of the alloys
contain some intermetallics although the amount was greatly reduced in the lower alloy
compositions. As zinc and magnesium contents increased, the size and amount of
interconnected eutectic-like intermetallic increased. The cooling curve and
microstructure of alloy 4 (14.1Zn-7.3Mg) with the highest alloying additions indicated
that the alloy was in the eutectic range and that the large as-cast intermetallics could not
be dissolved. Therefore, no further analysis was performed on alloy 4 (13.1Zn-7.3Mg).

80
(a)
(b)
Figure 4. As-cast microstructure for (a) alloy 3-1MPa (8.2Zn-1.4Mg) and (b) alloy 4
(13.1Zn-7.3Mg) showing the resulting intermetallic phase.

81
Aging studies were conducted at two different temperatures. Aging at 120°C
(248°F) for times between 0 – 120 hours resulted in the Brinell hardness values as shown
in Figure 5. All alloys showed a rapid increase in hardness between 0 to two hours.
Alloy 1 (7.9Zn-4.9Mg), alloy 2 (8.1Zn-2.1Mg), alloy 5 (12.5Zn-3.4Mg), and alloy 6
(12.4Zn-2.4Mg) also showed a modest increase in hardness when further aged up to 120
hours. The hardness of alloy 3 (8Zn-1.4Mg) leveled off between 24 and 96 hours when
aged at 120°C (248°F). Alloy 5 (12.5Zn-3.4Mg), the remaining alloy with the highest
alloying additions, had the highest hardness at all times with a peak hardness of 183BHN.
Alloys 1 (7.9 Zn-4.9Mg) and 6 (12.4Zn-2.4Mg) were similar in hardness and had a peak
hardness of 169 and 170BHN, respectively. Alloy 3-0.1MPa (7.9Zn-1.4Mg) was run
twice, showed good repeatability, and had a maximum hardness of 152BHN at 24 hours.
Alloy 3-1MPa (8.2Zn-2.1Mg) solidified at 1MPa of pressure had a peak hardness of
144BHN at 96 hours. There was a small increase in peak hardness at higher zinc
concentrations and peak hardness also increased with magnesium concentrations up to
3.4% (Figure 6a and 6b).

82
Figure 5. Hardness versus time for 120°C (248°F) aging.

83
(a)
(b)
Figure 6. Peak hardness versus (a) zinc and (b) magnesium content after aging at 120°C
(248°F).
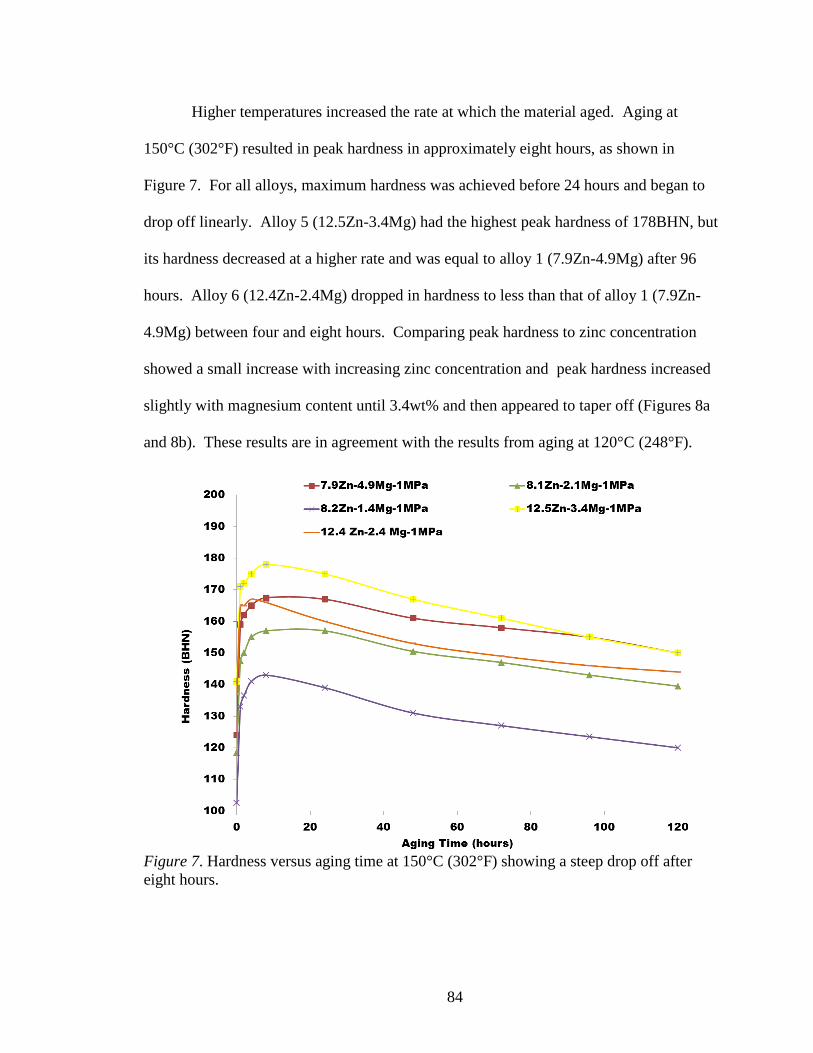
84
Higher temperatures increased the rate at which the material aged. Aging at
150°C (302°F) resulted in peak hardness in approximately eight hours, as shown in
Figure 7. For all alloys, maximum hardness was achieved before 24 hours and began to
drop off linearly. Alloy 5 (12.5Zn-3.4Mg) had the highest peak hardness of 178BHN, but
its hardness decreased at a higher rate and was equal to alloy 1 (7.9Zn-4.9Mg) after 96
hours. Alloy 6 (12.4Zn-2.4Mg) dropped in hardness to less than that of alloy 1 (7.9Zn-
4.9Mg) between four and eight hours. Comparing peak hardness to zinc concentration
showed a small increase with increasing zinc concentration and peak hardness increased
slightly with magnesium content until 3.4wt% and then appeared to taper off (Figures 8a
and 8b). These results are in agreement with the results from aging at 120°C (248°F).
Figure 7. Hardness versus aging time at 150°C (302°F) showing a steep drop off after
eight hours.
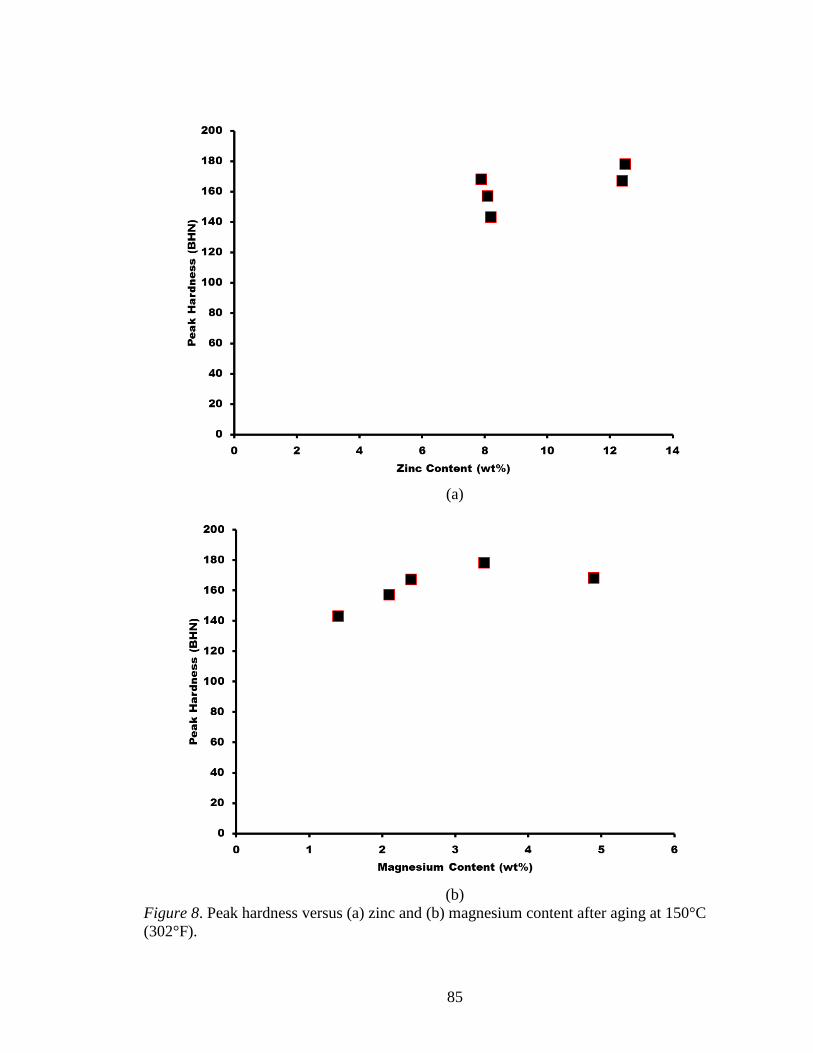
85
(a)
(b)
Figure 8. Peak hardness versus (a) zinc and (b) magnesium content after aging at 150°C
(302°F).

86
Lower temperature aging yielded better results. The peak hardness at 120°C
(248°F) was somewhat higher than peak hardness achieved at 150°C (302°F). The
largest difference was found in the alloys containing 12wt% zinc. The 8wt% zinc alloys
were only 1-2BHN higher when aged at 120°C (248°F) versus 5BHN at 150°C (302°F).
Solution treatment was unable to remove all of the as-cast intermetallics.
Following solution treatment and aging, some fraction of the as-cast intermetallics
remained in all of the samples. SEM-EDS analysis was performed on all the alloys and
two different as-cast intermetallic phases were identified. A representative SEM image
of the intermetallics in alloy 2 (8.1Zn-2.1Mg) is shown in Figure 9. The matrix contained
aluminum, zinc, magnesium and copper (red outline in Figure 10a). The majority of the
as-cast intermetallic phase contained aluminum, zinc, magnesium and copper (blue area
in Figure 11a) with a higher zinc, magnesium, and copper concentration than seen in the
matrix. A smaller amount of an intermetallic-inclusion phase was also identified and
contained aluminum and iron with trace amounts of zinc, magnesium, copper, and nickel
(Figure 10b).
The size of the intermetallic particles in the as-cast structure varied with cooling
rate (faster cooling rate, smaller intermetallics). The smaller the intermetallics, the easier
they were to dissolve during solution treatment. The iron containing intermetallic
(inclusion) did not dissolve during solution treatment and therefore this phase can only be
minimized by a reduction in total iron content requiring purer aluminum and alloying
elements.
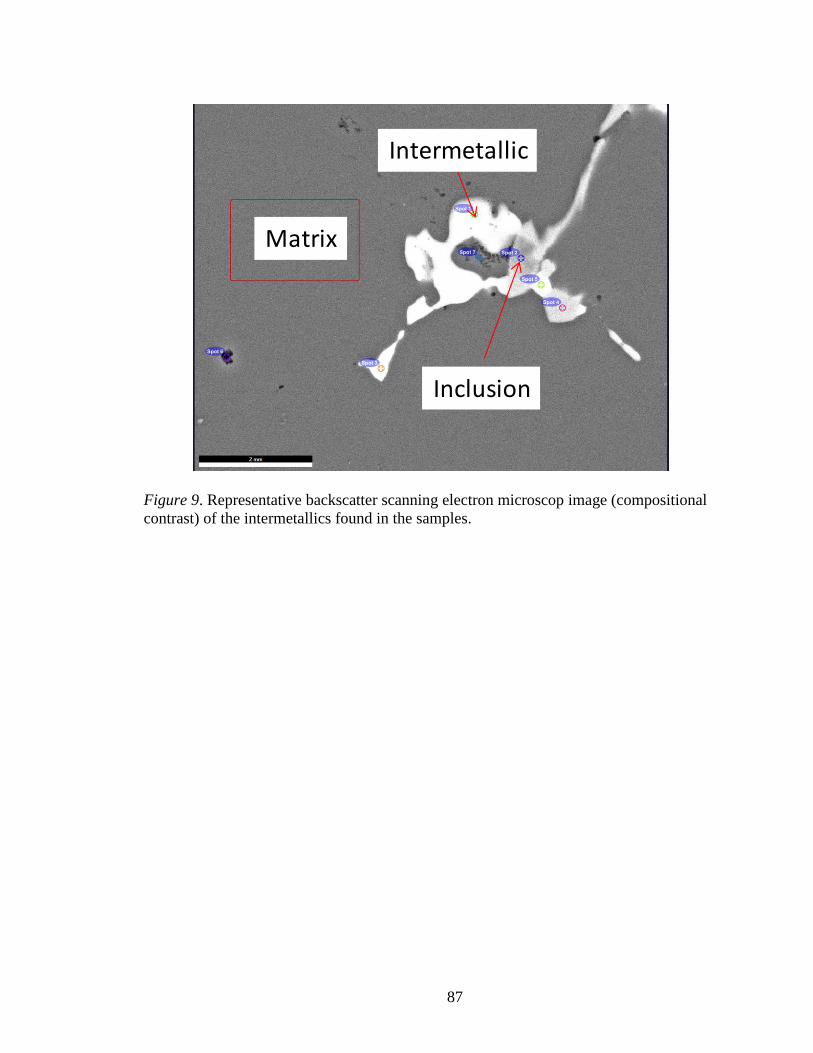
87
Figure 9. Representative backscatter scanning electron microscop image (compositional
contrast) of the intermetallics found in the samples.
Matrix
Intermetallic
Inclusion
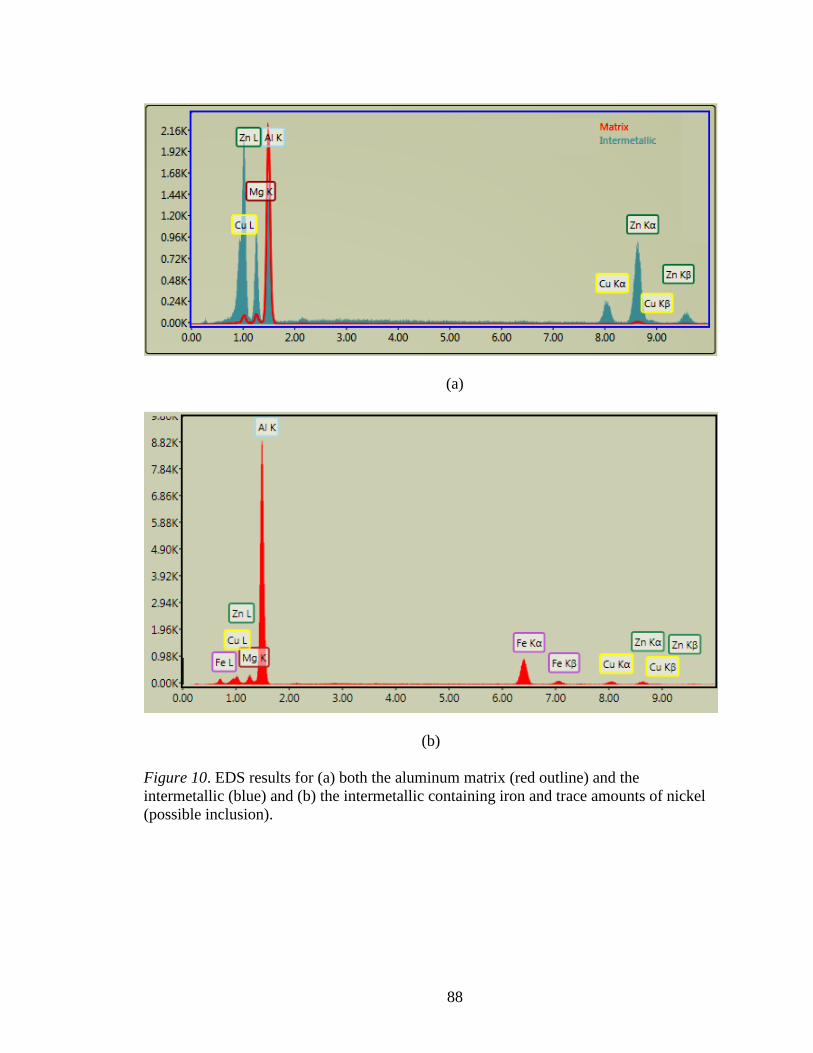
88
(a)
(b)
Figure 10. EDS results for (a) both the aluminum matrix (red outline) and the
intermetallic (blue) and (b) the intermetallic containing iron and trace amounts of nickel
(possible inclusion).
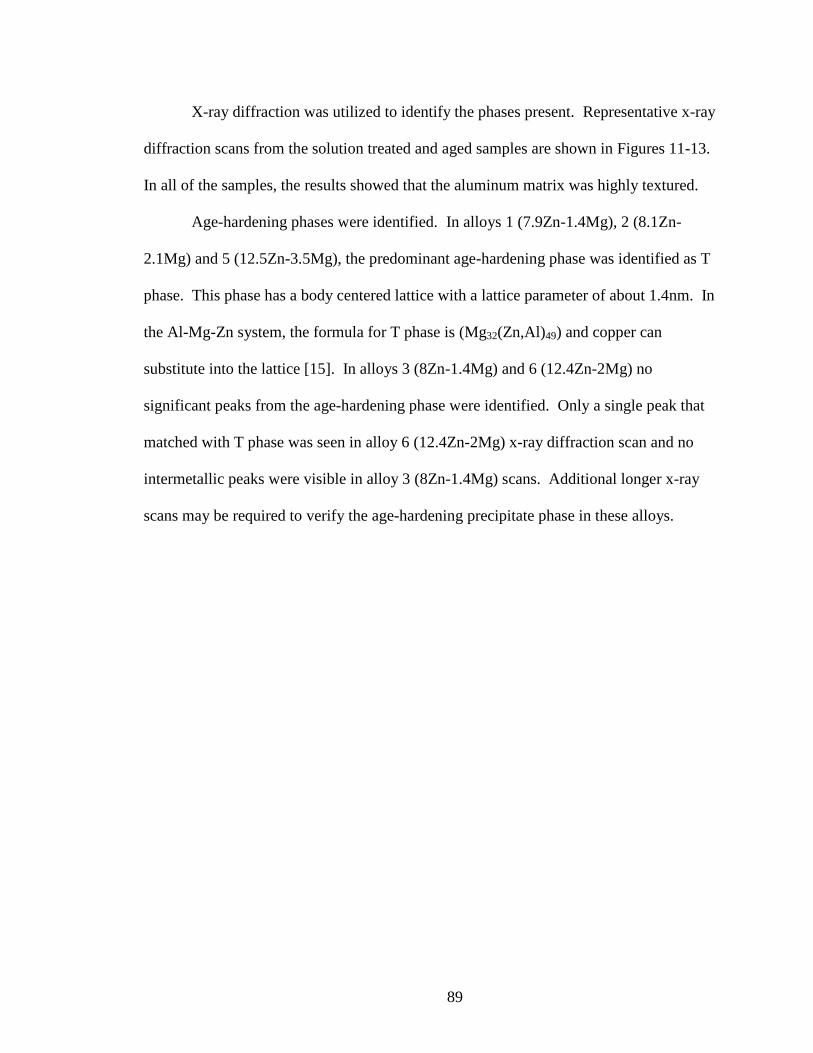
89
X-ray diffraction was utilized to identify the phases present. Representative x-ray
diffraction scans from the solution treated and aged samples are shown in Figures 11-13.
In all of the samples, the results showed that the aluminum matrix was highly textured.
Age-hardening phases were identified. In alloys 1 (7.9Zn-1.4Mg), 2 (8.1Zn-
2.1Mg) and 5 (12.5Zn-3.5Mg), the predominant age-hardening phase was identified as T
phase. This phase has a body centered lattice with a lattice parameter of about 1.4nm. In
the Al-Mg-Zn system, the formula for T phase is (Mg32(Zn,Al)49) and copper can
substitute into the lattice [15]. In alloys 3 (8Zn-1.4Mg) and 6 (12.4Zn-2Mg) no
significant peaks from the age-hardening phase were identified. Only a single peak that
matched with T phase was seen in alloy 6 (12.4Zn-2Mg) x-ray diffraction scan and no
intermetallic peaks were visible in alloy 3 (8Zn-1.4Mg) scans. Additional longer x-ray
scans may be required to verify the age-hardening precipitate phase in these alloys.

90
Figure 11. Relative x-ray intensity vs. 2θ (background subtracted) for alloy 1 (7.9Zn-
4.9Mg) showing a match with the intermetallic T-Phase (Mg32Zn31.9Al17.1).
0
10
20
30
40
50
60
70
80
90
100
35 40 45 50 55 60 65 70 75 80 85
Re
lati
ve In
ten
sity
2θ
Relative X-Ray Intensity Vs. 2θ for Alloy 1 (7.9Zn-4.9Mg)
Data
T Phase
Matrix (FCC Aluminum)

91
Figure 12. Zoomed relative x-ray intensity vs. 2θ (background subtracted) for alloy 1
(7.9Zn-4.9Mg) showing a match with the intermetallic T-Phase (Mg32Zn31.9Al17.1).
0
1
2
3
4
5
6
7
8
9
10
35 40 45 50 55 60 65
Re
lati
ve In
ten
sity
2θ
Relative X-Ray Intensity Vs. 2θ for Alloy 1 (7.9Zn-4.9Mg)
Data
T Phase
Matrix (FCC Aluminum)
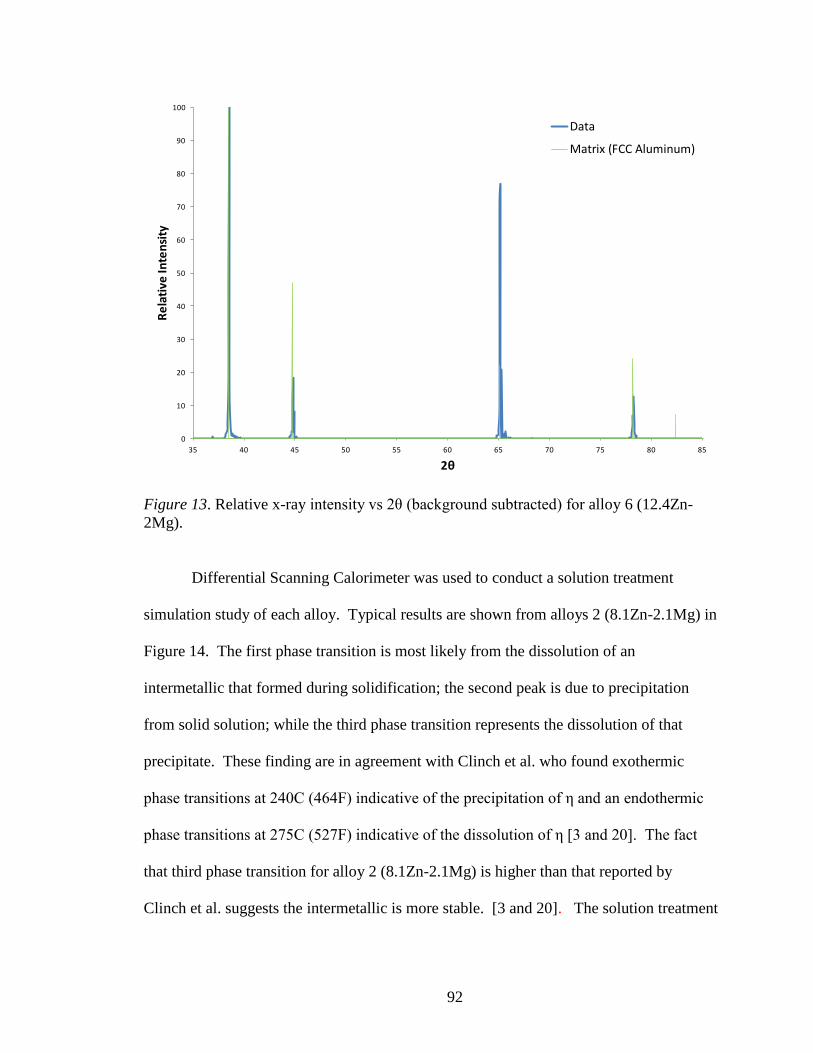
92
Figure 13. Relative x-ray intensity vs 2θ (background subtracted) for alloy 6 (12.4Zn-
2Mg).
Differential Scanning Calorimeter was used to conduct a solution treatment
simulation study of each alloy. Typical results are shown from alloys 2 (8.1Zn-2.1Mg) in
Figure 14. The first phase transition is most likely from the dissolution of an
intermetallic that formed during solidification; the second peak is due to precipitation
from solid solution; while the third phase transition represents the dissolution of that
precipitate. These finding are in agreement with Clinch et al. who found exothermic
phase transitions at 240C (464F) indicative of the precipitation of η and an endothermic
phase transitions at 275C (527F) indicative of the dissolution of η [3 and 20]. The fact
that third phase transition for alloy 2 (8.1Zn-2.1Mg) is higher than that reported by
Clinch et al. suggests the intermetallic is more stable. [3 and 20]. The solution treatment
0
10
20
30
40
50
60
70
80
90
100
35 40 45 50 55 60 65 70 75 80 85
Re
lati
ve In
ten
sity
2θ
Relative X-Ray Intensity Vs. 2θ for Alloy 6 (12.4Zn-2Mg)
Data
Matrix (FCC Aluminum)

93
study found that as alloy content increased, the size of the reaction peaks decreased and
the starting temperatures of the reactions increased in temperature. This is likely caused
by faster dissolution and coarsening rates for smaller intermetallics. Table 5 shows the
temperature of each peak for the alloys.
Figure 14. DSC curve for the “solution treatment study” of as-cast alloy 2 (8.1Zn-
2.1Mg).
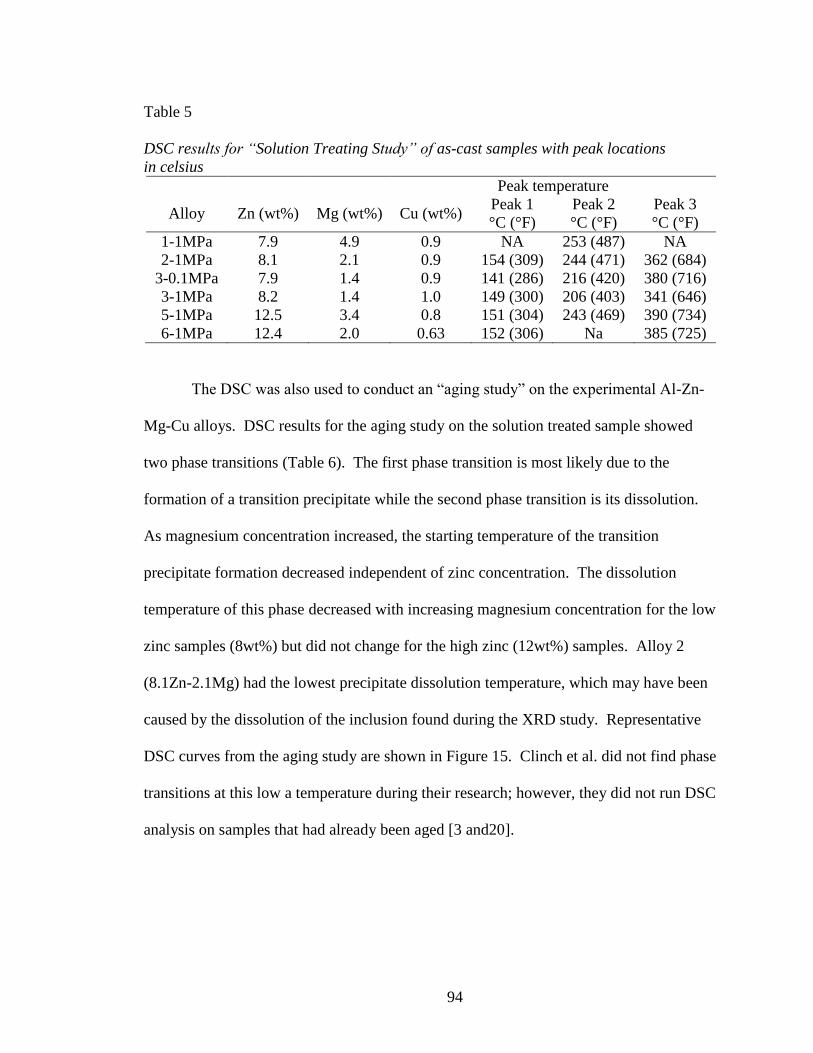
94
Table 5
DSC results for “Solution Treating Study” of as-cast samples with peak locations
in celsius
Peak temperature
Alloy Zn (wt%) Mg (wt%) Cu (wt%) Peak 1
°C (°F)
Peak 2
°C (°F)
Peak 3
°C (°F)
1-1MPa 7.9 4.9 0.9 NA 253 (487) NA
2-1MPa 8.1 2.1 0.9 154 (309) 244 (471) 362 (684)
3-0.1MPa 7.9 1.4 0.9 141 (286) 216 (420) 380 (716)
3-1MPa 8.2 1.4 1.0 149 (300) 206 (403) 341 (646)
5-1MPa 12.5 3.4 0.8 151 (304) 243 (469) 390 (734)
6-1MPa 12.4 2.0 0.63 152 (306) Na 385 (725)
The DSC was also used to conduct an “aging study” on the experimental Al-Zn-
Mg-Cu alloys. DSC results for the aging study on the solution treated sample showed
two phase transitions (Table 6). The first phase transition is most likely due to the
formation of a transition precipitate while the second phase transition is its dissolution.
As magnesium concentration increased, the starting temperature of the transition
precipitate formation decreased independent of zinc concentration. The dissolution
temperature of this phase decreased with increasing magnesium concentration for the low
zinc samples (8wt%) but did not change for the high zinc (12wt%) samples. Alloy 2
(8.1Zn-2.1Mg) had the lowest precipitate dissolution temperature, which may have been
caused by the dissolution of the inclusion found during the XRD study. Representative
DSC curves from the aging study are shown in Figure 15. Clinch et al. did not find phase
transitions at this low a temperature during their research; however, they did not run DSC
analysis on samples that had already been aged [3 and20].
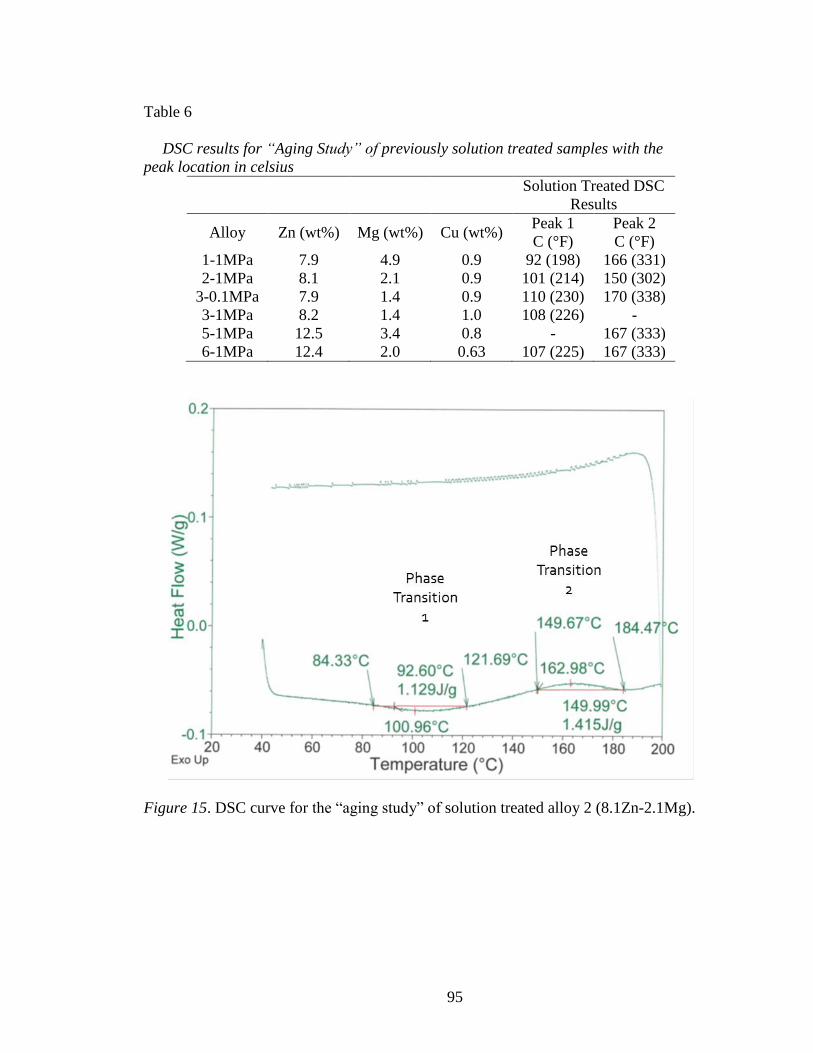
95
Table 6
DSC results for “Aging Study” of previously solution treated samples with the
peak location in celsius
Solution Treated DSC
Results
Alloy Zn (wt%) Mg (wt%) Cu (wt%) Peak 1
C (°F)
Peak 2
C (°F)
1-1MPa 7.9 4.9 0.9 92 (198) 166 (331)
2-1MPa 8.1 2.1 0.9 101 (214) 150 (302)
3-0.1MPa 7.9 1.4 0.9 110 (230) 170 (338)
3-1MPa 8.2 1.4 1.0 108 (226) -
5-1MPa 12.5 3.4 0.8 - 167 (333)
6-1MPa 12.4 2.0 0.63 107 (225) 167 (333)
Figure 15. DSC curve for the “aging study” of solution treated alloy 2 (8.1Zn-2.1Mg).
96
Summary and Conclusions
Six cast Al-Zn-Mg-Cu alloys were produced with zinc concentrations of 8 and
12%, and Zn/Mg ratios of 1 to 5.4%. Copper was limited to 0.9% to improve stress
corrosion cracking. The alloys were solution treated and the effect of aging at 120 and
150°C (248°F and 302°F) on hardness was investigated. X-ray diffraction was used to
identify the precipitates in the precipitation hardened alloys. DSC was used to determine
the effect of alloying on transformation temperatures.
At the highest alloy content (13.1Zn-7.3Mg) a large amount of eutectic structure
formed, such that no solution treating temperature and time would have re-dissolved it,
short of re-melting. Castings produced with lower alloying additions contained less
intermetallic compounds.
SEM EDS analysis showed the intermetallic particles had two different
chemistries, including an intermetallic phase with aluminum that was rich in magnesium;
zinc; and copper, and an unwanted intermetallic phase that contained aluminum; iron;
magnesium; and silicon with traces of zinc; nickel; and copper. The first intermetallic
was significantly dissolved during heat treatment while the second was stable. These
results indicate that the iron concentration should be minimized in these samples to
increase ductility.
X-ray diffraction showed that the age hardening precipitates in these alloys
matched well with T phase (Mg32Zn31.9Al17.1), a cubic crystal structure.
DSC confirmed that lower alloy contents resulted in easier intermetallic
dissolution. This is likely due to the smaller, more isolated intermetallic distribution.
97
Precipitation began at a higher temperature in the lower alloy samples. This is likely
caused by the amount of alloy in solution and its readiness to re-precipitate.
Heat treating of ultra-high strength cast Al-Zn-Mg-Cu has been optimized for
maximum hardness. Samples were solution treatment of 441°C (826°F) for four hours
before ramping to 460°C (860°F) for 75 hours and then aged at 120°C (248°F) for 75
hours.
Acknowledgements
The authors would like to thank Joe Jablonsky, Ricardo Aristizbal, and Grant
Ethridge for their aid in casting and microstructural analysis.
“Research was sponsored by the U.S. Army Contracting Command Joint
Munitions & Lethality Contracting Center, Picatinny, NJ on behalf of Benet Laboratories,
and was accomplished under Cooperative Agreement Number W15QKN-10-2-0001.
The views and conclusions contained in this document are those of the authors and
should not be interpreted as representing the official policies, either expressed or implied,
of Benet Laboratories or the U.S. Government. The U.S. Government is authorized to
reproduce and distribute reprints for Government purposes notwithstanding any copyright
notation heron.”

98
REFERENCES
1. Hatch, John. ed. Aluminum: Properties and Physical Metallurgy. Metals Park:
American Society for Metals.1984. 155; 238-39; 271. Print.
2. ASM International. ASM Handbook: Properties and Selection: Nonferrous Alloys and
Special-Purpose Materials. Materials Park: ASM International. 1990. Print.
3. ASM International. Metallography, Structures and Phase Diagrams, Metals
Handbook. Metals Park: American Society for Metals. 1973. 259. Print.
4. Stumpf, H. Unpublished Research at Alcoa Laboratories. 1965-1971. Print.
5. Clinch, M., Daval, R., Harris, S., Hepples, W., Holryoyd, N., Lawday, M., Noble, B.
“A Microstructural Engineering-Based Approach to Al-Zn-Mg-Cu Series Alloy
Optimization.” Institute of Materials Engineering Australasia Ltd, Materials Forum.
2004: vol. 28. Print.
6. Druschitz, Alan. Griffin, John. “Advanced Cast Aluminum Alloys.” Shape Casting:
3rd
International Symposium, Warrendale: TMS. 2009. 53-60. Print.
7. Senkov, O., Druschitz, A., Senkova, S., Kendig, K., Griffin, J. “Ultra-High Strength
Sand Castings from Aluminum Alloys 7042.” TMS 2011 Annual Meeting and
Exposition. Warrendale: TMS. 2011. Print.
8. Rokhlin, L., Dobatkina, T., Bochvar, N., Lysova, E. “Investigation of phase equilibria
in alloys of the Al-Zn-Mg-Cu-Zr-Sc system.” Journal of Alloys and Compounds.
2004: 10-6. Print.
9. Raghavan, V. “Al-Mg-Zn (Aluminum-Magnesium-Zinc),” Phase Diagram
Evaluations: Section II, Journal of Phase Equilibria and Diffusion. 2007: Vol. 28, No.
2. Print.
10. Andreatta, F., Lohrengel, M., Terryn, H., de Wit, J. “Electrochemical
Characterization of Aluminum AA7075-T6 and Solution Heat Treated AA7075 using
a Micro-Capillary Cell.” Electrochimica Acta. 2003: 3239-3247. Print.
11. Shastry, C., Levy, M., Joshi, A. “The Effects of Solution Treatment Temperature on
Stress Corrosion Susceptibility of 7075 Aluminum Alloys.” Corrosion Science. 1981:
Vol. 21. 673-688. Print.
12. Clinch, M., Harris, S., Hepples, W., Holroyd, N., Lawday, M. and Noble, B.
“Influence of Zinc to Magnesium Ratio and Total Solute Content on the Strength and
Toughness of Al-Zn-Mg-Cu series Alloys.” Materials Science Forum. 2006: vol. 519-
521. Print.
99
7. HIGH STRENGTH CAST ALUMINUM: TENSILE PROPERTIES
by
EDWARD DRUSCHITZ, ROBIN FOLEY, AND JOHN GRIFFIN
In preparation for AFS Transcripts
Format adapted for dissertation
100
Abstract
The Al-Zn-Mg-Cu series alloys are among the highest strength wrought
aluminum alloys. Casting these alloys typically results in two microstructural defects: (1)
intermetallic particles and (2) microporosity. In this paper, six experimental Al-Zn-Mg-
Cu alloys were cast under 1MPa (10 atmospheres) of pressure, heat treated, and
mechanically tested to determine the effect of Zn/Mg ratio and processing conditions on
tensile properties. Zinc concentrations of 8 and 12wt% and Zn/Mg ratios of 1.5 to 5.5
were tested. Copper was held constant at 0.9%. Chilled Al-8.2Zn-1.4Mg-0.9Cu
solidified under pressure resulted in an alloy with yield strength of 468MPa (68ksi),
tensile strength of 525MPa (76ksi) and elongation of 9%.
Keywords: cast high strength aluminum, wrought Al-Zn-Mg-Cu aluminum, tensile
properties.
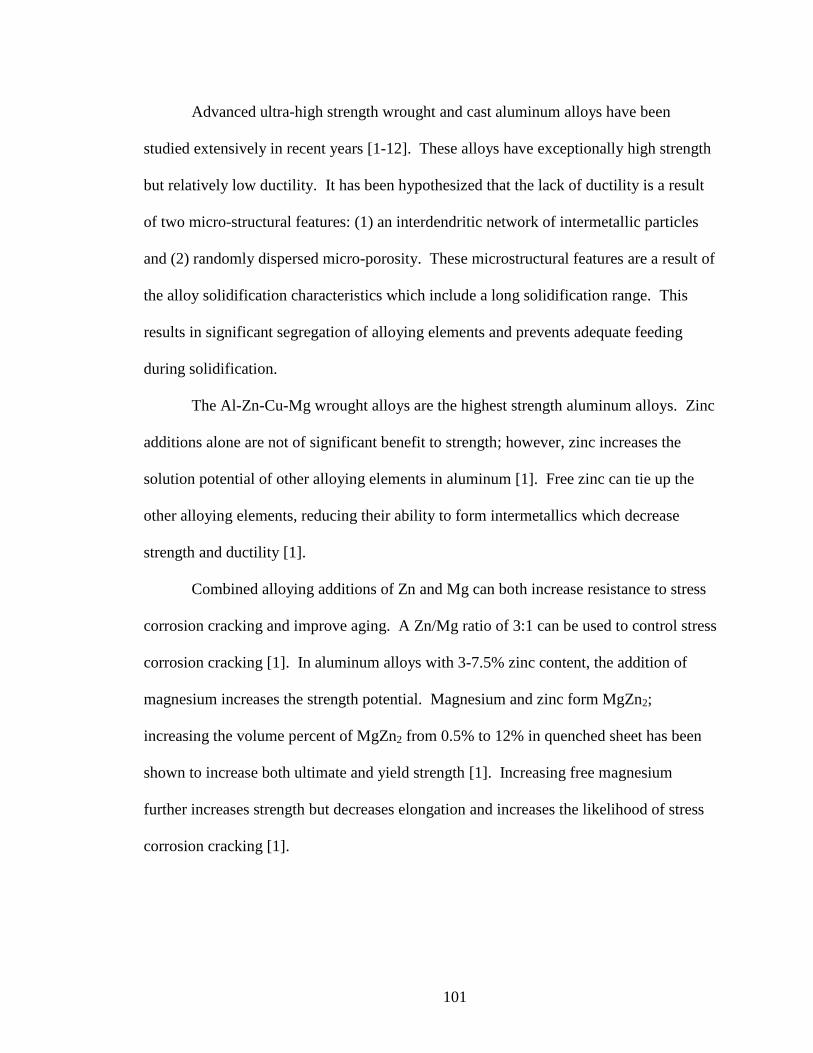
101
Advanced ultra-high strength wrought and cast aluminum alloys have been
studied extensively in recent years [1-12]. These alloys have exceptionally high strength
but relatively low ductility. It has been hypothesized that the lack of ductility is a result
of two micro-structural features: (1) an interdendritic network of intermetallic particles
and (2) randomly dispersed micro-porosity. These microstructural features are a result of
the alloy solidification characteristics which include a long solidification range. This
results in significant segregation of alloying elements and prevents adequate feeding
during solidification.
The Al-Zn-Cu-Mg wrought alloys are the highest strength aluminum alloys. Zinc
additions alone are not of significant benefit to strength; however, zinc increases the
solution potential of other alloying elements in aluminum [1]. Free zinc can tie up the
other alloying elements, reducing their ability to form intermetallics which decrease
strength and ductility [1].
Combined alloying additions of Zn and Mg can both increase resistance to stress
corrosion cracking and improve aging. A Zn/Mg ratio of 3:1 can be used to control stress
corrosion cracking [1]. In aluminum alloys with 3-7.5% zinc content, the addition of
magnesium increases the strength potential. Magnesium and zinc form MgZn2;
increasing the volume percent of MgZn2 from 0.5% to 12% in quenched sheet has been
shown to increase both ultimate and yield strength [1]. Increasing free magnesium
further increases strength but decreases elongation and increases the likelihood of stress
corrosion cracking [1].
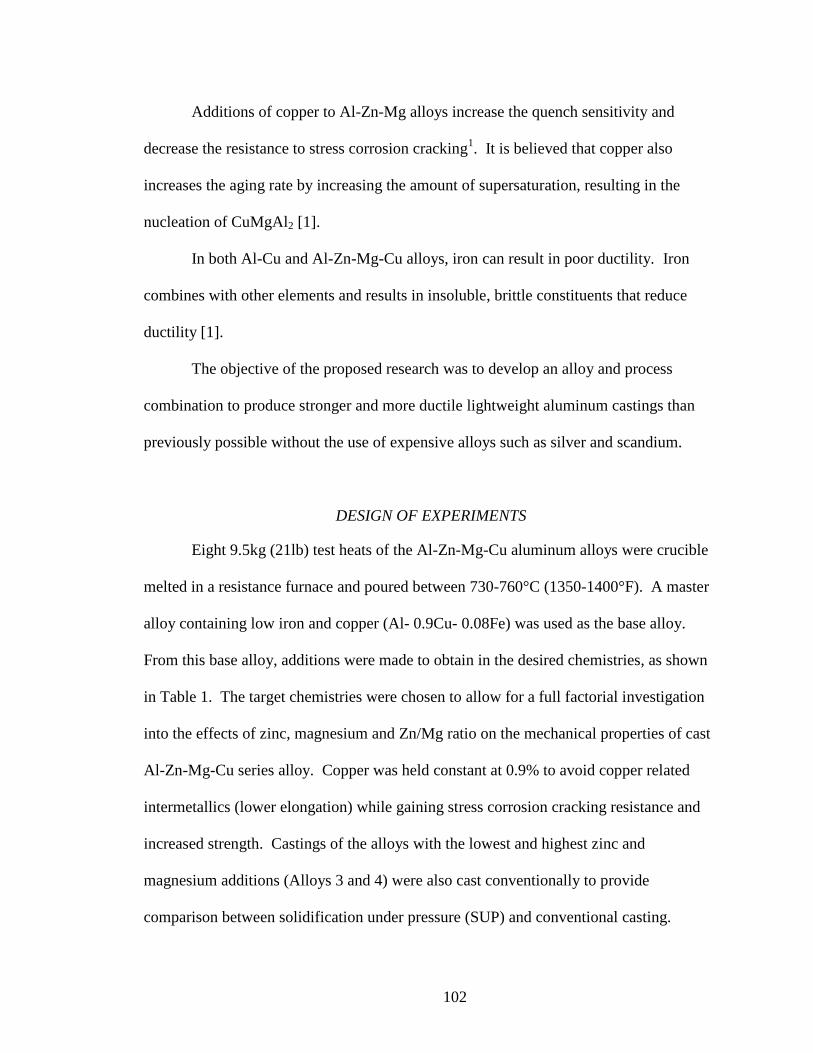
102
Additions of copper to Al-Zn-Mg alloys increase the quench sensitivity and
decrease the resistance to stress corrosion cracking1. It is believed that copper also
increases the aging rate by increasing the amount of supersaturation, resulting in the
nucleation of CuMgAl2 [1].
In both Al-Cu and Al-Zn-Mg-Cu alloys, iron can result in poor ductility. Iron
combines with other elements and results in insoluble, brittle constituents that reduce
ductility [1].
The objective of the proposed research was to develop an alloy and process
combination to produce stronger and more ductile lightweight aluminum castings than
previously possible without the use of expensive alloys such as silver and scandium.
DESIGN OF EXPERIMENTS
Eight 9.5kg (21lb) test heats of the Al-Zn-Mg-Cu aluminum alloys were crucible
melted in a resistance furnace and poured between 730-760°C (1350-1400°F). A master
alloy containing low iron and copper (Al- 0.9Cu- 0.08Fe) was used as the base alloy.
From this base alloy, additions were made to obtain in the desired chemistries, as shown
in Table 1. The target chemistries were chosen to allow for a full factorial investigation
into the effects of zinc, magnesium and Zn/Mg ratio on the mechanical properties of cast
Al-Zn-Mg-Cu series alloy. Copper was held constant at 0.9% to avoid copper related
intermetallics (lower elongation) while gaining stress corrosion cracking resistance and
increased strength. Castings of the alloys with the lowest and highest zinc and
magnesium additions (Alloys 3 and 4) were also cast conventionally to provide
comparison between solidification under pressure (SUP) and conventional casting.

103
Table 1
Target chemistries for each of 6 alloys
Alloy Zn
(wt%)
Mg
(wt%) Zn:Mg
Cu
(wt%)
Fe
(wt%)
1 8 5.3 1.5 0.9 <0.08
2 8 2.3 3.5 0.9 <0.08
3 8 1.5 5.5 0.9 <0.08
4 12 8 1.5 0.9 <0.08
5 12 3.4 3.5 0.9 <0.08
6 12 2.2 5.5 0.9 <0.08
7075 5.1-
6.1
2.1-
2.9
1.8-
2.9
1.2-
2.0
Chemistry samples of each heat were taken prior to pouring using a copper
permanent mold. Chemistries were determined by spectrometer analysis. The aluminum
alloys were degassed for 20-60 minutes using a rotary argon de-gassing unit. A reduced
pressure test sample was taken after degassing for each heat and checked for hydrogen
porosity before pouring. Additions of TiBor were made as a grain refiner and increased
the titanium concentration to 0.02wt%. The test mold used was a double filtered wedge
casting that offered smooth laminar filling and was properly risered to produce a sound
casting. A chill was placed at the base of the wedge to provide chilling and directional
solidification (Figure 1). A plug fill pouring basin was used to eliminate entrained air
and minimize entrained oxides.
104
Figure 1. Schematic of double filtered, chilled, wedge casting.
The pressure vessel at UAB was used for all SUP pours. The pressure vessel used
in the investigation was 1.2 meters in diameter and 1.8 meters in height, which provided
sufficient working space to easily produce large cylinder block castings (Figure 2). The
pressure vessel can achieve 10MPa (100 atmosphere) maximum pressure. After pouring,
the pressure vessel was closed and the filled mold pressurized to 1MPa (10 atmospheres)
pressure using a mixture of dry compressed air and compressed nitrogen gas. Peak
pressure of 1MPa was achieved in ~90 seconds after pressurization was initiated.
Thermal analysis of this casting configuration showed that the region closest to the chill
solidified prior to full application of pressure so that this region did not receive the
maximum effect of the applied pressure.

105
Figure 2. Pressure vessel used in SUP research at UAB.
For each heat, a thermal analysis cup was poured to allow for the identification of
the solidus and liquidus temperatures. Alloy 3-0.1MPa (7.9Zn-1.4Mg) was also
solidified at atmospheric pressure to allow for the comparison of conventional
solidification to SUP. Thermal analysis of alloy 4 (13.1Zn-7.3Mg - highest zinc and
magnesium concentration) showed that this alloy was a eutectic-containing alloy and
therefore analysis of this alloy was abandoned.
The location of tensile samples removal is shown in Figure 3. Chill samples were
removed from just above the chill, the location of fastest cooling in the wedge. Two
samples were machined and tested from each wedge from the chill location. As stated
previously, the chill samples solidified so quickly that the maximum pressure was applied
after solidification was complete. SUP samples were removed from the three locations at
distances ranging from 1.9 to 4.5cm (0.75 to 1.75in) from the chill. These samples did
solidify after maximum pressure was reached. As the distance from the chill increased,
the cooling rate in the samples decreased. Samples for HIPing were removed from a
106
section rotated 90 degrees from the chilled and SUP samples. The center of the HIPed
tensile bars were at a distance more than 5cm (2in) from the chill so the cooling rate in
these regions were lower than seen in the thickest SUP samples. In summary, two
chilled, six SUP (two from each thickness or distance from the chill), and four HIPed
samples were tested and analyzed for each wedge casting.
Figure 3. Casting produced with lines showing from where each tensile blank was cut.
Heat treatment was conducted using a recirculating air furnace. Tensile blanks
were solution treated at 441°C (826°F) for four hours followed by 460°C (860°F) for 72
hours. They were naturally aged at room temperature for greater than 24 hours then
artificially aged at 120°C (248°F) for 72 hours.
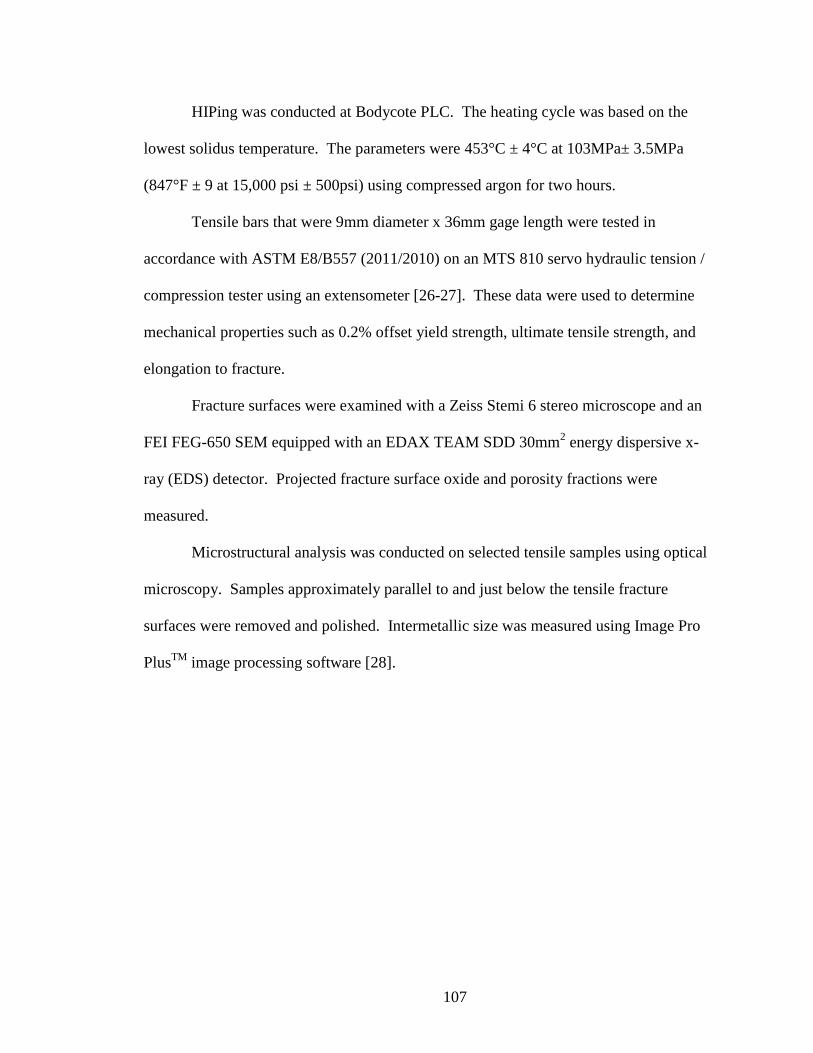
107
HIPing was conducted at Bodycote PLC. The heating cycle was based on the
lowest solidus temperature. The parameters were 453°C ± 4°C at 103MPa± 3.5MPa
(847°F ± 9 at 15,000 psi ± 500psi) using compressed argon for two hours.
Tensile bars that were 9mm diameter x 36mm gage length were tested in
accordance with ASTM E8/B557 (2011/2010) on an MTS 810 servo hydraulic tension /
compression tester using an extensometer [26-27]. These data were used to determine
mechanical properties such as 0.2% offset yield strength, ultimate tensile strength, and
elongation to fracture.
Fracture surfaces were examined with a Zeiss Stemi 6 stereo microscope and an
FEI FEG-650 SEM equipped with an EDAX TEAM SDD 30mm2 energy dispersive x-
ray (EDS) detector. Projected fracture surface oxide and porosity fractions were
measured.
Microstructural analysis was conducted on selected tensile samples using optical
microscopy. Samples approximately parallel to and just below the tensile fracture
surfaces were removed and polished. Intermetallic size was measured using Image Pro
PlusTM
image processing software [28].

108
Results / discussion
Spectrographic analysis was used to determine the chemistry. Spectrometer
analysis of each chemistry button was conducted and the results are shown in Table 2.
All alloys were relatively close to the desired composition.
Table 2
Actual chemical compositions for each alloy
Alloy Zn (%) Mg (%) Cu (%)
1 7.9 4.9 0.9
2 8.1 2.1 0.9
3-1MPa 8.2 1.4 0.9
3-0.1MPa 7.9 1.4 0.9
4 13.1 7.3 1.0
5 12.5 3.4 0.8
6 12.4 2.0 0.6
Tensile results were recorded. Tensile results for all alloys and conditions are
summarized in Table 3. The tensile properties for the SUP samples and the
corresponding atmospheric samples for alloy 3-0.1MPa (7.9Zn-1.4Mg) are shown in
Figure 4. The properties for the chill and HIPed samples are illustrated in Figures 5 and
6, respectively. In the SUP, chill and HIPed samples, both of the alloys with 12.5% zinc
(alloys 5 and 6) and the alloy with 8% zinc and 5% magnesium (alloy 1) had very low
ductility and failed before yield. Only the two alloys with lower alloy content, alloy 2
(8.1Zn-2.1Mg) and alloy 3-1MPa (8.2Zn-1.4Mg), reached yield during tensile testing.
Of these two alloys, the higher zinc alloy (alloy 2, 8.1Zn-2.1Mg) had higher strength but
lower ductility. In this alloy, the yields ranged from 538 to 490MPa (78 to 71ksi) and the
elongation ranged from 1.7 to 3.6%. Alloy 3-1MPa had the lowest alloying additions at
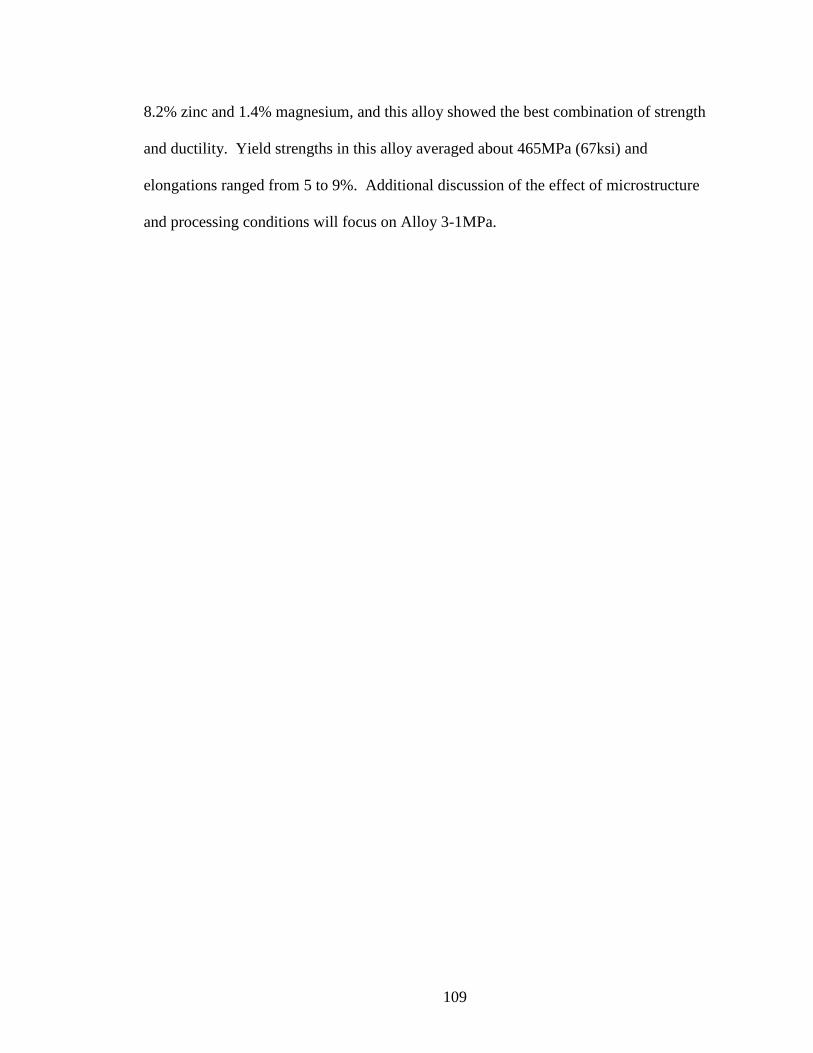
109
8.2% zinc and 1.4% magnesium, and this alloy showed the best combination of strength
and ductility. Yield strengths in this alloy averaged about 465MPa (67ksi) and
elongations ranged from 5 to 9%. Additional discussion of the effect of microstructure
and processing conditions will focus on Alloy 3-1MPa.
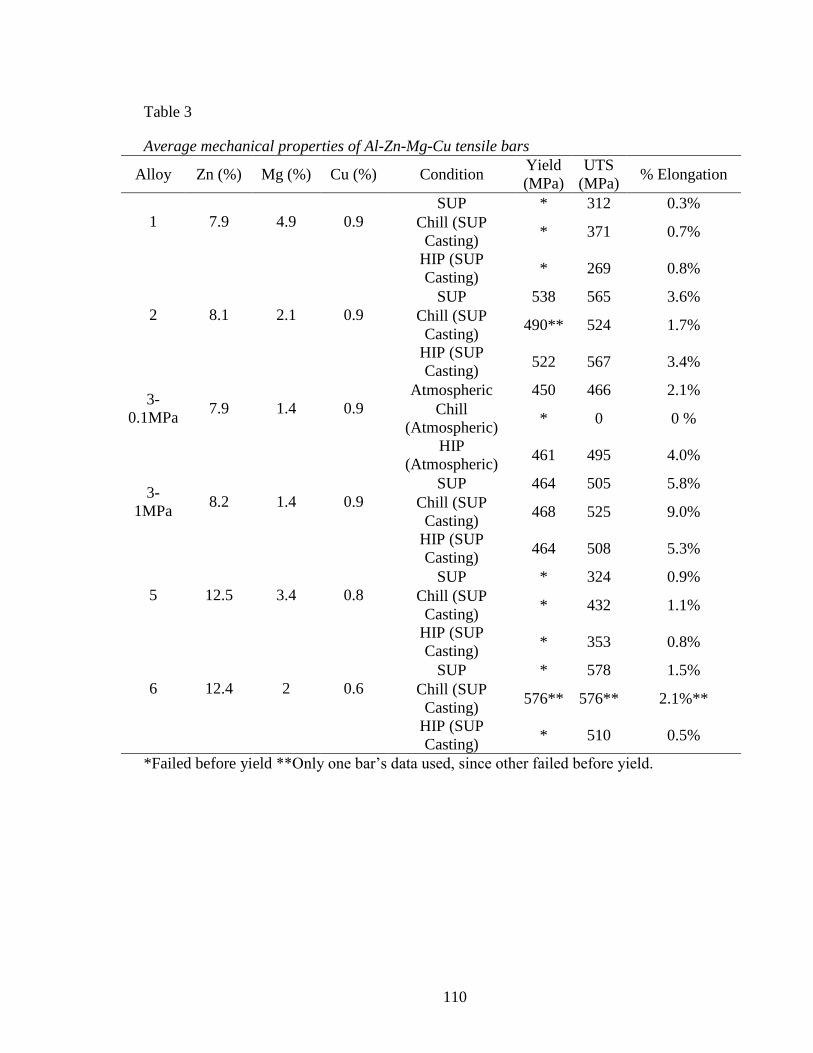
110
Table 3
Average mechanical properties of Al-Zn-Mg-Cu tensile bars
Alloy Zn (%) Mg (%) Cu (%) Condition Yield
(MPa)
UTS
(MPa) % Elongation
1
7.9
4.9
0.9
SUP * 312 0.3%
Chill (SUP
Casting) * 371 0.7%
HIP (SUP
Casting) * 269 0.8%
2
8.1
2.1
0.9
SUP 538 565 3.6%
Chill (SUP
Casting) 490** 524 1.7%
HIP (SUP
Casting) 522 567 3.4%
3-
0.1MPa
7.9
1.4
0.9
Atmospheric 450 466 2.1%
Chill
(Atmospheric) * 0 0 %
HIP
(Atmospheric) 461 495 4.0%
3-
1MPa
8.2
1.4
0.9
SUP 464 505 5.8%
Chill (SUP
Casting) 468 525 9.0%
HIP (SUP
Casting) 464 508 5.3%
5
12.5
3.4
0.8
SUP * 324 0.9%
Chill (SUP
Casting) * 432 1.1%
HIP (SUP
Casting) * 353 0.8%
6
12.4
2
0.6
SUP * 578 1.5%
Chill (SUP
Casting) 576** 576** 2.1%**
HIP (SUP
Casting) * 510 0.5%
*Failed before yield **Only one bar’s data used, since other failed before yield.
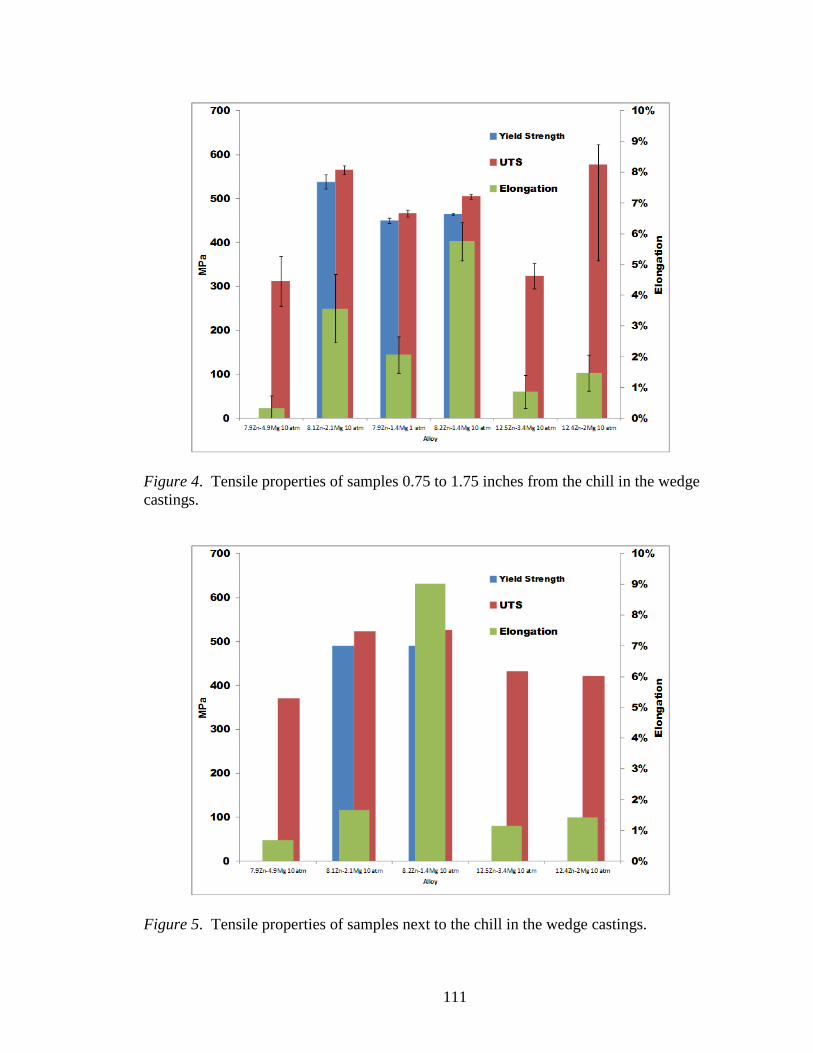
111
Figure 4. Tensile properties of samples 0.75 to 1.75 inches from the chill in the wedge
castings.
Figure 5. Tensile properties of samples next to the chill in the wedge castings.

112
Figure 6. Tensile properties of the HIPed samples in the wedge castings.
The combined effects of solidification under pressure and the distance from the
chilled were studied. The effect of SUP and distance from chill on percent elongation in
alloy 3-1MPa (8.2Zn-1.4Mg) and 3-0.1MPa (7.9Zn-1.4Mg) are shown in Figure 7. It
should be noted that the sample closest to the chill would not experience the full effect of
pressurization since solidification was completed before the full pressure was applied. In
the SUP casting, the chill sample had the highest elongation at about 9% and at greater
distances from the chill, the elongation dropped down to around 5 to 6%.
Solidification under pressure had a marked effect on elongation even in the
chilled sample. It was expected that the chilled sample in the conventionally solidified
wedge would have similar elongation values to that of the of the SUP chill sample. In
addition, the elongation would be expected to be lower in the remainder of the 0.1MPa
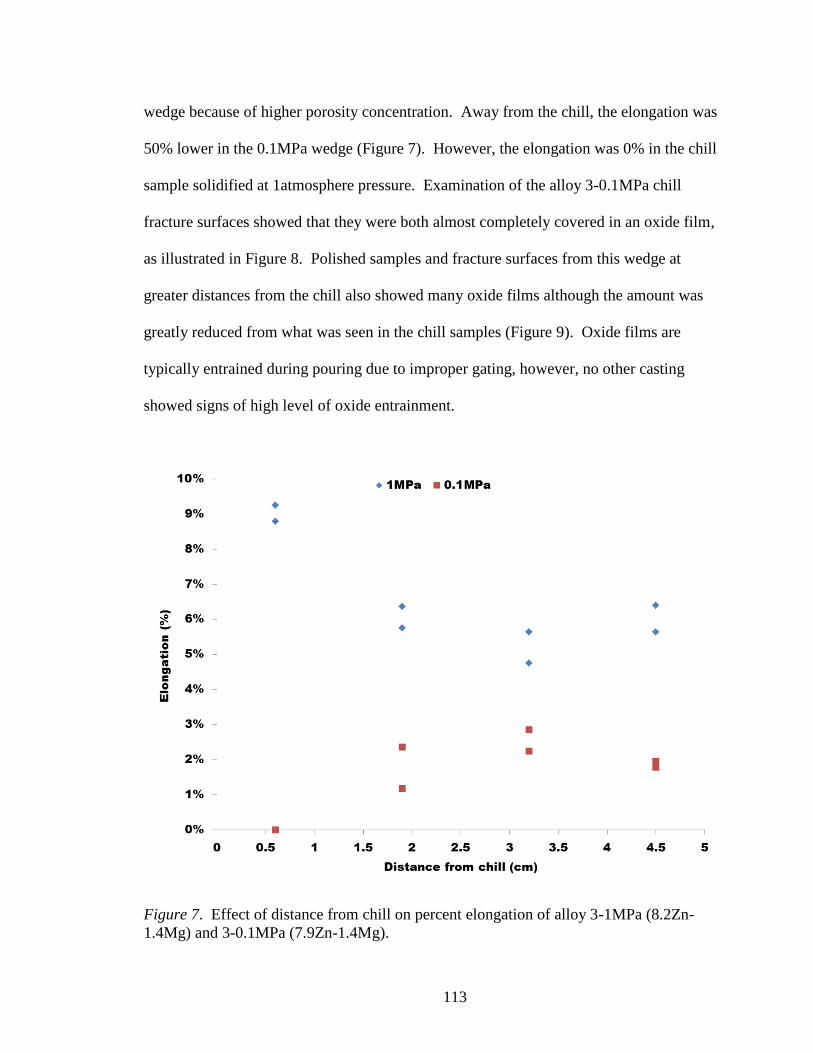
113
wedge because of higher porosity concentration. Away from the chill, the elongation was
50% lower in the 0.1MPa wedge (Figure 7). However, the elongation was 0% in the chill
sample solidified at 1atmosphere pressure. Examination of the alloy 3-0.1MPa chill
fracture surfaces showed that they were both almost completely covered in an oxide film,
as illustrated in Figure 8. Polished samples and fracture surfaces from this wedge at
greater distances from the chill also showed many oxide films although the amount was
greatly reduced from what was seen in the chill samples (Figure 9). Oxide films are
typically entrained during pouring due to improper gating, however, no other casting
showed signs of high level of oxide entrainment.
Figure 7. Effect of distance from chill on percent elongation of alloy 3-1MPa (8.2Zn-
1.4Mg) and 3-0.1MPa (7.9Zn-1.4Mg).

114
Figure 8. Stereo microscope image of fractured tensile surface from alloy 3-0.1MPa
(7.9Zn-1.4Mg), chill sample. Fracture surface is almost completely covered with an
oxide film.
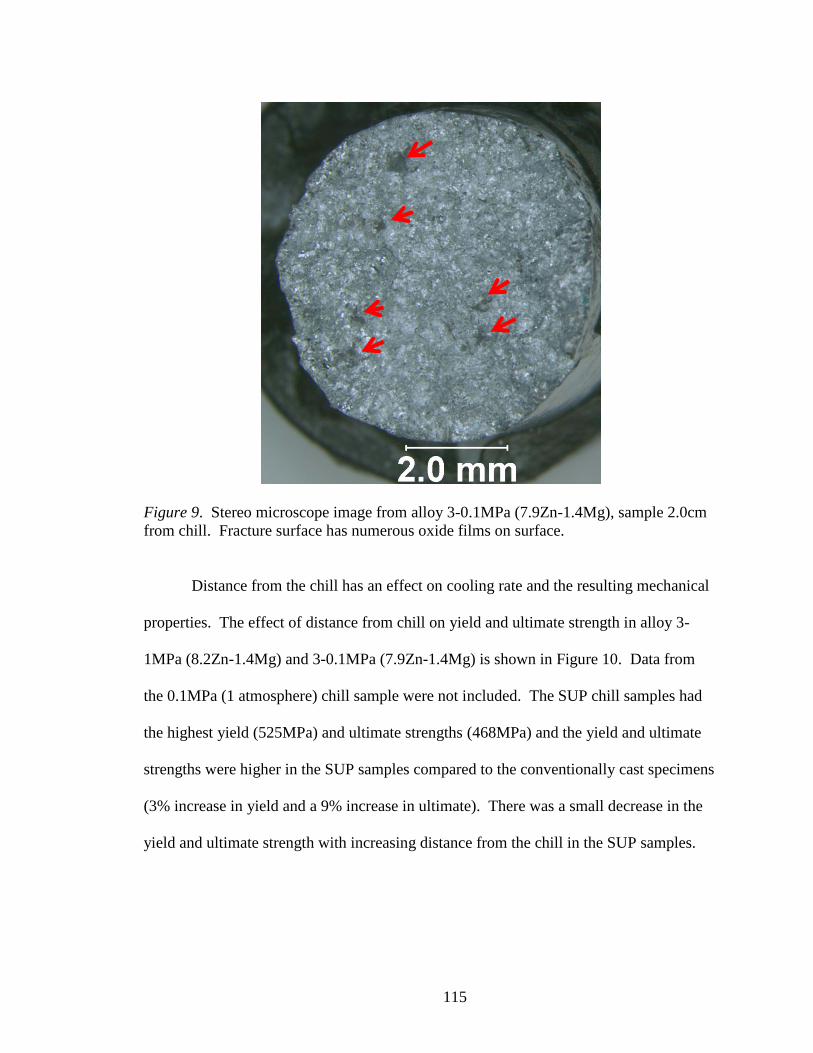
115
Figure 9. Stereo microscope image from alloy 3-0.1MPa (7.9Zn-1.4Mg), sample 2.0cm
from chill. Fracture surface has numerous oxide films on surface.
Distance from the chill has an effect on cooling rate and the resulting mechanical
properties. The effect of distance from chill on yield and ultimate strength in alloy 3-
1MPa (8.2Zn-1.4Mg) and 3-0.1MPa (7.9Zn-1.4Mg) is shown in Figure 10. Data from
the 0.1MPa (1 atmosphere) chill sample were not included. The SUP chill samples had
the highest yield (525MPa) and ultimate strengths (468MPa) and the yield and ultimate
strengths were higher in the SUP samples compared to the conventionally cast specimens
(3% increase in yield and a 9% increase in ultimate). There was a small decrease in the
yield and ultimate strength with increasing distance from the chill in the SUP samples.
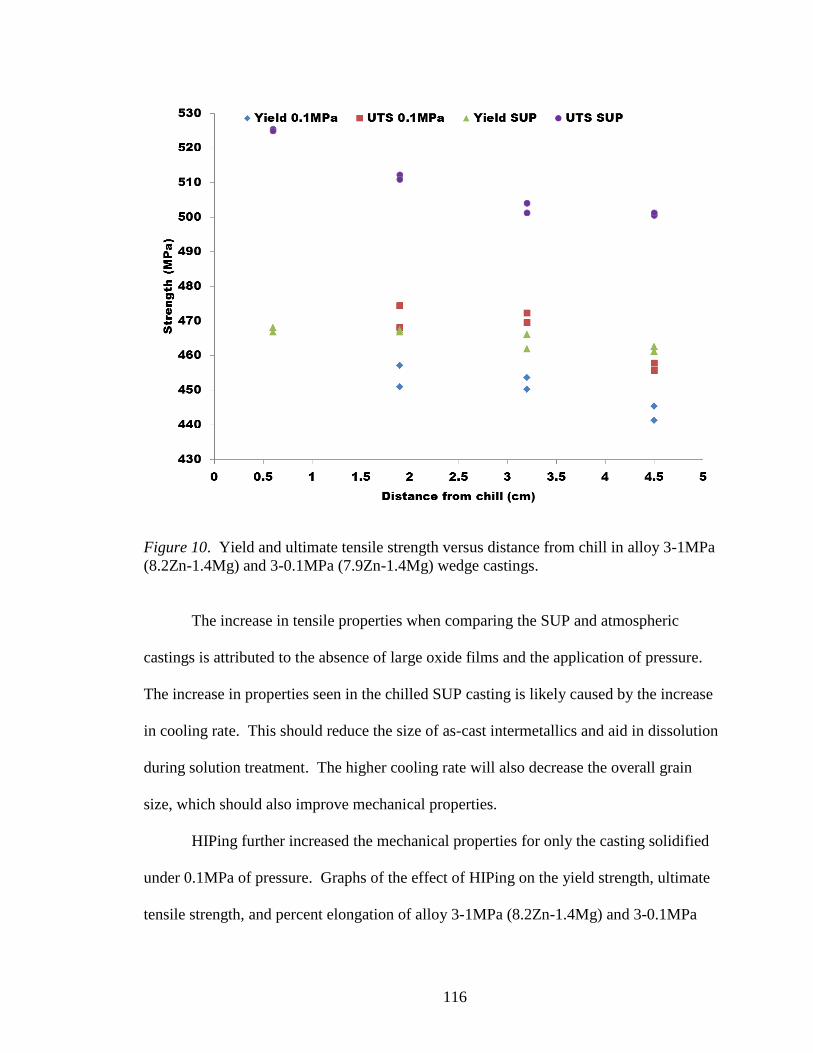
116
Figure 10. Yield and ultimate tensile strength versus distance from chill in alloy 3-1MPa
(8.2Zn-1.4Mg) and 3-0.1MPa (7.9Zn-1.4Mg) wedge castings.
The increase in tensile properties when comparing the SUP and atmospheric
castings is attributed to the absence of large oxide films and the application of pressure.
The increase in properties seen in the chilled SUP casting is likely caused by the increase
in cooling rate. This should reduce the size of as-cast intermetallics and aid in dissolution
during solution treatment. The higher cooling rate will also decrease the overall grain
size, which should also improve mechanical properties.
HIPing further increased the mechanical properties for only the casting solidified
under 0.1MPa of pressure. Graphs of the effect of HIPing on the yield strength, ultimate
tensile strength, and percent elongation of alloy 3-1MPa (8.2Zn-1.4Mg) and 3-0.1MPa
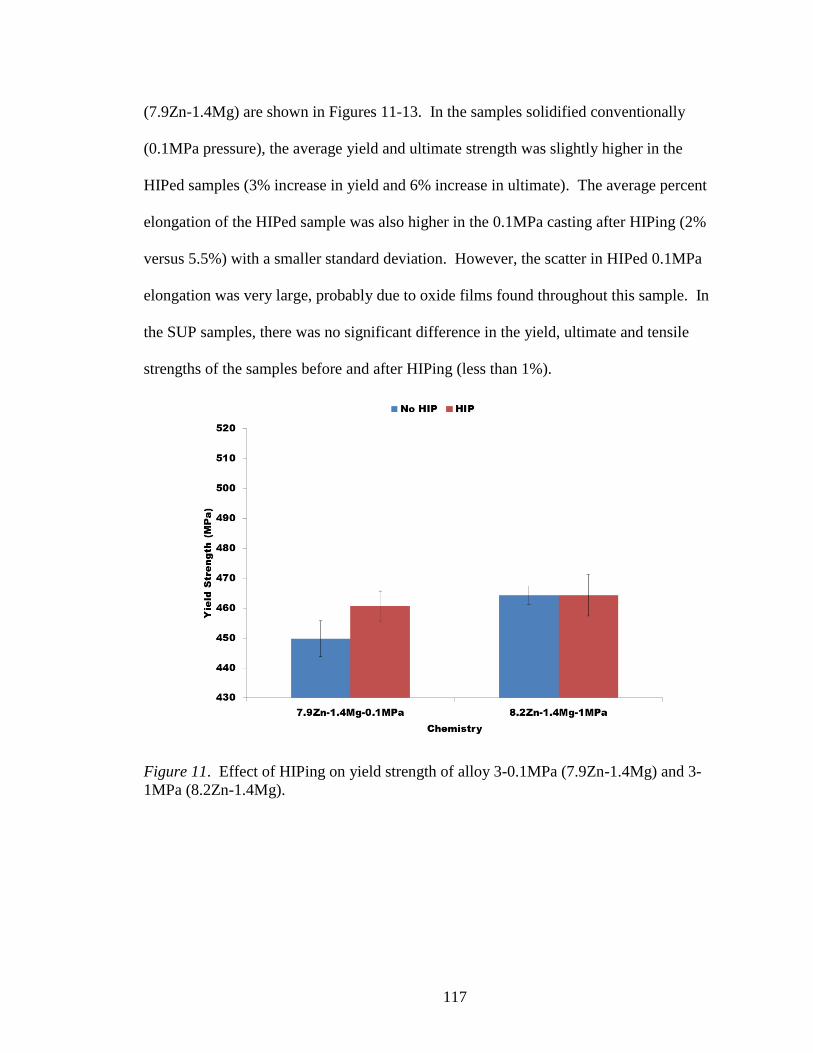
117
(7.9Zn-1.4Mg) are shown in Figures 11-13. In the samples solidified conventionally
(0.1MPa pressure), the average yield and ultimate strength was slightly higher in the
HIPed samples (3% increase in yield and 6% increase in ultimate). The average percent
elongation of the HIPed sample was also higher in the 0.1MPa casting after HIPing (2%
versus 5.5%) with a smaller standard deviation. However, the scatter in HIPed 0.1MPa
elongation was very large, probably due to oxide films found throughout this sample. In
the SUP samples, there was no significant difference in the yield, ultimate and tensile
strengths of the samples before and after HIPing (less than 1%).
Figure 11. Effect of HIPing on yield strength of alloy 3-0.1MPa (7.9Zn-1.4Mg) and 3-
1MPa (8.2Zn-1.4Mg).

118
Figure 12. Effect of HIPing on ultimate tensile strength of alloy 3-0.1MPa (7.9Zn-
1.4Mg) and 3-1MPa (8.2Zn-1.4Mg).
Figure 13. Effect of HIPing on percent elongation of alloy 3-0.1MPa (7.9Zn-1.4Mg) and
3-1MPa (8.2Zn-1.4Mg).
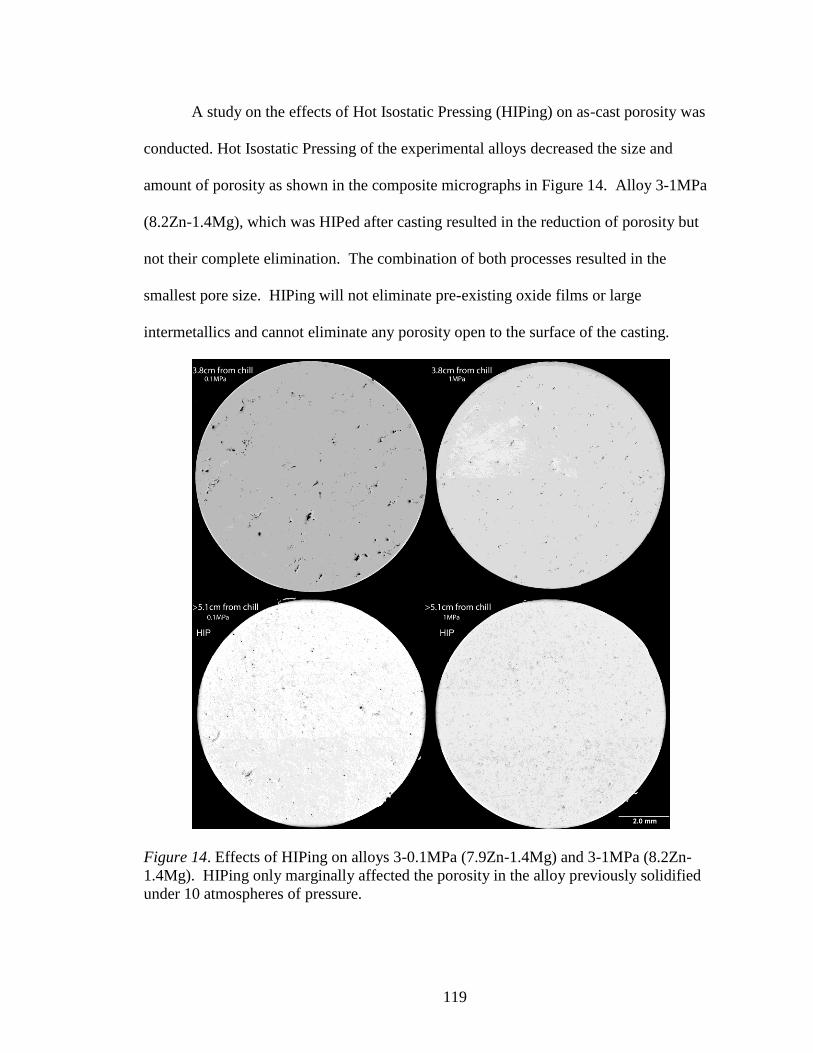
119
A study on the effects of Hot Isostatic Pressing (HIPing) on as-cast porosity was
conducted. Hot Isostatic Pressing of the experimental alloys decreased the size and
amount of porosity as shown in the composite micrographs in Figure 14. Alloy 3-1MPa
(8.2Zn-1.4Mg), which was HIPed after casting resulted in the reduction of porosity but
not their complete elimination. The combination of both processes resulted in the
smallest pore size. HIPing will not eliminate pre-existing oxide films or large
intermetallics and cannot eliminate any porosity open to the surface of the casting.
Figure 14. Effects of HIPing on alloys 3-0.1MPa (7.9Zn-1.4Mg) and 3-1MPa (8.2Zn-
1.4Mg). HIPing only marginally affected the porosity in the alloy previously solidified
under 10 atmospheres of pressure.

120
The effect of fracture surface porosity and oxides on elongation was studied.
Projected fracture surface porosity and oxide film measurements were performed on all
alloy 3-1MPa (8.2Zn-1.4Mg) tensile samples; the 0.1MPa chill samples are not included.
Higher anomaly concentrations on the fracture surface reduced the ductility of the
samples. However, in a number of the SUP samples there were no anomalies found on
the fracture surface, and the elongation of these samples was still lower than the SUP
chill samples (Figure 15), which is likely due to the higher cooling rate and the resulting
smaller grain size.
Microstructural analysis was also conducted on the samples. Microstructural
analysis of the chilled and HIPed 1MPa (10 atmosphere) was conducted. The HIPed
tensile bars were machined from blanks with a much slower cooling rate compared to the
chill samples tensile bars and the intermetallic size significantly increased as the cooling
rate decreased (Figures16 and 17). These results show that the brittle intermetallics
affected the ductility of the tensile samples. Higher cooling rates during solidification are
required to ensure ductility in this alloy, even when porosity is eliminated in order to
limit the size of the intermetallics.

121
Figure 15. Effect of fracture surface porosity and oxide films on percent elongation of
alloys 3-1MPa (8.2Zn-1.4Mg) and 3-0.1MPa (7.9Zn-1.4Mg) samples.
Figure 16. Microstructure of chill and HIPed sample in SUP alloy 3-1MPa (8.2Zn-
1.4Mg) casting.

122
Figure 17. Average intermetallic size in SUP alloy 3-1MPa (8.2Zn-1.4Mg) casting.
Summary
Six Al-Zn-Mg-Cu alloys were produced. Zinc concentrations ranged from 8 to
12% and magnesium concentrations ranged from 1.4 to 5%. All alloys were solidified
under 1MPa of pressure and poured into a well risered, filtered, and properly gated,
wedge-shaped mold with a large chill on the thinnest section of the wedge to provide a
variety of cooling rates. In addition, wedges with the highest and lowest alloying
additions were conventionally cast at 0.1MPa pressure (atmospheric).
Tensile samples were tested from various locations in the wedge to provide a
range of cooling rates. HIPed samples were tested for comparison purposes. The
composition with the highest alloying content (Alloy 4 (13.1Zn-7.3Mg)) was in the
eutectic range and had large intermetallics which would not dissolve during solution
treatment. Because of this, tensile bars were not analyzed from this alloy.
123
Elongations were very low in alloys 1 (8Zn-5Mg), 5 (12Zn-3Mg), and 6 (12Zn-
2Mg). These alloys failed before 0.2% offset yielding. Alloy 2 (8Zn-2Mg) provided the
highest strength; however, its elongation was limited. The best combination of strength
and ductility was obtained at the lowest alloying additions in alloy 3-1MPa (8.2Zn-
1.4Mg).
The conventional cast wedge produced with alloy 3-0.1MPa (7.9Zn-1.4Mg)
contained unusually high level of oxide films in both the tensile fracture surfaces and
polished microstructure. The source of these oxides is unknown and their presence
makes the tensile data suspect.
Solidification under pressure reduced the porosity in alloy 3-1MPa (8.2Zn-1.4Mg)
compared to the conventionally cast alloy. Furthermore, there was some reduction in
porosity in the HIPed samples in both the conventionally and SUP cast wedges.
However, HIPing only improved the conventionally cast tensile properties.
The best properties were achieved in the low alloy casting 3-1MPa (8.2Zn-1.4Mg)
with the highest solidification rate. In the chilled SUP casting, a yield strength of
468MPa (68ksi), tensile strength of 525MPa (76ksi), and elongation of 9% was achieved.
Ductility and strength decreased as the cooling rate decreased. These results show that
intermetallics are dominating the ultimate strength and elongation when porosity is
minimized. Higher solidification cooling rates are required to ensure ductility in this
alloy, even when porosity is eliminated.
124
ACKNOWLEDGMENTS
The authors would like to thank Joe Jablonsky, Ricardo Aristizbal, and Grant
Ethridge for their aid in casting and microstructural analysis.
“Research was sponsored by the U.S. Army Contracting Command Joint
Munitions & Lethality Contracting Center, Picatinny, NJ on behalf of Benet Laboratories,
and was accomplished under Cooperative Agreement Number W15QKN-10-2-0001. The
views and conclusions contained in this document are those of the authors and should not
be interpreted as representing the official policies, either expressed or implied, of Benet
Laboratories or the U.S. Government. The U.S. Government is authorized to reproduce
and distribute reprints for Government purposes notwithstanding any copyright notation
heron.”
FUTURE WORK
Future work includes further work to refine / define other possible cast Al-Zn-
Mg-Cu alloys. Technology implementation of the successful alloys will be conducted by
producing parts, which in the past were fabrications, and casting them using the
solidification under pressure process. Understanding the effects of oxide films on the
mechanical properties of these alloys may also yield valuable information in the pursuit
of creating lower cost ultra-high strength cast aluminum.
125
REFERENCES
1. Hatch, John. ed. Aluminum: Properties and Physical Metallurgy. Metals Park:
American Society for Metals.1984. 155; 238-39; 271. Print.
2. ASM International. ASM Handbook: Properties and Selection: Nonferrous Alloys and
Special-Purpose Materials. Materials Park: ASM International. 1990. Print.
3. ASM International. Metallography, Structures and Phase Diagrams, Metals
Handbook. Metals Park: American Society for Metals. 1973. 259. Print.
4. Stumpf, H. Unpublished Research at Alcoa Laboratories. 1965-1971. Print.
5. Clinch, M., Daval, R., Harris, S., Hepples, W., Holryoyd, N., Lawday, M., Noble, B.
“A Microstructural Engineering-Based Approach to Al-Zn-Mg-Cu Series Alloy
Optimization.” Institute of Materials Engineering Australasia Ltd, Materials Forum.
2004: vol. 28. Print.
6. Druschitz, Alan. Griffin, John. “Advanced Cast Aluminum Alloys.” Shape Casting:
3rd
International Symposium, Warrendale: TMS. 2009. 53-60. Print.
7. Senkov, O., Druschitz, A., Senkova, S., Kendig, K., Griffin, J. “Ultra-High Strength
Sand Castings from Aluminum Alloys 7042.” TMS 2011 Annual Meeting and
Exposition. Warrendale: TMS. 2011. Print.
8. Rokhlin, L., Dobatkina, T., Bochvar, N., Lysova, E. “Investigation of phase equilibria
in alloys of the Al-Zn-Mg-Cu-Zr-Sc system.” Journal of Alloys and Compounds.
2004: 10-6. Print.
9. Raghavan, V. “Al-Mg-Zn (Aluminum-Magnesium-Zinc),” Phase Diagram
Evaluations: Section II, Journal of Phase Equilibria and Diffusion. 2007: Vol. 28, No.
2. Print.
10. Andreatta, F., Lohrengel, M., Terryn, H., de Wit, J. “Electrochemical
Characterization of Aluminum AA7075-T6 and Solution Heat Treated AA7075 using
a Micro-Capillary Cell.” Electrochimica Acta. 2003: 3239-3247. Print.
11. Shastry, C., Levy, M., Joshi, A. “The Effects of Solution Treatment Temperature on
Stress Corrosion Susceptibility of 7075 Aluminum Alloys.” Corrosion Science. 1981:
Vol. 21. 673-688. Print.
12. Clinch, M., Harris, S., Hepples, W., Holroyd, N., Lawday, M. and Noble, B.
“Influence of Zinc to Magnesium Ratio and Total Solute Content on the Strength and
Toughness of Al-Zn-Mg-Cu series Alloys.” Materials Science Forum. 2006: vol. 519-
521. Print.

126
8. OVERALL SUMMARY
BAC 100TM
:
Mechanical properties of the seat fame castings were: (1) high strength yield
strength of 393MPa (57ksi), UTS of 429MPa (62ksi), and strain to failure of 2.6%
and (2) high toughness yield strength of 332MPa (48ksi), UTS of 394MPa
(57ksi), and strain to failure of 3.4%.
Mechanical properties for high toughness separately cast tensile bar castings
produced at a commercial foundry were a yield strength of 301MPa (44ksi), UTS
of 407MPa (59ksi), and a strain to failure of 6.4%.
Stress corrosion cracking results varied widely, none of the high strength castings
achieved the goal of 20 days. At least one of each high toughness samples lasted
for the desired 20 days. The wide variation in ductility may account for the
variation in the stress corrosion cracking results.
Fatigue testing at 87 and 102 % of the average yield strength for high toughness
seat frame castings resulted in test durations of greater than 100,000 and 10,000
cycles, respectively. Samples tested at 63% of the average yield for the high
toughness seat frame castings resulted in two run outs at one million cycles and
one early failure at a defect in the test bar radius at 258,014 cycles.
HIPing did not completely eliminate the porosity in the seat frame samples used
in the tensile, stress corrosion cracking, and fatigue testing. This porosity likely
decreased the resulting properties in the stress corrosion and fatigue samples and
increased the variability in the results.

127
In samples without visible tensile fracture surface defects, low ductility was
attributed to intermetallic phases that formed during solidification of the castings
and did not dissolved during heat treatment.
o Two different intermetallics were identified and included CuAl2 and an
Al-Cu-Fe-Mn intermetallic.
o Solution treatment times up to 75 hours were necessary to dissolve most of
the intermetallic CuAl2 that formed.
Faster cooling rates or a reduction in copper concentration might increase the
ductility of the alloy by decreasing the size of the intermetallics that form during
solidification.
Al-Zn-Mg-Cu:
At the highest alloy content (13.1Zn-7.3Mg) a large amount of eutectic structure
formed, such that no solution treating temperature and time would have re-
dissolved it, short of re-melting. Castings produced with lower alloying additions
contained less intermetallics.
SEM EDS analysis showed the intermetallic particles had two different
chemistries including an intermetallic phase with aluminum that was rich in
magnesium, zinc, and copper; and an unwanted intermetallic phase that contained
aluminum, iron, magnesium, and silicon with traces of zinc, nickel, and copper.
The first intermetallic was significantly dissolved during heat treatment while the
second was stable. These results indicate that the iron concentration should be
minimized in these samples to increase ductility.
128
X-ray diffraction showed that the age hardening precipitates in these alloys
matched well with T phase (Mg32Zn31.9Al17.1), a cubic crystal structure.
DSC confirmed that lower alloy contents resulted in easier intermetallic
dissolution. This is likely due to the smaller, more isolated intermetallic
distribution. Precipitation began at a higher temperature in the lower alloy
samples. This is likely caused by the amount of alloy in solution and its readiness
to re-precipitate.
Heat treating of ultra-high strength cast Al-Zn-Mg-Cu has been optimized for
maximum hardness. Samples were solution treated at 441°C (826°F) for four
hours before ramping to 460°C (860°F) for 75 hours and then aged at 120°C
(248°F) for 75 hours.
Tensile samples were tested from various locations in the wedge to provide a
range of cooling rates. HIPed samples were tested for comparison purposes. The
composition with the highest alloying content (Alloy 4 (13.1Zn-7.3Mg)) was in
the eutectic range and had large intermetallics which would not dissolve during
solution treatment. Because of this, tensile bars were not analyzed from this
alloy.
Elongations were very low in alloys 1 (8Zn-5Mg), 5 (12Zn-3Mg), and 6 (12Zn-
2Mg). These alloys failed before 0.2% offset yielding. Alloy 2 (8Zn-2Mg)
provided the highest strength; however, its elongation was limited. The best
combination of strength and ductility was obtained at the lowest alloying
additions in alloy 3-1MPa (8.2Zn-1.4Mg).
129
The conventional cast wedge produced with alloy 3-0.1MPa (7.9Zn-1.4Mg)
contained unusually high levels of oxide films in both the tensile fracture surfaces
and polished microstructure. The source of these oxides is unknown and their
presence makes the tensile data suspect.
Solidification under pressure reduced the porosity in alloy 3-1MPa (8.2Zn-1.4Mg)
compared to the conventionally cast alloy. Furthermore, there was some
reduction in porosity in the HIPed samples in both the conventionally and SUP
cast wedges. However, HIPing only improved the conventionally cast tensile
properties.
The best properties were achieved in the low alloy casting 3-1MPa (8.2Zn-1.4Mg)
with the highest solidification rate. In the chilled SUP casting, a yield strength of
468MPa (68ksi), tensile strength of 525MPa (76ksi), and elongation of 9% was
achieved. Ductility and strength decreased as the cooling rate decreased. These
results show that intermetallics are dominating the ultimate strength and
elongation when porosity is minimized. Higher solidification cooling rates are
required to ensure ductility in this alloy, even when porosity is eliminated.
130
9. GENERAL REFERENCES
1. ASM International. ASM Handbook: Properties and Selection: Nonferrous Alloys and
Special-Purpose Materials. Materials Park: ASM International. 1990. Print.
2. Hatch, John. Aluminum: Properties and Physical Metallurgy. Metals Park: American
Society for Metals. 1984. 143-155, 226-240. Print.
3. Davis, Joseph. ed. ASM Specialty Handbook: Aluminum and Aluminum Alloys.
Materials Park: ASM International. 1993. 706-711. Print.
4. ASM International. Metallography, Structures and Phase Diagrams, Metals
Handbook. Metals Park: American Society for Metals. 1973. 259. Print.
5. Auld, J., Williams, B. “X-Ray powder data of T Phases Composed of Aluminum &
Magnesium with Silver Copper or Zinc.” Acta Crystallographica: Crystallographic
Journals Online. 1966: 21, 803. Web. Oct. 2012.
6. Senkov, O., Druschitz, A., Senkova, S., Kendig, K., Griffin, J. “Ultra-High Strength
Sand Castings from Aluminum Alloys 7042.” TMS 2011 Annual Meeting and
Exposition. Warrendale: TMS. 2011. Print.
7. Druschitz, Alan. Griffin, John. “Advanced Cast Aluminum Alloys.” Shape Casting:
3rd
International Sumposium, Warrendale: TMS. 2009. 53-60. Print.
8. Askeland, D., Phule’, R. ed. The Science and Engineering of Materials. Stamford:
Cengage Learning. 2008. 5th
ed. Print.
9. Ruff, G., Prucha, T., Barry, J., and Patterson, D. “SAE Technical Paper No. 2001-01-
0411: Pressure Counter Pressure Casting (PCPC) for Automotive Aluminum
Structural Components.” Warrendale: Society of Automotive Engineers. 2001. Print.
10. Borovkov, Maxim. Bubbles in water: vector illustration. 123rf.com. web. Image ID:
2146464. June. 2012.
11. Thomas, J.A. “The Castyral R Process – Improvements to the Lost-Foam Process
Development in Light Alloy Castings.” Stratford-upon-Avon: Conference
Proceedings at Moat House International Hotel. 1989. Print.
12. Donahue, R. “New Developments that Improve Competitiveness and Open Market
Opportunities.” Lost Foam Casting Congress. 2001. Print.
13. Uram, S., Fleming, M., and Taylor, H. “AFS Transactions: Effect of Pressure during
Solidification on Microporosity in Aluminum Alloys.” Schaumburg: American
Foundry Society. 1958: Vol. 66. 129-134. Print.

131
14. Sabau, A., Viswanathan, S. “Porosity Prediction in Aluminum A356 Alloy Castings.”
Oak Ridge: Oak Ridge National Laboratory. 2008. Print.
15. ASTM International. “ASTM E8-04 Standard Test Methods for Tension Testing of
Metallic Materials.” West Conshohocken: ASTM International. 2011. Print.
16. ASTM International. “ASTM B557-02 Standard Test Methods of Tension Testing
Wrought and Cast Aluminum and Magnesium Alloy Products.” West
Conshohocken: ASTM International. 2010. Print.
17. ASTM International “ASTM G49-85: Standard Practice for Preparation and Use of
Direct Tension Stress-Corrosion Test Specimens.” West Conshohocken: ASTM
International. 2011. Print.
18. ASTM International. “ASTM 466-07 Standard Practice for Conducting Force
Controlled Constant Amplitude Axial Fatigue Tests of Metallic Materials.” West
Conshohocken: ASTM International. 2007. Print.
19. Image-Pro Plus [image analysis software]. Rockville: Media Cybernetics INC. 2012.
20. Stumpf, H. Unpublished Research at Alcoa Laboratories. 1965-1971. Print.
21. Clinch, M,. Harris, S., Hepples, W., Holroyd, N., Lawday, M. and Noble, B.
“Influence of Zinc to Magnesium Ratio and Total Solute Content on the Strength and
Toughness of Al-Zn-Mg-Cu series Alloys.” Materials Science Forum. 2006: vol. 519-
521. Print.
22. Rokhlin, L., Dobatkina, T., Bochvar, N., Lysova, E. “Investigation of phase
equalibiria in alloys of the Al-Zn-Mg-Cu-Zr-Sc system.” Journal of Alloys and
Compounds. 2004: 10-6. Print.
23. Raghavan, V. “Al-Mg-Zn (Aluminum-Magnesium-Zinc),” Phase Diagram
Evaluations: Section II, Journal of Phase Equilibria and Diffusion. 2007: Vol. 28, No.
2. Print.
24. Andreatta, F., Lohrengel, M., Terryn, H., de Wit, J. “Electrochemical
Characterization of Aluminum AA7075-T6 and Solution Heat Treated AA7075 using
a Micro-Capillary Cell.” Electrochimica Acta. 2003: 3239-3247. Print.
25. Shastry, C., Levy, M., Joshi, A. “The Effects of Solution Treatment Temperature on
Stress Corrosion Susceptibility of 7075 Aluminum Alloys.” Corrosion Science. 1981:
Vol. 21. 673-688. Print.
26. Clinch, M., Daval, R., Harris, S., Hepples, W., Holryoyd, N., Lawday, M., Noble, B.
“A Microstructural Engineering-Based Approach to Al-Zn-Mg-Cu Series Alloy
Optimization.” Institute of Materials Engineering Australasia Ltd, Materials Forum.
2004: vol. 28. Print.

132
27. Senkov, Oleg. Senkova, Svetlana. Mendiratta, Madan. Miracle, Daniel. “Method of
Making a High Strength Aluminum Alloy Composition.” U.S. Patent # 7,048,815.
2006.
28. Druschitz, Alan. “High strength, high toughness, weldable, ballistic quality, castable
aluminum alloy, heat treatment for same and articles produced from same.” US patent
Application 20070102071. 2007. Print.
29. Campbell, J. ed. Casting Practice: The 10 Rules of Castings. Oxford: Elsevier
Linacre House, Jordan Hill. 2008. Page #. Print.
30. Wang, Q., Jones, P., and Osborne, M. “SAE Technical Paper No. 2003-01-0823:
Effect of Iron on the Microstructure and mechanical Properties of an Al-7%Si-
0.4%Mg Casting Alloy.” Warrendale: Society of Automotive Engineers. 2003. Print.
31. Chintalapati, P., Griffin, J., and Griffin, R. “Effect of Applied Isostatic Pressure
during Solidification on the Microstructure and Mechanical Properties of Aluminum
Alloy A206.” Schaumburg: American Foundry Society. 2008. Print.
32. Chintalapati, P., Griffin, J., Griffin, R., Littleton, H. “Effect of Applied Isostatic
Pressure during Solidification on Static Mechanical Properties of Lost Foam
Aluminum Castings.” Detroit: Materials Science and Technology 2007 Conference
and Exhibition. 2007. Print.
33. Ghanti, S., Druschitz, E., Druschitz, A. and Griffin, J. “The Effects of Solidification
Under Pressure on the Microstructural and Mechanical Properties of Cast Aluminum
Alloys.” Pittsburg: Materials Science and Technology Proceedings: Forming of
Lightweight Materials. 2009. Print.
34. Hunt, J. “Steady State Columnar and Equiaxed Growth of Dendrites and Eutectic.”
Materials Science and Engineering. 1984: Vol. 65. 75-83. Print.
35. Backerud, L. “Kinetic aspects of the solidification of binary and ternary alloy
systems.” Uppsala: Almquist & Wiksell. 1968: Vol. 152. 109-138. Print.
36. Kattamis, T., Coughlin, J., Flemings, M. “Influence of Coarsening on Dendrite Arm
Spacing of Aluminum-Copper Alloys.” TMS-AIME. 1976: Vol. 239. 1504. Print.
37. AMS-A-21180A. “Aluminum Alloy Castings, High Strength, Area Meca.”
Warrendale: SAE International. 2005. 23. Print.
38. Starink, M. J. Wang, S. C. “A model for the Yield Strength of Overaged Al-Zn-Mg-
Cu Alloy.” Acta Mater. 2003: Vol. 51. 5131-5150. Print.


