
HEINRICH EVENTS: MASSIVE LATE PLEISTOCENE
DETRITUS LAYERS OF THE NORTH ATLANTIC
AND THEIR GLOBAL CLIMATE IMPRINT
Sidney R. HemmingDepartment of Earth and Environmental Sciencesand Lamont-Doherty Earth Observatory of Columbia UniversityPalisades, New York, USA
Received 3 March 2003; revised 22 August 2003; accepted 30 September 2003; published 18 March 2004.
[1] Millennial climate oscillations of the glacial intervalare interrupted by extreme events, the so-called Heinrichevents of the North Atlantic. Their near-global footprint is atestament to coherent interactions among Earth’satmosphere, oceans, and cryosphere on millennialtimescales. Heinrich detritus appears to have been derivedfrom the region around Hudson Strait. It was deposited overapproximately 500 ± 250 years. Several mechanisms havebeen proposed for the origin of the layers: binge-purge cycleof the Laurentide ice sheet, jokulhlaup activity from aHudson Bay lake, and an ice shelf buildup/collapse fed byHudson Strait. To determine the origin of the Heinrich
events, I recommend (1) further studies of the timing andduration of the events, (2) further sedimentology study nearthe Hudson Strait, and (3) greater spatial and temporalresolution studies of the layers as well as their precursoryintervals. Studies of previous glacial intervals may alsoprovide important constraints. INDEX TERMS: 4267
Oceanography: General: Paleoceanography; 1040 Geochemistry:
Isotopic composition/chemistry; 1620 Global Change: Climate
dynamics (3309); 3022 Marine Geology and Geophysics: Marine
sediments—processes and transport; 1045 Geochemistry: Low-
temperature geochemistry; KEYWORDS: climate, Heinrich layers,
Heinrich events, ice-rafted detritus.
Citation: Hemming, S. R. (2004), Heinrich events: Massive late Pleistocene detritus layers of the North Atlantic and their global
climate imprint, Rev. Geophys., 42, RG1005, doi:10.1029/2003RG000128.
1. INTRODUCTION
[2] Few discoveries have focused the attention of the
paleoclimate community more than ‘‘Heinrich events,’’
which are documented in the North Atlantic as anomalous
occurrences of ice-rafted detritus (IRD) (Figures 1 and 2).
As pointed out by Bond et al. [1993] and Broecker [1994],
the timing of Heinrich events is in striking coincidence with
the pattern of climate fluctuations documented from ice
cores. There is also good evidence for a global, or at least a
Northern Hemisphere-wide, footprint [e.g., Broecker, 1994].
Although the mechanism that drives the events remains a
matter of debate, there is no doubt that they are spectacular
examples of interactions among Earth’s atmosphere, oceans,
and cryosphere [Broecker, 1994]. Most of the individual
studies of sites outside the North Atlantic ice-rafting zone
(Figures 3 and 4) conclude that the Heinrich-correlated
events are caused by changes in winds: stronger trade winds
in the tropics [e.g., Arz et al., 1998; see also McIntyre and
Molfino, 1996], stronger winter monsoon winds in China
[e.g., Porter and An, 1995; Wang et al., 2001] and the
Arabian Sea [e.g., Schulz et al., 1998], and stronger north-
erly winds in the western Mediterranean [e.g., Cacho et al.,
1999]. Lund and Mix [1998] also found evidence of greater
northeast Pacific ventilation at intervals approximately
coincident with Heinrich events. When compared to the
ambient glacial conditions, there appears to be a general
pattern of a tendency for wetter (milder?) conditions along
the western North Atlantic margin during Heinrich events
[e.g., Grimm et al., 1993] and perhaps along the eastern
South Atlantic margin [Little et al., 1997; Kanfoush et al.,
2000]. In contrast, more extreme cold/dry glacial conditions
prevailed during Heinrich intervals on the eastern North
Atlantic margin and western Mediterranean [e.g., Cacho et
al., 1999; Bard et al., 2000]. The pattern of difference in
Heinrich events compared to ambient glacial, as well as the
geographic distribution of sites that are sensitive to Heinrich
events, versus Dansgaard-Oeschger (D-O) events may pro-
vide important clues to the driving forces of these abrupt
climate changes. Global climate correlatives are discussed
in section 6.
[3] Heinrich [1988] documented layers with extremely
high lithic fragment percentages (approaching 100%) by
taking the ratio of lithic grains to total entities in the 180 mmto 3 mm (sand is 63 mm to 2 mm) sediment fractions of
sediment cores from the eastern North Atlantic (Figures 1
and 2). Several subsequent studies have found correlative
horizons of high lithic percentages or high magnetic sus-
ceptibility in a band approximately coinciding with the
North Atlantic Current (Table 1 and Figure 2) and the ice-
Copyright 2004 by the American Geophysical Union.
8755-1209/04/2003RG000128$15.00
Review of Geophysics, 42, RG1005 / 2004
1 of 43
Paper number 2003RG000128
RG1005
rafted detritus (IRD) belt of Ruddiman [1977]. The layers
are generally considered to fall within six brief time
intervals during the last glacial period, which are labeled
‘‘H1’’ through ‘‘H6’’ from youngest to oldest [Bond et al.,
1992; Broecker et al., 1992].
[4] In the North Atlantic the Heinrich layers are also
anomalous in their abundance of detrital carbonate [Bond
et al., 1992; Broecker et al., 1992]. Parallel observations
of high detrital carbonate concentrations within approxi-
mately correlative intervals [Andrews and Tedesco, 1992]
suggested that the Heinrich layers were formed by ‘‘arma-
das of icebergs’’ launched from Hudson Strait [Broecker et
al., 1992]. Hudson Strait is a major trough and likely the
location of an ice stream capable of draining the eastern
portion of the Laurentide ice sheet. MacAyeal [1993]
proposed a ‘‘binge-purge’’ mechanism, which could oper-
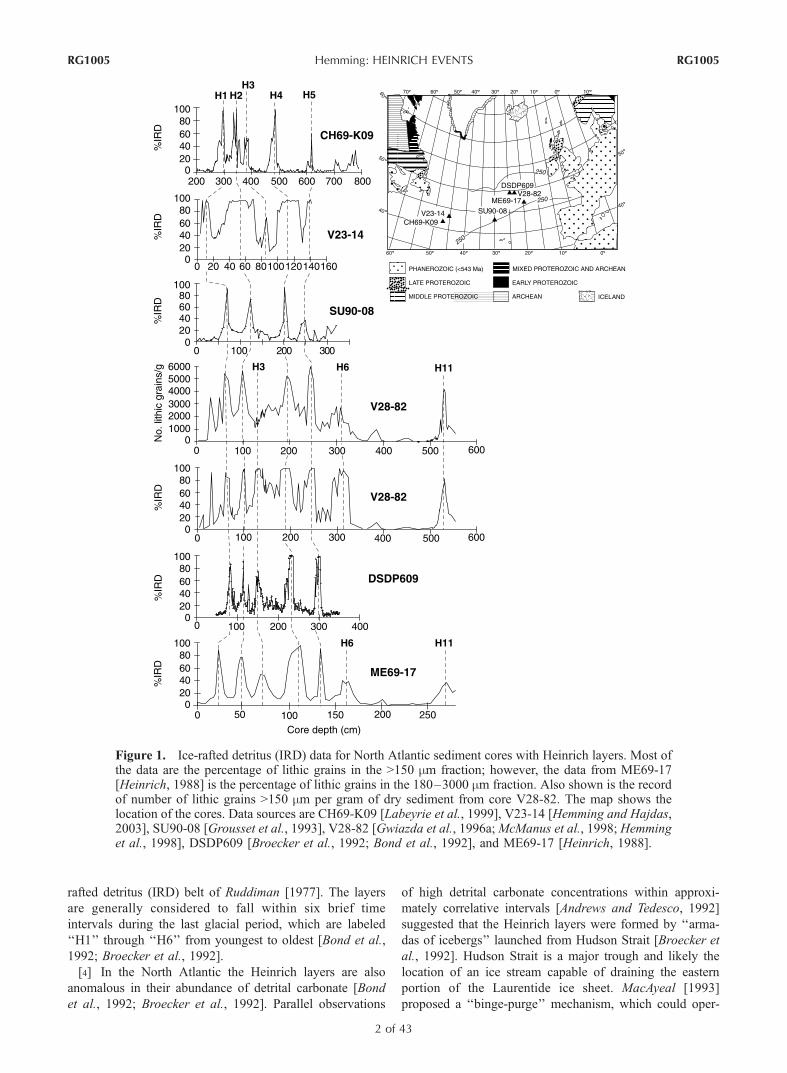
Figure 1. Ice-rafted detritus (IRD) data for North Atlantic sediment cores with Heinrich layers. Most ofthe data are the percentage of lithic grains in the >150 mm fraction; however, the data from ME69-17[Heinrich, 1988] is the percentage of lithic grains in the 180–3000 mm fraction. Also shown is the recordof number of lithic grains >150 mm per gram of dry sediment from core V28-82. The map shows thelocation of the cores. Data sources are CH69-K09 [Labeyrie et al., 1999], V23-14 [Hemming and Hajdas,2003], SU90-08 [Grousset et al., 1993], V28-82 [Gwiazda et al., 1996a;McManus et al., 1998; Hemminget al., 1998], DSDP609 [Broecker et al., 1992; Bond et al., 1992], and ME69-17 [Heinrich, 1988].
RG1005 Hemming: HEINRICH EVENTS
2 of 43
RG1005

ate independently of climate changes, to account for the
armadas of icebergs, and he further proposed that the
Paleozoic carbonates lining Hudson Bay and Hudson Strait
provided a relatively soft substrate that significantly helped
foster an ice stream. More recently, other models have
been proposed, but the notion of a binge-purge cycle
remains attractive. Bond et al. [1999] pointed out that
there is no doubt that the enormous amounts of ice
discharged during Heinrich events H1, H2, H4, and H5
require glaciological processes, probably involving mas-
sive surging or collapse of ice in Hudson Strait. However,
they also emphasize that the temporal pattern appears to
require a climate trigger.
[5] In the 10 years since Heinrich layers gained prom-
inence because of discoveries of North Atlantic and
Labrador Sea correlatives [Andrews and Tedesco, 1992;
Bond et al., 1992; Broecker et al., 1992], more than
200 papers have been published from studies of the layers
or purported global equivalents. In this paper I review the
research to date on Heinrich layers (events). I discuss the
ice-rafted detritus (section 2.1) setting that encompasses
them, the physical and chemical evidence that character-
izes them, the processes that may explain them, and the
global signals that may relate to them. It is important to
understand the global footprint of Heinrich events [e.g.,
Leuschner and Sirocko, 2000; Broecker and Hemming,
2001] and how it compares to that of the more frequent
Dansgaard-Oeschger cycles that are so prominent in the
Greenland ice cores. I use the information I have compiled
here to suggest a means of constraining the origin of
Heinrich layers and to propose key areas that need further
research.
2. BACKGROUND
2.1. Definition of Ice-Rafted Detritus
[6] Ice-rafted detritus (IRD) is sediment that was
entrained in floating ice, either icebergs or sea ice, and that
settled to the seafloor when the enclosing ice melted.
Considerable disagreement exists about the quantification
of IRD in marine sediment cores. Heinrich [1988] used the
percentage of IRD: the percentage of mineral or rock
fragments compared to all entities (what is not mineral or
rock fragments is almost exclusively foraminifera). Heinrich
counted the 180 mm to 3 mm fraction, whereas most
subsequent counts are from the >150 mm fraction, and some
from the Nordic Seas are from a much larger size fraction.
Another IRD indicator is the lithic portion, measured by
weight, of a sample’s coarse fraction.
[7] Three complications exist for choosing appropriate
grain-size intervals to study IRD. First, the coarse fraction
of marine sediments is generally small [Andrews, 2000].
Andrews [2000] has emphasized the point that the <63 mmfraction, not the >63 mm fraction, is far more abundant and
representative in glacial deposits on land and near marine
outlets. In core V28-82, Heinrich layers H1, H2, H4, and H5
contain approximately 5000–6000 lithic grains (>150 mm)
per gram of dry bulk sediment, and H3 and H6 have only
about 3000 (see Figure 5). Second, the provenance of
sediments eroded by glaciers profoundly influences their
Figure 2. Map showing locations of cores with identified Heinrich layers. Data sources are given inTable 1. Simplified geological provinces are shown for reference. The map template is from Ruddiman[1977], and the 250 mg cm�2 kyr�1 flux lines from 25 to 13 kyr, Ruddiman’s [1977] ‘‘IRD belt,’’ areshown for reference.
RG1005 Hemming: HEINRICH EVENTS
3 of 43
RG1005

grain-size distribution; thus different grain-size ranges
should arguably be examined to identify different funda-
mental rock-type contributions. Third, distance of transport
under the glacier is a strong control on the ultimate grain
size.
[8] These complications mean that the coarse-grain frac-
tions are inevitably biased toward rocks near the ocean
margin and toward rocks that tend to break into grains of the
size range examined. (For example, shale would be under-
represented in the >63 mm fraction.) While recognizing the
inevitable complexity of glacial sediment [e.g., Dreimanis,
1976; Dowdeswell and Dowdeswell, 1989; Dowdeswell and
Murray, 1990; Dowdeswell et al., 1998; Andrews, 1998,
2000], in the open ocean it is necessary to use a fraction that
is coarse enough to not have been transported by means
other than ice rafting. Away from turbidite aprons (shown
by Ruddiman [1977]), >63 mm grains are most likely
derived by ice rafting and grains >150 mm definitely are.
[9] Depositional and bottom current processes in the
ocean can also modify the grain-size distributions. For
example, in drift deposits, there is a very large fraction of
sortable silt [e.g., McCave, 1995], and some depositional
sites must be quantitatively losing their fine fraction to
scouring by bottom currents. Core V28-82 in the eastern
North Atlantic is not on a drift and appears to be a case
where the flux from above matches the accumulation (based
on 230Thexcess analyses [McManus et al., 1998]). Thus it is a
good reference core for deep ocean IRD characteristics in
the IRD belt. In contrast to V28-82, in western North
Atlantic core V23-14, Heinrich layers are at minima in
>63 mm fraction and number of lithic grains per gram (see
Figure 5). V23-14 has a very low sedimentation rate
between Heinrich layers of approximately 3 cm kyr�1
[Hemming and Hajdas, 2003], and it is likely that bottom
currents are robbing the fine fraction from this site. Eastern
North Atlantic core V23-81 from the Feni Drift is a place
where extra fine fraction is added by bottom current
processes. V23-81 has a sedimentation rate of approximately
12 cm kyr�1, and Heinrich layers are strong maxima in
numbers of lithic grains per gram (see Figure 10). However,
Figure 3. Map showing locations of records of abrupt climate events discussed in this paper. TheGreenland Ice Sheet Project 2 (GISP2) d18O (Figure 4), Nordic Seas and Irminger Basin ice-rafteddetritus (IRD) [e.g., Rasmussen et al., 1997; Elliot et al., 1998; Voelker et al., 1998; Dokken and Jansen,1999; van Kreveld et al., 2000], Santa Barbara Basin anoxia [Behl and Kennett, 1996; Kennett et al.,2000], and Cariaco Basin runoff [Peterson et al., 2000] do not record more extreme climate conditionsduring Heinrich events. DSDP609 detrital carbonate concentration (Figure 4) Lake Tulane pine pollen[Grimm et al., 1993], Brazil margin terrigenous concentration [Arz et al., 1998], Lake Baikal (Selengadelta) runoff [Prokopenko et al., 2001], and Chinese loess average grain size [Porter and An, 1995] haveapproximately the same number of peaks as Heinrich events and do not seem to record the othermillennial climate shifts. Alboran Sea sea surface temperature (Figure 4), Arabian Sea organic carbon(Figure 4), and Hulu cave d18O (Figure 4) appear to record all the GISP2 events in the last 50 kyr, andHeinrich events are pronounced extrema.
RG1005 Hemming: HEINRICH EVENTS
4 of 43
RG1005
the maximum is only about 1500 grains per gram [Bond and
Lotti, 1995; Bond et al., 1999].
2.2. Geochemical Provenance Studies and PotentialSource Terranes Around the North Atlantic
[10] Geochemical approaches provide a valuable comple-
ment to petrographic provenance studies. Petrographic stud-
ies allow identification of major lithological components in
the sand fraction, as well as potentially diagnostic minerals
and/or rock types. In general, geochemical approaches
are applicable to both coarse- and fine-grained fractions.
Potential complications exist with using the fine fractions.
For example, fine-grained sediments typically represent
more homogeneously mixed sources. Additionally, in
studies of marine sediment cores, processes other than ice
rafting are capable of transporting fine-grained components.
However, the fine fraction carries valuable information
about sources. Measurements of components that are greatly
enriched or depleted in the sedimentary cycle yield infor-
mation about the degree of chemical alteration of the source
and thus provide insights into the contributions from sed-
imentary sources. In the North Atlantic, geochemical studies
of the fine terrigenous fraction include X-ray diffraction
(mineralogical) studies, K/Ar ages, Rb-Sr, Sm-Nd, and Pb
isotopes, and organic compounds.
[11] Many of the studies of IRD provenance have focused
on the sand fraction. The sand fraction is appealing because
it must have been rafting on ice (although whether sea ice or
icebergs were the rafts is difficult to determine). In the
North Atlantic, geochemical studies of the sand fraction
include the Sm-Nd and Rb-Sr isotope systems in the bulk
sand fraction (after carbonate is removed), Pb isotopes in
individual grains or composite samples of feldspar, and40Ar/39Ar ages of individual grains of hornblende.
2.2.1. Sm-Nd Isotope System[12] The Sm-Nd isotope system provides an average age of
crust formation of the sediment’s sources [Taylor and
McLennan, 1985; Goldstein and Jacobsen, 1988;McLennan
and Hemming, 1992]. This is because Sm and Nd are rare
earth elements with similar radii, and thus are generally not
separated by most sedimentary processes (although there are
exceptions). Average post-Archean upper continental crust
has a Sm/Nd of 0.173, and average post-Archean shale has a
Sm/Nd of 0.175 [Taylor and McLennan, 1985]. Evidence
from Archean sedimentary rocks indicates a slightly
higher Sm/Nd [Taylor and McLennan, 1985; McLennan
and Hemming, 1992], but for the purpose of this application
the difference is negligible. Because of the relatively small
range of Sm/Nd of continental sources the Nd isotope
composition of a sediment provides a rough estimate of
the average continental age of its sources (there is approx-
imately a 1 epsilon unit decrease per 100 million years, so a
sample with eNd of�27 can be inferred to have been derived
from a late Archean source or, alternatively, from a mix of
early Archean source with a younger source). In the North
Atlantic, Iceland can be a significant sediment contributor,
with a higher Sm/Nd [Farmer et al., 2003] and eNd ranging
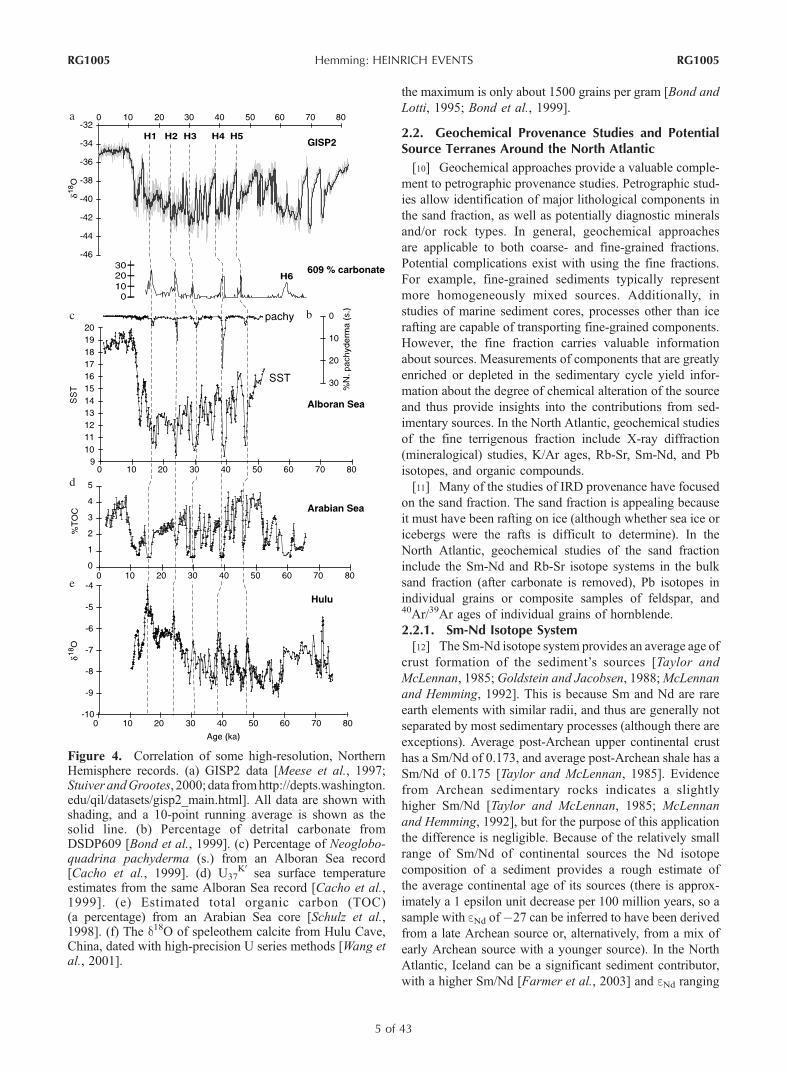
Figure 4. Correlation of some high-resolution, NorthernHemisphere records. (a) GISP2 data [Meese et al., 1997;Stuiver andGrootes, 2000; data fromhttp://depts.washington.edu/qil/datasets/gisp2_main.html]. All data are shown withshading, and a 10-point running average is shown as thesolid line. (b) Percentage of detrital carbonate fromDSDP609 [Bond et al., 1999]. (c) Percentage of Neoglobo-quadrina pachyderma (s.) from an Alboran Sea record[Cacho et al., 1999]. (d) U37
K0sea surface temperature
estimates from the same Alboran Sea record [Cacho et al.,1999]. (e) Estimated total organic carbon (TOC)(a percentage) from an Arabian Sea core [Schulz et al.,1998]. (f) The d18O of speleothem calcite from Hulu Cave,China, dated with high-precision U series methods [Wang etal., 2001].
RG1005 Hemming: HEINRICH EVENTS
5 of 43
RG1005

TABLE1.
CoresThatHaveBeenStudiedforHeinrich
Layersin
andClose
totheIR
DBelta
Map
Source
Core
Longitude,
deg
Latitude,
deg
Depth,
m
H1
H2
H3
H4
H5
H6
�T
C�T
C�T
C�T
C�T
C�T
C
1Heinrich
[1988]
ME69-17
�19.71
47.36
3905
523
946.5
13
64
20
106
6133
14
162
1ME69-19
�19.69
47.32
4350
18
37
44
79
100
140
2Bondet
al.[1992]
HU75-55
�58.65
61.50
2500
40
90
69
210
3V27-20
�46.20
54.00
3510
0125
8210
4V23-14b
�45.25
43.40
3177
613
24
52
286
20
116
5V23-16
�45.05
46.00
2813
25
45
35
120
20
205
50
270
8375
12
550
6V27-17
�37.30
50.08
4054
270
395
2147
7V30-101k
�32.50
44.10
3504
337
852
580
498
8Mo1-32
�28.93
47.58
4070
342
778
0105
12
157
5192
0236
9V29-179
�24.53
44.02
3331
260
383
1120
4200
10
DSDP609
�24.23
49.88
3884
182
5113
0150
10
229
10
296
0400
11V28-82c
�22.27
49.45
3935
18
60
21
99
131
31
192
30
245
305
12
V23-82
�21.93
52.58
3974
190
5152
0190
4270
2340
0440
13
V23-81
�16.83
54.25
2393
1220
3329
0383
3495
2584
0760
41
Grousset
etal.[1993]
CH69-K
09
�47.35
41.75
4100
23
62
31
15
5V23-16
�45.05
46.00
2813
25
35
14
SU90-11
�40.27
44.73
3645
28
34
27
81.5
10
110
35
144.5
30
210
279
15
KS79-14
�32.13
45.33
3500
32
54
38
24
16
KS79-15
�30.20
43.22
2875
10
12
816
14
17
SU90-08
�30.40
43.50
3080
16
79
12
130
10
15
18
KS79-24
�29.00
47.04
3425
918
40
38
27
1ME69-17
�19.71
47.36
3905
79
621
319
KS79-18
�27.24
45.47
2815
20
10
30
40
22
20
KS79-25
�27.28
46.98
2950
20
35
20
61
40
106
20
168
230
21
KS79-17
�27.17
43.00
3030
77
67
10
ODP609
�24.23
49.88
3884
65
15
17
13
22
KS79-28
�22.76
45.63
3625
12
12
818
17
23
SU90-39
�23.00
53.00
3955
86
310
12
24
SU90-40
�22.50
52.00
113
410
725
SU90-43
�19.30
50.30
350
12
83
926
SU90-44
�17.93
50.10
4255
867
12
136
15
182.5
17
243.5
10
293
27
KS79-29
�15.07
46.30
3499
631
443
365
12
88
2118
148
28
SU90-09
�31.08
43.08
3375
13
56.5
10
87
7110.5
10
147
10
191
RG1005 Hemming: HEINRICH EVENTS
6 of 43
RG1005

TABLE
1.
(continued)
Map
Source
Core
Longitude,
deg
Latitude,
deg
Depth,
m
H1
H2
H3
H4
H5
H6
�T
C�T
C�T
C�T
C�T
C�T
C
29
Francoisand
Bacon[1994]
CHN823111PC
�31.80
42.38
3209
553.5
783.5
30
BondandLotti[1995]
GGC31
�46.35
50.57
16
45
15
104.5
31
Manighettiet
al.[1995]
BOFS5K
�21.87
50.68
3547
72
109
226
32
BOFS6K
�21.20
51.12
2865
34
60
136
175
212
33
BOFS7K
�22.54
51.76
2327
32
42
83
103
125
34
BOFS8K
�22.07
52.50
4045
76
126
234
35
BOFS17K
�16.50
58.00
1150
62
90
150
188
230
36
Thomsonet
al.[1995]
CD63#9K
�12.55
46.40
3849
11
36
10
98.5
5135
37
Vidalet
al.[1997]
NA87-22
�14.70
55.50
2161
17.5
348.3
22.5
494
15
555
15
630
17
SU90-08
�30.04
43.05
3080
11
68.5
11
123.5
10
205
10
249
38
Chapmanand
Shackleton[1998]
SU90-03
�32.00
40.05
2475
77
132
195
39
Stoner
etal.[1998]
HU91-045-094P
�45.69
50.20
3448
237
375
470
570
680
835
39
Veiga-Pires
and
Hillaire-Marcel
[1999]
HU91-045-094P
�45.69
50.20
3448
20
238
15
372.5
40
Zahnet
al.[1997]
SO75-26KL
�9.50
37.82
1099
8136
10
272
28
568
46
Cortijoet
al.[1997]
SU90-12
�39.78
51.87
2950
109
17
SU90-08
�30.40
43.50
3080
18
201
41
CH69-K
09
�47.35
41.75
4100
15
482
45
SU90-05
�32.25
41.63
3285
493
36
Snoeckx
etal.[1999]
CD63#9K
�12.55
46.40
3849
137
175
48
KS01
�17.03
46.00
4730
109
141
50
D11957P
125
1ME69196
68
109
24
SU90-40
�22.50
52.00
110
160
26
SU90-44
�17.93
50.10
4255
180
240
49
SU92-28
�9.47
37.09
997
493
47
Thomsonet
al.[1999]
MD95-2039
�10.35
40.69
3381
225
550
1020
1220
41
Labeyrieet
al.[1999]
CH69-K
09
�47.35
41.75
4100
11
294.5
3344.5
8384
18
481
5617.5
42
Grousset
etal.[2000]
MD95-2002
�8.53
47.45
2174
43
Bard
etal.[2000]
SU81-18
�11.18
37.77
3135
�330
44
vanKreveld
etal.[1996]
T88-9P
�25.08
48.38
3193
a�Tisthickness,andCiscore
depth
atcenteroflayer,both
incentimeters.
bValueiscorrectedaccordingto
Hem
mingandHajdas[2003].
cValueiscorrectedaccordingto
McM
anuset
al.[1998].
RG1005 Hemming: HEINRICH EVENTS
7 of 43
RG1005

up to near depleted mantle compositions [Grousset et al.,
1993; Farmer et al., 2003].
2.2.2. Rb-Sr Isotope System[13] The Rb-Sr isotope system may be disturbed by many
geological processes [Dasch, 1969; Goldstein and Jacobsen,
1988]. This is because of the large geochemical difference
between Rb (alkali metal) and Sr (alkaline earth element)
as well as their mineralogical hosts. Rb tends to follow K
and is enriched in K-feldspar and micas, whereas Sr tends
to follow Ca and is enriched in plagioclase and pyroxene.
Plagioclase and pyroxene are generally susceptible to
chemical attack during weathering, and Sr is removed
to the aqueous system. Rubidium’s hosts have greater
resistance to chemical weathering, and, additionally, Rb
released during weathering tends to follow Al and thus to
be retained in the solid system. In addition to the
sedimentary alteration of the Rb-Sr system, metamorphism
tends to break down and reform the mineral hosts of these
elements, and thus metamorphic resetting of the Rb-Sr
isotope system is common. Accordingly, the Rb-Sr isotope
system provides a large signal compared to our ability to
measure the Sr isotope composition, but the interpretation
of the geological source is complicated by the wide array
of processes that disturb or reset its clock.
2.2.3. Pb Isotope System[14] The Pb isotope system is a powerful provenance tool
because of its formation from two isotopes of U and one of
Th. Pb is composed of four stable isotopes, 204Pb, 206Pb,207Pb, and 208Pb. Of these isotopes, only 204Pb is non-
changing. Isotopes 206Pb and 207Pb are the final products
from decay of 238U and 235U, respectively. Owing to the
much longer half-life of 238U (�4.5 b.y.) compared to 235U
(�700 m.y.) the Pb isotope system is particularly sensitive
to detection of ancient (particularly Archean) sources.
Although some published Pb isotope data exist from bulk
samples of Heinrich layers and potential sources [Hemming
et al., 1998; Farmer et al., 2003], they are still too scarce to
determine how sensitively they can be used to discriminate
sources in the North Atlantic region. However, the Pb
isotope composition of feldspar provides important insights
into basement sources to sediments. Feldspars have high Pb
abundance and very low U and Th abundance, and thus the
Pb isotope composition of feldspar approximates the initial
Pb isotope composition of its source [e.g., Hemming et al.,
1994, 1996, 2000b].
2.2.4. K/Ar Isotope System[15] The K/Ar isotope system is reset as easily as the Rb-
Sr system, perhaps even more easily [Hurley et al., 1963;
Hurley and Rand, 1969]. Accordingly, the K/Ar ages of
sedimentary components are likely to record the approxi-
mate time of the last disturbance of the system. In the case
of the North Atlantic the K/Ar age of ambient pelagic
sediments is about 400 Ma [Hurley et al., 1963; Jantschik
and Huon, 1992], consistent with a dominant derivation
from Paleozoic shale sources. As mentioned in section 4.4,
K/Ar ages of fine-sediment fractions from the Heinrich
layers are approximately 1 Ga [Jantschik and Huon,
1992], and this age is most likely derived from a mixture
of clay minerals from Paleozoic sediments and glacially
powdered minerals from older terranes [Hemming et al.,
2002]. The 40Ar/39Ar age range of feldspar grains from
Heinrich layers is large, but the average is about 1.4 Ga
[Hemming and Rasbury, 2000; Hemming et al., 2002].
Although the 40Ar/39Ar age range of hornblende is smaller
and older, hornblende is a minor rock-forming mineral, and
it has a low K concentration, and thus it has little impact on
the bulk K/Ar age of North Atlantic sediments.
2.2.5. Continents Around the North Atlantic[16] The continents around the North Atlantic have
experienced a similar set of thermal pulses: �3.8 Ga,
�2.5 Ga, �1.8 Ga, �1 Ga, �0.6 Ga, �0.4 Ga, and
<0.06 Ga (summarized by Hemming et al. [1998], see
geological provinces shown in Figure 1). It is not expected
that any 3.8 Ga terrains have 40Ar/39Ar hornblende ages
any older than �2.6 Ga because of thermal overprinting.
Hornblende has a blocking temperature to diffusion of Ar of
Figure 5. Comparison of IRD and foraminifera data fromV28-82 [Gwiazda et al., 1996a; McManus et al., 1998;Hemming et al., 1998] and V23-14 [Hemming and Hajdas,2003]. Age scales were developed using the ages of theHeinrich layers (discussed in section 4.6). Weight percentdata for the <63 mm fraction are not available for V28-82.Note that in both cores the number of foraminifera per gramis minima at Heinrich layers and that the percentage of IRDis maxima. However, in contrast to core V28-82 thenumbers of lithic grains per gram in Heinrich layers inV23-14 are at relatively low values compared to the rest ofthe core. Additionally, the weight fractions >63 mm aredistinct minima at Heinrich intervals in V23-14.
RG1005 Hemming: HEINRICH EVENTS
8 of 43
RG1005
about 450�C [e.g., Harrison, 1981]. Thus amphibolite and
higher-grade metamorphic events will reset or disturb the
ages of hornblende. The Churchill province has an Archean
(�2.7 Ga) heritage, and it experienced an intense metamor-
phic event in the Paleoproterozoic (�1.8 Ga). The reader is
referred to a review by Hoffman [1989] for an overview of
the geological history of continents surrounding the North
Atlantic.
[17] Although there is substantial overlap in the geo-
logic history of continental sources around the North
Atlantic, Nordic Seas, and Arctic regions, the detailed
combination of rock types (igneous, metamorphic, and
sedimentary and more specific types within these) and
geologic ages allows some specific conclusions to be
drawn about IRD sources. Generally, it is easier to
eliminate sources than it is to demonstrate that a source
is the most likely candidate for a particular component. In
addition to the specific details that may allow ‘‘finger-
printing’’ a particular source (e.g., Campanian chalk from
Europe [Scourse et al., 2000]), the geographic arrange-
ment of the terranes on the continents may yield useful
constraints. For example, Hemming et al. [2000a] and
Hemming and Hajdas [2003] used the general trend from
old to young basement terranes from north to south along
the North American margin to constrain the maximum
position of the Laurentide ice sheet during the last glacial
cycle. With this approach it is possible to determine when
the ice sheet had extended far enough south to contribute
hornblende grains with Paleozoic and Mesoproterozoic40Ar/39Ar ages to the IRD.
2.2.6. Geochemical Evidence for Sedimentary Sources[18] Geochemical evidence for sedimentary sources may
provide unique insights into ice rafting. This appears to be
particularly true of organic compounds where the combina-
tion of depositional environment and burial/diagenesis cre-
ates specific groups of compounds that are only found in
limited places. Organic compounds are greatly enriched in
sedimentary sources compared to igneous and metamorphic
terranes. The Heinrich layers again provide a good example
of the application of this approach. While preparing samples
for sea surface temperature estimates by separating the
alkenones, Rosell-Mele et al. [1997] found some unusual
organometalic compounds that require sedimentary sources
from a very specific depositional environment and a very
specific diagenetic history. J. Sachs (personal communica-
tion, 2000) has found similar compounds in one sample
from the Hudson Strait.
2.3. Sediment Flux Estimates by the 230Thexcess Method
[19] As a result of the long residence time of uranium in
seawater the 230Th production rate by the radioactive decay
of dissolved 234U within the entire water column above any
particular seafloor location is a simple function of water
depth. The 230Th is extremely particle reactive and is
rapidly removed from the water column and buried after
adsorption by settling particles. Once buried, this excess230Th, combined with independently derived ages and the
assumption of constant 230Thexcess burial rate, may be used
to measure instantaneous sediment rates. The method only
normalizes the vertical flux of sediment, and lateral move-
ment of sediment along the seafloor (focusing) can only be
estimated by comparing the 230Th accumulation with that
predicted for the water column depth of the core. The reader
is referred to articles that summarize the methods
and assumptions [Bacon, 1984; Suman and Bacon, 1989;
Francois et al., 1990] and to the articles that specifically
deal with Heinrich events [Francois and Bacon, 1994;
Thomson et al., 1995; McManus et al., 1998; Veiga-Pires
and Hillaire-Marcel, 1999]. The high percentage of IRD
that characterizes Heinrich layers (Figure 1) could theoret-
ically be a product of two end-member scenarios: very low
flux of foraminifera or, alternatively, very high flux of IRD.
In fact, four of the six Heinrich layers from the last 60 kyr,
H1, H2, H4, and H5, have very high IRD flux in cores
within the IRD belt, whereas two of the layers, H3 and H6,
only show a modest increase in flux (Figure 20) or in the
number of lithic grains per gram (see comparison of
percentage of IRD and number of lithic grains per gram
in core V28-82 in Figure 5).
3. ICE-RAFTED DETRITUS IN THE GLACIALNORTH ATLANTIC: PATTERN OF DEPOSITION
[20] Ruddiman [1977] mapped the flux of lithic grains
(mg cm�2 kyr�1) in the 63 mm to 2 mm (i.e., sand) fraction
in seven time slices between 125 and 13 kyr. He found two
distinct patterns of variation in North Atlantic IRD (refer to
section 2.1 for a working definition of IRD), loosely
corresponding to interglacial and glacial conditions. The
interglacial pattern is characterized by a depocenter along
the 50� latitude ‘‘locus of melting’’ approximating the North
Atlantic Drift (Figure 6a). During glacial time the flux is
much greater, and the maximum IRD concentration is
shifted to the south by a few degrees (Figures 6b and 6c).
The 250 mg cm�2 kyr�1 contours from the 25–13 kyr slice
(Figure 6c) are used extensively throughout this paper as the
reference position of the IRD belt. This pattern of IRD
deposition requires a significant drift of icebergs from west
to east across the North Atlantic during glacial times
[Ruddiman, 1977; Robinson et al., 1995;Matsumoto, 1997].
4. CHARACTER OF HEINRICH LAYERS
4.1. Definition, Identification, and Correlation
[21] As noted in section 1, Heinrich measured the per-
centage of lithic grains to total entities (percentage of IRD) in
the 180 mm to 3 mm size fraction of marine sediment
samples from the Dreizack seamounts. Within the last glacial
cycle he found six layers with a high percentage of IRD.
Four of these six layers, specifically H1, H2, H4, and H5
were termed ‘‘cemented marls’’ [Heinrich, 1988; Huon and
Jantschik, 1993; Jantschik and Huon, 1992] (these works
refer to internal German theses in which many of the original
core descriptions appear to be reported). The three sediment
types that were defined for these cores are ‘‘foraminiferal
RG1005 Hemming: HEINRICH EVENTS
9 of 43
RG1005

ooze’’ (interglacial), ‘‘diamicton’’ (glacial), and ‘‘cemented
marl’’ (Heinrich layers H1, H2, H4, and H5). Although they
have high percentage of IRD and lithic counts, these mea-
sures do not uniquely separate H1, H2, H4, and H5 from
other IRD-rich layers. Several types of measurements of
bulk samples have been shown to be diagnostic of these four
Heinrich layers: high detrital carbonate concentration, flux
as measured by 230Thexcess, high magnetic susceptibility,
1 Ga K/Ar ages, and eNd of approximately �27. As
discussed in section 4.4, these characters are all consistent
with the inference that they were derived from Hudson Strait
[Hemming et al., 1998]. Thus, for practical purposes, I will
define a subgroup of Heinrich’s layers (H1, H2, H4, and H5)
as Hudson Strait (HS) Heinrich events H1, H2, H4, and H5.
The distinction is important for attempting to refine the
correlations and assumptions about events in the North
Atlantic and Nordic Seas. It is a troubling issue that needs
attention because (1) different researchers naturally choose
different definitions that depend on the tools applied and the
regions of study and (2) it is important to agree on (or at least
to understand differences in) definitions in order to assess the
relations among disparate observations in time and space.
[22] Heinrich’s [1988] original percentage of IRD assess-
ment works well for identifying the approximate positions
of Heinrich layers in the IRD belt; however, the layers of
high-IRD content are composites of different provenance
and possibly different sea surface conditions [e.g., Bond
et al., 1992, 1993, 1997, 1999; Bond and Lotti, 1995;
Grousset et al., 2001; Huon et al., 2002]. Accordingly,
even within the IRD belt, there is a clear need for refinement
of the definition in order to understand Heinrich layers.
Heinrich layers are most clearly identifiable in the IRD belt
of Ruddiman [1977] and have been mapped (Figure 7)
based on anomalously high magnetic susceptibility [e.g.,
Grousset et al., 1993] and IRD content [e.g., Bond et al.,
1992]. Grousset et al. [1993] and Robinson et al. [1995]
showed the correspondence between IRD measures and
magnetic susceptibility in some North Atlantic cores within
the IRD belt, and Grousset’s correlations for core SU90-08
are shown in Figure 8. Stoner et al. [1996] have used
multiple magnetic measurements to quantify the magnetic
character of IRD in Labrador Sea sediments, and this shows
promise as a provenance tracer [see also Stoner and
Andrews, 1999]. However, although H1, H2, H4, and H5
have strong magnetic susceptibility peaks in core V28-82,
they are not entirely coincident with the IRD layers and
peaks in deposition rate (Figure 9), so even in the IRD belt
more refinement is needed. Grousset et al. [1993] showed
the contrast between the magnetic susceptibility character of
cores within and outside of the IRD belt (Figure 8).
[23] Outside the IRD belt, identification of the Heinrich
events is trickier and relies on different types of observa-
tions. IRD peaks are found for virtually every cold interval
in cores north of the IRD belt [e.g., Bauman et al., 1995;
Fronval et al., 1995; Dokken and Hald, 1996; McManus et
al., 1996; Rasmussen et al., 1997; Andrews et al., 1998;
Elliot et al., 1998; Lackschewitz et al., 1998; Mangerud et
al., 1998; Voelker et al., 1998; Dokken and Jansen, 1999;
van Kreveld et al., 2000; Hald et al., 2001; Knies et al.,
2001]; however, their provenance is clearly different. The
inability to track a single IRD source north of the IRD belt
hinders correlations between HS Heinrich events and the
numerous IRD peaks documented out of the belt. Further-
more, no estimates of IRD flux, based on constant flux
proxies, have been reported outside of the IRD belt.
4.2. Anatomy of Heinrich Layers
[24] On the basis of 230Thexcess measurements [e.g.,
McManus et al., 1998] the high percentage of IRD of
Heinrich layers (Figure 1) is attributable to a high IRD
flux in four of the six Heinrich layers from the last 60 kyr,
namely, H1, H2, H4, and H5 (Figure 9). These big four,
HS Heinrich layers (also called cemented marl layers by
Figure 6. Maps of IRD flux to the North Atlantic fromRuddiman [1977] for (a) 125–115, (b) 40–25, and (c) 25–13 kyr. Geologic provinces and zone with flux >250 mgcm�2 kyr�1 (stippled area) from 25 to 13 kyr interval areshown for reference.
RG1005 Hemming: HEINRICH EVENTS
10 of 43
RG1005
Heinrich [1988] and colleagues studying Dreizack sea-
mounts cores) also have large fractions of detrital carbonate
[Bond et al., 1992]. Carbonate-bearing Heinrich layers
appear to require a series of repeated, anomalous, glacialog-
ical processes within the northern portion of the Laurentide
ice sheet. They have razor-sharp bases and thus must have
had extremely rapid onsets [Bond et al., 1992; Broecker et
al., 1992]. Bond et al. [1992] and Broecker et al. [1993] made
a detailed assessment of H1 and H2 from DSDP core 609.
Their results emphasize the decline in numbers of forami-
nifera during the Heinrich events within the IRD belt and the
change in the slope of the 14C age versus depth across these
intervals. Bond et al. [1992] emphasized that the detrital
carbonate peaks do not coincide with the entire cold inter-
vals. Although foraminifera abundance is low in DSDP609,
the shells that are found are in good shape in H1, H2, H4, and
H5 [Bond et al., 1992], so it does not appear to be a
preservation problem. Because the abundance of foraminif-
era is so low in DSDP609 Heinrich layers, it is difficult to
interpret the relative timing of decrease in percent of Neo-
globoquadrina pachyderma (sinistral (s.)). In V23-81 the
detrital carbonate maxima occur within coldest part of the
record, and except for H6 they are abruptly followed by
warming [Bond et al., 1999].
[25] Heinrich layers H3 and H6 are different from the
other Heinrich layers. Although H1, H2, H4, and H5 have
very high IRD flux in cores within the IRD belt, H3 and H6
show only a modest increase in flux and in the number of
lithic grains per gram despite their high percentage of IRD
(Figures 1, 9, and 10). Gwiazda et al. [1996b] concluded
that H3 and H6 were not really ice rafting events but instead
were low foraminifera intervals, which would account for
the high percentage of IRD. Bond et al. [1992] reported
evidence for foraminiferal dissolution in H3 from
DSDP609. Further study of H6 would be useful, particu-
larly in comparison to H3. H6 has not been studied as much
as the others. It is not clear what the reasons are, but
possibly it is because it is in a rather difficult time interval
for high-quality chronology. Additionally, the IRD abun-
dance appears generally high across much of stage 4,
perhaps analogous to the Last Glacial Maximum (LGM)
rather than an abrupt event. In any case, more attention
needs to be directed at both H3 and H6, especially at H6.
4.2.1. Heinrich Layer H4[26] Cores can be correlated with particular confidence
near Heinrich layer H4 because the event occurred shortly
after the Laschamp geomagnetic excursion [Kissel et al.,
1999; Laj et al., 2000; Stoner et al., 2000]. Additionally, H4
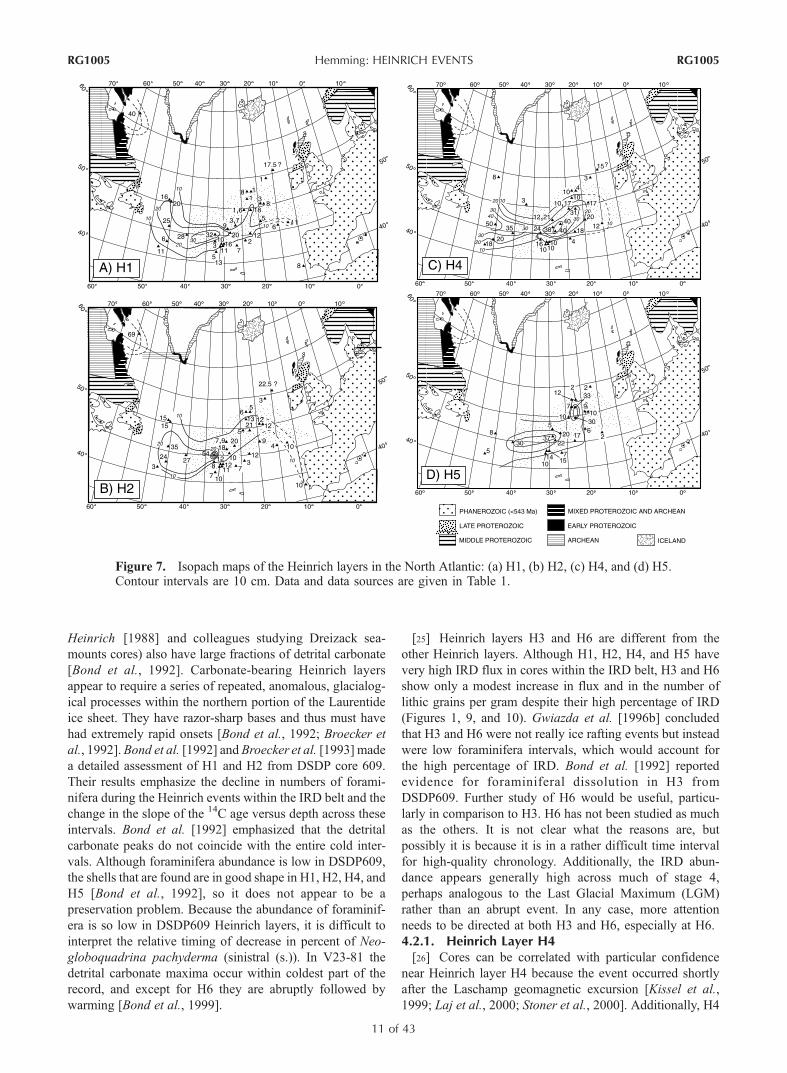
Figure 7. Isopach maps of the Heinrich layers in the North Atlantic: (a) H1, (b) H2, (c) H4, and (d) H5.Contour intervals are 10 cm. Data and data sources are given in Table 1.
RG1005 Hemming: HEINRICH EVENTS
11 of 43
RG1005

is the largest of the six events during the last glacial period.
Several studies have focused on H4 [Cortijo et al., 1997;
Vidal et al., 1997; Snoeckx et al., 1999; Elliot et al., 2002],
so it is possible to examine the geographic pattern of IRD
(Figure 11a), d18O of surface water (Figure 11b), and Sr and
Nd isotopes (Figures 11c and 11d). Radiogenic isotopes
including Sr and Nd are discussed more thoroughly in the
section on geochemical provenance studies (section 2.2),
but two things are clear from these maps. The detritus in
Heinrich layers was derived from very ancient sources.
Additionally, there are no apparent geographic trends in
these radiogenic isotopes, except that the two cores outside
the IRD belt have distinctly different compositions. Both
surface d18O and benthic d13C show dramatic decreases
during H4, consistent with a large iceberg-derived freshwa-
ter flux and associated retardation of North Atlantic Deep
Water (NADW) formation [Cortijo et al., 1997; Vidal et al.,
1997; Elliot et al., 2002].
4.2.2. Heinrich Layers in Previous Glacial Stages?[27] Little published information is available to address
the question of whether Heinrich layers occur in previous
glacial stages. I have found four tidbits of information
pertaining to this question. (1) In ODP core 980 on the Feni
Drift, McManus et al. [1999; see also Oppo et al., 1998]
have shown that millennial-scale variation in IRD persists in
glacial intervals for the last 500 kyr, but no indication of
provenance or flux is given. (2) Grousset et al. [1993]
presented a magnetic susceptibility record, interpreted to
Figure 8. Magnetic susceptibility measurements from North Atlantic cores [Grousset et al., 1993]. (left)Four cores from within the Ruddiman [1977] IRD belt. (top right) Map showing the locations of the coresin Figure 8. (right) Three cores from outside the IRD belt. Note that H1, H2, H4, and H5 stand out asprominent spikes in magnetic susceptibility and that H3 and H6 are less prominent or not visible.
RG1005 Hemming: HEINRICH EVENTS
12 of 43
RG1005
extend through stage 7, for SU90-08. No large magnetic
susceptibility peaks are found outside of the last glacial, HS
Heinrich layers. (3) Van Kreveld et al. [1996] claim to have
found 13 Heinrich layers in stages 7 to 2; however, the IRD
layers, other than the four HS Heinrich layers discussed in
section 4.2, have very different character, including low
detrital carbonate percentage. (4) Huon and Jantschik
[1993] reported �1 Ga K/Ar ages for a ‘‘cemented marl’’
layer in each of stages 8 and 12. From the published
information it appears that the IRD events in older parts of
the record (except the layers from stages 8 and 12 mentioned
above) have different sources, or they are not as prominent.
[28] If there were major IRD events in stage 6, their
provenance seems to be different. It appears that SU90-08
had a much lower sediment accumulation rate in stage 6 than
stages 2–4 [Grousset et al., 1993]. In either case the
magnetic susceptibility signal, which is so prominent in the
Heinrich layers of the last glacial interval, seems much less
pronounced in stage 6. An ongoing survey of cores at
Lamont-Doherty Earth Observatory of Columbia University
(G. Downing, unpublished data, 2003) indicates that the
prominent magnetic signature of HSHeinrich layers is absent
through stage 6. However, Rasmussen et al. [2003] have
found 12 IRD peaks in a sediment core off the Newfoundland
margin, with up to 10% detrital carbonate, through the last
130 kyr (i.e., through H11 at termination 2). More work is
needed to characterize the flux and provenance of IRD in this
interval, as well as in previous glacial intervals. Although the
provenance appears to be different based on magnetic
susceptibility [Grousset et al., 1993; G. Downing, unpub-
lished data, 2003) as well as composite feldspar Pb isotope
compositions [Gwiazda et al., 1996b], an increased flux of
IRD is indicated for termination II [McManus et al., 1998],
and each glacial termination appears to be characterized by a
prominent IRD event [McManus et al., 1999].
4.3. Detrital Carbonate Contents of theHeinrich Layers
[29] Several observations have led to the conclusion that
the elevated detrital carbonate contents of Heinrich layers
[e.g., Bond et al., 1992] are derived from a Hudson Strait
source [e.g., Andrews and Tedesco, 1992]. Paleozoic car-
bonate deposits occur in many places surrounding the North
Atlantic (major locations compiled by Bond et al. [1992]);
however, the thickness of Heinrich layers increases toward
the Canadian margin, and the Hudson Strait and Hudson
Bay are floored by Paleozoic carbonate. The thickest
deposits of the detrital carbonate occur in the Labrador
Sea, just off the Hudson Strait [Andrews and Tedesco,
1992]. Andrews [1998] credits Clough [1978] as the first
to identify a series of carbonate facies in northwestern
Labrador Sea cores that are now known to correlate with
Heinrich events [Andrews and Tedesco, 1992; Bond et al.,
1992] (see also Andrews’ [1998] review paper). In an even
earlier paper by Pastouret et al. [1972] on a study of
Newfoundland margin sediments, Heinrich layers are ap-
parent although the authors did not recognize their signif-
icance (F. Grousset, personal communication, 2003). A
recent paper by Rasmussen et al. [2003] further documents
the presence of detrital carbonate-rich IRD peaks off New-
foundland, with many more layers than seen in the IRD belt.
Figure 12 shows the correlation among Heinrich layers with
the various methods that have been used to detect the
detrital carbonate contribution. A map of the distribution
of cores where detrital carbonate estimations within the
Heinrich layers are published is shown in Figure 13. It is
clear from this map that a more systematic study of detrital
carbonate contents is in order. Cores DSDP609, V23-81,
SU90-24 (on a volcanic-free basis), EW93-GGC31, and
V28-82 were all counted by G. Bond [Bond et al., 1992,
1999; Bond and Lotti, 1995; Hemming et al., 1998], and yet
there are some puzzling features of the pattern. Core V28-82
is in the heart of the thickest Heinrich layer deposits,
whereas nearby DSDP609 shows uniformly thinner layers
(Table 1 and Figure 7). Additionally, V28-82 shows much
more pronounced magnetic susceptibility maxima than
DSDP609 (G. Downing, unpublished data, 2003). Thus
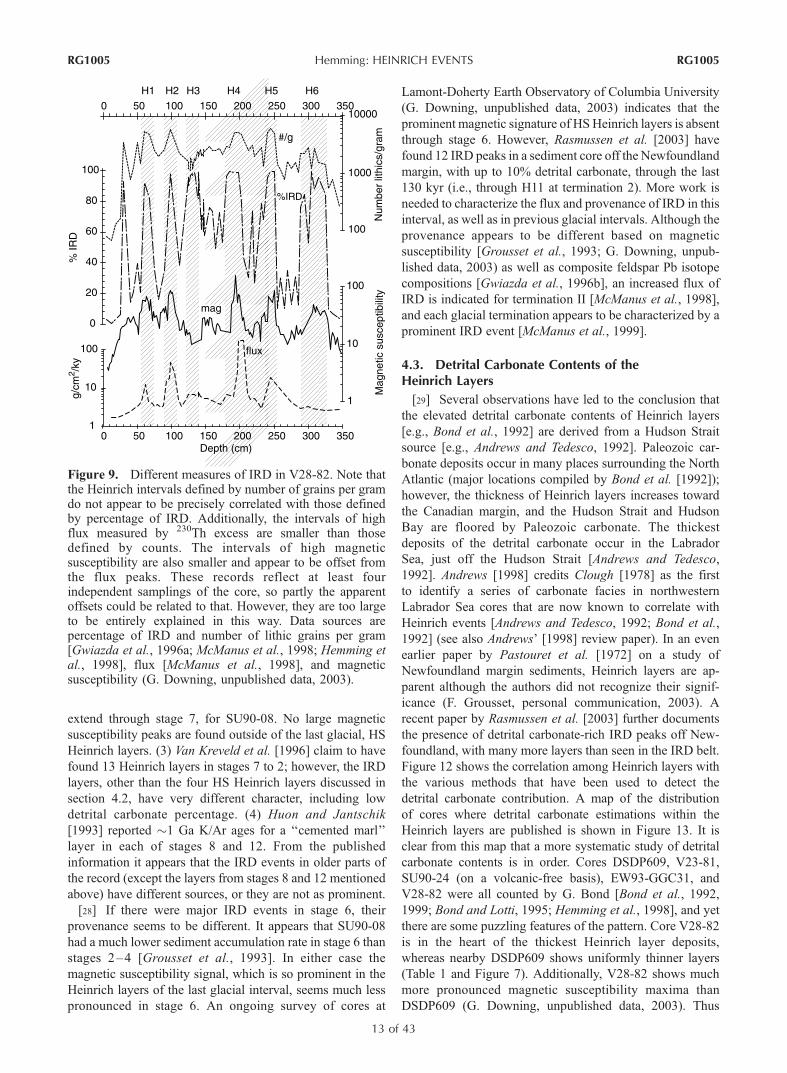
Figure 9. Different measures of IRD in V28-82. Note thatthe Heinrich intervals defined by number of grains per gramdo not appear to be precisely correlated with those definedby percentage of IRD. Additionally, the intervals of highflux measured by 230Th excess are smaller than thosedefined by counts. The intervals of high magneticsusceptibility are also smaller and appear to be offset fromthe flux peaks. These records reflect at least fourindependent samplings of the core, so partly the apparentoffsets could be related to that. However, they are too largeto be entirely explained in this way. Data sources arepercentage of IRD and number of lithic grains per gram[Gwiazda et al., 1996a; McManus et al., 1998; Hemming etal., 1998], flux [McManus et al., 1998], and magneticsusceptibility (G. Downing, unpublished data, 2003).
RG1005 Hemming: HEINRICH EVENTS
13 of 43
RG1005
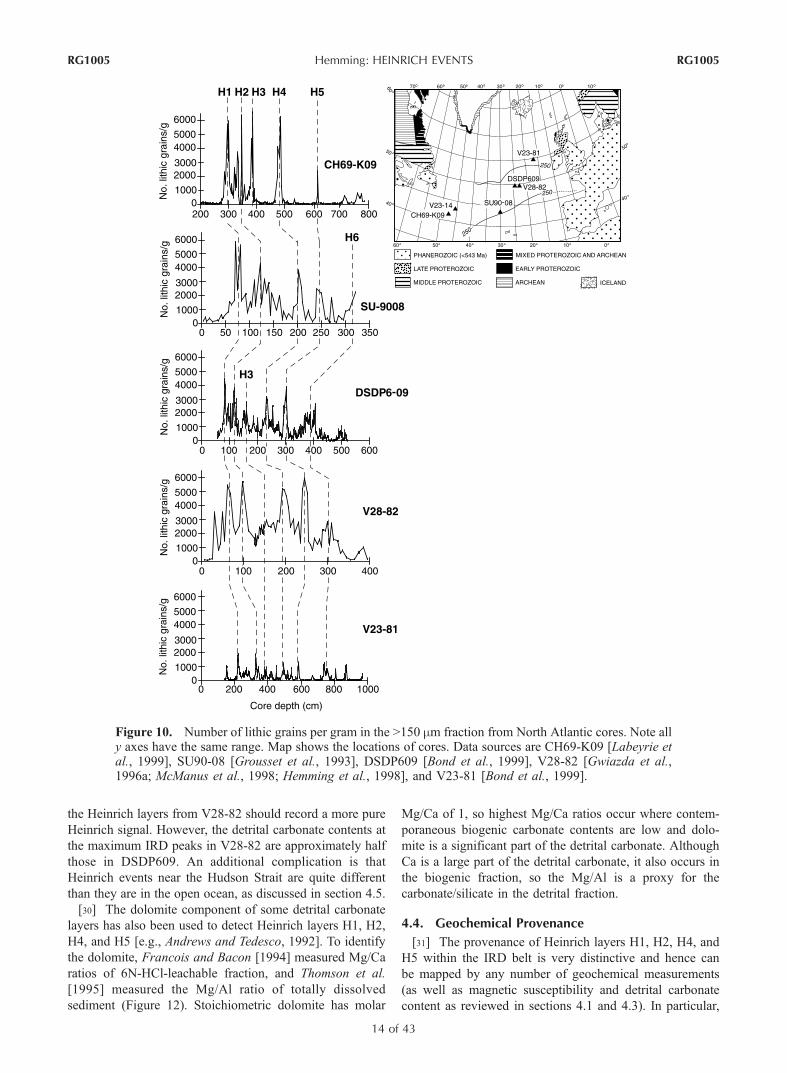
the Heinrich layers from V28-82 should record a more pure
Heinrich signal. However, the detrital carbonate contents at
the maximum IRD peaks in V28-82 are approximately half
those in DSDP609. An additional complication is that
Heinrich events near the Hudson Strait are quite different
than they are in the open ocean, as discussed in section 4.5.
[30] The dolomite component of some detrital carbonate
layers has also been used to detect Heinrich layers H1, H2,
H4, and H5 [e.g., Andrews and Tedesco, 1992]. To identify
the dolomite, Francois and Bacon [1994] measured Mg/Ca
ratios of 6N-HCl-leachable fraction, and Thomson et al.
[1995] measured the Mg/Al ratio of totally dissolved
sediment (Figure 12). Stoichiometric dolomite has molar
Mg/Ca of 1, so highest Mg/Ca ratios occur where contem-
poraneous biogenic carbonate contents are low and dolo-
mite is a significant part of the detrital carbonate. Although
Ca is a large part of the detrital carbonate, it also occurs in
the biogenic fraction, so the Mg/Al is a proxy for the
carbonate/silicate in the detrital fraction.
4.4. Geochemical Provenance
[31] The provenance of Heinrich layers H1, H2, H4, and
H5 within the IRD belt is very distinctive and hence can
be mapped by any number of geochemical measurements
(as well as magnetic susceptibility and detrital carbonate
content as reviewed in sections 4.1 and 4.3). In particular,
Figure 10. Number of lithic grains per gram in the >150 mm fraction from North Atlantic cores. Note ally axes have the same range. Map shows the locations of cores. Data sources are CH69-K09 [Labeyrie etal., 1999], SU90-08 [Grousset et al., 1993], DSDP609 [Bond et al., 1999], V28-82 [Gwiazda et al.,1996a; McManus et al., 1998; Hemming et al., 1998], and V23-81 [Bond et al., 1999].
RG1005 Hemming: HEINRICH EVENTS
14 of 43
RG1005

studies to date have examined Heinrich layer provenance
using K/Ar, Nd, Sr, and Pb isotopic techniques as well as
organic geochemical measures. Refer to section 2.2 for a
brief overview of geochemical provenance approaches.
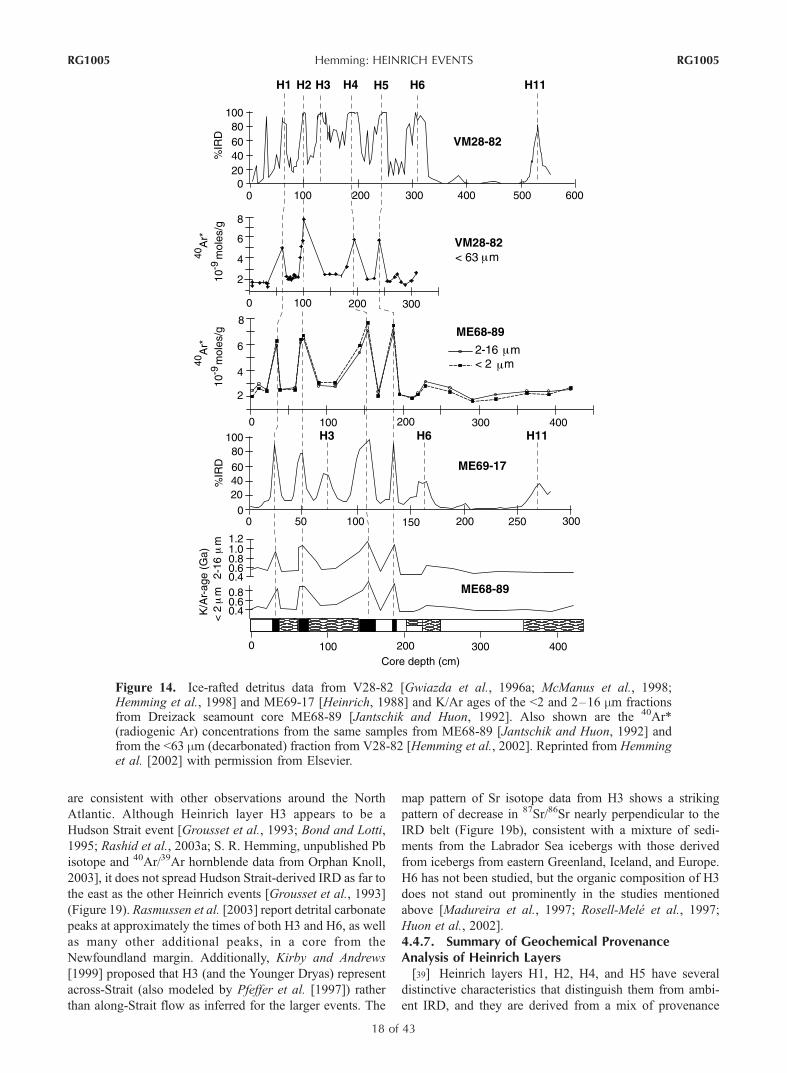
4.4.1. K/Ar Ages[32] The first geochemical provenance measurement of
the Heinrich layers was the K/Ar apparent age of the fine
fractions <2 mm and 2–16 mm [Jantschik and Huon, 1992].
Ambient North Atlantic sediments have apparent K/Ar ages
of approximately 400 Ma [Hurley et al., 1963; Huon and
Ruch, 1992; Jantschik and Huon, 1992], whereas the sedi-
ments from Heinrich layers H1, H2, H4, and H5 yielded
apparent ages of approximately 1 Ga (Figure 14). Variation
in the K concentration is small, and thus the K/Ar age signal
is a product of the radiogenic 40Ar* concentration [Hemming
et al., 2002]. Hemming et al. [2002] showed that the 40Ar* is
quite uniform in eastern North Atlantic cores (Figure 14) and
that the K/Ar age and 40Ar/39Ar spectra of <2 mm terrigenous
sediment from Heinrich layer H2 in the eastern North
Atlantic and from Orphan Knoll (southern Labrador Sea/
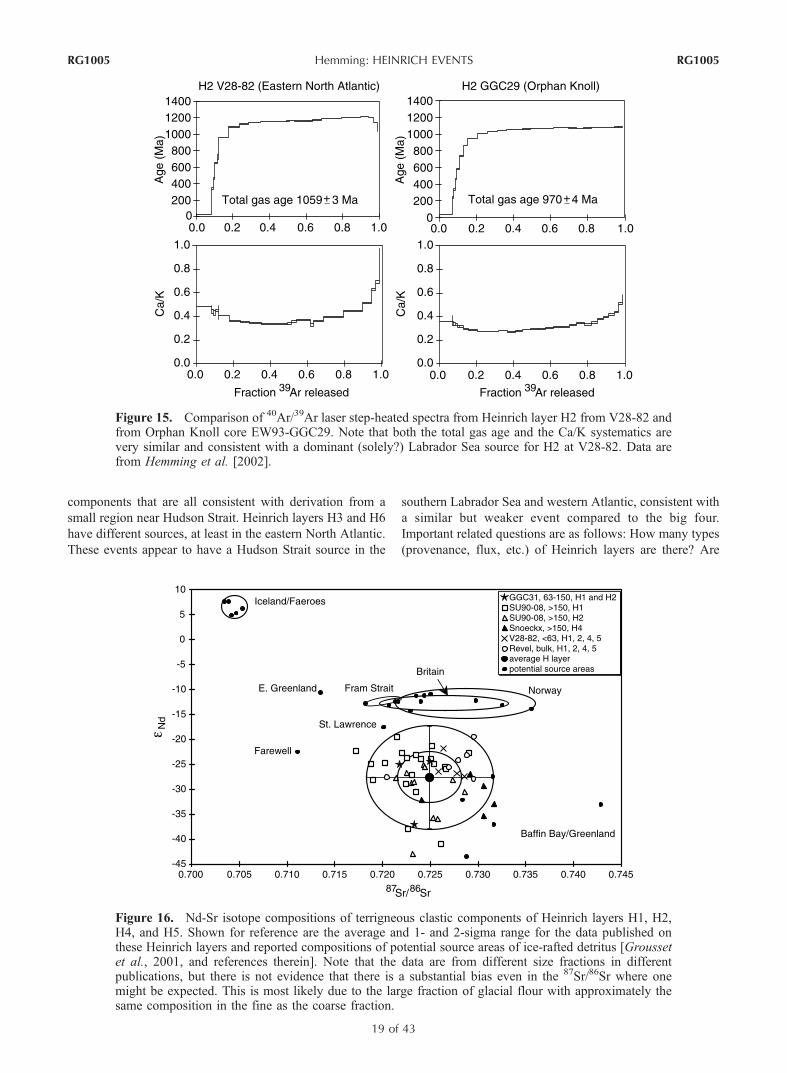
western Atlantic) are indistinguishable (Figure 15). Taken
together these results imply the entire fine fraction of
Heinrich layer H2 was derived from sources bordering the
Labrador Sea, presumably the Hudson Strait. The same
pattern most likely characterizes H1, H4, and H5, because
their K/Ar ages and 40Ar* concentrations are similar to H2 in
eastern North Atlantic cores.
4.4.2. Nd-Sr-Pb Isotope Compositionof Terrigenous Sediments[33] Grousset et al. [1993] reported Nd and Sr isotope
compositions of Heinrich layers from core SU90-08
(Figures 1 and 2). Although the Sr isotope composition is
not particularly diagnostic, the Nd isotope composition is
consistent with derivation from a source with Archean
heritage, and Grousset et al. [1993] suggested sources
surrounding the Labrador Sea or Baffin Bay (Figure 16).
Nd and Sr isotope compositions for various grain size
fractions from North Atlantic sediments suggest that the
total terrigenous sediment load within these Heinrich layers
in the IRD belt may derive from the same limited range of
Figure 11. Maps of Heinrich layer H4. The stippled area is the region with greater than 250 mg cm�2
kyr�1 sediment flux between 25 and 13 kyr [Ruddiman, 1977]. (a) Isopach with 10 cm contour intervals(from Figure 7). (b) Map of difference between d18O before and during H4. Data are from Cortijo et al.[1997]. (c) The 87Sr/86Sr composition of the terrigenous fraction within H4. Data are from Snoeckx et al.[1999], Hemming et al. [1998], Grousset et al. [1993, 2001], and Revel et al. [1996]. (d) The eNdcomposition of the terrigenous fraction within H4. Data are from Snoeckx et al. [1999], Hemming et al.[1998], Grousset et al. [1993, 2001], and Revel et al. [1996].
RG1005 Hemming: HEINRICH EVENTS
15 of 43
RG1005

sources [Revel et al., 1996; Hemming et al., 1998; Snoeckx
et al., 1999; Grousset et al., 2000, 2001]. The University
of Colorado group has extensively characterized the com-
position of potential source areas in the vicinity of the
Hudson Strait as well as Baffin Bay [Barber, 2001;
Farmer et al., 2003] and other regions along the western
Labrador coast and the Gulf of St. Lawrence [Farmer et
al., 2003]. Their data are consistent with the interpretation
of a Hudson Strait provenance for Heinrich layers H1, H2,
H4, and H5 and demonstrate an absence of substantial
southeastern Laurentide ice sheet sources within pure
Heinrich intervals.
[34] The Pb isotope composition of the fine terrigenous
fraction of Heinrich layers is also distinctive [Hemming et
al., 1998] and consistent with derivation from the Hudson
Strait region [Barber, 2001]. New results from Farmer et al.
Figure 12. Different measures of detrital carbonate that have been used in Labrador Sea and NorthAtlantic sediment cores. Data sources are HU87-009 [Andrews et al., 1994b], HU91-045-094-P (wt %CaCO3 [Hillaire-Marcel et al., 1994]), EW93-GGC31 (percentage of carbonate grains in 63–150 mmfraction [Bond and Lotti, 1995]), CHN82 31 11PC (Mg/Ca weight fraction [Francois and Bacon, 1994]),and CD63#9K (Mg/Al weight fraction [Thomson et al., 1995]). Also shown for reference is the estimatedsediment flux from CD63#9K based on excess 230Th [Thomson et al., 1995].
RG1005 Hemming: HEINRICH EVENTS
16 of 43
RG1005

[2003] may allow further distinction of fine-grained sedi-
ment sources with Pb isotopes.
4.4.3. Isotopic and Geochronologic Measurementson Individual Grains[35] In addition to the bulk geochemical methods sev-
eral studies have examined individual grains or composite
samples of feldspar grains for their Pb isotope composi-
tions [Gwiazda et al., 1996a, 1996b; Hemming et al.,
1998] or individual grains of hornblende for their40Ar/39Ar ages [Gwiazda et al., 1996c; Hemming et al.,
1998, 2000a; Hemming and Hajdas, 2003]. These studies
provide remarkable insights into the geologic history of
Heinrich layers that allow further refinement of the inter-
pretations based on bulk isotopic analyses. Feldspars have
high Pb abundance and very low U and Th abundance,
and thus the Pb isotope composition of feldspar approx-
imates the initial Pb isotope composition of its source
[e.g., Hemming et al., 1994, 1996, 2000b]. Pb isotope data
from Heinrich layer H1, H2, H4, H5 feldspar grains form
a linear trend that indicates an Archean (�2.7 Ga) heritage
and a Paleoproterozoic (�1.8 Ga) metamorphic event
(Figure 17b). Heinrich layer grains are similar in compo-
sition to H2 from Hudson Strait proximal core HU87-009
and to feldspar grains from Baffin Island till. However,
they are distinctly different from feldspar grains from Gulf
of St. Lawrence core V17-203 where Appalachian (Paleo-
zoic) and Grenville (�1 Ga) sources are found. The40Ar/39Ar ages of individual hornblende grains from
Heinrich layers H1, H2, H4, and H5 cluster around the
implied Paleoproterozoic metamorphic events from the
feldspar Pb isotope data [Gwiazda et al., 1996c; Hemming
et al., 1998, 2000a; Hemming and Hajdas, 2003] and are
consistent with hornblende grains from Baffin Island tills
[Hemming et al., 2000b].
4.4.4. Organic Carbon Compounds[36] Organic compounds are important provenance tools
because they emphasize sedimentary contributions to IRD,
and they are sufficiently diverse in different sedimentary
basins with different sedimentary and diagenetic conditions
that they may prove to be very sensitive monitors of
provenance components. Several studies have examined
organic carbon compounds through Heinrich intervals
[Madureira et al., 1997; Rosell-Mele et al., 1997; Huon et
al., 2002] and have found evidence that a large fraction of
terrestrial organic carbon contributed to the layers.Madureira
et al. [1997] found enhanced concentrations of total
terrigenous lipids during glacial intervals, which they
attributed to a combination of eolian and IRD sources.
Heinrich events H1, H2, H4, and H5 have low concentrations
of organic carbon and terrigenous lipids [Madureira et al.,
1997; Huon et al., 2002]; however, they have very high
terrigenous flux [e.g., Francois and Bacon, 1994; Thomson
et al., 1995; McManus et al., 1998], and the carbon is
almost exclusively from terrestrial sources [Huon et al.,
2002]. Rosell-Mele et al. [1997] found vanadyl porphyrins
and carotenoid-derived aromatic hydrocarbon compounds
within Heinrich layers and found specific compounds that
originated from green sulphur bacteria that must have been
derived from an ancient sedimentary source that was depos-
ited in anoxic conditions. A survey of potential source areas
has found one sample from the Hudson Strait region with
appropriate compositions to match Rosell-Mele’s results
(J. Sachs, personal communication, 2000). A. Rosell-Mele
(personal communication, 2002) is also in the process of
surveying potential source areas around the North Atlantic
region.
4.4.5. Geologic History of Heinrich Layers’ Source[37] The data that have been collected on Heinrich layer
provenance reveal a remarkably complete story of the
geological history of the Heinrich layers’ source (Table 2).
The entire spectrum of provenance observations is consis-
tent with derivation from near the Hudson Strait.
4.4.6. Contrasting Provenance of H3 and H6[38] Events H3 and H6 do not appear to be derived
from the same sources as H1, H2, H4, and H5 (Figures 17c
and 18). Using Pb isotope compositions of composite
feldspar samples, Gwiazda et al. [1996b] found that H3
and H6 resemble ambient sediment in V28-82, suggesting
a large contribution from European sources, which agrees
with the conclusion of Grousset et al. [1993]. Pb isotope
data from composites of 75 to 300 grains from Gwiazda et
al. [1996b] are shown in Figure 17c. As mentioned in
section 4.4.6, H3 and H6 seem to be low-foraminifera
intervals rather than ice-rafting events. These conclusions
Figure 13. Locations of cores where detrital carbonatecontents have been estimated for H2. Isopach for H2 andstippled area representing Ruddiman’s [1977] IRD belt areshown for reference. Data sources are HU75-055 (wt %CaCO3 [Andrews et al., 1994b]), HU91-045-094-P (wt %CaCO3 [Hillaire-Marcel et al., 1994]), EW93-GGC31(percentage of carbonate grains in 63–150 mm fraction[Bond and Lotti, 1995]), SU90-09 (percentage of carbonategrains in >150 mm fraction [Grousset et al., 2001]),DSDP609 (percentage of carbonate grains in 63–150 mmfraction [Bond et al., 1992, 1999]), V28-82 (percentage ofcarbonate grains in >150 mm fraction [Hemming et al.,1998]), SU90-24 (percentage of carbonate grains in 63–150 mm fraction on a nonvolcanic basis [Bond et al., 1999]).
RG1005 Hemming: HEINRICH EVENTS
17 of 43
RG1005
are consistent with other observations around the North
Atlantic. Although Heinrich layer H3 appears to be a
Hudson Strait event [Grousset et al., 1993; Bond and Lotti,
1995; Rashid et al., 2003a; S. R. Hemming, unpublished Pb
isotope and 40Ar/39Ar hornblende data from Orphan Knoll,
2003], it does not spread Hudson Strait-derived IRD as far to
the east as the other Heinrich events [Grousset et al., 1993]
(Figure 19). Rasmussen et al. [2003] report detrital carbonate
peaks at approximately the times of both H3 and H6, as well
as many other additional peaks, in a core from the
Newfoundland margin. Additionally, Kirby and Andrews
[1999] proposed that H3 (and the Younger Dryas) represent
across-Strait (also modeled by Pfeffer et al. [1997]) rather
than along-Strait flow as inferred for the larger events. The
map pattern of Sr isotope data from H3 shows a striking
pattern of decrease in 87Sr/86Sr nearly perpendicular to the
IRD belt (Figure 19b), consistent with a mixture of sedi-
ments from the Labrador Sea icebergs with those derived
from icebergs from eastern Greenland, Iceland, and Europe.
H6 has not been studied, but the organic composition of H3
does not stand out prominently in the studies mentioned
above [Madureira et al., 1997; Rosell-Mele et al., 1997;
Huon et al., 2002].
4.4.7. Summary of Geochemical ProvenanceAnalysis of Heinrich Layers[39] Heinrich layers H1, H2, H4, and H5 have several
distinctive characteristics that distinguish them from ambi-
ent IRD, and they are derived from a mix of provenance
Figure 14. Ice-rafted detritus data from V28-82 [Gwiazda et al., 1996a; McManus et al., 1998;Hemming et al., 1998] and ME69-17 [Heinrich, 1988] and K/Ar ages of the <2 and 2–16 mm fractionsfrom Dreizack seamount core ME68-89 [Jantschik and Huon, 1992]. Also shown are the 40Ar*(radiogenic Ar) concentrations from the same samples from ME68-89 [Jantschik and Huon, 1992] andfrom the <63 mm (decarbonated) fraction from V28-82 [Hemming et al., 2002]. Reprinted from Hemminget al. [2002] with permission from Elsevier.
RG1005 Hemming: HEINRICH EVENTS
18 of 43
RG1005
components that are all consistent with derivation from a
small region near Hudson Strait. Heinrich layers H3 and H6
have different sources, at least in the eastern North Atlantic.
These events appear to have a Hudson Strait source in the
southern Labrador Sea and western Atlantic, consistent with
a similar but weaker event compared to the big four.
Important related questions are as follows: How many types
(provenance, flux, etc.) of Heinrich layers are there? Are
Figure 15. Comparison of 40Ar/39Ar laser step-heated spectra from Heinrich layer H2 from V28-82 andfrom Orphan Knoll core EW93-GGC29. Note that both the total gas age and the Ca/K systematics arevery similar and consistent with a dominant (solely?) Labrador Sea source for H2 at V28-82. Data arefrom Hemming et al. [2002].
Figure 16. Nd-Sr isotope compositions of terrigneous clastic components of Heinrich layers H1, H2,H4, and H5. Shown for reference are the average and 1- and 2-sigma range for the data published onthese Heinrich layers and reported compositions of potential source areas of ice-rafted detritus [Groussetet al., 2001, and references therein]. Note that the data are from different size fractions in differentpublications, but there is not evidence that there is a substantial bias even in the 87Sr/86Sr where onemight be expected. This is most likely due to the large fraction of glacial flour with approximately thesame composition in the fine as the coarse fraction.
RG1005 Hemming: HEINRICH EVENTS
19 of 43
RG1005
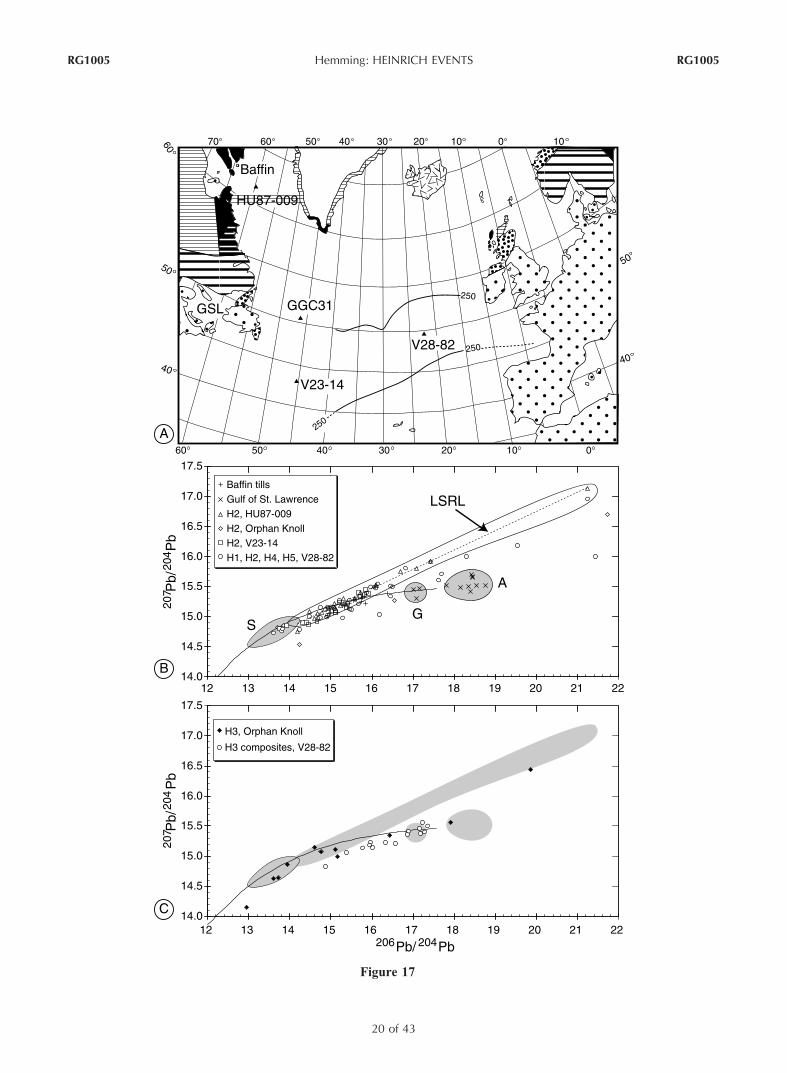
Figure 17
RG1005 Hemming: HEINRICH EVENTS
20 of 43
RG1005

IRD events in previous glacial intervals akin to the six in the
last glacial period?
4.5. ‘‘Precursor Events’’ and the Placementof Heinrich Events in D-O Cycles
[40] Bond and Lotti [1995] showed that in addition to the
variation of detrital carbonate, other petrological changes
could be quantified in the IRD fraction. Specifically, per-
centages of fresh basaltic glass and hematite-stained grains,
counted at high resolution in several North Atlantic cores,
vary on a 1 to 2 kyr interval [Bond et al., 1999]. The pacing
of petrological changes in IRD appears to be similar to that
of d18O changes in Greenland ice [Bond and Lotti, 1995;
Bond et al., 1997, 1999]. Bond and Lotti [1995] showed that
Icelandic glass and hematite-stained grains peak within the
broad lithic peaks that encompass Heinrich layers and that
they precede the detrital carbonate peaks for Heinrich layers
H1, H2, H3, and H4 in cores DSDP609 and V23-81 [see
also Bond et al., 1999].
[41] Grousset et al. [2001] showed a series of provenance
changes consistent with these observations. They found that
during Heinrich layers H1 and H2, there appear to be
sequential increases in volcanic grains, quartz grains, and
carbonate grains at core SU90-09 in the south central part of
the IRD belt. This observation of a precursor of increased
concentration of lithic grains with a non-Hudson Strait
source suggested that the Laurentide ice sheet was not
always responding to the same climate forcing as the D-O
cycles or was doing so later than other ice sheets.
[42] Grousset et al. [2000] showed that the Nd and Sr
isotope composition of the coarse IRD fraction from core
MD95-2002 in the Bay of Biscay recorded values close to
the end-member composition of Labrador sources during
the peak of Heinrich events but showed much different
compositions in the precursory interval. The compositions
of Sr and Nd measured in the precursory interval of this core
and core SU90-09 are similar to those documented from
European sources [Grousset et al., 2000], although they are
also similar to values that would be expected from the
southeastern Laurentide ice sheet [Farmer et al., 2003].
Furthermore, Vance and Archer [2002] have found that the
provenance of precursory intervals to H4 and H2 are not
similar based on radiogenic isotope studies of DSDP609
sediments. It will be important to find a combination of
tracers that allows distinction between Gulf of St. Lawrence
and European sources. Perhaps tracing the geographic
pattern of distribution of the precursory tracers will yield
the answer. The provenance of the precursor intervals may
become clearer with studies close to glaciated margins [e.g.,
Darby and Bischof, 1996; Bischof and Darby, 1999;
Grousset et al., 2001; Hemming et al., 2000b, 2002;
Hemming and Hajdas, 2003; Farmer et al., 2003].
[43] Scourse et al. [2000] documented the presence of H1
and H2 based on magnetic susceptibility and dolomite
concentrations in cores from the southwest of the British
Isles. The magnetic susceptibility signal is similar to that
found in the IRD belt, but the dolomite concentrations of
�20% are anomalously high for Heinrich layers and may be
derived from more than one source (this may also be a
counting artifact, and ‘‘dolomite’’ is really Paleozoic car-
bonate including both limestone and dolostone (I. N.
McCave, personal communication, 2002)). Scourse et al.
[2000] reported an increase in Celtic shelf detritus, charac-
terized by up to 3% Campanian chalk and 8% mica, prior to
the H2 event; however, they do not see a similar pattern
prior to the H1 event. While it is conceivable that there is a
cause and effect relation between the British ice sheet and
Heinrich events, given the proximity to Britain and the
absence of the source before the H1 event, more data would
be required if a convincing case is to be made.
[44] One view of precursors is that they are simply the
IRD signals of D-O cool phases in the North Atlantic [Bond
et al., 1999; G. Bond, personal communication, 2002], and
their occurrence before the Hudson Strait-derived detritus
means that the sea surface cooled prior to the input of
Heinrich layers. Icelandic glass is an important component
of the Iceland Sea [Voelker et al., 1998] and Irminger Basin
[Elliot et al., 1998; van Kreveld et al., 2000], and East
Greenland may be a significant source of hematite-stained
grains [Bond et al., 1999; van Kreveld et al., 2000]. Several
Figure 17. Pb isotopes in feldspar grains from Heinrich layers. (a) Map showing locations of cores analyzed with geologyand IRD belt for reference. (b) Data from Heinrich layers H1, H2, H4, and H5 from several North Atlantic and LabradorSea cores. Also shown are data from Gulf of St. Lawrence core V17-203 (S. R. Hemming, unpublished data, 2003) andfrom Baffin Island tills [Hemming et al., 2000b]. Reference fields are Superier province (S) [Gariepy and Allegre, 1985],Labrador Sea reference line (LSRL) [Gwiazda et al., 1996a]), Grenville (G) [DeWolf and Mezger, 1994] and Appalachian(A) [Ayuso and Bevier, 1991]. Data sources are H2 from HU87-009, V23-14, and V28-82 [Gwiazda et al., 1996a], OrphanKnoll core GGC31 (S. R. Hemming, unpublished, 2003), and H1, H4, and H5 from V28-82 [Hemming et al., 1998].(c) Data from Heinrich layer H3 with reference fields from Figure 17b. Data sources are H3 from V28-82 [Gwiazda et al.,1996b] and H3 from Orphan Knoll core GGC31 (S. R. Hemming, unpublished data, 2003).
TABLE 2. Geologic History of Heinrich Layers’ Source
Provenance Character Evidence
Archean heritage Nd isotopes of bulk sediments and Pb isotopes in feldspar grains
Paleoproterozoic orogeny Pb isotopes in feldspar grains and 40Ar/39Ar hornblende ages of hornblende grainsPaleozoic sedimentary cover detrital carbonate, K/Ar, and Rb/Sr ages of fine fraction,
40Ar/39Ar ages of pelitic fragments, chemical (inorganic and organic), and mineralogical composition
RG1005 Hemming: HEINRICH EVENTS
21 of 43
RG1005

studies have reported IRD contents at high resolution in the
Nordic Seas and North Atlantic sites north of the IRD belt,
and in these locations the IRD contents and other indicators
of climate change appear to closely follow the pattern of
d18O change in Greenland ice [Bauman et al., 1995;
Fronval et al., 1995; Dokken and Hald, 1996; McManus
et al., 1996; Rasmussen et al., 1997; Andrews et al., 1998;
Elliot et al., 1998; Lackschewitz et al., 1998; Mangerud et
al., 1998; Voelker et al., 1998; Dokken and Jansen, 1999;
van Kreveld et al., 2000; Hald et al., 2001; Knies et al.,
2001].
[45] Although there is contention about whether Hein-
rich layers have correlatives in the Nordic Seas (e.g.,
Fronval et al. [1995] and Elliot et al. [2002] versus
Dowdeswell et al. [1999]), it is clear that the pattern is
different. In the IRD belt, Heinrich layers are outstanding
IRD events, while events in between are modest, although
apparently correlative with Greenland cooling events
[Bond et al., 1993, 1999; Bond and Lotti, 1995]. In
contrast, there is apparently an IRD event of equal
magnitude for each of the Greenland cooling events,
although there is a larger flux in general during the Last
Glacial Maximum. This Greenland pattern also appears in
the Barra Fan record of British glacial activity [Knutz et
al., 2001]. However, Darby et al. [2002] report evidence
for four Arctic iceberg export events through Fram Strait,
approximately coincident with Heinrich events H1–H4.
They consider the Arctic export events to precede Hudson
Strait IRD, although both are not found in the core, so the
interpreted lead is subject to the vagaries of dating
uncertainties.
[46] The key precursory events to Heinrich events may be
preserved in Labrador Sea sediment. The recognition that
the carbonate-rich intervals in the Labrador Sea are approx-
imately synchronous with Heinrich events [Andrews and
Tedesco, 1992; Bond et al., 1992] helped to explain the
origin of the Heinrich ice armadas [e.g., MacAyeal, 1993] as
well as to emphasize the importance of studies proximal to
large glacial-marine outlets. A large fraction of the sediment
deposited near the Hudson Strait is brought by meltwater
not icebergs as is the case in the open ocean. Hesse and
Khodabakhsh [1998] showed that the carbonate-rich layers
near the mouth of Hudson Strait differ in sedimentological
character from the Heinrich layers in the open ocean and, in
particular, are much finer grained. They described a series
of facies: nepheloid layer deposits (or type I Heinrich
layers), mud turbidites (or type II Heinrich layers), laminae
of IRD (or type III Heinrich layers), and fine suspended
sediment and dropstones supplied by ice rafting (type IV
Heinrich layers). These facies are generally arranged prox-
imal to distal from the Hudson Strait, with type IV being the
character of Heinrich layers in the IRD belt. (Sedimento-
logical details can be found in several other references cited
in this paper as well as a new paper by Rashid et al.
[2003b].) Hillaire-Marcel et al. [1994] and Clarke et al.
[1999] suggest that at Orphan Knoll site HU91-045-094-P
(Table 1 and Figures 2, 13, and Figure 20), Heinrich events
are separable into two distinct depositional processes. Tur-
bidite sedimentation with high fine-grained carbonate con-
centrations is followed by a brief interval of increased IRD.
Taken collectively, the observations from the Labrador
Sea seem to imply an interval of significant subglacial
Figure 18. Nd-Sr isotope compositions of terrigneous clastic components of Heinrich layer H3. Shownfor reference are the average and 2-sigma range for the data published on Heinrich layers H1, H2, H4,and H5 and reported compositions of potential source areas of ice-rafted detritus [Grousset et al., 2001,and references therein]. Data sources are Grousset et al. [1993], Revel et al. [1996] and Snoeckx et al.[1999]. Also included is the average of five unpublished analyses across H3 from V28-82, where theerror bars represent the range of values measured (A. Jost and S. Hemming, unpublished data, 1999).
RG1005 Hemming: HEINRICH EVENTS
22 of 43
RG1005

meltwater-derived sediments to the North Atlantic Mid-
Ocean Channel prior to the launching of iceberg armadas
to the North Atlantic IRD belt.
4.6. Chronology and Duration of the Heinrich Layers
[47] Constraining the chronology and duration of the
Heinrich layers is critical to understanding their origin as
well as their role in global abrupt climate change. There are
two chronological objectives: (1) to place the Heinrich
events in time, i.e., 14C dates, and (2) to assess their
sedimentation rates and hence also their duration. Although
radiocarbon is a powerful chronometer, there are issues that
limit its applicability to constraining the age and duration of
Heinrich layers. There is a relatively large and variable
difference between ‘‘14C years’’ and ‘‘calendar years.’’ This
difference is due to a combination of an incorrect decay
constant and variability in the 14C content of the reservoir
from which the foraminifera precipitate their shells. The 14C
content of the seawater reservoir varies because of changes
in the cosmogenic production rate as well as the movement
of carbon through the ocean-atmosphere-biosphere system,
particularly changes in ventilation of the deep water [e.g.,
Bard et al., 1990, 1998; Adkins et al., 1998; Wunsch, 2003].
Today there is about a 400 year reservoir age in surface
waters of the North Atlantic, and in most applications of the
chronometer to North Atlantic sediments it is generally
assumed that this reservoir age was the same in the past.
However, recent publications have raised questions about
this assumption [e.g., Voelker et al., 2000;Waelbroeck et al.,
2001].
[48] The duration of Heinrich layers has been estimated
by the difference in 14C ages across Heinrich layers,
particularly H1 and H2 [Bond et al., 1992, 1993]. The
published radiocarbon measurements of the cores, whose
stratigraphy is summarized in this paper, are given in
Figure 21. Heinrich [1988] did not publish 14C ages but
used the planktonic d18O record for his age model. Dura-
tion estimates have been also made by measurements of
sediment flux by the 230Thexcesss method (see section 2.3
for an overview of the 230Thexcess method; see Figure 20
for the four published records).
[49] Nonetheless, there are complications in interpreting
these ages. The ages of Heinrich layers H1 and H2 are
reasonably certain based on radiocarbon measurements
(Table 3 and Figure 21), but estimations of their duration
are compromised by the events themselves because they
represent a large sediment flux increase [Manighetti et al.,
1995]. Within the IRD belt the estimated age at the base of
the layers is a maximum because of capping of the
bioturbated layer by the Heinrich layer (Figure 22). The
estimated age at the top is a minimum because of
bioturbation after the events. Additionally, the likelihood
that Heinrich events are associated with major deep water
circulation changes [Vidal et al., 1997; Kissel et al., 1999;
Elliot et al., 2001, 2002] and thus changes in the atmo-
spheric radiocarbon content [e.g., Yokoyama et al., 2000],
as well as reservoir issues such as mentioned above,
means that it is uncertain how to interpret the value of
Figure 19. Maps of data from Heinrich layer H3. GeologyandRuddiman [1997] IRD belt for reference. (a) Isopachmapwith 10 cm contour interval. (b) The 87Sr/86Sr values forsiliciclastic detritus in H3. Isopachs are shown in dashed linesfor reference. (c) The 25-23 kyr 250 mg cm�2 kyr�1 contoursdefining the approximately E-W IRD belt [Ruddiman, 1977],contours of 10, 50, and 100 sand-sized ash shards per squarecentimeter defining the approximately N-S trajectory ofcurrents bringing Icelandic detritus into the North Atlantic[Ruddiman and Glover, 1982], and dashed lines of 10 cmthickness intervals for H3.
RG1005 Hemming: HEINRICH EVENTS
23 of 43
RG1005
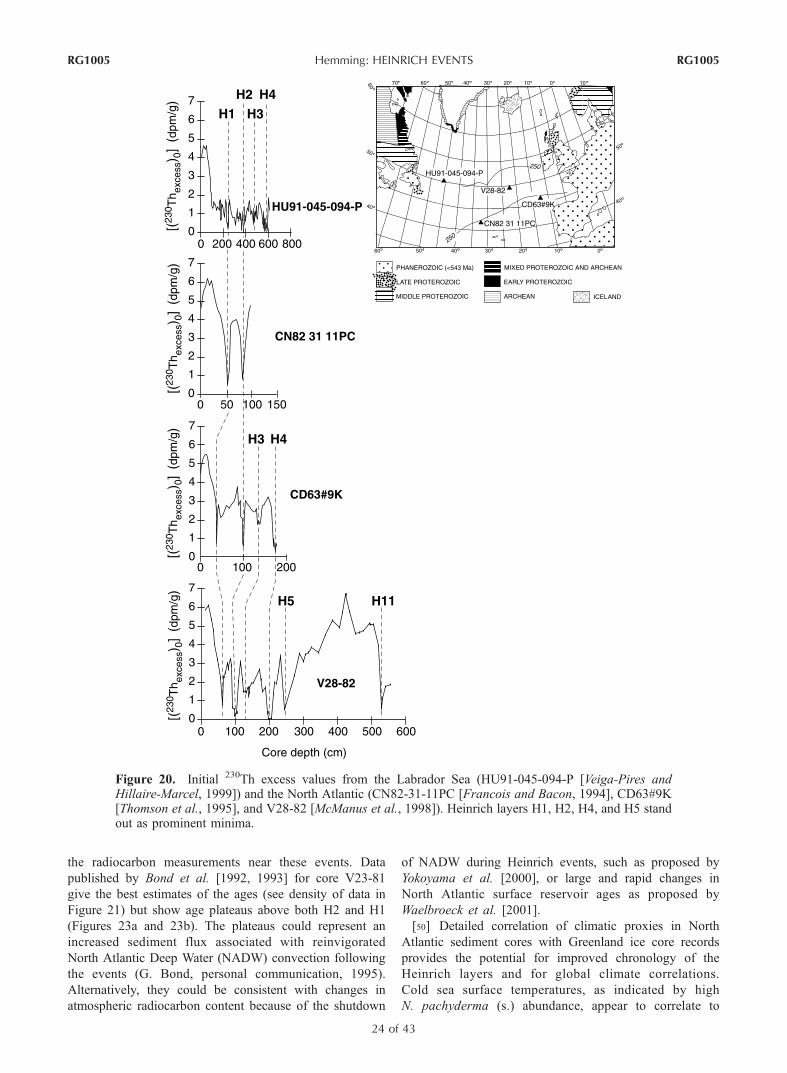
the radiocarbon measurements near these events. Data
published by Bond et al. [1992, 1993] for core V23-81
give the best estimates of the ages (see density of data in
Figure 21) but show age plateaus above both H2 and H1
(Figures 23a and 23b). The plateaus could represent an
increased sediment flux associated with reinvigorated
North Atlantic Deep Water (NADW) convection following
the events (G. Bond, personal communication, 1995).
Alternatively, they could be consistent with changes in
atmospheric radiocarbon content because of the shutdown
of NADW during Heinrich events, such as proposed by
Yokoyama et al. [2000], or large and rapid changes in
North Atlantic surface reservoir ages as proposed by
Waelbroeck et al. [2001].
[50] Detailed correlation of climatic proxies in North
Atlantic sediment cores with Greenland ice core records
provides the potential for improved chronology of the
Heinrich layers and for global climate correlations.
Cold sea surface temperatures, as indicated by high
N. pachyderma (s.) abundance, appear to correlate to
Figure 20. Initial 230Th excess values from the Labrador Sea (HU91-045-094-P [Veiga-Pires andHillaire-Marcel, 1999]) and the North Atlantic (CN82-31-11PC [Francois and Bacon, 1994], CD63#9K[Thomson et al., 1995], and V28-82 [McManus et al., 1998]). Heinrich layers H1, H2, H4, and H5 standout as prominent minima.
RG1005 Hemming: HEINRICH EVENTS
24 of 43
RG1005

low d18O of Greenland ice (Figure 24) [Bond et al., 1993,
1999]. Estimates of the calendar ages of Heinrich events,
using this approach for H3–H6, are provided in Table 4.
However, in detail, there are some substantial differences
among the patterns that introduce uncertainty in the
correlations and thus ice core-based chronologies. In
particular, the Heinrich events do not stand out as more
extreme temperatures in the Greenland ice cores, although
they do appear to be located within longer-duration cold
spells (Figure 24). Additionally, this correlation method
appears to work best during stage 3 (i.e., between H5 and
H3) and is not particularly sensitive within stages 2 and 4.
Radiocarbon dating provides a good alternative (with
caveats stated above) within stage 2, but stage 4 remains
problematic. The approach of correlating to the Greenland
ice cores with detailed speleothem records that can be
precisely dated using U series methods shows promise for
improving ice core chronology [e.g., Wang et al., 2001],
but this depends on the accuracy of correlation, as dis-
cussed section 5.2.
[51] Published estimates of Heinrich layer duration are
given in Table 3, and they range from 208 to 2280 years.
In the Labrador Sea data, where the focusing factor is very
large and its value is uncontrolled during Heinrich layers
[Veiga-Pires and Hillaire-Marcel, 1999], the apparent
duration is almost twice as long as for other North Atlantic230Thexcess estimates. This core is located in a sediment
drift, and it is uncertain what changes may have happened
to bottom currents during Heinrich events. The Labrador
Sea data are more similar to open Atlantic data, with the
assumption of similar focusing during Heinrich events as
the ambient conditions (minimum estimates of Veiga-Pires
and Hillaire-Marcel [1999]). Taking the best estimates
(that is open ocean 230Thexcess and V23-81 and DSDP60914C data from H1 and H2), the average duration is
495 years, and the standard deviation in this duration is
255 years.
5. PROCESSES THAT MAY PRODUCEHEINRICH LAYERS
[52] As summarized above, Heinrich layers record pro-
found and catastrophic events, likely armadas of icebergs
launched from Hudson Strait. In this section I review the
constraints on volume of water discharged based on the area
covered by Hudson Strait IRD and the d18O composition of
planktonic foraminifera. I then review the mechanisms that
have been proposed for their origin, the implied water
volumes that would be produced by each, and the concen-
tration of IRD that the ice would have contained in each.
Finally, I conclude that it should be possible to resolve their
origin by a combination of local sedimentological synthesis
near Hudson Strait, further quantification of hydrographic
impacts in the North Atlantic, further quantification of ice
and sediment flux using 10Be and 3He, and possibly quan-
tification of global sea level rises that accompanied them.
5.1. Size of the Discharge
[53] Alley and MacAyeal [1994] estimated the mass and
volume of a typical Heinrich IRD layer to be 1.0 ± 0.3 �1015 kg or 370 ± 120 km3. Their estimate was based on
combining the total glacial IRD flux estimate of 9.8 �1015 kg from Ruddiman [1977] with the area fractions under
the SU90-08 magnetic susceptibility curve that are Heinrich
fluxes as opposed to background glacial values [Grousset et
al., 1993]. A consistent estimate of 100–400 km3 is derived
from simple mapping of the layer thickness across the North
Atlantic (Figures 7 and 25 and Table 5), but more impor-
tantly the mapping of Heinrich layer area allows assessment
Figure 21. Age versus depth plots for cores used in plotsthroughout this paper. (a) Cores with high sedimentationrates. Data sources are CH09-K09 [Labeyrie et al., 1999],V23-81 [Bond et al., 1992, 1993], and NA87-22 [Vidal etal., 1997]. The boxes around the data of H1 and H2 indicatethe intervals of V23-81 that are shown in Figures 23a and23b. (b) Cores with low sedimentation rates. Data sourcesare DSDP609 [Bond et al., 1992, 1993], V28-82 [Hemminget al., 1998], SU90-08 [Vidal et al., 1998], SU90-09[Grousset et al., 2001], and V23-14 [Hemming and Hajdas,2003]. The box around the data of H1 indicates the intervalof DSDP609 that is shown in Figure 23c.
RG1005 Hemming: HEINRICH EVENTS
25 of 43
RG1005
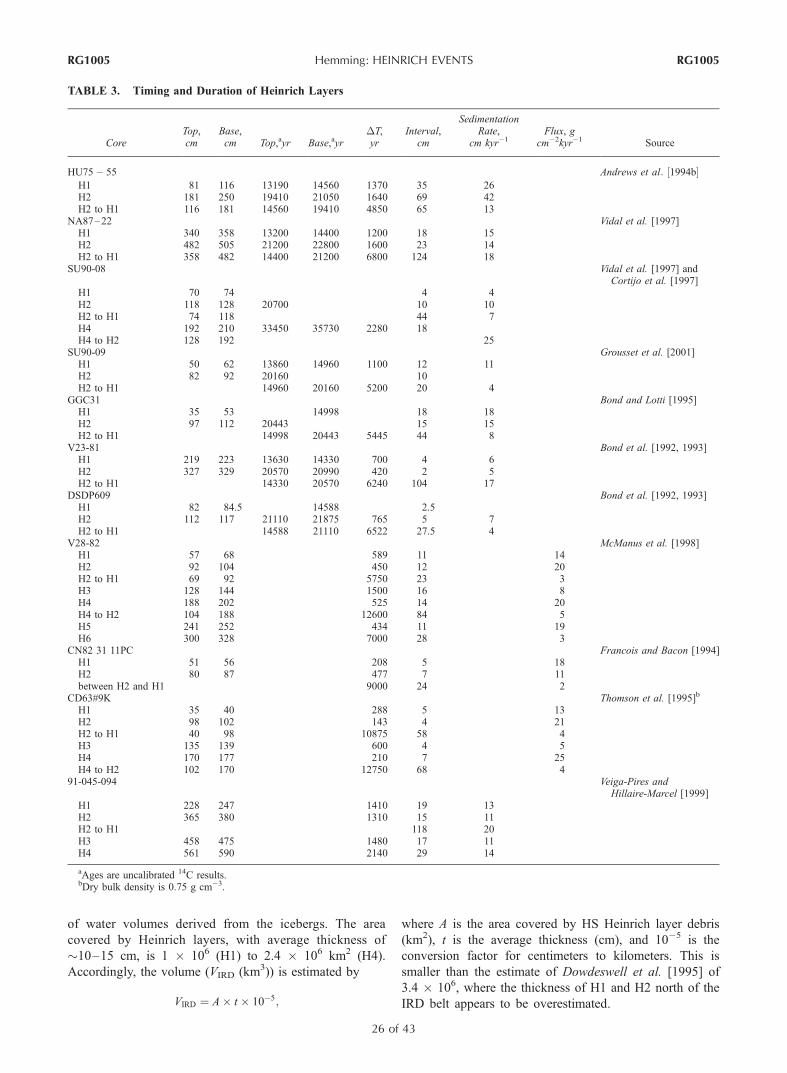
of water volumes derived from the icebergs. The area
covered by Heinrich layers, with average thickness of
�10–15 cm, is 1 � 106 (H1) to 2.4 � 106 km2 (H4).
Accordingly, the volume (VIRD (km3)) is estimated by
VIRD ¼ A� t � 10�5;
where A is the area covered by HS Heinrich layer debris
(km2), t is the average thickness (cm), and 10�5 is the
conversion factor for centimeters to kilometers. This is
smaller than the estimate of Dowdeswell et al. [1995] of
3.4 � 106, where the thickness of H1 and H2 north of the
IRD belt appears to be overestimated.
TABLE 3. Timing and Duration of Heinrich Layers
CoreTop,cm
Base,cm Top,ayr Base,ayr
�T,yr
Interval,cm
SedimentationRate,
cm kyr�1Flux, g
cm�2kyr�1 Source
HU75� 55 Andrews et al: ½1994b�H1 81 116 13190 14560 1370 35 26H2 181 250 19410 21050 1640 69 42H2 to H1 116 181 14560 19410 4850 65 13
NA87–22 Vidal et al. [1997]H1 340 358 13200 14400 1200 18 15H2 482 505 21200 22800 1600 23 14H2 to H1 358 482 14400 21200 6800 124 18
SU90-08 Vidal et al. [1997] andCortijo et al. [1997]
H1 70 74 4 4H2 118 128 20700 10 10H2 to H1 74 118 44 7H4 192 210 33450 35730 2280 18H4 to H2 128 192 25
SU90-09 Grousset et al. [2001]H1 50 62 13860 14960 1100 12 11H2 82 92 20160 10H2 to H1 14960 20160 5200 20 4
GGC31 Bond and Lotti [1995]H1 35 53 14998 18 18H2 97 112 20443 15 15H2 to H1 14998 20443 5445 44 8
V23-81 Bond et al. [1992, 1993]H1 219 223 13630 14330 700 4 6H2 327 329 20570 20990 420 2 5H2 to H1 14330 20570 6240 104 17
DSDP609 Bond et al. [1992, 1993]H1 82 84.5 14588 2.5H2 112 117 21110 21875 765 5 7H2 to H1 14588 21110 6522 27.5 4
V28-82 McManus et al. [1998]H1 57 68 589 11 14H2 92 104 450 12 20H2 to H1 69 92 5750 23 3H3 128 144 1500 16 8H4 188 202 525 14 20H4 to H2 104 188 12600 84 5H5 241 252 434 11 19H6 300 328 7000 28 3
CN82 31 11PC Francois and Bacon [1994]H1 51 56 208 5 18H2 80 87 477 7 11between H2 and H1 9000 24 2
CD63#9K Thomson et al. [1995]b
H1 35 40 288 5 13H2 98 102 143 4 21H2 to H1 40 98 10875 58 4H3 135 139 600 4 5H4 170 177 210 7 25H4 to H2 102 170 12750 68 4
91-045-094 Veiga-Pires andHillaire-Marcel [1999]
H1 228 247 1410 19 13H2 365 380 1310 15 11H2 to H1 118 20H3 458 475 1480 17 11H4 561 590 2140 29 14
aAges are uncalibrated 14C results.bDry bulk density is 0.75 g cm�3.
RG1005 Hemming: HEINRICH EVENTS
26 of 43
RG1005
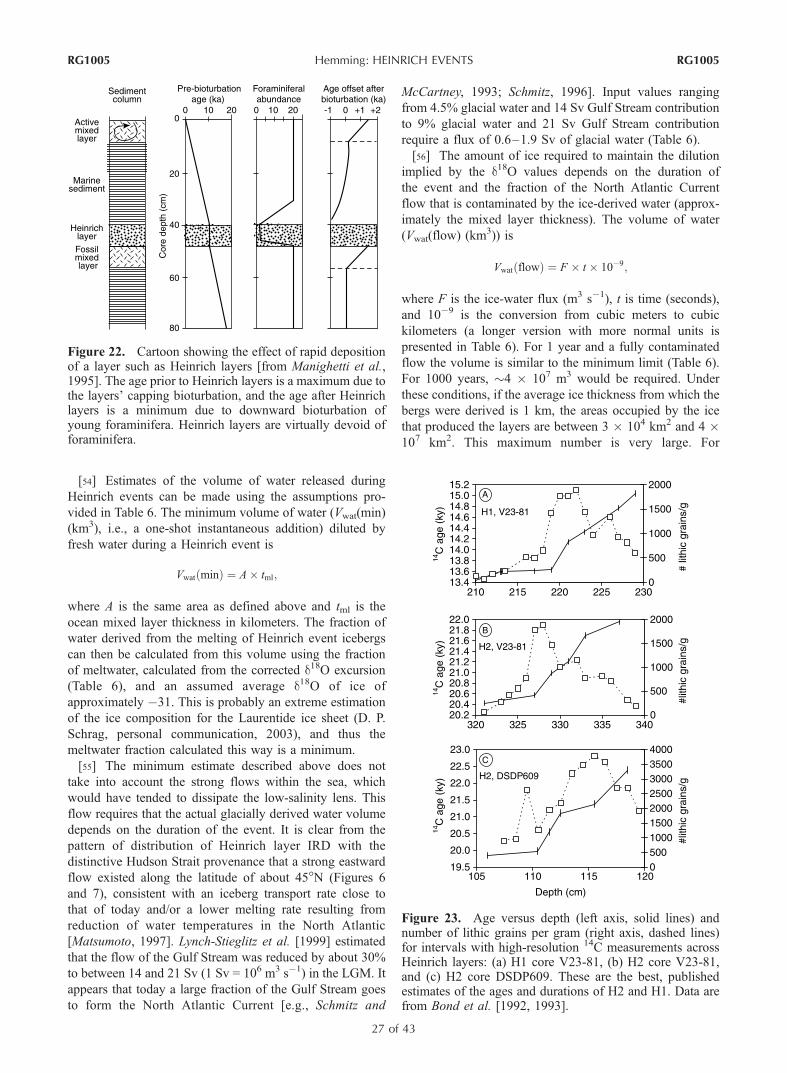
[54] Estimates of the volume of water released during
Heinrich events can be made using the assumptions pro-
vided in Table 6. The minimum volume of water (Vwat(min)
(km3), i.e., a one-shot instantaneous addition) diluted by
fresh water during a Heinrich event is
Vwat minð Þ ¼ A� tml;
where A is the same area as defined above and tml is the
ocean mixed layer thickness in kilometers. The fraction of
water derived from the melting of Heinrich event icebergs
can then be calculated from this volume using the fraction
of meltwater, calculated from the corrected d18O excursion
(Table 6), and an assumed average d18O of ice of
approximately �31. This is probably an extreme estimation
of the ice composition for the Laurentide ice sheet (D. P.
Schrag, personal communication, 2003), and thus the
meltwater fraction calculated this way is a minimum.
[55] The minimum estimate described above does not
take into account the strong flows within the sea, which
would have tended to dissipate the low-salinity lens. This
flow requires that the actual glacially derived water volume
depends on the duration of the event. It is clear from the
pattern of distribution of Heinrich layer IRD with the
distinctive Hudson Strait provenance that a strong eastward
flow existed along the latitude of about 45�N (Figures 6
and 7), consistent with an iceberg transport rate close to
that of today and/or a lower melting rate resulting from
reduction of water temperatures in the North Atlantic
[Matsumoto, 1997]. Lynch-Stieglitz et al. [1999] estimated
that the flow of the Gulf Stream was reduced by about 30%
to between 14 and 21 Sv (1 Sv = 106 m3 s�1) in the LGM. It
appears that today a large fraction of the Gulf Stream goes
to form the North Atlantic Current [e.g., Schmitz and
McCartney, 1993; Schmitz, 1996]. Input values ranging
from 4.5% glacial water and 14 Sv Gulf Stream contribution
to 9% glacial water and 21 Sv Gulf Stream contribution
require a flux of 0.6–1.9 Sv of glacial water (Table 6).
[56] The amount of ice required to maintain the dilution
implied by the d18O values depends on the duration of
the event and the fraction of the North Atlantic Current
flow that is contaminated by the ice-derived water (approx-
imately the mixed layer thickness). The volume of water
(Vwat(flow) (km3)) is
Vwat flowð Þ ¼ F � t � 10�9;
where F is the ice-water flux (m3 s�1), t is time (seconds),
and 10�9 is the conversion from cubic meters to cubic
kilometers (a longer version with more normal units is
presented in Table 6). For 1 year and a fully contaminated
flow the volume is similar to the minimum limit (Table 6).
For 1000 years, �4 � 107 m3 would be required. Under
these conditions, if the average ice thickness from which the
bergs were derived is 1 km, the areas occupied by the ice
that produced the layers are between 3 � 104 km2 and 4 �107 km2. This maximum number is very large. For
Figure 23. Age versus depth (left axis, solid lines) andnumber of lithic grains per gram (right axis, dashed lines)for intervals with high-resolution 14C measurements acrossHeinrich layers: (a) H1 core V23-81, (b) H2 core V23-81,and (c) H2 core DSDP609. These are the best, publishedestimates of the ages and durations of H2 and H1. Data arefrom Bond et al. [1992, 1993].
Figure 22. Cartoon showing the effect of rapid depositionof a layer such as Heinrich layers [from Manighetti et al.,1995]. The age prior to Heinrich layers is a maximum due tothe layers’ capping bioturbation, and the age after Heinrichlayers is a minimum due to downward bioturbation ofyoung foraminifera. Heinrich layers are virtually devoid offoraminifera.
RG1005 Hemming: HEINRICH EVENTS
27 of 43
RG1005
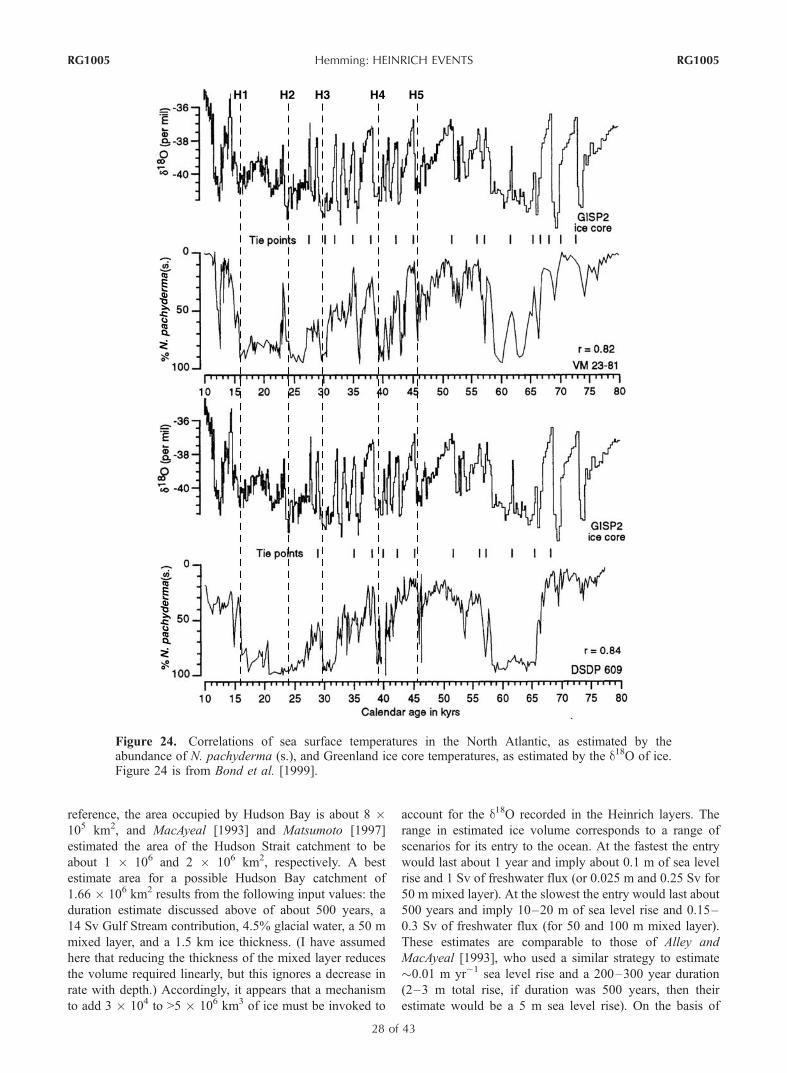
reference, the area occupied by Hudson Bay is about 8 �105 km2, and MacAyeal [1993] and Matsumoto [1997]
estimated the area of the Hudson Strait catchment to be
about 1 � 106 and 2 � 106 km2, respectively. A best
estimate area for a possible Hudson Bay catchment of
1.66 � 106 km2 results from the following input values: the
duration estimate discussed above of about 500 years, a
14 Sv Gulf Stream contribution, 4.5% glacial water, a 50 m
mixed layer, and a 1.5 km ice thickness. (I have assumed
here that reducing the thickness of the mixed layer reduces
the volume required linearly, but this ignores a decrease in
rate with depth.) Accordingly, it appears that a mechanism
to add 3 � 104 to >5 � 106 km3 of ice must be invoked to
account for the d18O recorded in the Heinrich layers. The
range in estimated ice volume corresponds to a range of
scenarios for its entry to the ocean. At the fastest the entry
would last about 1 year and imply about 0.1 m of sea level
rise and 1 Sv of freshwater flux (or 0.025 m and 0.25 Sv for
50 m mixed layer). At the slowest the entry would last about
500 years and imply 10–20 m of sea level rise and 0.15–
0.3 Sv of freshwater flux (for 50 and 100 m mixed layer).
These estimates are comparable to those of Alley and
MacAyeal [1993], who used a similar strategy to estimate
�0.01 m yr�1 sea level rise and a 200–300 year duration
(2–3 m total rise, if duration was 500 years, then their
estimate would be a 5 m sea level rise). On the basis of
Figure 24. Correlations of sea surface temperatures in the North Atlantic, as estimated by theabundance of N. pachyderma (s.), and Greenland ice core temperatures, as estimated by the d18O of ice.Figure 24 is from Bond et al. [1999].
RG1005 Hemming: HEINRICH EVENTS
28 of 43
RG1005
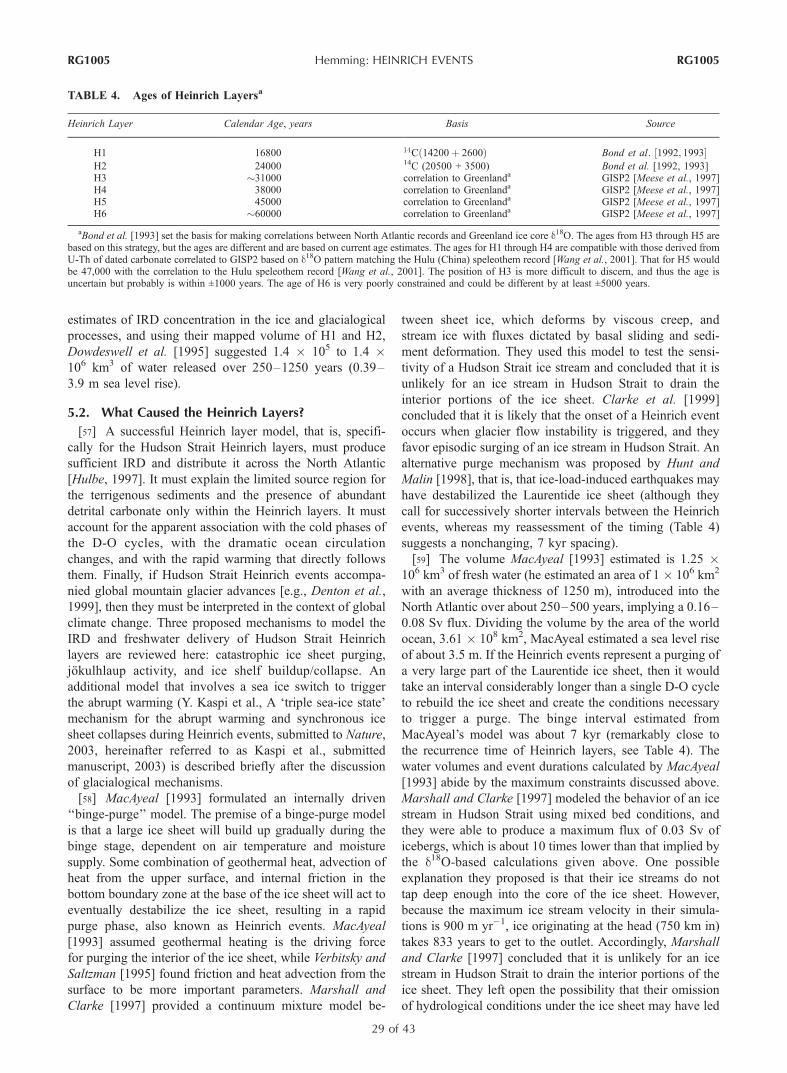
estimates of IRD concentration in the ice and glacialogical
processes, and using their mapped volume of H1 and H2,
Dowdeswell et al. [1995] suggested 1.4 � 105 to 1.4 �106 km3 of water released over 250–1250 years (0.39–
3.9 m sea level rise).
5.2. What Caused the Heinrich Layers?
[57] A successful Heinrich layer model, that is, specifi-
cally for the Hudson Strait Heinrich layers, must produce
sufficient IRD and distribute it across the North Atlantic
[Hulbe, 1997]. It must explain the limited source region for
the terrigenous sediments and the presence of abundant
detrital carbonate only within the Heinrich layers. It must
account for the apparent association with the cold phases of
the D-O cycles, with the dramatic ocean circulation
changes, and with the rapid warming that directly follows
them. Finally, if Hudson Strait Heinrich events accompa-
nied global mountain glacier advances [e.g., Denton et al.,
1999], then they must be interpreted in the context of global
climate change. Three proposed mechanisms to model the
IRD and freshwater delivery of Hudson Strait Heinrich
layers are reviewed here: catastrophic ice sheet purging,
jokulhlaup activity, and ice shelf buildup/collapse. An
additional model that involves a sea ice switch to trigger
the abrupt warming (Y. Kaspi et al., A ‘triple sea-ice state’
mechanism for the abrupt warming and synchronous ice
sheet collapses during Heinrich events, submitted to Nature,
2003, hereinafter referred to as Kaspi et al., submitted
manuscript, 2003) is described briefly after the discussion
of glacialogical mechanisms.
[58] MacAyeal [1993] formulated an internally driven
‘‘binge-purge’’ model. The premise of a binge-purge model
is that a large ice sheet will build up gradually during the
binge stage, dependent on air temperature and moisture
supply. Some combination of geothermal heat, advection of
heat from the upper surface, and internal friction in the
bottom boundary zone at the base of the ice sheet will act to
eventually destabilize the ice sheet, resulting in a rapid
purge phase, also known as Heinrich events. MacAyeal
[1993] assumed geothermal heating is the driving force
for purging the interior of the ice sheet, while Verbitsky and
Saltzman [1995] found friction and heat advection from the
surface to be more important parameters. Marshall and
Clarke [1997] provided a continuum mixture model be-
tween sheet ice, which deforms by viscous creep, and
stream ice with fluxes dictated by basal sliding and sedi-
ment deformation. They used this model to test the sensi-
tivity of a Hudson Strait ice stream and concluded that it is
unlikely for an ice stream in Hudson Strait to drain the
interior portions of the ice sheet. Clarke et al. [1999]
concluded that it is likely that the onset of a Heinrich event
occurs when glacier flow instability is triggered, and they
favor episodic surging of an ice stream in Hudson Strait. An
alternative purge mechanism was proposed by Hunt and
Malin [1998], that is, that ice-load-induced earthquakes may
have destabilized the Laurentide ice sheet (although they
call for successively shorter intervals between the Heinrich
events, whereas my reassessment of the timing (Table 4)
suggests a nonchanging, 7 kyr spacing).
[59] The volume MacAyeal [1993] estimated is 1.25 �106 km3 of fresh water (he estimated an area of 1 � 106 km2
with an average thickness of 1250 m), introduced into the
North Atlantic over about 250–500 years, implying a 0.16–
0.08 Sv flux. Dividing the volume by the area of the world
ocean, 3.61 � 108 km2, MacAyeal estimated a sea level rise
of about 3.5 m. If the Heinrich events represent a purging of
a very large part of the Laurentide ice sheet, then it would
take an interval considerably longer than a single D-O cycle
to rebuild the ice sheet and create the conditions necessary
to trigger a purge. The binge interval estimated from
MacAyeal’s model was about 7 kyr (remarkably close to
the recurrence time of Heinrich layers, see Table 4). The
water volumes and event durations calculated by MacAyeal
[1993] abide by the maximum constraints discussed above.
Marshall and Clarke [1997] modeled the behavior of an ice
stream in Hudson Strait using mixed bed conditions, and
they were able to produce a maximum flux of 0.03 Sv of
icebergs, which is about 10 times lower than that implied by
the d18O-based calculations given above. One possible
explanation they proposed is that their ice streams do not
tap deep enough into the core of the ice sheet. However,
because the maximum ice stream velocity in their simula-
tions is 900 m yr�1, ice originating at the head (750 km in)
takes 833 years to get to the outlet. Accordingly, Marshall
and Clarke [1997] concluded that it is unlikely for an ice
stream in Hudson Strait to drain the interior portions of the
ice sheet. They left open the possibility that their omission
of hydrological conditions under the ice sheet may have led
TABLE 4. Ages of Heinrich Layersa
Heinrich Layer Calendar Age, years Basis Source
H1 16800 14Cð14200þ 2600Þ Bond et al: ½1992; 1993�H2 24000 14C (20500 + 3500) Bond et al. [1992, 1993]H3 �31000 correlation to Greenlanda GISP2 [Meese et al., 1997]H4 38000 correlation to Greenlanda GISP2 [Meese et al., 1997]H5 45000 correlation to Greenlanda GISP2 [Meese et al., 1997]H6 �60000 correlation to Greenlanda GISP2 [Meese et al., 1997]
aBond et al. [1993] set the basis for making correlations between North Atlantic records and Greenland ice core d18O. The ages from H3 through H5 arebased on this strategy, but the ages are different and are based on current age estimates. The ages for H1 through H4 are compatible with those derived fromU-Th of dated carbonate correlated to GISP2 based on d18O pattern matching the Hulu (China) speleothem record [Wang et al., 2001]. That for H5 wouldbe 47,000 with the correlation to the Hulu speleothem record [Wang et al., 2001]. The position of H3 is more difficult to discern, and thus the age isuncertain but probably is within ±1000 years. The age of H6 is very poorly constrained and could be different by at least ±5000 years.
RG1005 Hemming: HEINRICH EVENTS
29 of 43
RG1005

to an underestimation, and this theme was extended by
Clarke et al. [1999]. The Verbitsky and Saltzman [1995]
model implies that the formation of the Heinrich events
depends on climate; however, Marshall and Clarke [1997]
concluded that the response time of the Laurentide ice sheet
to climate change is quite long. Large ice streams tend to
take on oscillatory behavior without the need for climate
forcing [Marshall and Clarke, 1997], and rapid climate
change is integrated into the buildup of the ice sheet (S. J.
Marshall, personal communication, 2002). However, hydro-
logically controlled ice streams might have a more direct
influence from climate change [Marshall and Clarke,
1997], and Clarke et al. [1999] speculated that during the
buildup to a Heinrich event, phase locking between an
atmospheric forcing applied to the ice surface and subgla-
cial meltwater production can be achieved if the ice bed
contact is at the melting temperature and strain heating is
appreciable. The apparent interhemispheric symmetry of
mountain glacier advances and their coincidence in timing
with Heinrich events [e.g., Lowell et al., 1995; Denton et
al., 1999] favors a climate control on the Heinrich layers but
does not eliminate the binge-purge behavior.
Figure 25. Equal area maps of H1-H4 used to estimate area covered by Hudson Strait-derived IRD:(a) H1, (b) H2, (c) H3, and (d) H4. Data sources are reported in Table 1. Numbers are estimated thicknessfor each location. Values of ‘‘0’’ are used where the position where the layer would be is understood butthe layer was not identified. Rectangles surround the areas estimated for the layers, and the results arereported in Table 5.
RG1005 Hemming: HEINRICH EVENTS
30 of 43
RG1005

[60] Johnson and Lauritzen [1995] proposed an alterna-
tive hypothesis for Heinrich layers: Repetitive jokulhlaups
from a Hudson Bay lake may have produced major fresh-
water pulses into the North Atlantic when the ice dams at
the mouth of the Hudson Strait failed. A jokulhlaup is a
massive flood that occurs when the height of the dam is
exceeded by lake level because of rising lake level or
reduced flow of glacial ice into the dam [Johnson and
Lauritzen, 1995]. As noted in section 5.1, the area of
Hudson Bay is about 8 � 105 km2, and if it was overfilled
by 100 m, the amount of water that would spill into the
ocean in this process is around 8 � 104 km3, about twice the
minimum estimate based on the area occupied by H4 and
assuming a 200 m mixed layer. The Johnson and Lauritzen
[1995] mechanism would be very rapid, and thus a number
approaching the minimum estimate is reasonable based on
the volume constraints alone. It is clear that a large fraction
of the precursor fine carbonate sediment deposited near the
Hudson Strait is brought by meltwater not icebergs [e.g.,
Hesse and Khodabakhsh, 1998; Rashid et al., 2003b]. This
model could produce a sea level change of only �0.2 m or
less, and it would be virtually instantaneous. In the distri-
bution of continental ice proposed by the Johnson and
Lauritzen [1995] mechanism, Hudson Bay is filled with
water and surrounded by glacial ice flowing into it rather
than being a glacial dome itself. During early phases of the
ice sheet buildup (stage 5) and possibly for H3, an ice-
damned lake in Hudson Bay is possible; however, during
the LGM it is unlikely that a lake occupied Hudson Bay
(J. Andrews, personal communication, 2003). J. Andrews
(personal communication, 2003) is considering the possi-
bility of large, subglacial lakes under the Laurentide ice
sheet. If large subglacial lakes existed under the Laurentide
ice sheet, this would provide scope for large bursts of
meltwater, accompanied by dramatic destabilization of the
ice sheet.
[61] Hulbe [1997] proposed a model for Heinrich events
in which the Hudson Strait ice stream flows into the
Labrador Sea from a Hudson Bay dome and forms an ice
shelf in the Labrador Sea, in other words with an ice sheet
configuration similar to that assumed by MacAyeal [1993].
The ice shelf model proposed by Hulbe [1997] would
operate under extreme cold conditions, consistent with the
observations of Heinrich layers in DSDP609 and V23-81
[e.g., Bond et al., 1992; Broecker et al., 1992]. Ice shelves
form where grounded ice flows into the sea and floats on the
surface. In this model, sediment would be enriched in the
basal zone of the ice shelf by basal freezing due to large
slopes in the basal topography. Hulbe’s [1997] model
appears to produce an acceptable volume of ice of 800 �1200 km, with �500 m average thickness (4.8 � 105 km3 of
ice). However, there is not a Heinrich event for every cold
interval in Greenland, and the d18O excursions coincident
TABLE 6. Parameters Used to Calculate Water Volumes From Hudson Strait Heinrich Events
Parameter Used Value Source or Calculation
d18O of ice �28 to� 34% Duplessy et al. [2002] and Schrag et al. [2002](note that the Laurentide is likely heavier, so this yieldsminimum volumes (D. P. Schrag, personal communication, 2003))
Magnitude of d18O excursion(d18OHeinrich �18Oambient)
�1 to �2% Cortijo et al. [1997]
Temperature lowering (�T) 3� to 4�C Cortijo et al. [1997]d18O excursion of water �1.7 to �2.9% (d18OHeinrich � d18Oambient) � (�Heinrich � �ambient)
a
Area of Heinrich layers A 0.7 to 2.3 � 106 km2 Table 3 and Figure 24Mixed layer depth (MLD) 0.02 to 0.1 km Kara et al. [2003]Volume of water (minimum)(b) 1.4 � 104 to 2.3 � 105 km3 from A times mixed layer depthDuration t 1 to 500 years timing and duration sectionReplenishment of NAC 14 to 21 Sv Lynch-Stieglitz et al. [1999] and Schmitz and McCartney [1993]Flux of water to maintain dilution F 0.6 to 1.9 Sv (4.5% of 14 Sv) to (9% of 21 Sv)c
Volume of water(d) 1.9 � 104 to 3 � 107 km(e) Vwater(km3) = F(Sv) � 1 � 106(m3 s�1 Sv�1) �
t(years) � 3.15 � 107(s yr�1) � 10�9 (km3 m�3)
aTemperature-d18O relationship [Shackleton, 1967] is shown: (T �C � 16.9)/(�4.28) = �(� is CaCO3 minus water difference; in the case presented here,�Heinrich � �ambient is taken from the 3�–4�C temperature lowering and is �3/(�4.28) or �4/(�4.28) or an extra 0.7–0.9% added to the measuredexcursion).
bValue assumes a volume the area of the Heinrich layers, and the thickness of the mixed layer is mixed one time with enough ice and water to make thed18O excursion.
cHere 4.5% and 9% are the range in d18O excursion as deduced from information provided in Table 6 on measured values, assumed ice values, and thetemperature-d18O relationship.
dThe range of estimates from 1 to 500 years is used to estimate the volume of water with the equation in the third column. For the minimum a 1 yearduration and 0.6 Sv flow are assumed. For the maximum a 500 year duration and 1.9 Sv flow are assumed.
eThe estimate 3 � 107 km3 is probably beyond what is reasonable, as discussed in text. In Table 7 and the text I suggest possible modifications of the‘‘maximum’’ estimate.
TABLE 5. Area and Volume Estimates of Heinrich Layer IRD
H LayerArea Covered,
km2Average
Thickness, cmVolume
Detritus, km3
1 1:0� 106 10 100
2 2.0 � 106 15 3003 0.7 � 106 15 994 2.4 � 106 15 350
RG1005 Hemming: HEINRICH EVENTS
31 of 43
RG1005

with Heinrich events do not stand out in magnitude
(Figure 24). Nonetheless, Heinrich events do appear to
occupy relatively long cold intervals, and the model shelf
needs about a thousand years of cooling to build up the ice
shelf volume noted above [Hulbe, 1997]. Hulbe’s model
should predict detrital carbonate events for every cold phase
of the D-O cycles in the vicinity of Hudson Strait. Indeed, it
appears that there might be such events [Andrews and
Barber, 2002], although the greatly reduced amplitudes that
are implied are puzzling unless the freezing-on process in
the ice shelf model operates effectively only when the shelf
is fully developed. Sea level should not rise because of ice
shelf collapse because the ice is already floating in the
Labrador Sea prior to its release. However, perhaps small
sea level rise from surges of other ice sheets could be a
trigger for Hudson Strait collapse. Additionally, the collapse
of the ice shelf could allow enhanced ice stream activity in
Hudson Strait (although this does not appear to provide
appropriate amounts of ice in the required time interval
according to the work of Marshall and Clarke [1997]).
[62] Hulbe et al. [2004] suggest a revision of the ice shelf
hypothesis. In the new scenario the ice shelf is fringing the
Laurentide ice sheet margin rather than extending across the
Labrador Sea, and the events are formed by explosive
disintegration of the ice shelf such as recently witnessed
along the Antarctic Peninsula. The proposed ice shelf was
fed by several ice streams, which have been identified by
geomorphic studies. Each of the suggested ice streams is
underlain by dominantly Churchill Province basement,
consistent with the provenance constraints. The ice-derived
water volume estimated in this study is 2.8 � 104 to 2 �105 km3, consistent with volume constraints shown in
Table 6 as long as the duration is very short.
[63] The three mechanisms described above, (1) purging
of the Laurentide ice sheet [MacAyeal, 1993; Verbitsky
and Saltzman, 1995; Hunt and Malin, 1998; Clarke et al.,
1999] or episodic activity of an ice stream in Hudson
Strait [Marshall and Clarke, 1997], (2) jokulhlaup activity
[Johnson and Lauritzen, 1995], and (3) ice shelf buildup/
collapse [Hulbe, 1997; Hulbe et al., 2004], all appear to be
capable of producing the first-order features of the Heinrich
layers, including the large injection of fresh water into the
North Atlantic Current (with volume depending on dura-
tion, see Table 7) and the large volume of sediment
deposited rapidly in these events. In the purging and
jokulhlaup scenarios the best way to get IRD-enriched
icebergs appears to be a glaciohydraulic supercooling
mechanism [e.g., Alley et al., 1997, 1998; Lawson et al.,
1998; Roberts et al., 2002], which would allow the limited
sediment provenance of Heinrich layer sediments [Bond et
al., 1992; Gwiazda et al., 1996a; Hemming et al., 1998,
2002]. In this mechanism, ice accretes to the bottom of the
glacier ice from water that is supercooled due to flowing up
large topographic features such as the Hudson Strait sill. In
the case of binge-purge behavior, basal debris entrainment
mechanisms described by Alley and MacAyeal [1994] will
also yield appropriate sediment loads. Glaciohydraulic
supercooling may not apply to the ice shelf model. Accord-
ing to R. Alley (personal communication, 2003) the detritus
from the mouth of Hudson Strait is most likely melted out.
This is because the ice shelf is likely to be thickest in the
mouth of Hudson Strait where the bed is deep. Freeze-on
would be expected down flow, where the ice shelf is thinner,
but after the debris has melted out. Alternatively, the freeze-
on could be transverse to flow, which would tend to
preserve sediment incorporated in the slower moving ice
from the sides of the strait rather than in the main ice
coming out of the strait (or other ice streams in the modified
ice shelf model of Hulbe et al. [2004]). Additionally, it is
likely that warming, rather than sea level rise, drives the
retreat of the ice shelf [e.g., Parizek et al., 2002; Hulbe et
al., 2004], although the revised ice shelf model may not
require very substantial warming [Hulbe et al., 2004].
[64] Taking everything together, glacialogical instability
(episodic purging) seems to be the most likely explanation
for the Hudson Strait Heinrich layers unless it can be
demonstrated that these events are substantially shorter than
the apparent 500 year duration or that the mixed layer is
extremely thin (�0.5–1 m). Such a thin mixed layer seems
unlikely given the (probably) more vigorous atmospheric
circulation that accompanies Heinrich events. Interestingly,
a scenario that involves components of all three proposed
end-members may have some appeal. Buttressing by an ice
shelf during cold periods could lock up the Hudson Strait
TABLE 7. Vital Statistics of Heinrich Layers
Duration 495 ± 255 years (1s)
Freshwater flux � 3� 104 km3ð 1 year; 200 m mixed layerÞ�1 � 107 km3 (500 years, 4.5% ice water, and 14 Sv flow);if assumption of 100 (or 50) m mixed layer halves(quarters) volume,then 5 (or 2.5) � 106 km3
Sea level rise 0 m (ice shelf)0.2 m (jokulhaup)3–15 m (Laurentide ice sheet purge)
Size of Hudson Strait catchment 1.66 � 106 km2 (for 5 � 106 km3 volume and 3 km icethickness or for 2.5 � 106 km3 volume and 1.5 km thickness)
Average ice thickness for 500 year duration �1.5 kmVolume of over-deepened Hudson Strait �2 � 103 km3
Volume of IRD 100–350 km3
Concentration of IRD in ice 0.01–10%
RG1005 Hemming: HEINRICH EVENTS
32 of 43
RG1005
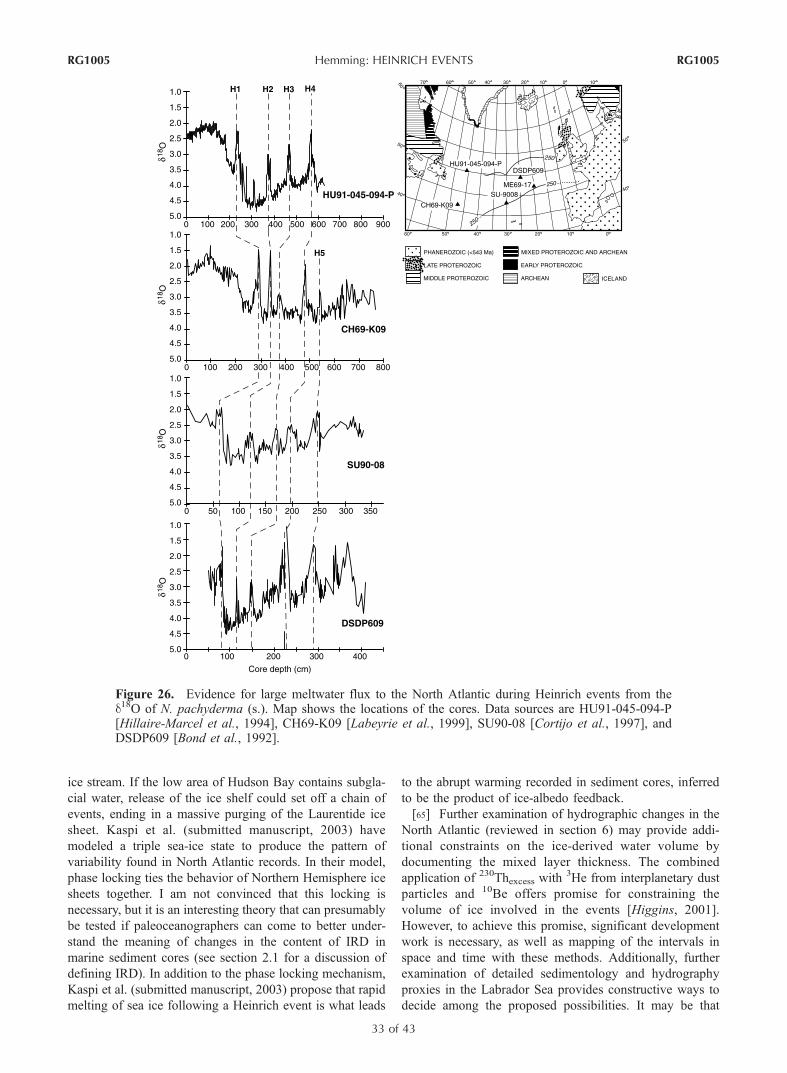
ice stream. If the low area of Hudson Bay contains subgla-
cial water, release of the ice shelf could set off a chain of
events, ending in a massive purging of the Laurentide ice
sheet. Kaspi et al. (submitted manuscript, 2003) have
modeled a triple sea-ice state to produce the pattern of
variability found in North Atlantic records. In their model,
phase locking ties the behavior of Northern Hemisphere ice
sheets together. I am not convinced that this locking is
necessary, but it is an interesting theory that can presumably
be tested if paleoceanographers can come to better under-
stand the meaning of changes in the content of IRD in
marine sediment cores (see section 2.1 for a discussion of
defining IRD). In addition to the phase locking mechanism,
Kaspi et al. (submitted manuscript, 2003) propose that rapid
melting of sea ice following a Heinrich event is what leads
to the abrupt warming recorded in sediment cores, inferred
to be the product of ice-albedo feedback.
[65] Further examination of hydrographic changes in the
North Atlantic (reviewed in section 6) may provide addi-
tional constraints on the ice-derived water volume by
documenting the mixed layer thickness. The combined
application of 230Thexcess with3He from interplanetary dust
particles and 10Be offers promise for constraining the
volume of ice involved in the events [Higgins, 2001].
However, to achieve this promise, significant development
work is necessary, as well as mapping of the intervals in
space and time with these methods. Additionally, further
examination of detailed sedimentology and hydrography
proxies in the Labrador Sea provides constructive ways to
decide among the proposed possibilities. It may be that
Figure 26. Evidence for large meltwater flux to the North Atlantic during Heinrich events from thed18O of N. pachyderma (s.). Map shows the locations of the cores. Data sources are HU91-045-094-P[Hillaire-Marcel et al., 1994], CH69-K09 [Labeyrie et al., 1999], SU90-08 [Cortijo et al., 1997], andDSDP609 [Bond et al., 1992].
RG1005 Hemming: HEINRICH EVENTS
33 of 43
RG1005

much of the hydrographic and sedimentological data
from Labrador Sea cores are available [e.g., Andrews
and Tedesco, 1992; Andrews et al., 1994a, 1994b, 1998;
Hillaire-Marcel et al., 1994; Jennings et al., 1996; Hesse
and Khodabakhsh, 1998; Hillaire-Marcel and Bilodeau,
2000; de Vernal and Hillaire-Marcel, 2000; de Vernal et
al., 2000; Rashid et al., 2003b], and a synthesis with the
goal of testing the alternative hypotheses for Heinrich
events could be what is most needed.
6. IMPACTS AND CORRELATIVES
6.1. Surface and Deep Water Changesin the North Atlantic
[66] Maslin et al. [1995] used foraminiferal assemblages
combined with d18O measurements of planktonic forami-
nifera to estimate temperature and salinity at the sea surface
and found dramatic reduction in both temperature and
salinity during Heinrich events. During Heinrich events,
there is a dip in the d18O of up to 2% in N. pachyderma (s.)
within the IRD belt, which reveals the change in tempera-
ture and salinity attributable to the large amount of ice
melting (Figure 26). U37K0-based sea surface temperature
estimates indicate that sea surface temperatures were
reduced in eastern Atlantic cores during these events
[Madureira et al., 1997; Rosell-Mele et al., 1997; Bard et
al., 2000], consistent with faunal evidence [e.g., Bond et al.,
1993; Cortijo et al., 1997]. Other biomarkers are consistent
with a dramatic salinity reduction during these events [Bard
et al., 2000]. de Vernal and Hillaire-Marcel [2000] and de
Vernal et al. [2000] found evidence from dinoflagellate cyst
assemblages for low-salinity conditions, accompanied by
extensive sea ice, around the margins of the North Atlantic
during the LGM. However, they find evidence for largely
sea ice-free conditions in the eastern Nordic Seas. During
Heinrich events, sea ice cover increased to 10 months per
year, and the sea surface salinity was reduced even further.
The lower d18O of surface water during Heinrich events was
transferred to the deep ocean, and this has been interpreted
to be a signal of brine rejection [Vidal et al., 1998].
[67] Paillard and Cortijo [1999] have made simple
modeling experiments using the planktonic d18O and faunal
data from H4 [Cortijo et al., 1997] (shown in Figure 11b) to
show that such a change in temperature and salinity during
glacial conditions is predicted to result in complete shut-
down of NADW formation. Dramatic NADW reduction
during Heinrich events has been proposed based on obser-
vations of dramatically lowered benthic d13C [e.g., Keigwin
and Lehman, 1994; Vidal et al., 1997, 1998; Zahn et al.,
1997; Willamowski and Zahn, 2000; Elliot et al., 2002].
This dramatic reduction of NADW formation is further
supported by excess Pa/Th ratios from Bermuda Rise sedi-
ments [McManus et al., 2002; J. F. McManus et al., Rapid
deglacial changes in the Atlantic meridional circulation
recorded in sedimentary 231Pa/230Th, submitted to Nature,
2002].
[68] Such changes in the thermohaline circulation could
be triggers for abrupt climate change [e.g., Broecker, 1994;
Clark et al., 2002; Rahmstorf, 2002], and hints that they
may be mirrored by deep water changes in the northeastern
Pacific suggest the possibility of globally propagated sig-
nals by deep water circulation changes [e.g., Lund and Mix,
1998]. Alternatively, they could be responses to abrupt
climate change [e.g., Boyle, 2000; Wunch, 2003; Kaspi et
al., submitted manuscript, 2003]. The estimated flux of
glacial meltwater ranges from 3 � 104 km3 (and 1.6 Sv in
1 year) to 5 � 106 km3 (0.3 Sv over 500 year interval),
derived in section 5 on origin of the Heinrich layers. Model
studies have shown a dramatic decrease of NADW turnover
when a sudden flux of fresh water is injected into the North
Atlantic [e.g., Manabe and Stouffer, 1995; Paillard, 1995;
Seidov and Maslin, 1999; Alley et al., 2001; Ganopolski and
Rahmstorf, 2002] (see recent review articles by Clark et al.
[2002] and Rahmstorf [2002]). These models differ in detail
but have in common the sensitivity of Atlantic overturning
to freshwater injections. They also produce a cooling of air
and sea surface temperatures in the eastern North Atlantic
when overturning is slowed or halted.
[69] Global climate changes may have triggered the
Heinrich layers [e.g., Denton et al., 1999], but certainly
the Laurentide response during Heinrich events must have
made a significant impact on regional climate. Schmittner et
al. [2002] suggested that the presence of large continental
ice sheets in the Northern Hemisphere may lead to increased
instability in climate. Even if NADW shutdown was not the
trigger for global climate change, the imprint it left in the
benthic marine record should provide important correlation
ties [e.g., Charles et al., 1996].
6.2. Global Signals
[70] High-resolution records around the globe show ev-
idence for millennial-scale climate variability, particularly
pronounced during stage 3 of the last glacial interval [e.g.,
Broecker, 1994, 2000; Lund and Mix, 1998; Bond et al.,
1999; Mix et al., 2001; Clark et al., 2002; Voelker, 2002;
Rahmstorf, 2002; Siddall et al., 2003]. As discussed below,
several Northern Hemisphere records resemble the pattern
of the Greenland ice cores, and some have extremes that
occur approximately synchronous to Heinrich events with
little evidence of the other millennial variations. Two
important precautions should be kept in mind in interpreting
these records: (1) the achievable accuracy of the chronology
and of correlations at high resolution (e.g., as discussed by
Boyle [2000]) and (2) the sensitivity of the proxy and/or the
region to the changes that accompany the abrupt climate
changes in Greenland and the North Atlantic.
[71] Voelker [2002] provides a review of records with
high-resolution analyses through stage 3. Within the limits
of dating many Northern Hemisphere records show a strong
resemblance to d18O in the Greenland ice core [Boyle,
2000]. This is particularly true of cores within the polar
North Atlantic and Nordic Seas [e.g., Elliot et al., 1998;
Rasmussen et al., 1997; Voelker et al., 1998; Dokken and
Jansen, 1999; van Kreveld et al., 2000]. Examples from
outside the polar seas are the alkenone sea surface temper-
ature records from the Bermuda Rise [Sachs and Lehman,
RG1005 Hemming: HEINRICH EVENTS
34 of 43
RG1005

1999] and Alboran Sea [Cacho et al., 1999], bioturbation
and planktonic and benthic d18O and d13C and total organic
carbon records from the Santa Barbara Basin [Behl and
Kennett, 1996; Kennett et al., 2000], terrigenous runoff
records in the Cariaco Basin [Peterson et al., 2000], and
total organic carbon and d15N records in Arabian Sea
[Schulz et al., 1998; Altabet et al., 2002] sediments.
[72] Although Heinrich events do not stand out in the
Greenland ice core (Figure 24) or in the Santa Barbara and
Cariaco Basins, they do appear as extremes in the Arabian
and Alboran Seas (Figures 3 and 4) and Gulf of Lions
[Rohling et al., 1998]. In at least two records outside the
North Atlantic IRD belt, only the Heinrich pattern is seen
(Figure 3). One is the pollen record from Florida’s Lake
Tulane where pine pollen replaces oak pollen at times
corresponding to the Heinrich events [Grimm et al.,
1993]. A second is the continental margin sediment record
off Brazil where high CaCO3 sedimentation is interrupted
by pulses of continental debris at the times of each Heinrich
event [Arz et al., 1998]. A third record that appears to
capture only Heinrich events is the average grain size of
Chinese loess, where Heinrich intervals are seen as having
larger average grain size, presumably related to stronger
winds [Porter and An, 1995] (however, the resolution of
this record is too low to identify D-O cycles).
[73] If there are some areas that have climate variability
following the pacing of D-O cycles and others that only feel
Heinrich events, then the geographic pattern of where they
do and do not stand out should provide important clues
about the behavior of the climate system [Leuschner and
Sirocko, 2000; Broecker and Hemming, 2001]. However, an
alternative explanation is that different aspects of climate
are recorded by the different proxies and/or in the different
settings. Accordingly, it is possible that the records in which
only Heinrich events are seen would show the other
millennial events with different proxies. Additionally, it is
possible that records where Heinrich events are not seen as
clear extremes could contain proxies that do emphasize
these events over the others.
[74] Examples of both scenarios come from the North
Atlantic itself. Notably, the Greenland ice core does not
record greater light d18O excursions during Heinrich events
than in other cold intervals (Figure 24), although they do
appear to be of longer duration. Heinrich events left a
dramatic IRD signal in the North Atlantic IRD belt, and
there they are clearly related to extreme climate conditions
and very different deep water composition and thus pre-
sumably collapse of NADW formation. However, Heinrich
events are not distinct in every measure of IRD, even in the
IRD belt. Although they are dramatically displayed in230Thexcess flux estimates, detrital carbonate concentration,
and most radiogenic isotope compositions, they are invisi-
ble in records of hematite-stained grains and volcanic glass
counts, where a quasiperiodic 1500 year variability is seen
instead [Bond et al., 1997, 1999].
[75] Different sensitivity is one explanation, and another
possible explanation is that biases in the ability to distin-
guish Heinrich events from other millennial events may be
produced if the proxies are at the limits of their range. For
example, Heinrich events stand out as having an extremely
high percentage of N. pachyderma (s.), indicating low sea
surface temperatures during stage 3 in the North Atlantic’s
DSDP609 (Figure 24). However, in stage 2 this species
makes up close to 100% in DSDP609, and thus H2 does not
stand out at all in the N. pachyderma (s.) of this core.
Furthermore, H1 is marked only by the abrupt reduction in
N. pachyderma (s.) that follows it (Figure 24), possibly in
the transition to interglacial conditions. In core V23-81 the
tops of H1 through H5 are all marked by the abrupt
reduction in percentage of N. pachyderma (s.) (Figure 24).
The two cooling events between H5 and H4 in the ice core
show up with approximately the same scaling in V23-81,
but this is generally not true between H4 and H2. Even
high-resolution North Atlantic records of sea surface tem-
perature variability, as measured by the abundance of
N. pachyderma (s.), do not necessarily highlight the prom-
inence of the Heinrich events (Figure 24), although some
measures do clearly distinguish them from all other events
in the IRD belt as discussed throughout this paper.
[76] By analogy, records outside the IRD zone may
contain proxies that are sensitive to different aspects of
the climate system or are near the limits of their sensitivity.
For example, the median grain size of loess from China
appears to only distinguish Heinrich events, while other
measures show more of the millennial-scale variability
[Porter and An, 1995]. Additionally, in a speleothem d18Orecord from Hulu Cave, located within the same monsoon-
sensitive region, a reasonably certain correlation to the
Greenland ice core can be made within the stage 3 interval,
and the Heinrich events appear as more prominent maxima
than the other cold events [Wang et al., 2001]. The corre-
lation-based approach for Hulu gives comparable ages from
H1, H2, H3, and H4 to those from the Greenland Ice Sheet
Project 2 (GISP2)/North Atlantic correlations but implies an
approximately 2 kyr older age for H5. The pattern of d18Ovariation in Hulu does not appear to be similar to GISP2
beyond this interval. A very large number of papers,
reporting records from Chinese loess deposits and nearby
marginal seas, include reference to the Heinrich events.
However, suggestion of clear pattern matches to Heinrich
events is not convincing. There does appear to be evidence
for recurrent runoff events from the Selenga River into Lake
Baikal that are approximately coincident with Heinrich
event timing of H2 through H5, although the chronology
appears quite uncertain [Prokopenko et al., 2001].
[77] The records studied by Arz et al. [1998], from the
Brazil margin, and by Peterson et al. [2000], from the
Cariaco Basin, are both located near tropical South Amer-
ica, and both are interpreted to reflect variations in rainfall/
runoff. However, the Cariaco record shows a pattern of
variability similar to Greenland ice and does not distinguish
Heinrich events. In contrast, the Brazil margin record only
distinguishes Heinrich events. Perhaps this apparent con-
trast is a real measure of climatic differences at these two
sites. The Cariaco Basin variations were interpreted to
reflect changes in the position of the Intertropical Conver-
RG1005 Hemming: HEINRICH EVENTS
35 of 43
RG1005

gence Zone (ITCZ) (the core is 10�42.730N, 65�10.180W),
with rainy intervals correlated to warm intervals in Green-
land [Peterson et al., 2000]. Today the ITCZ is north of the
equator in July and mostly north of the equator in the
Atlantic in January. However, it does dip far south over
the South American continent in the winter, and it is
considered to have shifted south during the last glacial
interval [Harris and Mix, 1999]. The Arz et al. [1998]
location is 3�40.00S and 37�43.00W, and the runoff events
recorded in this core appear to be reasonably correlated to
Heinrich (cold) intervals. Their explanation is that increased
trade winds may have led to greater precipitation on the
Brazil coast. Arz et al. showed data at a recent miniconfer-
ence (reviewed by Broecker and Hemming [2001]) from
beneath the bulge of Africa where Heinrich events appear to
be dry spells, which would also be consistent with increased
trade winds. Alternatively, perhaps only extreme southward
shifts of the ITCZ during glacial times resulted in the greater
runoff south of the equator, whereas smaller changes
resulted in shifts in the Cariaco Basin hydrology. Could
there be a position in between these locations for which a
wetness proxy would see all the millennial variations, but
the Heinrich events would stand out?
[78] The pattern of difference of Heinrich events com-
pared to ambient glacial as well as the geographic distribu-
tion of sites that are sensitive to Heinrich events versus D-O
events may provide important clues to the driving forces of
these abrupt climate changes. For example, there is no
strong evidence in the North Atlantic for large changes in
NADW production relative to ambient glacial conditions for
each of the non-Heinrich cold stadials. However, during the
four massive Heinrich events, there is dramatic evidence of
deep water change, as evidenced by the extreme d13C values
of benthic foraminifera in these intervals [e.g., Vidal et al.,
1997; Elliot et al., 2002]. As reviewed by Rahmstorf
[2002], three ocean states are inferred: interglacial
(deep NADW formation), glacial (intermediate NADW
formation), and Heinrich (no NADW formation) modes. It
appears that the earliest suggestion of this three-state ocean
can be attributed to Sarnthein et al. [1994], and the idea was
popularized by Alley and Clark [1999]. Presumably, there is
an atmospheric component to spreading all these signals
around the globe, but perhaps the differences between
regular cold snaps and Heinrich cold snaps lie in the specific
mechanisms of thermohaline overturning.
[79] Dokken and Jansen [1999] reported evidence for
contrasting deep water formation mechanisms in the Nordic
Seas during warm and cold intervals of the last glacial. They
documented d18O excursions of benthic foraminifera to light
values, coincident with light excursions of planktonic fora-
minifera and associated with each of the Greenland cooling
events. They inferred that deep water was generated fairly
continuously in the Nordic Seas but in two different ways:
(1) convection in the open ocean in warm intervals and
(2) brine rejection during sea ice formation in cold intervals.
The most extreme of these events are credibly correlated to
Heinrich events. There is a growing literature of high-
resolution stable isotope records in the Nordic Seas that I
expect will provide some important constraints on the
behavior of the NADW part of the thermohaline circulation
in the last 60 kyr [e.g., Rasmussen et al., 1997; Voelker et
al., 1998; Dokken and Jansen, 1999; van Kreveld et al.,
2000].
[80] It is still unclear how climate records in the Southern
Hemisphere relate to Northern Hemisphere variability. Steig
and Alley [2003] have made detailed statistical analyses of
the phase relationships between Antarctic (Byrd) and
Greenland (GISP2) ice cores and showed that either a
maximum positive correlation with an Antarctic lead of
about 1000–1600 years or a maximum negative correlation
with an Antarctic lag of about 400–800 years best fit the
data. They conclude from this treatment of the data that the
concepts of antiphase (‘‘seesaw’’) or phase-shifted (‘‘south-
ern lead’’) behavior do not adequately describe the real
behavior of the climate system at millennial timescales. The
ice cores from Antarctica appear to be generally offset in
their temperature records from Greenland. An exception is
the Taylor Dome core, where the temperature record
appears to be positively correlated with Greenland [e.g.,
Steig et al., 1998; Grootes et al., 2001]. Grootes et al.
[2001] interpret this to be a product of varying degrees of
marine influence around the Antarctic, yielding heteroge-
neous climate. According to the best available chronologies,
relatively warm sea surface temperatures in the eastern
South Atlantic [e.g., Little et al., 1997; Kanfoush et al.,
2000; Voelker, 2002] and in the eastern South Pacific [e.g.,
Ninnemann et al., 1999] also appear to indicate warmer
conditions in the Southern Ocean when Greenland is cold.
[81] However, the apparent synchrony of moraines in
Chile and New Zealand with Heinrich events represents a
contrasting image of Southern Hemisphere climate. Mor-
aines representing major glacial advances in the Chilean
Lake District may correspond to the youngest three layers at
14.5–14.8 (H1), 22.3–22.6 (or 21?) (H2), and �26.8 (H3)14C kyr [Lowell et al., 1995; Denton et al., 1999; Lowell,
2000]. These advances are correlated to cooling based on
expansion of grassland vegetation [Heusser et al., 1999;
Denton et al., 1999]. Many glacial advances are recorded in
New Zealand [Denton et al., 1999; G. H. Denton, personal
communication, 2002], perhaps enough to match one for
one with cold oscillations in Greenland. It is clear from the
compilation of records of high-resolution climate variability
in stage 3 [Voelker, 2002] that there needs to be a concerted
focus on the Southern Hemisphere. As pointed out by
Denton et al. [1999], the apparent discrepancy between
mountain glacier and marine records in the southern mid-
latitudes might be resolved with an Antarctic Circumpolar
Transect emphasizing chronology combined with proxies of
climate conditions at high resolution.
6.3. Sea Level Variations Linked to Heinrich Events
[82] Dated coral terraces from the Huon Peninsula, Papua
New Guinea, and Barbados appear to record substantial
millennial fluctuations in sea level [Yokoyama et al., 2001;
Chappell, 2002; Cutler et al., 2003]. Chappell [2002] and
Yokoyama et al. [2001] infer that these sea level jumps,
RG1005 Hemming: HEINRICH EVENTS
36 of 43
RG1005

interpreted to reflect approximately 10–15 m excursions,
are correlated to Heinrich events. Additionally, planktonic
d18O from a marine sediment core record from the Red Sea
appears to reflect rapid and large sea level excursions during
stage 3 [Siddall et al., 2003], and high-resolution benthic
d18O records appear to support these interpretations [e.g.,
Waelbroeck et al., 2002; Cutler et al., 2003]. I had thought
that sea level jumps could constrain the origin of Heinrich
events. Indeed, if it were demonstrated that there were no
jumps, it would eliminate the binge-purge scenario. How-
ever, as the Hudson Strait is not the only outlet of ice into
the ocean, sea level rises are necessary but not sufficient to
demonstrate a connection. Although not the ‘‘smoking gun’’
I had originally considered it, further evidence concerning
rapid sea level changes should have important implications
for understanding the system in which HS Heinrich events
operated.
7. SUMMARY AND SCOPE FOR FUTURE RESEARCH
[83] Heinrich layers are spectacular IRD deposits in the
North Atlantic that resulted from massive discharges of
icebergs from the Laurentide ice sheet through the Hudson
Strait. They are clearly linked to dramatic climate shifts in
the Northern Hemisphere, and they could have global
correlations. Detailed studies of the interval containing H1
through H4 in the IRD belt have demonstrated a strong
connection between the timing of Heinrich layers and the
pace of climate variability in the North Atlantic. More work
is needed in the Southern Hemisphere in order to evaluate
whether or not there is truly an interhemispheric correlation
at the times of the Heinrich events, and the Antarctic
Circumpolar Transect proposed by Denton et al. [1999]
would be a good way to start.
[84] In order to resolve the details of how Heinrich layers
formed, it is necessary to consider the predictions that come
from the proposed models, that is, purging of the Laurentide
ice sheet through the Hudson Strait ice stream, jokulhlaups,
and ice shelf. Careful assessment of the sedimentology of
the Labrador Sea in the vicinity of the Hudson Strait should
provide important clues about the glacial processes that were
operating. Additional work is needed at high resolution across
the intervals of Heinrich events in the IRD belt, including
their ‘‘precursors’’ and combined with further constraints on
the composition of potentially contributing sources.
[85] Much effort has gone into characterizing the Hein-
rich events in the North Atlantic and into identifying
potentially correlative climate events globally, and from
this effort a picture is emerging about the causes and effects
related to them. They occurred during extreme cold periods
in the North Atlantic and were abruptly followed by
dramatic warming. A large influx of fresh water into the
North Atlantic accompanied these events (Figure 26), and it
appears that a complete shutdown of NADW production
was produced. What remains to be understood better is
whether the correlations are global or Northern Hemisphere-
wide and what the ultimate driver of these dramatic events
was. The existence of the prominent 100 kyr cycle and its
apparent pacing with the insolation in northern latitudes
seems to require a magnifier such as the Northern Hemi-
sphere ice sheets and their impact on such things as
thermohaline and atmospheric circulation, albedo, green-
house gases, and so forth. So it is not a big leap of faith to
conclude that the rapid and large climate changes that we
see during the last glacial might also be related to the
presence of the very large ice sheets that existed in the
Northern Hemisphere.
[86] ACKNOWLEDGMENTS. Support for my research on
IRD was provided by NSF OCE9907290. Thanks go to Patty
Catanzaro for drafting the figures. Comments from Richard Alley,
John Andrews, Wally Broecker, Greg Downing, Francis Grousset,
Johan Kleman, Doug MacAyeal, Scott McLennan, Byrdie
Renik, and Tom Torgersen improved the focus and readability of
the manuscript. Discussions with many people have influenced my
thinking about Heinrich events. Names that stand out are John
Andrews, Wally Broecker, Gerard Bond, Mary Elliot, Francis
Grousset, Roberto Gwiazda, Sean Higgins, and Jerry McManus.
Thanks go to Trond Dokken, Lang Farmer, and two anonymous
reviewers for their journal reviews, and thanks go to Tom
Torgersen for editorial suggestions. I dedicate this work to my
mother, Ann Rasbury, who passed away during my writing of it,
for her unending support and enthusiasm for my work.
[87] Thomas Torgersen was the Editor responsible for this
paper. He thanks three technical reviewers and one cross-disciplin-
ary reviewer.
REFERENCES
Adkins, S. F., H. Cheng, E. A. Boyle, E. R. M. Druffel, and R. L.Edwards (1998), Deep-sea coral evidence for rapid change inventilation of the deep North Atlantic 15,400 years ago, Science,280, 725–728.
Alley, R. B., and P. U. Clark (1999), The deglaciation of the North-ern Hemisphere: A global perspective, in Mechanisms of GlobalClimate Change at Millennial Time Scales, Geophys. Monogr.Ser., vol. 112, edited by P. U. Clark, R. S. Webb, and L. D.Keigwin, pp. 142–182, AGU, Washington D. C.
Alley, R. B., and D. R. MacAyeal (1993), West Antarctic ice sheetcollapse: Chimera or clear danger?, Antarct. J. U.S., XXVIII(5),59–60.
Alley, R. B., and D. R. MacAyeal (1994), Ice-rafted debris asso-ciated with binge purge oscillations of the Laurentide ice sheet,Paleoceanography, 9(4), 503–511.
Alley, R. B., K. M. Cuffey, E. B. Evenson, J. C. Strasser, D. E.Lawson, and G. J. Larson (1997), How glaciers entrain andtransport basal sediment: Physical constraints, Quat. Sci. Rev.,16(9), 1017–1038.
Alley, R. B., D. E. Lawson, E. B. Evenson, J. C. Strasser, and G. J.Larson (1998), Glaciohydraulic supercooling: A freeze-onmechanism to create stratified, debris-rich basal ice: II. Theory,J. Glaciol., 44, 563–569.
Alley, R., S. Anandakrishnan, and P. Jung (2001), Stochasticresonance in the North Atlantic, Paleoceanography, 16(2),190–198.
Altabet, M. A., M. J. Higginson, and D. W. Murray (2002), Theeffect of millennial-scale changes in Arabian Sea denitrificationon atmospheric CO2, Nature, 415, 159–162.
Andrews, J. T. (1998), Abrupt changes (Heinrich events) in lateQuaternary North Atlantic marine environments: A history andreview of data and concepts, J. Quat. Sci., 13(1), 3–16.
Andrews, J. T. (2000), Icebergs and iceberg rafted detritus (IRD) inthe North Atlantic: Facts and assumptions, Oceanography, 13(3),100–108.
RG1005 Hemming: HEINRICH EVENTS
37 of 43
RG1005

Andrews, J. T., and D. C. Barber (2002), Dansgaard-Oeschgerevents: Is there a signal off the Hudson Strait Ice Stream?, Quat.Sci. Rev., 21(1–3), 443–454.
Andrews, J. T., and K. Tedesco (1992), Detrital carbonate-richsediments, northwestern Labrador Sea: Implications for ice-sheetdynamics and iceberg rafting (Heinrich) events in the NorthAtlantic, Geology, 20(12), 1087–1090.
Andrews, J. T., K. Tedesco, W. M. Briggs, and L. W. Evans(1994a), Sediments, sedimentation rates, and environments,southeast Baffin Shelf and northwest Labrador Sea, 8–26 ka,Can. J. Earth Sci., 31, 90–103.
Andrews, J. T., H. Erlenkeuser, K. Tedesco, A. E. Aksu, andA. J. T. Jull (1994b), Late Quaternary (Stage 2 and 3) melt-water and Heinrich events, northwest Labrador Sea, Quat. Res.,41, 26–34.
Andrews, J. T., T. A. Cooper, A. E. Jennings, A. B. Stein, andH. Erlenkeuser (1998), Late Quaternary iceberg-rafted detritusevents on the Denmark Strait-Southeast Greenland continentalslope (�65�N): Related to North Atlantic Heinrich events?,Mar. Geol., 149, 211–228.
Arz, H. W., J. Patzold, and G. Wefer (1998), Correlated millennial-scale changes in surface hydrography and terrigenous sedimentyield inferred from last-glacial marine deposits off northeasternBrazil, Quat. Res., 50, 157–166.
Ayuso, R. A., and M. L. Bevier (1991), Regional differences in Pbisotopic compositions of feldspars in plutonic rocks of the north-ern Appalachian Mountains, U.S.A. and Canada: A geochemicalmethod of terrane correlation, Tectonics, 10, 191–212.
Bacon, M. P. (1984), Glacial to interglacial changes in carbonateand clay sedimentation in the Atlantic Ocean estimated from Th-230 measurements, Isot. Geosci., 2(2), 97–111.
Barber, D. C. (2001), Laurentide ice sheet dynamics from 35 to7 ka: Sr-Nd-Pb isotopic provenance of northwest Atlantic marginsediments, Ph.D. thesis, Univ. of Colorado, Boulder.
Bard, E., B. Hamelin, R. G. Fairbanks, and A. Zindler (1990),Calibration of the 14C timescale over the past 30,000 years usingmass spectrometric U-Th ages from Barbados corals, Nature,345, 405–410.
Bard, E., M. Arnold, B. Hamelin, N. Tisnerat-Laborde, andG. Cabioch (1998), Radiocarbon calibration by means ofmass spectrometric Th-230/U-234 and C-14 ages of corals: Anupdated database including samples from Barbados, Mururoaand Tahiti, Radiocarbon, 40(3), 1085–1092.
Bard, E., F. Rostek, J.-L. Turon, and S. Gendreau (2000), Hydro-logical impact of Heinrich events in the subtropical northeastAtlantic, Science, 289, 1321–1324.
Baumann, K.-H., K. S. Lackschewitz, J. Mangerud, R. F.Spielhagen, T. C. W. Wolf-Welling, R. Henrich, and H. Kassens(1995), Reflection of Scandinavian ice sheet fluctuations inNorwegian Sea sediments during the past 150,000 years, Quat.Res., 43, 185–197.
Behl, R. J., and J. P. Kennett (1996), Brief interstadial events in theSanta Barbara basin, NE Pacific, during the past 60 kyr, Nature,379, 243–246.
Bischof, J. F., and D. A. Darby (1999), Quaternary ice transport inthe Canadian Arctic and extent of the Late Wisconsinian glacia-tion in the Queen Elizabeth Islands, Can. J. Earth Sci., 36,2007–2022.
Bond, G. C., and R. Lotti (1995), Iceberg discharges into the NorthAtlantic on millennial time scales during the last glaciation,Science, 267, 1005–1010.
Bond, G., et al. (1992), Evidence for massive discharges of ice-bergs into the North Atlantic Ocean during the last glacial period,Nature, 360, 245–249.
Bond, G. C., W. S. Broecker, S. Johnsen, J. F. McManus,L. Labeyrie, J. Jouzel, and G. Bonani (1993), Correlationbetween climate records from North Atlantic sediments andGreenland ice, Nature, 365, 143–147.
Bond, G., W. Showers, M. Cheseby, R. Lotti, P. Almasi,P.deMenocal, P. Priore, H. Cullen, I. Hajdas, and G. Bonani
(1997), A pervasive millennial-scale cycle in North AtlanticHolocene and glacial climates, Science, 278, 1257–1266.
Bond, G. C., W. Showers, M. Elliot, M. Evans, R. Lotti, I. Hajdas,G. Bonani, and S. Johnsen (1999), The North Atlantic’s 1–2 kyrclimate rhythm: Relation to Heinrich events, Dansgaard/Oesch-ger cycles and the little ice age, in Mechanisms of Global Cli-mate Change at Millennial Time Scales, Geophys. Monogr. Ser.,vol. 112, edited by P. U. Clark, R. S. Webb, and L. D. Keigwin,pp. 35–68, AGU, Washington D. C.
Boyle, E. A. (2000), Is thermohaline circulation linked to abruptstadial/interstadial transitions?, Quat. Sci. Rev., 19(1–5), 255–272.
Broecker, W. S. (1994), Massive iceberg discharges as triggers forglobal climate change, Nature, 372, 421–424.
Broecker, W. S. (2000), Abrupt climate change: Causal constraintsprovided by the paleoclimate record, Earth Sci. Rev., 51, 137–154.
Broecker, W. S., and S. Hemming (2001), Paleoclimate: Climateswings come into focus, Science, 294, 2308–2309.
Broecker, W. S., G. C. Bond, M. Klas, E. Clark, and J. F. McManus(1992), Origin of the northern Atlantic’s Heinrich events, Clim.Dyn., 6, 265–273.
Broecker, W., G. Bond, and J. McManus (1993), Heinrich events:Triggers of ocean circulation change?, in Ice in the ClimateSystem, NATO ASI Ser., Ser. I, vol. 12, edited by W. R. Peltier,pp. 161–166, Springer-Verlag, New York.
Cacho, I., J. O. Grimalt, C. Pelejero, M. Canals, F. J. Sierro, J. A.Flores, and N. Shackleton (1999), Dansgaard-Oeschger andHeinrich event imprints in Alboran Sea paleotemperatures,Paleoceanography, 14(6), 698–705.
Chapman, M. R., and N. J. Shackleton (1998), Millennial-scalefluctuations in North Atlantic heat flux during the last 150,000years, Earth Planet. Sci. Lett., 159, 57–70.
Chappell, J. (2002), Sea level changes forced ice breakouts in thelast glacial cycle: New results from coral terraces, Quat. Sci.Rev., 21(10), 1229–1240.
Charles, C. D., J. Lynch-Stieglitz, U. S. Ninnemann, and R. G.Fairbanks (1996), Climate connections between the hemispheresrevealed by deep sea sediment core ice core correlations, EarthPlanet. Sci. Lett., 142, 19–27.
Clark, P. U., N. G. Pisias, T. F. Stocker, and A. J. Weaver (2002),The role of the thermohaline circulation in abrupt climatechange, Nature, 415, 863–869.
Clarke, G. K. C., S. J. Marshall, C. Hillaire-Marcel, G. Bilodeau,and C. Veiga-Pires (1999), A glaciological perspective on Hein-rich events, in Mechanisms of Global Climate Change at Millen-nial Time Scales, Geophys. Monogr. Ser., vol. 112, edited by P. U.Clark, R. S. Webb, and L. D. Keigwin, pp. 243–262, AGU,Washington D. C.
Clough, S. K. (1978), Morphology, sedimentary facies and pro-cesses of the Northwest Atlantic Mid-Ocean Channel between 61and 54�N, Labrador Sea, Ph.D. thesis, 167 pp., McGill Univ.,Montreal, Que., Canada.
Cortijo, E., L. Labeyrie, L. Vidal, M. Vautravers, M. Chapman,J.-C. Duplessy, M. Elliot, M. Arnold, J.-L. Turon, and G. Auffret(1997), Changes in sea surface hydrology associated with Hein-rich event 4 in the North Atlantic Ocean between 40� and 60�N,Earth Planet. Sci. Lett., 146, 29–45.
Cutler, K. B., R. L. Edwards, F. W. Taylor, H. Cheng, J. Adkins,C. D. Gallup, P. M. Cutler, G. S. Burr, and A. L. Bloom (2003),Rapid sea-level fall and deep-ocean temperature change since thelast interglacial period, Earth Planet. Sci. Lett., 206, 253–271.
Darby, D. A., and J. F. Bischof (1996), A statistical approach tosource determination of lithic and Fe oxide grains: An examplefrom the Alpha Ridge, Arctic Ocean, J. Sediment. Res., 66, 599–607.
Darby, D. A., J. F. Bischof, R. F. Spielhagen, S. A. Marshall, andS. W. Herman (2002), Arctic ice export events and their potentialimpact on global climate during the late Pleistocene, Paleocean-ography, 17(2), 1025, doi:10.1029/2001PA000639.
RG1005 Hemming: HEINRICH EVENTS
38 of 43
RG1005
Dasch, E. J. (1969), Strontium isotopes in weathering profiles,deep sea sediments, and sedimentary rocks, Geochim. Cosmo-chim. Acta, 33, 1521–1552.
Denton, G. H., C. J. Heusser, T. V. Lowell, P. I. Moreno, B. G.Andersen, L. E. Heusser, C. Schluchter, and D. R. Marchant(1999), Interhemispheric linkage of paleoclimate during the lastglaciation, Geogr. Ann., Ser. A, 81(2), 107–153.
de Vernal, A., and C. Hillaire-Marcel (2000), Sea-ice cover, sea-surface salinity and halo-/thermocline structure of the northwestNorth Atlantic: Modern versus full glacial conditions, Quat. Sci.Rev., 19(1–5), 65–85.
de Vernal, A., C. Hillaire-Marcel, J.-L. Turon, and J. Matthiessen(2000), Reconstruction of sea-surface temperature, salinity, andsea-ice cover in the northern North Atlantic during the LastGlacial Maximum based on dinocyst assemblages, Can. J. EarthSci., 37, 725–750.
DeWolf, C. P., and K. Mezger (1994), Lead isotope analyses ofleached feldspars—Constraints on the early crustal history of theGrenville Orogen, Geochim. Cosmochim. Acta, 58, 5537–5550.
Dokken, T. M., and M. Hald (1996), Rapid climatic shifts duringisotope stages 2–4 in the polar North Atlantic, Geology, 24,599–602.
Dokken, T. M., and E. Jansen (1999), Rapid changes in themechanism of ocean convection during the last glacial period,Nature, 401, 458–461.
Dowdeswell, J. A., and E. K. Dowdeswell (1989), Debris in ice-bergs and rates of glacimarine sedimentation: Observation fromSpitsbergen and a simple model, J. Geol., 97, 221–231.
Dowdeswell, J. A., and T. Murray (1990), Modelling rates of se-dimentation from icebergs, in Glacimarine Environments: Pro-cesses and Sediments, edited by J. A. Dowdeswell and J. D.Scourse, Geol. Soc. Spec. Publ. London, 53, 121–137.
Dowdeswell, J. A., M. A. Maslin, J. T. Andrews, and I. N. McCave(1995), Iceberg production, debris rafting, and the extent andthickness of Heinrich layers (H-1, H-2) in North Atlantic sedi-ments, Geology, 23, 301–304.
Dowdeswell, J. A., A. Elverhoi, and R. Spielhagen (1998), Glaci-marine sedimentary processes and facies on the polar NorthAtlantic margins, Quat. Sci. Rev., 17(1–3), 243–273.
Dowdeswell, J. A., A. Elverhøi, J. T. Andrews, and D. Hebbeln(1999), Asynchronous deposition of ice-rafted layers in theNordic Seas and North Atlantic Ocean, Nature, 400, 348–351.
Dreimanis, A. (1976), Tills: Their origin and properties, in GlacialTill—An Interdisciplinary Study, Spec. Publ., vol. 12, edited byR. F. Legget, pp. 11–49, R. Soc. of Can., Ottawa, Ont.
Duplessy, J. C., L. Labeyrie, and C. Waelbroeck (2002), Con-straints on the ocean oxygen isotopic enrichment between theLast Glacial Maximum and the Holocene: Paleoceanographicimplications, Quat. Sci. Rev., 21(1–3), 315–330.
Elliot, M., L. Labeyrie, G. Bond, E. Cortijo, J.-L. Turon, N. Tisnerat,and J.-C. Duplessy (1998), Millennial-scale iceberg dischargesin the Irminger Basin during the last glacial period: Relationshipwith the Heinrich events and environmental settings, Paleoceano-graphy, 13(5), 433–446.
Elliot, M., L. Labeyrie, T. Dokken, and S. Manthe (2001), Coher-ent patterns of ice-rafted debris deposits in the Nordic regionsduring the last glacial (10–60 ka), Earth Planet. Sci. Lett., 194,151–163.
Elliot, M., L. Labeyrie, and J. C. Duplessy (2002), Changes inNorth Atlantic deep-water formation associated with the Dans-gaard-Oeschger temperature oscillations (60–10 ka), Quat. Sci.Rev., 21(10), 1153–1165.
Farmer, G. L., D. C. Barber, and J. T. Andrews (2003), Provenanceof late Quaternary ice proximal sediments in the North Atlantic:Nd, Sr and Pb isotopic evidence, Earth Planet. Sci. Lett., 209,227–243.
Francois, R., and M. Bacon (1994), Heinrich events in the NorthAtlantic: Radiochemical evidence, Deep Sea Res., Part I, 41(2),315–334.
Francois, R., M. P. Bacon, and D. O. Suman (1990), Th-230 pro-filing in deep-sea sediments: High-resolution records of flux anddissolution of carbonate in the equatorial Atlantic during the last24,000 years, Paleoceanography, 5(5), 761–787.
Fronval, T., E. Jansen, J. Bloemendal, and S. Johnsen (1995),Oceanic evidence for coherent fluctuations in Fennoscandianand Laurentide ice sheets on millennium timescales, Nature,374, 443–446.
Ganopolski, A., and S. Rahmstorf (2002), Abrupt glacial climatechanges due to stochastic resonance, Phys. Rev. Lett., 88(3),038501, doi:10.1103/PhysRevLett.88.038501.
Gariepy, C., and C. J. Allegre (1985), The lead isotope geochem-istry and geochronology of late-kinematic intrucives from theAbitibi greenstone belt, and the implications for late Archaeancrustal evolution, Geochim. Cosmochim. Acta, 49, 2371–2383.
Goldstein, S. J., and S. B. Jacobsen (1988), Nd and Sr isotopesystematic of river water suspended sediment: Implications forcrustal evolution, Earth Planet. Sci. Lett., 87, 249–265.
Grimm, E. C., G. L. Jacobson Jr., W. A. Watts, B. C. S. Hansen,and K. A. Maasch (1993), A 50,000-year record of climateoscillations from Florida and its temporal correlation with theHeinrich events, Science, 261, 198–200.
Grootes, P. M., E. J. Steig, M. Stuiver, E. D. Waddington, and D. L.Morse (2001), The Taylor dome Antarctic O-18 record and glob-ally synchronous changes in climate, Quat. Res., 56, 289–298.
Grousset, F. E., L. Labeyrie, J. A. Sinko, M. Cremer, G. Bond,J. Duprat, E. Cortijo, and S. Huon (1993), Patterns of ice-rafted detritus in the glacial North Atlantic (40 – 55�N),Paleoceanography, 8(2), 175–192.
Grousset, F. E., C. Pujol, L. Labeyrie, G. Auffret, and A. Boelaert(2000), Were the North Atlantic Heinrich events triggered by thebehavior of the European ice sheets?, Geology, 28, 123–126.
Grousset, F. E., E. Cortijo, S. Huon, L. Herve, T. Richter,D. Burdloff, J. Duprat, and O. Weber (2001), Zooming in onHeinrich layers, Paleoceanography, 16(3), 240–259.
Gwiazda, R. H., S. R. Hemming, and W. S. Broecker (1996a),Tracking the sources of icebergs with lead isotopes: The prove-nance of ice-rafted debris in Heinrich layer 2, Paleoceanography,11(1), 77–93.
Gwiazda, R. H., S. R. Hemming, and W. S. Broecker (1996b),Provenance of icebergs during Heinrich event 3 and the contrastto their sources during other Heinrich episodes, Paleoceanogra-phy, 11(4), 371–378.
Gwiazda, R. H., S. R. Hemming, W. S. Broecker, T. Onsttot, andC. Mueller (1996c), Evidence from 40Ar/39Ar ages for a Church-ill Province source of ice-rafted amphiboles in Heinrich layer 2,J. Glaciol., 42, 440–446.
Hald, M., T. Dokken, and G. Mikalsen (2001), Abrupt climaticchange during the last interglacial-glacial cycle in the polar NorthAtlantic, Mar. Geol., 176, 121–137.
Harris, S. E., and A. C. Mix (1999), Pleistocene precipitation bal-ance in the Amazon Basin recorded in deep sea sediments, Quat.Res., 51, 14–26.
Harrison, T. M. (1981), Diffusion of 40Ar in hornblende, Contrib.Mineral. Petrol., 78, 324–331.
Heinrich, H. (1988), Origin and consequences of cyclic ice raftingin the northeast Atlantic Ocean during the past 130,000 years,Quat. Res., 29, 142–152.
Hemming, S. R., and I. Hajdas (2003), Ice rafted detritus evidencefrom 40Ar/39Ar ages of individual hornblende grains for evolu-tion of the southeastern Laurentide ice sheet since 43 14C ky,Quat. Int., 99–100, 29–43.
Hemming, S. R., and E. T. Rasbury (2000), Pb isotope measure-ments of sanidine monitor standards: Implications for prove-nance analysis and tephrochronology, Chem. Geology, 165,311–337.
Hemming, S. R., S. M. McLennan, and G. N. Hanson (1994), Pbisotopes as a provenance tool for quartz: Examples from plutonsand quartzite, northeastern Minnesota, Geochim. Cosmochim.Acta, 58, 4455–4464.
RG1005 Hemming: HEINRICH EVENTS
39 of 43
RG1005
Hemming, S. R., D. K. McDaniel, S. M. McLennan, and G. N.Hanson (1996), Pb isotope constraints on the provenance anddiagenesis of detrital feldspars from the Sudbury Basin, Canada,Earth Planet. Sci. Lett., 142, 501–512.
Hemming, S. R., W. S. Broecker, W. D. Sharp, G. C. Bond, R. H.Gwiazda, J. F. McManus, M. Klas, and I. Hajdas (1998), Prove-nance of the Heinrich layers in core V28-82, northeastern Atlan-tic: 40Ar-39Ar ages of ice-rafted hornblende, Pb isotopes infeldspar grains, and Nd-Sr-Pb isotopes in the fine sediment frac-tion, Earth Planet. Sci. Lett., 164, 317–333.
Hemming, S. R., G. C. Bond, W. S. Broecker, W. D. Sharp, andM. Klas-Mendelson (2000a), Evidence from 40Ar/39Ar ages ofindividual hornblende grains for varying Laurentide sources oficeberg discharges 22,000 to 10,500 yr B.P., Quat. Res., 54,372–383.
Hemming, S. R., R. H. Gwiazda, J. T. Andrews, W. S. Broecker,A. E. Jennings, and T. C. Onstott (2000b), 40Ar/39Ar and Pb-Pbstudy of individual hornblende and feldspar grains from south-eastern Baffin Island glacial sediments: Implications for theprovenance of the Heinrich layers, Can. J. Earth Sci., 37,879–890.
Hemming, S. R., C. M. Hall, P. E. Biscaye, S. M. Higgins, G. C.Bond, J. F. McManus, D. C. Barber, J. T. Andrews, and W. S.Broecker (2002), 40Ar/39Ar ages and 40Ar* concentrations offine-grained sediment fractions from North Atlantic Heinrichlayers, Chem. Geol., 182, 583–603.
Hesse, R., and S. Khodabakhsh (1998), Depositional facies of latePleistocene Heinrich events in the Labrador Sea, Geology, 26,103–106.
Heusser, C. J., L. E. Heusser, and T. V. Lowell (1999), Paleoecol-ogy of the southern Chilean Lake District-Isla Grande de Chiloeduring middle-late Llanquihue glaciation and deglaciation,Geogr. Ann., Ser. A, 81(2), 231–284.
Higgins, S. M. (2001), Extraterrestrial tracer in the sea: Evaluationand application of 3He in interplanetary dust particles as a con-stant flux tracer in marine sediments, Ph.D. thesis, 203 pp., Dep.of Earth and Environ. Sci., Columbia Univ., New York.
Hillaire-Marcel, C., and G. Bilodeau (2000), Instabilities in theLabrador Sea water mass structure during the last climatic cycle,Can. J. Earth Sci., 37, 795–809.
Hillaire-Marcel, C., A. de Vernal, G. Bilodeau, and G. Wu (1994),Isotope stratigraphy, sedimentation rates, deep circulation, andcarbonate events in the Labrador Sea during the last �200 ka,Can. J. Earth Sci., 31, 68–89.
Hoffman, P. F. (1989), United plates of America, the birth of acraton—Early Proterozoic assembly and growth of Laurentia,Annu. Rev. Earth Planet. Sci., 16, 543–603.
Hulbe, C. L. (1997), An ice shelf mechanism for Heinrich layerproduction, Paleoceanography, 12(5), 711–717.
Hulbe, C. L., D. R. MacAyeal, G. H. Denton, J. Kleman, and T. V.Lowell (2004), Catastrophic ice shelf breakup as the source ofHeinrich event icebergs, Paleoceanography, 19, PA1004,doi:10.1029/2003PA000890.
Hunt, A. G., and P. E. Malin (1998), Possible triggering of Hein-rich events by ice load-induced earthquakes, Nature, 393, 155–158.
Huon, S., and R. Jantschik (1993), Detrital silicates in northeastAtlantic deep-sea sediments during the late Quaternary: Majorelement REE and Rb-Sr isotopic data, Eclogae Geol. Helv., 86,195–218.
Huon, S., and P. Ruch (1992), Mineralogical, K-Ar and 87Sr/86/Srisotope study of Holocene and last glacial sediments in a deep-sea core from the northeast Atlantic Ocean, Mar. Geol., 107,275–282.
Huon, S., F. E. Grousset, D. Burdloff, G. Barboux, and A. Mariotti(2002), Sources of fine-sized organic matter in North AtlanticHeinrich layers: d13C and d15N tracers, Geochim. Cosmochim.Acta, 66, 223–239.
Hurley, P. M., and J. R. Rand (1969), Pre-drift continental nuclei,Science, 164, 1229–1242.
Hurley, P. M., B. C. Heezen, W. H. Pinson, and H. W. Fairbairn(1963), K-Ar age values in pelagic sediments of the North Atlan-tic, Geochim. Cosmochim. Acta, 27, 393–399.
Jantschik, R., and S. Huon (1992), Detrital silicates in northeastAtlantic deep-sea sediments during the late Quaternary: Miner-alogical and K-Ar isotopic data, Eclogae Geol. Helv., 85, 195–212.
Jennings, A. E., K. A. Tedesco, J. T. Andrews, and M. E. Kirby(1996), Shelf erosion and glacial ice proximity in the LabradorSea during and after Heinrich events [H-3 or H-4 to H-0] asshown by foraminifera, in Late Quaternary Palaeoceanographyof the North Atlantic Margins, edited by J. T. Andrews, Geol.Soc. Spec. Publ., 111, 29–49.
Johnson, R. G., and S.-E. Lauritzen (1995), Hudson Bay-HudsonStrait jokulhlaups and Heinrich events: A hypothesis, Palaeo-geogr. Palaeoclimatol. Palaeoecol., 117, 123–137.
Kanfoush, S. L., D. A. Hodell, C. D. Charles, T. P. Guilderson,P. G. Mortyn, and U. S. Ninnemann (2000), Millennial-scaleinstability of the Antarctic ice sheet during the last glaciation,Science, 288, 1815–1818.
Kara, A. B., P. A. Rochford, and H. E. Hurlburt (2003), Mixedlayer depth variability over the global ocean, J. Geophys. Res.,108(C3), 3079, doi:10.1029/2000JC000736.
Keigwin, L. D., and S. J. Lehman (1994), Deep circulation changelinked to Heinrich event 1 and Younger Dryas in a middepthNorth Atlantic core, Paleoceanography, 9(2), 185–194.
Kennett, J. P., K. G. Cannariato, I. L. Hendy, and R. J. Behl (2000),Carbon isotopic evidence for methane hydrate instability duringquaternary interstadials, Science, 288, 128–133.
Kirby, M. E., and J. T. Andrews (1999), Mid-Wisconsin Laurentideice sheet growth and decay: Implications for Heinrich events 3and 4, Paleoceanography, 14(2), 211–223.
Kissel, C., C. Laj, L. Labeyrie, T. Dokken, A. Voelker, andD. Blamart (1999), Rapid climatic variations during marine iso-topic stage 3: Magnetic analysis of sediments from Nordic Seasand North Atlantic, Earth Planet. Sci. Lett., 171, 489–502.
Knies, J., H.-P. Kleiber, J. Matthiessen, C. Muller, andN. Nowaczyk (2001), Marine ice-rafted debris records con-strain maximum extent of Saalian and Weichselian ice-sheetsalong the northern Eurasian margin, Global Planet. Change,31, 45–64.
Knutz, P. C., W. E. N. Austin, and E. J. W. Jones (2001), Millen-nial-scale depositional cycles related to British Ice Sheet varia-bility and North Atlantic paleocirculation since 45 kyr B.P., BarraFan, U. K. margin, Paleoceanography, 16(1), 53–64.
Labeyrie, L., H. Leclaire, C. Waelbroeck, E. Cortijo, J.-C. Duplessy,L. Vidal, M. Elliot, B. Le Coat, and G. Auffret (1999), Temporalvariability of the surface and deep waters of the North WestAtlantic Ocean at orbital and millennial scales, in Mechanismsof Global Climate Change at Millennial Time Scales, Geophys.Monogr. Ser., vol. 112, edited by P. U. Clark, R. S. Webb, andL. D. Keigwin, pp. 77–98, AGU, Washington D. C.
Lackschewitz, K. S., K.-H. Baumann, B. Gehrke, H.-J. Wallrabe-Adams, J. Thiede, G. Bonani, R. Endler, H. Erlenkeuser, andJ. Heinemeier (1998), North Atlantic ice sheet fluctuations10,000–70,000 yr ago as inferred from deposits on the Rey-kjanes Ridge, southeast of Greenland, Quat. Res., 49, 171–182.
Laj, C., C. Kissel, A. Mazaud, J. E. T. Channell, and J. Beer(2000), North Atlantic palaeointensity stack since 75 ka (NA-PIS-75) and the duration of the Laschamp event, Philos. Trans.R. Soc. London, Ser. A, 358, 1009–1024.
Lawson, D. E., J. C. Strasser, E. B. Evenson, R. B. Alley, G. J.Larson, and S. A. Arcone (1998), Glaciohydraulic supercooling:A freeze-on mechanism to create stratified, debris-rich basal ice:I. Field evidence, J. Glaciol., 44, 547–562.
Leuschner, D. C., and F. Sirocko (2000), The low-latitude mon-soon climate during Dansgaard-Oeschger cycles and Heinrichevents, Quat. Sci. Rev., 19(1–5), 243–254.
Little, M. G., R. R. Schneider, D. Kroon, B. Price, C. P.Summerhayes, and M. Segl (1997), Trade wind forcing of upwel-
RG1005 Hemming: HEINRICH EVENTS
40 of 43
RG1005

ling, seasonality, and Heinrich events as a response to sub-Milan-kovitch climate variability, Paleoceanogrphy, 12(4), 568–576.
Lowell, T. V. (2000), As climate changes, so do glaciers, Proc. Nat.Acad. Sci. U. S. A., 97(4), 1351–1354.
Lowell, T. V., C. J. Heusser, B. G. Andersen, P. I. Moreno,A. Hauser, L. E. Heusser, C. Schluchter, D. R. Marchant, andG. H. Denton (1995), Interhemispheric correlation of late Pleis-tocene glacial events, Science, 269, 1541–1549.
Lund, D. C., and A. C. Mix (1998), Millennial-scale deep wateroscillations: Reflections of the North Atlantic in the deep Pacificfrom 10 to 60 ka, Paleoceanography, 13(1), 10–19.
Lynch-Stieglitz, J., W. B. Curry, and N. Slowey (1999), WeakerGulf Stream in the Florida straits during the Last Glacial Max-imum, Nature, 402, 644–648.
MacAyeal, D. R. (1993), Binge/purge oscillations of the Laurentideice sheet as a cause of the North Atlantic’s Heinrich events,Paleoceanography, 8(6), 775–784.
Madureira, L. A. S., S. A. van Kreveld, G. Eglinton, M. Conte,G. Ganssen, J. E. vanHinte, and J. J. Ottens (1997), Late Qua-ternary high-resolution biomarker and other sedimentary climateproxies in a northeast Atlantic core, Paleoceanography, 12(2),255–269.
Manabe, S., and R. J. Stouffer (1995), Simulation of abrupt climatechange induced by freshwater input to the North Atlantic Ocean,Nature, 378, 165–167.
Mangerud, J., T. Dokken, D. Hebbeln, B. Heggen, O. Ingolfsson,J. Y. Landvik, V. Mejdahl, J. I. Svendsen, and T. O. Vorren(1998), Fluctuations of the Svalbard Barents Sea Ice Sheet duringthe last 150,000 years, Quat. Sci. Rev., 17(1–3), 11–42.
Manighetti, B., I. N. McCave, M. Maslin, and N. J. Shackleton(1995), Chronology for climate change: Developing age modelsfor the Biogeochemical Ocean Flux Study cores, Paleoceanogra-phy, 10(3), 513–525.
Marshall, S. J., and G. K. C. Clarke (1997), A continuum mixturemodel of ice stream thermomechanics in the Laurentide ice sheet:2. Application to the Hudson Strait ice stream, J. Geophys. Res.,102(B9), 20,615–20,637.
Maslin, M. A., N. J. Shackleton, and U. Pflaumann (1995), Surfacewater temperature, salinity and density changes in the northeastAtlantic during the last 45,000 years: Heinrich events, deep waterformation and climatic rebounds, Paleoceanography, 10(3),527–544.
Matsumoto, K. (1997), Modeled glacial North Atlantic ice-rafteddebris pattern and its sensitivity to various boundary conditions,Paleoceanography, 12(2), 271–280.
McCave, N. (1995), Sedimentary processes and the creation of thestratigraphic record in the late Quaternary North Atlantic Ocean,Philos. Trans. R. Soc. London, Ser. B, 348, 229–240.
McIntyre, A., and B. Molfino (1996), Forcing of Atlantic equator-ial and subpolar millennial cycles by precession, Nature, 274,1867–1870.
McLennan, S. M., and S. Hemming (1992), Samarium/neodymiumelemental and isotopic systematics in sedimentary rocks, Geo-chim. Cosmochim. Acta, 56, 887–898.
McManus, J. F., C. O. Major, B. Flower, and T. Fronval (1996),Variability in sea-surface conditions in the North Atlantic-Arcticgateways during the last 140,000 years, Proc. Ocean Drill.Program Sci. Results, 151, 437–443.
McManus, J. F., R. F. Anderson, W. S. Broecker, M. Q. Fleisher,and S. M. Higgins (1998), Radiometrically determined sedimen-tary fluxes in the sub-polar North Atlantic during the last140,000 years, Earth Planet. Sci. Lett., 155, 29–43.
McManus, J. F., D. W. Oppo, and J. L. Cullen (1999), A 0.5-million-year record of millennial-scale climate variability in theNorth Atlantic, Science, 283, 971–975.
McManus, J. F., R. Francois, J. M. Gherardi, and J. Nuwer (2002),Variable rates of ocean circulation from sedimentary Pa-231/Th-230 during the last ice age termination, paper presented at 12thAnnual V. M. Goldschmidt Conference, Geochem. Soc., Davos,Switzerland.
Meese, D. A., A. J. Gow, R. B. Alley, G. A. Zielinski, P. M.Grootes, M. Ram, K. C. Taylor, P. A. Mayewski, and J. F. Bolzan(1997), The Greenland Ice Sheet Project 2 depth-age scale:Methods and results, J. Geophys. Res., 102(C12), 26,411–26,423.
Mix, A. C., E. Bard, and R. Schneider (2001), Environmentalprocesses of the ice age: Land, oceans, glaciers (EPILOG), Quat.Sci. Rev., 20(4), 627–657.
Ninnemann, U. S., C. D. Charles, and D. A. Hodell (1999), Originof global millennial scale climate events: Constraints from theSouthern Ocean deep sea sedimentary record, in Mechanisms ofGlobal Climate Change at Millennial Time Scales, Geophys.Monogr. Ser., vol. 112, edited by P. U. Clark, R. S. Webb, andL. D. Keigwin, pp. 99–112, AGU, Washington, D. C.
Oppo, D. W., J. F. McManus, and J. L. Cullen (1998), Abruptclimate events 500,000 to 340,000 years ago: Evidence fromsubpolar North Atlantic sediments, Science, 279, 1335–1338.
Paillard, D. (1995), The hierarchical structure of glacial climaticoscillations: Interactions between ice-sheet dynamics and cli-mate, Clim. Dyn., 11, 162–177.
Paillaird, D., and E. Cortijo (1999), A simulation of the Atlanticmeridional circulation during Heinrich event 4 using recon-structed sea surface temperatures and salinities, Paleoceanogra-phy, 14(6), 716–724.
Parizek, B. R., R. B. Alley, S. Anandakrishnan, and H. Conway(2002), Sub-catchment melt and long-term stability of ice streamD, West Antarctica, Geophys. Res. Lett., 29(8), 1214,doi:10.1029/2001GL014326.
Pastouret, L., G. Auffret, M. Hoffert, M. Melguen, H. D. Needham,and C. Latouche (1972), Sedimentation sur la ride de Terre-Neuve, Can. J. Earth Sci., 12, 1019–1035.
Peterson, L. C., G. H. Haug, K. A. Hughen, and U. Rohl (2000),Rapid changes in the hydrologic cycle of the tropical Atlanticduring the last glacial, Science, 290, 1947–1951.
Pfeffer, W. T., M. Dyurgerov, M. Kaplan, J. Dwyer, C. Sassolas,A. Jennings, B. Raup, and W. Manley (1997), Numerical model-ing of late glacial Laurentide advance of ice across HudsonStrait: Insights into terrestrial and marine geology, mass balance,and claving flux, Paleoceanography, 12(1), 97–110.
Porter, S. C., and Z. S. An (1995), Correlation between climateevents in the North Atlantic and China during the last glaciation,Nature, 375, 305–308.
Prokopenko, A. A., D. F. Williams, W. B. Karabanov, and G. K.Khursevich (2001), Continental response to Heinrich events andBond cycles in sedimentary record of Lake Baikal, Siberia, Glo-bal Planet. Change, 28, 217–226.
Rahmstorf, S. (2002), Ocean circulation and climate during thepast 120,000 years, Nature, 419, 207–214.
Rashid, H., R. Hesse, and D. J. W. Piper (2003a), Distribution,thickness and origin of Heinrich layer 3 in the Labrador Sea,Earth Planet. Sci. Lett., 205, 281–293.
Rashid, H., R. Hesse, and D. J. W. Piper (2003b), Origin of unu-sually thick Heinrich layers in ice-proximal regions of the north-west Labrador Sea, Earth Planet. Sci. Lett., 208, 319–336.
Rasmussen, T. L., T. C. E. van Weering, and L. Labeyrie (1997),Climatic instability, ice sheets and ocean dynamics at high north-ern latitudes during the last glacial period (58–10 ka BP), Quat.Sci. Rev., 16(1), 71–80.
Rasmussen, T. L., D. W. Oppo, E. Thomsen, and S. J. Lehman(2003), Deep sea records from the southeast Labrador Sea:Ocean circulation changes and ice-rafting events during the last160,000 years, Paleoceanography, 18(1), 1018, doi:10.1029/2001PA000736.
Revel, M., J. A. Sinko, F. E. Grousset, and P. E. Biscaye (1996), Srand Nd isotopes as tracers of North Atlantic lithic particles:Paleoclimatic implications, Paleoceanography, 11(1), 95–113.
Roberts, M. J., F. S. Tweed, A. J. Russell, O. Knudsen, D. E.Lawson, G. J. Larson, E. B. Evenson, and H. Bjornsson(2002), Glaciohydraulic supercooling in Iceland, Geology, 30,439–442.
RG1005 Hemming: HEINRICH EVENTS
41 of 43
RG1005

Robinson, S. G., M. A. Maslin, and N. McCave (1995), Magneticsusceptibility variations in upper Pleistocene deep-sea sedimentsof the NE Atlantic: Implications for ice rafting and paleocircula-tion at the Last Glacial Maximum, Paleoceanography, 10(2),221–250.
Rohling, E. J., A. Hayes, S. De Rijk, D. Kroon, W. J. Zachariasse,and D. Eisma (1998), Abrupt cold spells in the northwest Med-iterranean, Paleoceanography, 13(4), 316–322.
Rosell-Mele, A., M. A. Maslin, J. R. Maxwell, and P. Schaeffer(1997), Biomarker evidence for ‘Heinrich’ events, Geochim.Cosmochim. Acta, 61, 1671–1678.
Ruddiman, W. F. (1977), Late Quaternary deposition of ice-raftedsand in the subpolar North Atlantic (lat 40� to 65�N), Geol. Soc.Am. Bull., 88, 1813–1827.
Ruddiman, W. F., and L. K. Glover (1982), Mixing of volcanic ashzones in subpolar North Atlantic sediments, in The Ocean Floor,Bruce C. Heezen Memorial Volume, edited by R. A. Scrutton andM. Talwani, pp. 37–60, John Wiley, Hoboken, N. J.
Sachs, J. P., and S. J. Lehman (1999), Subtropical North Atlantictemperatures 60,000 to 30,000 years ago, Science, 286, 756–759.
Sarnthein, M., K. Winn, S. J. A. Jung, J. C. Duplessy, L. Labeyrie,H. Erlenkeuser, and G. Ganssen (1994), Changes in east Atlanticdeep water circulation over the last 30,000 years: Eight time slicereconstructions, Paleoceanography, 9(2), 209–267.
Schmittner, A., M. Yoshimori, and A. J. Weaver (2002), Instabilityof glacial climate in a model of the ocean-atmosphere-cryospheresystem, Science, 295, 1489–1493.
Schmitz, W. J., Jr. (1996), On the world ocean circulation: VolumeI some global features/North Atlantic circulation, Tech Rep.WHOI-96-03, Woods Hole Oceanogr. Inst., Woods Hole, Mass.
Schmitz, W. J., Jr., and M. S. McCartney (1993), On the NorthAtlantic circulation, Rev. Geophys., 31, 24–49.
Schrag, D. P., J. F. Adkins, K. McIntyre, J. L. Alexander, D. A.Hodell, C. D. Charles, and J. F. McManus (2002), The oxygenisotopic composition of seawater during the Last Glacial Max-imum, Quat. Sci. Rev., 21(1–3), 331–342.
Schulz, H., U. von Rad, and H. Erlenkeuser (1998), Correlationbetween Arabian Sea and Greenland climate oscillations of thepast 110,000 years, Nature, 393, 54–57.
Scourse, J. D., I. R. Hall, I. N. McCave, J. R. Young, andC. Sugdon (2000), The origin of Heinrich layers: Evidence fromH2 for European precursor events, Earth Planet. Sci. Lett., 182,187–195.
Seidov, D., and M. Maslin (1999), North Atlantic deep water cir-culation collapse during Heinrich events, Geology, 27, 23–26.
Shackleton, N. J. (1967), Oxygen isotope analyses and paleotem-peratures reassessed, Nature, 215, 15–17.
Siddall, M., E. J. Rohling, A. Almogi-Labin, C. Hemeleben,D. Meischner, I. Schmelzer, and D. A. Smeed (2003), Sea-level fluctuations during the last glacial cycle, Nature, 423,853–858.
Snoeckx, H., F. Grousset, M. Revel, and A. Boelaert (1999), Eur-opean contribution of ice-rafted sand to Heinrich layers H3 andH4, Mar. Geol., 158, 197–208.
Steig, E. J., and R. B. Alley (2003), Phase relationships betweenAntarctic and Greenland climate records, Ann. Glaciol., 35,451–456.
Steig, E. J., E. J. Brook, J. W. C. White, C. M. Sucher, M. L.Bender, S. J. Lehman, D. L. Morse, E. D. Waddington, andG. D. Clow (1998), Synchronous climate changes in Antarcticaand the North Atlantic, Science, 282, 92–95.
Stoner, J. S., and J. T. Andrews (1999), The North Atlantic as aQuaternary magnetic archive, in Quaternary Climate, Environ-ments and Magnetism, edited by B. B. Maher and R. Thompson,pp. 49–80, Cambridge Univ. Press, New York.
Stoner, J. S., J. E. T. Channell, and C. Hillaire-Marcel (1996), Themagnetic signature of rapidly deposited detrital layers from thedeep Labrador Sea: Relationship to North Atlantic Heinrichlayers, Paleoceanography, 11(3), 309–325.
Stoner, J. S., J. E. T. Channell, and C. Hillaire-Marcel (1998), A200 ka geomagnetic chronostratigraphy for the Labrador Sea:Indirect correlation of the sediment record to SPECMAP, EarthPlanet. Sci. Lett., 159, 165–181.
Stoner, J. S., J. E. T. Channell, C. Hillaire-Marcel, and C. Kissel(2000), Geomagnetic paleointensity and environmental recordfrom Labrador Sea core MD95-2024: Global marine sedimentand ice core chronostratigraphy for the last 110 kyr, Earth Pla-net. Sci. Lett., 183, 161–177.
Stuiver, M., and P. M. Grootes (2000), GISP2 oxygen isotoperatios, Quat. Res., 53, 277–283.
Suman, D. O., and M. P. Bacon (1989), Variations in Holocenesedimentation in the North American Basin determined fromTh-230 measurements, Deep Sea Res., Part A, 36(6), 869–878.
Taylor, S. R., and S. M. McLennan (1985), The continental crust:Its composition and evolution, in Geoscience Texts, pp. 312,Blackwell Sci., Malden, Mass.
Thomson, J., N. C. Higgs, and T. Clayton (1995), A geochemicalcriterion for the recognition of Heinrich events and estimation oftheir depositional fluxes by the 230Thexcess profiling method,Earth Planet. Sci. Lett., 135, 41–56.
Thomson, J., S. Nixon, C. P. Summerhayes, J. Schonfeld, R. Zahn,and P. Grootes (1999), Implications for sedimentation changes onthe Iberian margin over the last two glacial/interglacial transi-tions from (230Thexcess)0 systematics, Earth Planet. Sci. Lett.,165, 255–270.
Vance, D., and C. Archer (2002), Isotopic constraints on the originof Heinrich event precursors, Geochim. Cosmochim. Acta, 66,Suppl. 1, A798.
van Kreveld, S. A., M. Knappertsbusch, J. Ottens, G. M. Ganssen,and J. E. van Hinte (1996), Biogenic carbonate and ice-rafteddebris (Heinrich layer) accumulation in deep-sea sediments froma northeast Atlantic piston core, Mar. Geol., 131, 21–46.
van Kreveld, S., M. Sarnthein, H. Erlenkeuser, P. Grootes, S. Jung,M. J. Nadeau, U. Pflaumann, and A. Voelker (2000), Potentiallinks between surging ice sheets, circulation changes, and theDansgaard-Oeschger cycles in the Irminger Sea, 60–18 kyr,Paleoceanography, 15(4), 425–442.
Veiga-Pires, C. C., and C. Hillaire-Marcel (1999), U and Th iso-tope constraints on the duration of Heinrich events H0-H4 in thesoutheastern Labrador Sea, Paleoceanography, 14(2), 187–199.
Verbitsky, M., and B. Saltzman (1995), A diagnostic analysis ofHeinrich glacial surge events, Paleoceanography, 10(1), 59–65.
Vidal, L., L. Labeyrie, E. Cortijo, M. Arnold, J. C. Duplessy,E. Michel, S. Becque, and T. C. E. van Weering (1997), Evidencefor changes in the North Atlantic Deep Water linked to meltwatersurges during the Heinrich events, Earth Planet. Sci. Lett., 146,13–27.
Vidal, L., L. Labeyrie, and T. C. E. van Weering (1998), Benthicd18O records in the North Atlantic over the last glacial period(60–10 kyr): Evidence for brine formation, Paleoceanography,13(3), 245–251.
Voelker, A. H. L. (2002), Global distribution of centennial-scalerecords for Marine Isotope Stage (MIS) 3: A database, Quat. Sci.Rev., 21(10), 1185–1212.
Voelker, A. H. L., M. Sarnthein, P. M. Grootes, H. Erlenkeuser,C. Laj, A. Mazaud, M.-J. Nadeau, and M. Schleicher (1998),Correlation of marine 14C ages from the Nordic Seas with theGISP2 isotope record: Implications for 14C calibration beyond25 ka BP, Radiocarbon, 40(1–2), 517–534.
Voelker, A. H. L., P. M. Grootes, M. J. Nadeaue, and M. Sarnthein(2000), Radiocarbon levels in the Iceland Sea from 25–53 kyrand their link of the Earth’s magnetic field intensity, Radiocar-bon, 42(3), 437–452.
Waelbroeck, C., J. C. Duplessy, E. Michel, L. Labeyrie, D. Paillard,and J. Duprat (2001), The timing of the last deglaciation in NorthAtlantic climate records, Nature, 412, 724–727.
Waelbroeck, C., L. Labeyrie, E. Michel, J. C. Duplessy, J. F.McManus, K. Lambeck, E. Balbon, and M. Labracherie(2002), Sea-level and deep water temperature changes derived
RG1005 Hemming: HEINRICH EVENTS
42 of 43
RG1005
from benthic foraminifera isotopic records, Quat. Sci. Rev.,21(1–3), 295–305.
Wang, Y. J., H. Cheng, R. L. Edwards, Z. S. An, J. Y. Wu, C.-C.Shen, and J. A. Dorale (2001), A high-resolution absolute-datedlate Pleistocene monsoon record from Hulu Cave, China,Science, 294, 2345–2348.
Willamowski, C., and R. Zahn (2000), Upper ocean circulation inthe glacial North Atlantic from benthic foraminiferal isotope andtrace element fingerprinting, Paleoceanography, 15(5), 515–527.
Wunsch, C. (2003), Determining paleoceanographic circulations,with emphasis on the Last Glacial Maximum, Quat. Sci. Rev.,22(2–4), 371–385.
Yokoyama, Y., T. M. Esat, K. Lambeck, and L. K. Fifield (2000),Last ice age millennial scale climate changes recorded in HuonPeninsula corals, Radiocarbon, 42(3), 383–401.
Yokoyama, Y., T. M. Esat, and K. Lambeck (2001), Coupled cli-mate and sea-level changes deduced from Huon Peninsula coralterraces of the last ice age, Earth Planet. Sci. Lett., 193, 579–587.
Zahn, R., J. Shonfeld, H.-R. Kudrass, M.-H. Park, H. Erlenkeuser,and P. Grootes (1997), Thermohaline instability in the NorthAtlantic during meltwater events: Stable isotope and ice-rafteddetritus records from core SO75-26KL, Portuguese margin,Paleoceanography, 12(5), 696–710.
�������������������������S. R. Hemming, Lamont-Doherty Earth Observatory of Columbia
University, Route 9W, Palisades, NY 10964, USA. ([email protected]. edu)
RG1005 Hemming: HEINRICH EVENTS
43 of 43
RG1005


