
Health Disparities in Hawaii County
Japanese Chamber of Commerce January 25, 2012
Sharon H. Vitousek, M.D.North Hawaii Outcomes Project, www.nhop.org
Hawaii Island Healthcare Alliance www.hawaiihealthcarealliance.org

Health Disparities in Hawaii County
• What impact on business?
• What is the role of business ?
• Benefits of improvement to business
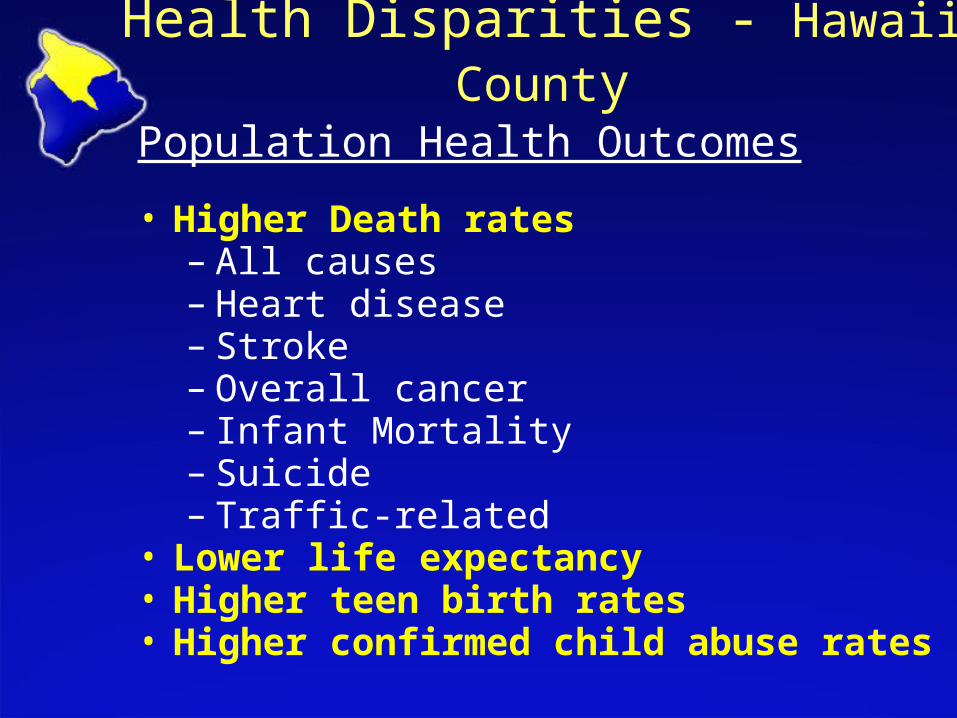
Health Disparities - Hawaii County
Population Health Outcomes
• Higher Death rates– All causes– Heart disease– Stroke– Overall cancer– Infant Mortality– Suicide– Traffic-related
• Lower life expectancy• Higher teen birth rates• Higher confirmed child abuse rates

764.0
670.8
668.4
603.8
0
100
200
300
400
500
600
700
800
900
1000
1999 2000 2001 2002 2003 2004 2005 2006 2007 2008 2009
Age
-Adj
ust
ed
Dea
th R
ate
per
100
,000
pop
ula
tion
All Causes - Age-Adjusted Death RateHawaii County Compared to the State
Chart: North Hawaii Outcomes Project - April 2011 Source: Office of Health Status Monitoring, 1999-2011
Hawaii County
State

153.4
Hawaii CountyHawaii County
93.4HP 2020 - 100.8
124.3
State 77.6
0.0
20.0
40.0
60.0
80.0
100.0
120.0
140.0
160.0
180.0
1999 2000 2001 2002 2003 2004 2005 2006 2007 2008 2009
Age
-adj
uste
d ra
te p
er 1
00,0
00 p
opul
atio
nCoronary Heart Disease - Death RatesHawaii County compared to State (1999-2009)
Chart: North Hawaii Outcomes Project - May 27, 2011 Source: Hawaii State Department of Health - Office of Health Status Monitoring 1999 - 2009

75.5
Hawaii County
42.7
61.9
State39.1
0.0
10.0
20.0
30.0
40.0
50.0
60.0
70.0
80.0
90.0
100.0
1999 2000 2001 2002 2003 2004 2005 2006 2007 2008 2009
Ag
e-a
dju
ste
d r
ate
pe
r 10
0,0
00
po
pu
lati
on
Chart: North Hawaii Outcomes Project - May 31, 2011
Cerebrovascular(Stroke) Disease - Death RatesHawaii County compared to State (1999-2009)
Source: Department of Health - Office of Health Status Monitoring, 1999 - 2009
Healthy People 2020 Target - (33.8)

172.7
156.3151.9
140.7
0
20
40
60
80
100
120
140
160
180
200
1999 2000 2001 2002 2003 2004 2005 2006 2007 2008 2009
Dea
ths
per 1
00,0
00 a
ge-a
djus
ted
popu
latio
nOverall Cancer - Death Rate
Hawaii County Compared to the State - (1999-2009)
Chart: North Hawaii Outcomes Project - May 31, 2011 Source: Office of Health Status Monitoring, 1999-2009
State
Hawaii CountyHealthy People 2020 Target - 160.6

10.3
6.9
7.7
5.9
0.0
2.0
4.0
6.0
8.0
10.0
12.0
2000 2001 2002 2003 2004 2005 2006 2007 2008 2009
Ra
te o
f In
fan
t d
ea
ths
pe
r 1
,00
0 li
ve b
irth
sInfant Mortality Rate
(Place of residence)
HP 2020
HC
St
Source: State of Hawaii Health Department, Vital StatisticsChart: North Hawaii Outcomes Project - September 2011
HP 2020 Target - 6.0
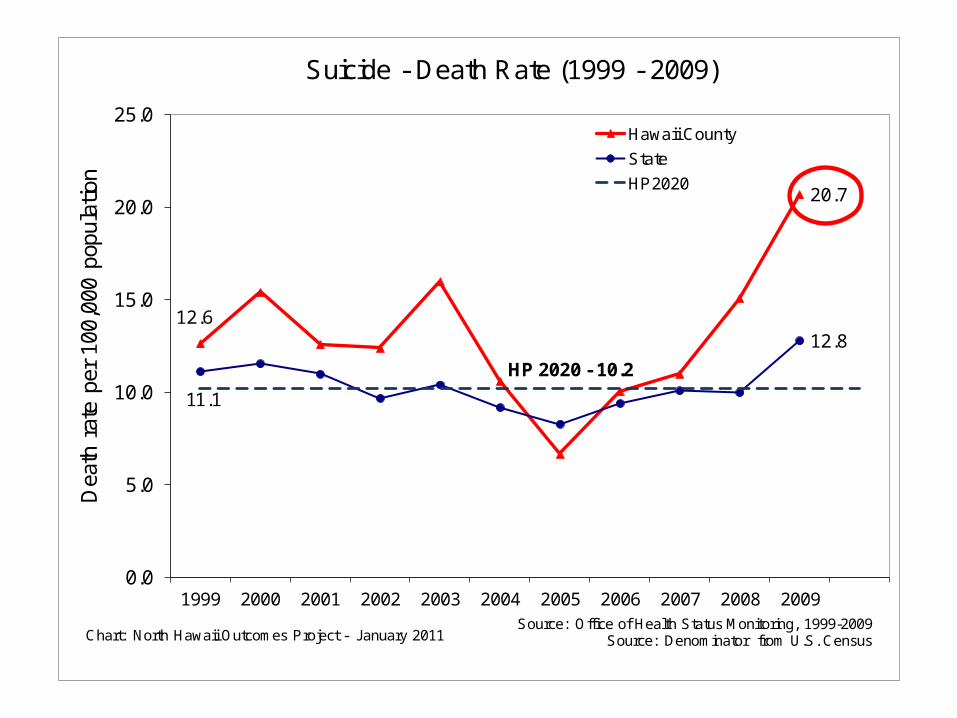
12.6
20.7
11.1
12.8
HP 2020 - 10.2
0.0
5.0
10.0
15.0
20.0
25.0
1999 2000 2001 2002 2003 2004 2005 2006 2007 2008 2009
Dea
th r
ate
per
100,
000
popu
latio
n
Hawaii County
State
HP2020
Suicide - Death Rate (1999 - 2009)
Chart: North Hawaii Outcomes Project - January 2011Source: Office of Health Status Monitoring, 1999-2009
Source: Denominator from U.S. Census

10.9 11.5
9.710.8 11.4 11.1
12.7
10.9
8.4 8.5 8.7
7.48.9
7.69.0
7.9 8.49.8
7.5
4.85.9
6.6
25.5
19.9
18.3
21.1
25.624.2
23.021.9
16.515.2
17.3
0.0
5.0
10.0
15.0
20.0
25.0
30.0
2000 2001 2002 2003 2004 2005 2006 2007 2008 2009 2010
Ra
te o
f tr
aff
ic -r
ela
ted
fa
talit
ies
pe
r 10
0,0
00
po
pu
latio
n,
no
t a
ge-
ad
just
edFatalitiesRelated -Rate of Traffic
Chart: North Hawaii Outcomes Project - April 2011Traffic fatalities include; motor vehicle occupants, pedestrians, motorcyclists,
Source: Numerator from Department of TransportationDenominator-Source: U.S. Census Bureau, Population
Division, "CO-PEST2010-totalsJuly 1, 2000 to July 1, 2010(CO-EST2009-01-15)
Hawaii County
State
City & County of Honolulu

79.7 80.9 80.7 80.6
0.0
10.0
20.0
30.0
40.0
50.0
60.0
70.0
80.0
90.0
100.0
Hawaii County City & County of Honolulu Kauai County Maui/Kalawao County
Average Life Expectancy at Birth, by County (2004-2006)
Chart: North Hawaii Outcomes Project - March 2010 Source: Hawaii State Data Book 2008
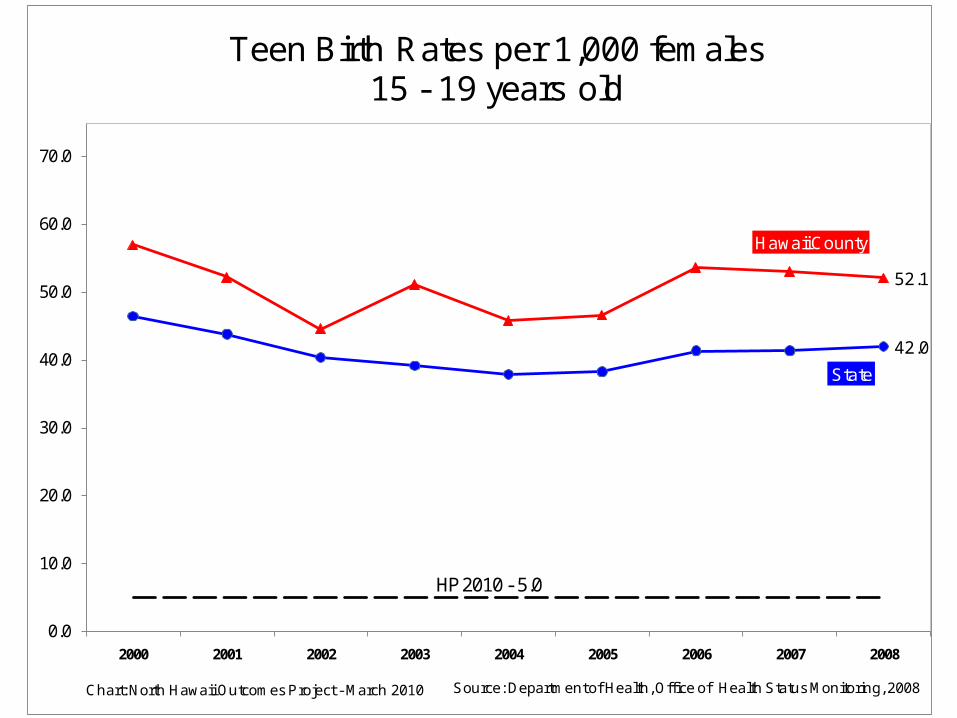
Hawaii County
52.1
State
42.0
0.0
10.0
20.0
30.0
40.0
50.0
60.0
70.0
2000 2001 2002 2003 2004 2005 2006 2007 2008
HP 2010 - 5.0
Source: Department of Health, Office of Health Status Monitoring, 2008Chart: North Hawaii Outcomes Project - March 2010
Teen Birth Rates per 1,000 females15 - 19 years old

Hawaii County
State
0.0
5.0
10.0
15.0
20.0
25.0
30.0
2000 2002 2003 2005 2006 2007 2008
Per
1,0
00 c
hild
ren
Chart: North Hawaii Outcomes Project - August 2010
Rate Confirmed-Child Abuse and Neglect
Source: Hawaii State Data BookNote: No data was available for years 2001 and 2004.

Health Disparities - Hawaii County
Why?

Institute of MedicineFramework for Population Health
Social and Physical Environment
Social, Economic & Physical Environment
(Socioeconomic Determinants)
Health-Related Behaviors
Health Systems
(Access to Care)
Population
Health Outcomes

9.8%
5.6%
8.3% 8.7%
0.0%
2.0%
4.0%
6.0%
8.0%
10.0%
12.0%
Hawaii County City & County of Honolulu Maui County Kauai County
Average Percent Unemployed 2010
Chart: North Hawaii Outcomes Project - January 2012 Source: American Community Survey 2010

$22,713
$28,629 $27,767
$24,774
$0
$5,000
$10,000
$15,000
$20,000
$25,000
$30,000
$35,000
Hawaii County City & County of Honolulu Maui County Kauai County
Per Capita Income - 2010
Chart: North Hawaii Outcomes Project - October 2011 Source: U.S. Census, ACS 2010

$57,308
$81,177$73,916
$59,020
$0
$10,000
$20,000
$30,000
$40,000
$50,000
$60,000
$70,000
$80,000
$90,000
Hawaii County City & County of Honolulu Maui County Kauai County
Median Income - 2010
Chart: North Hawaii Outcomes Project - October 2011 Source: U.S. Census, ACS 2010

35.0%
21.9%
28.4% 26.5%State - 24.6%
0.0%
5.0%
10.0%
15.0%
20.0%
25.0%
30.0%
35.0%
40.0%
45.0%
50.0%
Hawaii County City & County of Honolulu Kauai County Maui County
Population at or Below 200% Federal Poverty - 2010
Chart: North Hawaii Outcomes Project - October 2010 Source: U.S. Census Bureau, ACS 2010

25.0%
18.0%
12.5%11.0%
State - 13.9%
0.0%
5.0%
10.0%
15.0%
20.0%
25.0%
30.0%
Hawaii County Maui County Kauai County C & C of Honolulu
Youth Below 100% Federal Poverty Level 2010
Chart: North Hawaii Outcomes Project - October 2011 Source: U.S. Census, ACS 2010

0.451
0.422
0.4410.447
State - 0.433
U.S. - 0.469
0.39
0.4
0.41
0.42
0.43
0.44
0.45
0.46
0.47
0.48
Hawaii County City & County of Honolulu Maui County Kauai County
Gini Ratio of Income Inequality - 2010
Chart: North Hawaii Outcomes Project - October 2011 Source: U.S. Census, ACS 2010
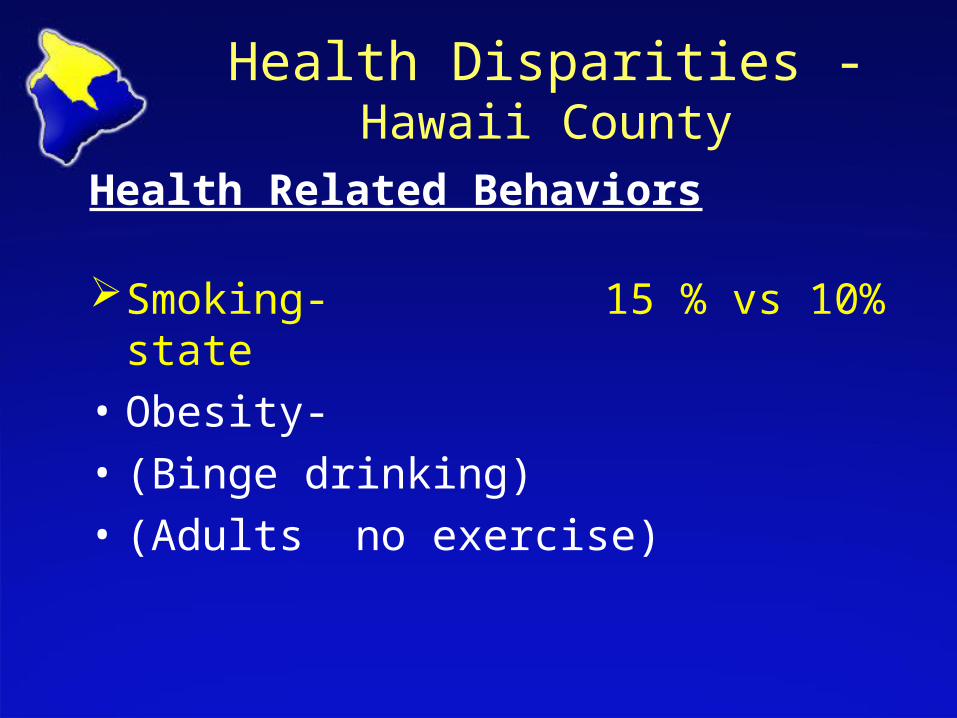
Health Disparities - Hawaii County
Health Related Behaviors
Smoking- 15 % vs 10% state
• Obesity-
• (Binge drinking)
• (Adults no exercise)
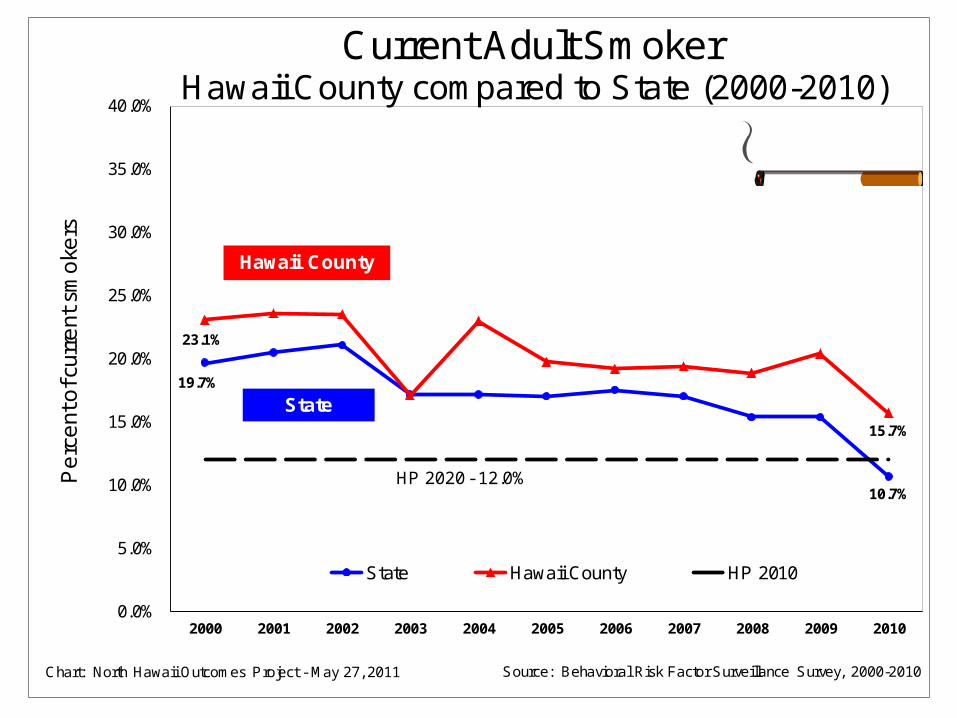
19.7%
10.7%
23.1%
15.7%
HP 2020 - 12.0%
0.0%
5.0%
10.0%
15.0%
20.0%
25.0%
30.0%
35.0%
40.0%
2000 2001 2002 2003 2004 2005 2006 2007 2008 2009 2010
Perc
ent
of c
urre
nt s
moke
rs
State Hawaii County HP 2010
Chart: North Hawaii Outcomes Project - May 27, 2011 Source: Behavioral Risk Factor Surveillance Survey, 2000-2010
Current Adult SmokerHawaii County compared to State (2000-2010)
Hawaii County
State

15.7%
23.1%
15.2%
26.3%
0.0%
5.0%
10.0%
15.0%
20.0%
25.0%
30.0%
35.0%
40.0%
45.0%
50.0%
2000 2001 2002 2003 2004 2005 2006 2007 2008 2009 2010
State
Hawaii County
HP 2020
Chart: North Hawaii Outcomes Project - January 2012 Source: Behavioral Risk Factor Surveillance Survey, 2000 - 2010
HP 2020 Target- 30.6%
Obesity-(Body Mass Index > 30)Hawaii County Compared to State (2000-2010)

10.4%
17.9%
12.2%
17.7%
0.0%
5.0%
10.0%
15.0%
20.0%
25.0%
2001 2002 2003 2004 2005 2006 2007 2008 2009 2010
State Hawaii County
Hawaii County Compared to State - *Binge Drinking Adults 18 years and older (2001- 2010)
Source: Behavioral Risk Factor Surveillance Survey 2001- 2010*"five or more alcoholic beverages on at least one occasion, in the past month."
Chart: North Hawaii Outcomes Project May 27, 2011

22.4%20.2%
18.9% 19.2%
0.0%
10.0%
20.0%
30.0%
40.0%
50.0%
2001 2002 2003 2004 2005 2006 2007 2008 2009 2010
Adults with no Leisure Time Exercise or Physical Activity within last 30 days
Chart: North Hawaii Outcomes Project - September 2011 Source: State of Hawaii Behavioral Risk Factor Surveillance Survey, 2001-2010
Hawaii County
State
HP 2020 Target - 32.6%
Health Disparities - Hawaii County
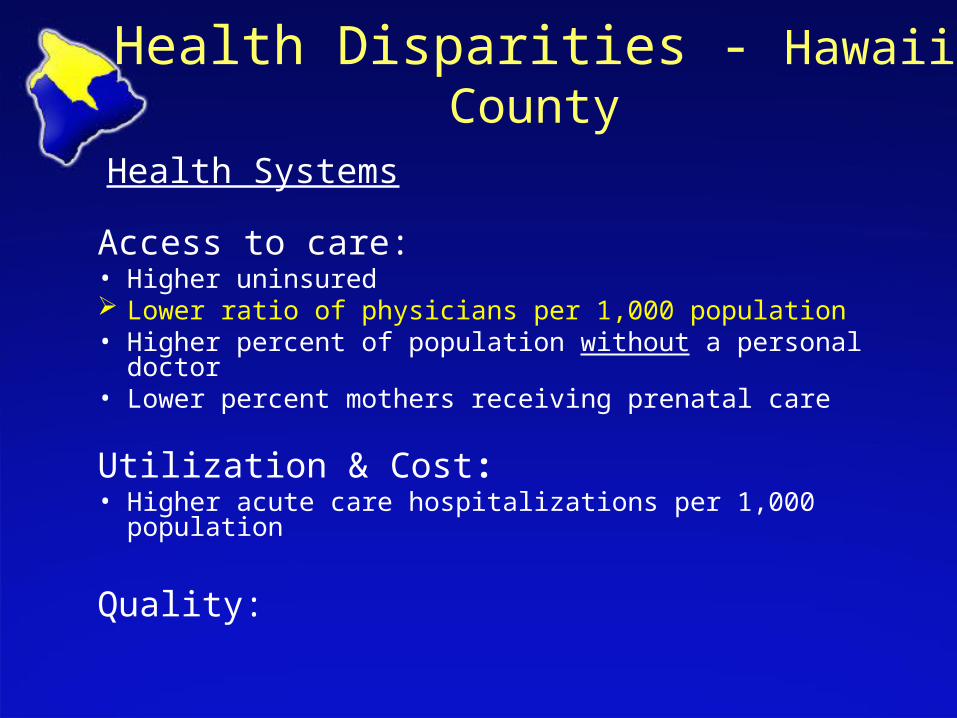
Health Systems
Access to care:• Higher uninsured Lower ratio of physicians per 1,000 population• Higher percent of population without a personal doctor• Lower percent mothers receiving prenatal care
Utilization & Cost:• Higher acute care hospitalizations per 1,000 population
Quality:

2.1
3.4
2.22.4
0.0
0.5
1.0
1.5
2.0
2.5
3.0
3.5
4.0
Hawaii County City & County Of Honolulu
Maui County Kauai County
Lic
en
sed
ph
ysic
ian
s p
er 1
,000 p
op
ula
tio
n
Licensed Physicians with a Hawaii Primary Address per 1,000 Population by County (2011)
Chart: North Hawaii Outcomes Project - September 2011 Source: Numerator from Department of Commerce and Consumer Affairs –July 27, 2011
*Denominator from U.S. Census 2010 .may or may not be active** Licensed physicians
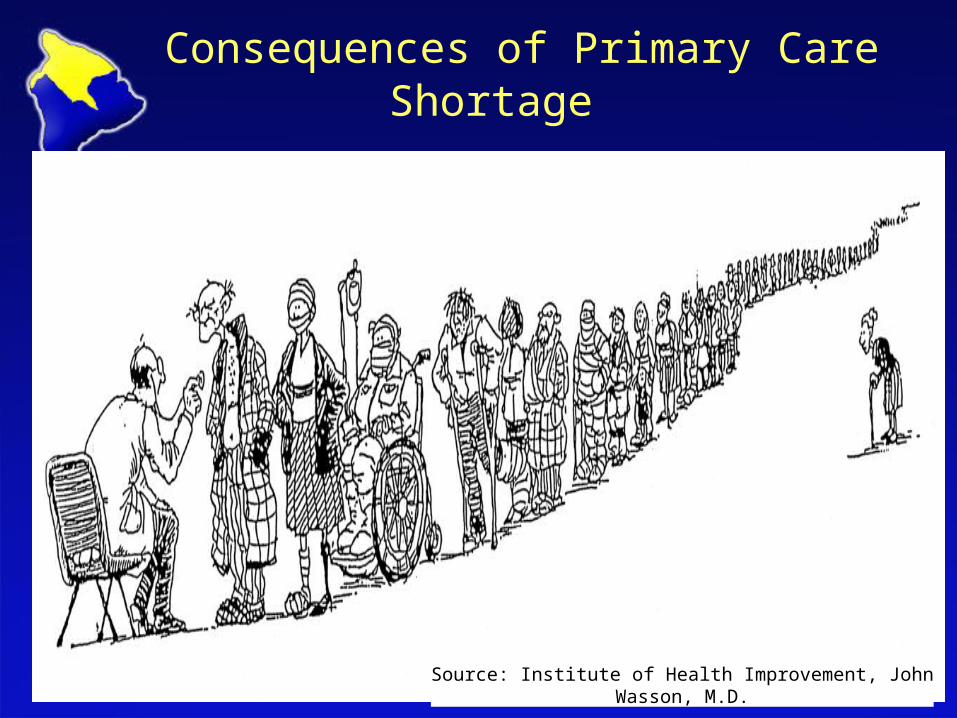
Consequences of Primary Care Shortage
Source: Institute of Health Improvement, John Wasson, M.D.

Consequences of Primary Care Shortage
• Delayed Care & Increased suffering
• Higher ER utilization
• Higher hospital utilization
• Increased costs
• Less focus on Prevention- Life style
• Less screening- Cancer & Depression
• Poorer outcomes

76%
76%
83%84%
0%
10%
20%
30%
40%
50%
60%
70%
80%
90%
100%
2000 2001 2002 2003 2004 2005 2006 2007 2008 2009
HP 2020
Hawaii County
State
Mothers Receiving Prenatal Care in First Trimester
Chart: North Hawaii Outcomes Project - September 4, 2011 Source: Department of Health - Office of Health Status Monitoring, 2000 - 2009
Healthy People 2020 Target 77.9%

Improving Population Health -- How?
Socioeconomic DeterminantsEconomic Development
•Health sector: policy change & planning•Education & Science sectors- TMT•Energy sector
Health-Related BehaviorsEnvironmental AND Individual Strategies
•Smoking cessation, physical activity, • Identifying and addressing problem drinking, & depression
Health SystemsPrimary Care Workforce Development
•Grow our own docs, Policy change, •BEACON: Redesign care through Collaboration, Technology & Engagement
Improved
Population
Health Outcomes

Economic Development of the Healthcare Sector
• Why – 3rd largest employer in Hawaii County – Largest employer in many rural communities– Economic Multiplier effect of physicians~ 5 to 1– Good for business & community
• How– Work force development & policy change
• What Business can do

Hawaii County EmployeesDBED Nov 2011
Employment sector # of Employees
1. Government 12,0002. Retail trade 8,0003. Healthcare/social assistance 6,900
4. Accommodations 5,5005. Food service and drinking places
5,200

Hawaii Island Healthcare Alliance• Island wide, voluntary, collaborative group of
stakeholders• Goal: Improve health & healthcare in Hawaii County
by increasing healthcare workforce & improving financial sustainability of providers
• Endorses:– Growing own providers - Residency Hilo, – Broader primary care team– Collaboration to align policy efforts,
• Friends of the Future is 501(c )(3) Fiscal Agent

What Business Can Do
• Engage Employees in Healthy Lifestyles• Advocate for:
– Development of the Health Sector/Workforce– Funding UH Family Practice Residency - Hilo
• Technical Assistance for planning, finance– Serve on healthcare boards or committees– Join Hawaii Island Healthcare Alliance
• Demonstrate for Residency Program - Hilo– Small donations to show community support

Benefits of Health Workforce Development
• Improved Access– Timely Care & Decreased suffering– Lower hospital/ER utilization
• More prevention & life style improvements• More recommended screenings• Decreased costs• Economic stimulation- job creation• Better outcomes & Quality of Life• Improved productivity/business environment

Hawaii Island Healthcare Alliance
www.hawaiihealthcarealliance.org


