
Health Disparities for Hawaii County
Health ConferenceAugust 13, 2010
Sharon H. Vitousek, M.D.North Hawaii Outcomes Project
www.nhop.org
Health Disparities - Hawaii County
Health Outcomes
• Higher Death rates– All causes– Heart disease– Stroke– Overall cancer– Infant Mortality– Traffic-related– Suicide
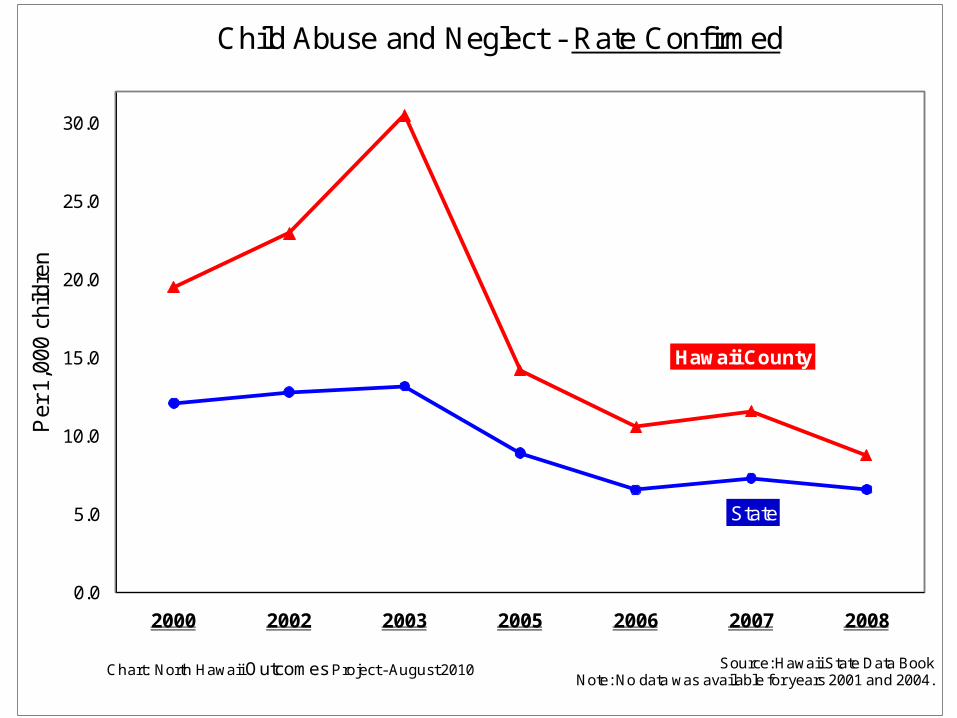
• Lower life expectancy• Higher teen birth rates• Higher confirmed child abuse rates• Higher self-reported fair/poor health status
Health Disparities - Hawaii CountyHealth Outcomes
0
100
200
300
400
500
600
700
800
900
1000
1999 2000 2001 2002 2003 2004 2005 2006 2007
Ag
e-A
dju
ste
d R
ate
s p
er
10
0,0
00
po
pu
latio
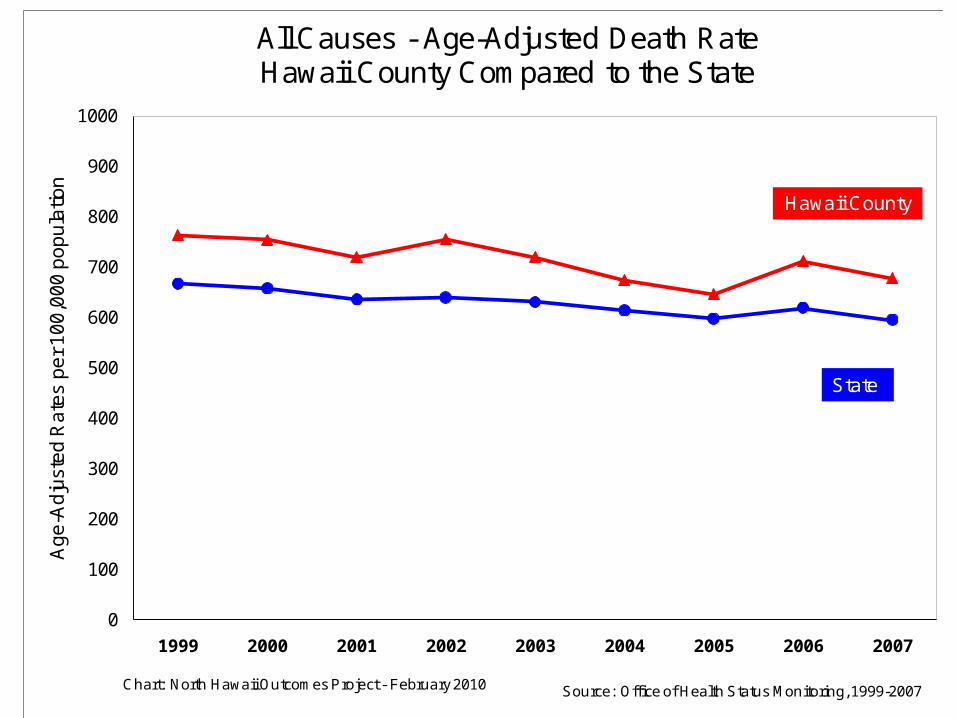
nAll Causes - Age-Adjusted Death RateHawaii County Compared to the State
Chart: North Hawaii Outcomes Project - February 2010 Source: Office of Health Status Monitoring, 1999-2007
Hawaii County
State

Hawaii County
State
HP 2010 - 166.0
0.0
20.0
40.0
60.0
80.0
100.0
120.0
140.0
160.0
180.0
1999 2000 2001 2002 2003 2004 2005 2006 2007 2008
Ag
e-a
dju
ste
d r
ate
pe
r 1
00
,00
0 p
op
ula
tion
Coronary Heart Disease - Death RateHawaii County Compared to State
Chart: North Hawaii Outcomes Project - July 2010 Source: Hawaii State Department of Health - Office of Health Status Monitoring 1999 - 2008
Hawaii County
State
0.0
10.0
20.0
30.0
40.0
50.0
60.0
70.0
80.0
90.0
100.0
1999 2000 2001 2002 2003 2004 2005 2006 2007 2008
Ag
e-a
dju
ste
d ra
te p
er
10
0,0
00
po
pu
lati
on
Chart: North Hawaii Outcomes Project - August 2010Source: Department of Health - Office of Health Status
Monitoring, 1999 - 2008
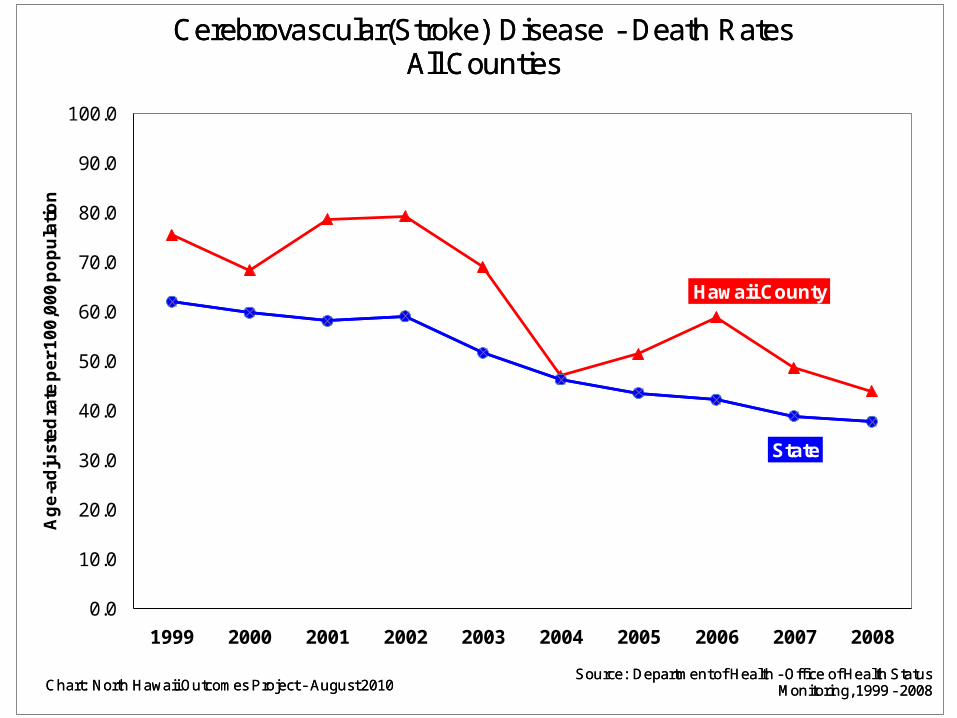
Cerebrovascular(Stroke) Disease - Death RatesAll Counties
Chart: North Hawaii Outcomes Project - August 2010Source: Department of Health - Office of Health Status
Monitoring, 1999 - 2008
Cerebrovascular(Stroke) Disease - Death RatesAll Counties

0
20
40
60
80
100
120
140
160
180
200
1999 2000 2001 2002 2003 2004 2005 2006 2007
De
ath
s p
er
10
0,0
00
ag
e-a
dju
ste
d p
op
ula
tion
Overall Cancer - Death RateHawaii County Compared to the State
Chart: North Hawaii Outcomes Project - February 2010 Source: Office of Health Status Monitoring, 1999-2007
State
Hawaii County

10.911.5
9.710.7
11.3 11.112.6
10.8
8.3 8.4
25.5
19.918.3
21.1
25.6
24.323.1
22.0
16.5
15.2
7.48.9
7.68.9
7.8 8.39.7
7.4
4.85.8
0.0
5.0
10.0
15.0
20.0
25.0
30.0
2000 2001 2002 2003 2004 2005 2006 2007 2008 2009
Rat
e of
traffi
c -rel
ated
fata
litie
s pe
r 100
,000
pop
ulat
ion,
not
age
-adj
uste
dFatalitiesRelated -Rate of Traffic
Chart: North Hawaii Outcomes Project - April 2010Traffic fatalities include; motor vehicle occupants, pedestrians, motorcyclists, moped operators, ATV operators, and bicyclists.
Source: Numerator from Department of TransportationDenominator-Table 1: Annual Estimates of the Population for Counties of Hawaii:
April 1, 2000 to July 1, 2009(CO-EST2009-01-15)Source: Population Division, U.S. Census Bureau
Release Date: March 20, 2010
Hawaii County
State
City & County of Honolulu

4.6
5.3
0
2
4
6
8
10
12
2000 2001 2002 2003 2004 2005 2006 2007 2008
Ra
te o
f In
fan
t de
ath
s p
er 1
,00
0 li
ve b
irth
sInfant Mortality Rate
(Place of residence)
HP 2010
HC
St
Source: State of Hawaii Health Department, Vital StatisticsChart: North Hawaii Outcomes Project - March 2010
HP 2010 Goal - 4.5
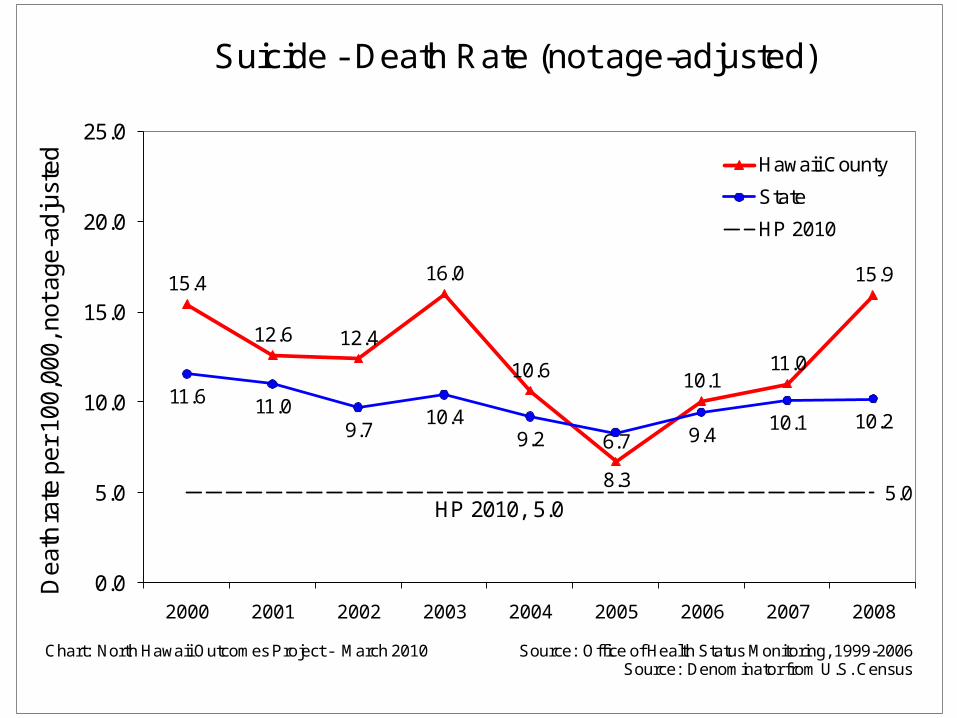
15.4
12.6 12.4
16.0
10.6
6.7
10.111.0
15.9
11.6 11.09.7
10.49.2
8.3
9.410.1 10.2
HP 2010, 5.05.0
0.0
5.0
10.0
15.0
20.0
25.0
2000 2001 2002 2003 2004 2005 2006 2007 2008
Dea
th ra
te p
er 1
00,0
00, n
ot a
ge-a
djus
ted Hawaii County
State
HP 2010
Suicide - Death Rate (not age-adjusted)
Chart: North Hawaii Outcomes Project - March 2010 Source: Office of Health Status Monitoring, 1999-2006Source: Denominator from U.S. Census

79.7 80.9 80.7 80.6
0.0
10.0
20.0
30.0
40.0
50.0
60.0
70.0
80.0
90.0
100.0
Hawaii County City & County of Honolulu Kauai County Maui/Kalawao County
Average Life Expectancy at Birth, by County (2004-2006)
Chart: North Hawaii Outcomes Project - March 2010 Source: Hawaii State Data Book 2008

Hawaii County
52.1
State
42.0
0.0
10.0
20.0
30.0
40.0
50.0
60.0
70.0
2000 2001 2002 2003 2004 2005 2006 2007 2008
HP 2010 - 5.0
Source: Department of Health, Office of Health Status Monitoring, 2008Chart: North Hawaii Outcomes Project - March 2010
Teen Birth Rates per 1,000 females15 - 19 years old
Hawaii County
State
0.0
5.0
10.0
15.0
20.0
25.0
30.0
2000 2002 2003 2005 2006 2007 2008
Per
1,0
00 c
hild
ren
Chart: North Hawaii Outcomes Project - August 2010
Rate Confirmed-Child Abuse and Neglect
Source: Hawaii State Data BookNote: No data was available for years 2001 and 2004.
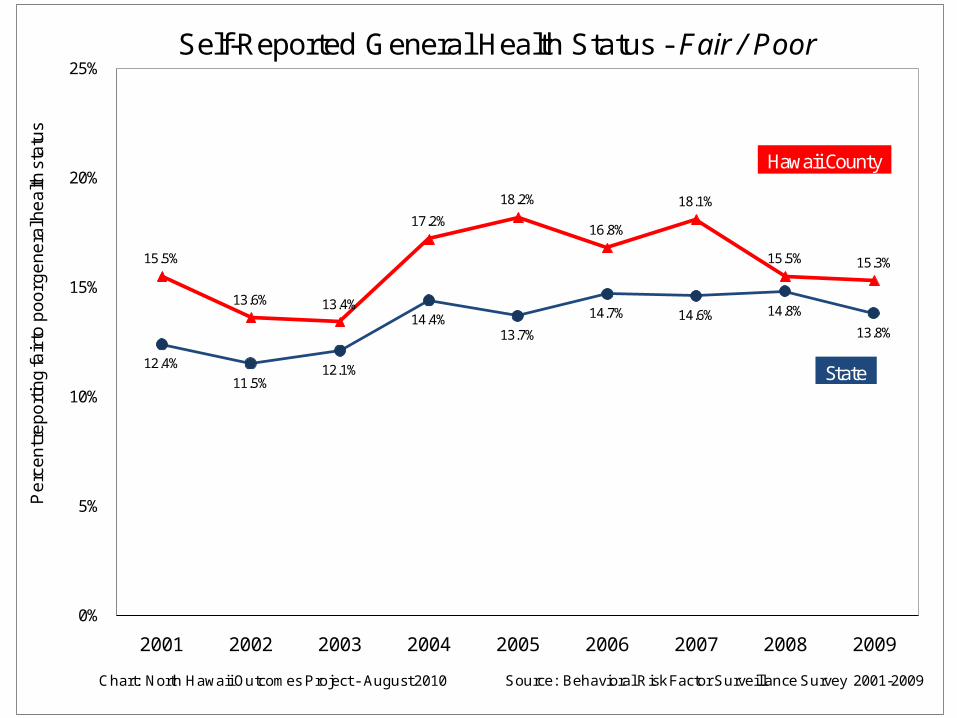
15.5%
13.6% 13.4%
17.2%
18.2%
16.8%
18.1%
15.5% 15.3%
12.4%
11.5%12.1%
14.4%13.7%
14.7% 14.6% 14.8%
13.8%
0%
5%
10%
15%
20%
25%
2001 2002 2003 2004 2005 2006 2007 2008 2009
Per
cent
repo
rting
fair
to p
oor g
ener
al h
ealth
sta
tus
Self-Reported General Health Status - Fair / Poor
Source: Behavioral Risk Factor Surveillance Survey 2001-2009Chart: North Hawaii Outcomes Project - August 2010
Hawaii County
State

Health Disparities - Hawaii County• Geographic
– Hawaii County
• Economic – higher death rates with lower income
• Education– Higher death rates with lower education
• Ethnic: Genetic & Cultural, Socioeconomic
– Higher CVD death rates --Hawaiian, Filipino– Lower cancer screening rates– Hawaiian– Lower rates of control - diabetes & blood pressure

Health Disparities - Hawaii County
Why?

Framework for Population Health Institute of Medicine
Social and Physical Environment
Social, Economic & Physical Environment
(Socioeconomic Determinants)
Health-Related Behaviors
Health Systems
(Access to Care & Quality)
Population
Health Outcomes

Health Disparities - Hawaii County
Social and Economic Determinants
• Higher unemployment• Lower income per capita• Higher % population living under 200%
of federal poverty• More children living in poverty• Higher income inequality

5.1%
4.3% 4.2% 4.1%
0.0%
1.0%
2.0%
3.0%
4.0%
5.0%
6.0%
Hawaii County Maui County City & County of Honolulu Kauai County
Average Percemt Unemployed by Counties2006 - 2008
Chart: North Hawaii Outcomes Project - August 2010Source: American Community Survey 2006-2008

$25,070
$30,205$29,128
$0
$5,000
$10,000
$15,000
$20,000
$25,000
$30,000
$35,000
Hawaii County City & County of Honolulu Maui
Average Per Capita Income by County - 2008
Chart: North Hawaii Outcomes Project - December 2009 Source: American Community Survey, 2008
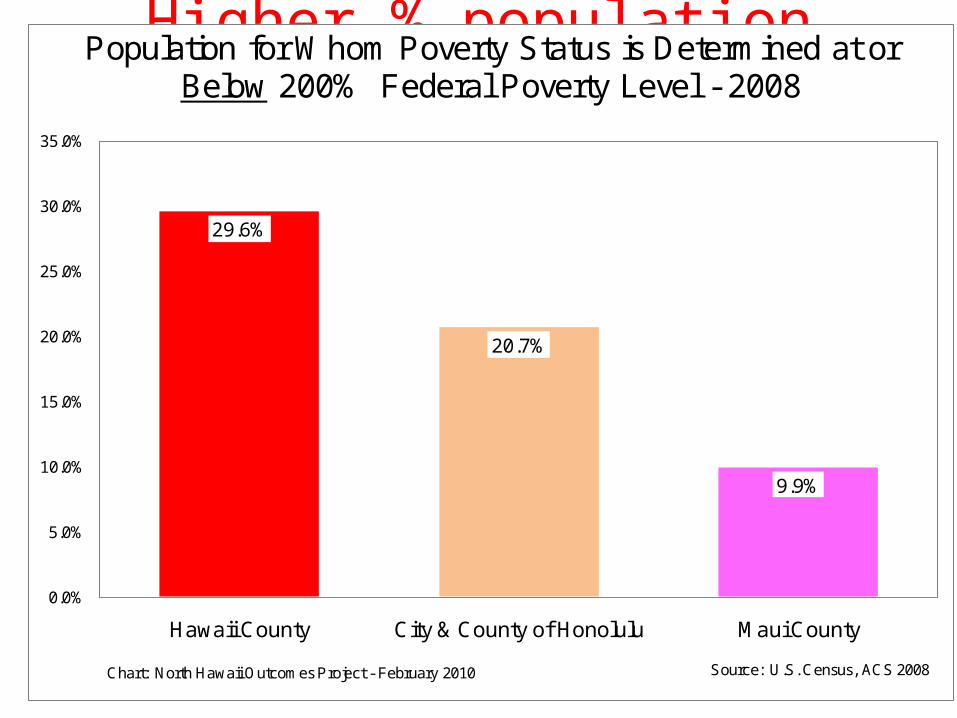
Higher % population living under 200% of federal poverty
29.6%
20.7%
9.9%
0.0%
5.0%
10.0%
15.0%
20.0%
25.0%
30.0%
35.0%
Hawaii County City & County of Honolulu Maui County
Population for Whom Poverty Status is Determined at or Below 200% Federal Poverty Level - 2008
Source: U.S. Census, ACS 2008Chart: North Hawaii Outcomes Project - February 2010
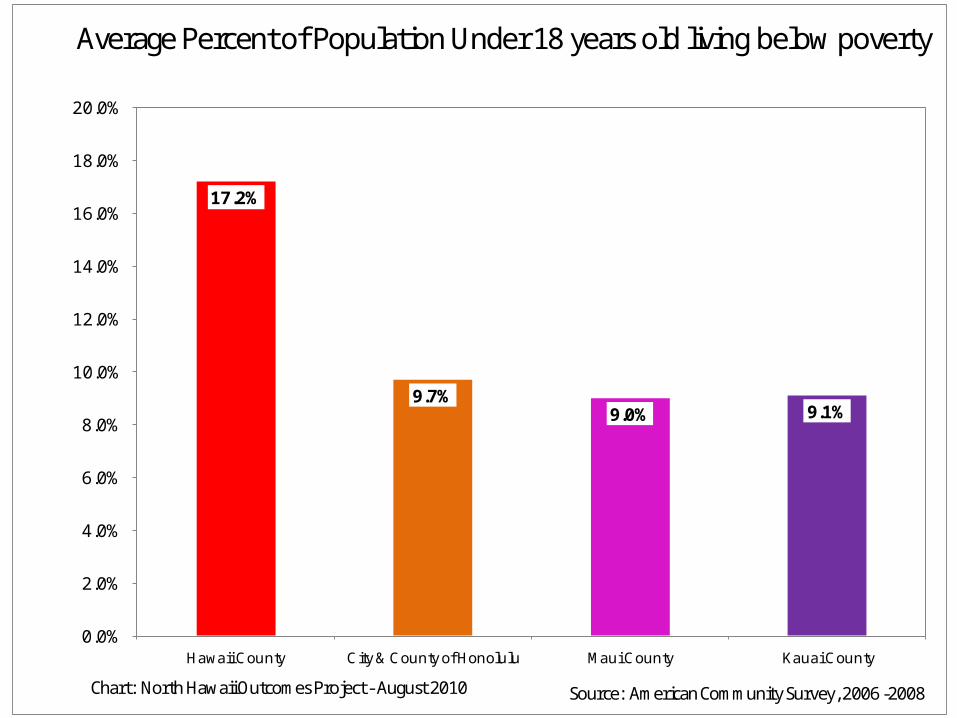
17.2%
9.7%9.0% 9.1%
0.0%
2.0%
4.0%
6.0%
8.0%
10.0%
12.0%
14.0%
16.0%
18.0%
20.0%
Hawaii County City & County of Honolulu Maui County Kauai County
Average Percent of Population Under 18 years old living below poverty
Chart: North Hawaii Outcomes Project - August 2010 Source: American Community Survey, 2006 -2008
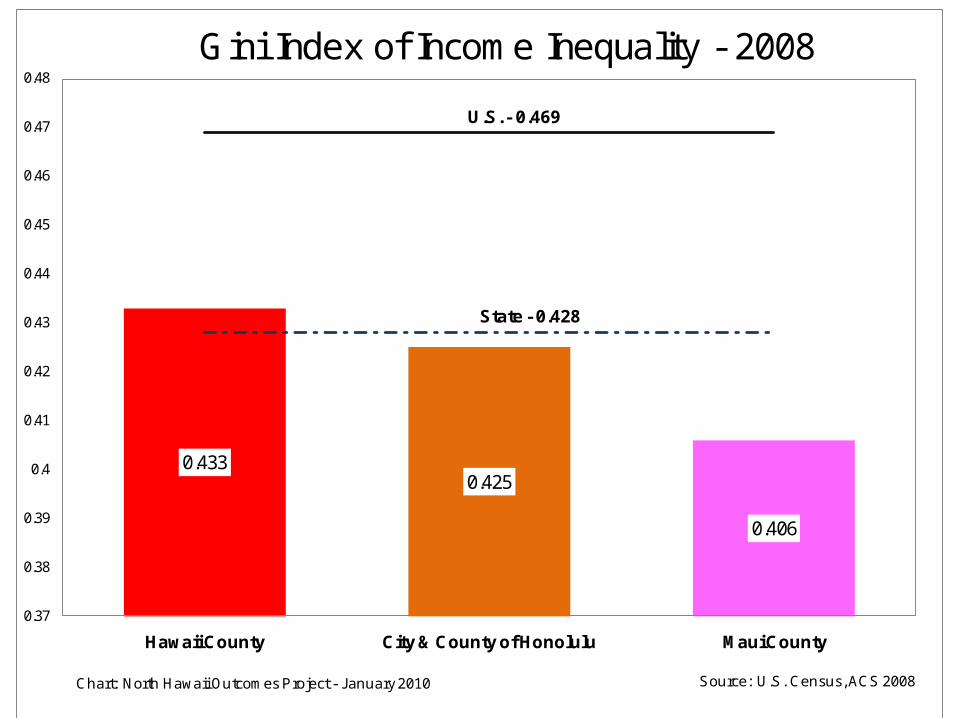
0.4330.425
0.406
State - 0.428
U.S. - 0.469
0.37
0.38
0.39
0.4
0.41
0.42
0.43
0.44
0.45
0.46
0.47
0.48
Hawaii County City & County of Honolulu Maui County
Gini Index of Income Inequality - 2008
Chart: North Hawaii Outcomes Project - January 2010 Source: U.S. Census, ACS 2008

Health Disparities - Hawaii County
Health Related Behaviors
Smoking
• Binge drinking
• (Obesity)
• (Adults getting no exercise)

Smoking
HP 2010 - 12.0%
0.0%
5.0%
10.0%
15.0%
20.0%
25.0%
30.0%
35.0%
40.0%
2000 2001 2002 2003 2004 2005 2006 2007 2008 2009
Per
cent
of c
urre
nt s
mok
ers
State Hawaii County HP 2010
Chart: North Hawaii Outcomes Project - July 2010Source: Behavioral Risk Factor Surveillance Survey, 2000-2008
Current Adult Smoker
Hawaii County
State

0.0%
5.0%
10.0%
15.0%
20.0%
25.0%
2001 2002 2003 2004 2005 2006 2007 2008 2009
State Hawaii County
Hawaii County Compared to State - *Binge Drinking Adults 18 years and older (2001- 2009)
Source: Behavioral Risk Factor Surveillance Survey 2001-2009*"five or more alcoholic beverages on at least one occasion, in the past month."
Chart: North Hawaii Outcomes Project July 2010

0.0%
5.0%
10.0%
15.0%
20.0%
25.0%
30.0%
2000 2001 2002 2003 2004 2005 2006 2007 2008 2009
State
Hawaii County
HP 2010
ObesityBody Mass Index > 30
Chart: North Hawaii Outcomes Project - August 2010 Source: Behavioral Risk Factor Surveillance Survey, 2000 - 2009
HP 2010 Goal

Activity
HP 2010 - 20.0%
0.0%
10.0%
20.0%
30.0%
2001 2002 2003 2004 2005 2006 2007 2008 2009
Adults Getting No Exercise
Chart: North Hawaii Outcomes Project - July 2010 Source: State of Hawaii Behavioral Risk Factor Surveillance Survey, 2001-2009
Hawaii County
State

Health Disparities - Hawaii County
Health Systems
Access:• Higher uninsured Lower ratio of physicians per 1,000 population• Higher percent of population without a personal doctor• Lower percent of female population receiving prenatal
careUtilization & Cost:• Higher acute care hospitalizations per 1,000 population
Quality:

2.1
3.4
2.32.4
0.0
0.5
1.0
1.5
2.0
2.5
3.0
3.5
4.0
Hawaii County City & County Of Honolulu Maui County Kauai County
Access to Physicians - 2009**Current licenses as of April 1, 2009
Chart: North Hawaii Outcomes Project - January 2010 Source: Numerator from Department of Commerce and Consumer Affairs –April 1, 2009
*Denominator from U.S. Census March 19, 2009 population estimate.may or may not be active** Licensed physicians

136137
146 146
150151
136
125
130
135
140
145
150
155
2001 2002 2003 2004 2005 2006 2007
7 %
1 %
3 %
1 %
-10%
Number of Hawaii CountyPhysicians Offices (2001- 2007)
Chart: North Hawaii Outcomes Project - February 2010Source: U.S. Census, Economic Census 2007

Consequences of Inadequate Access to Primary Healthcare
Source: Institute of Health Improvement, John Wasson, M.D.

78%
65%
0%
10%
20%
30%
40%
50%
60%
70%
80%
90%
100%
2000 2001 2002 2003 2004 2005 2006 2007
State
Hawaii County
HP 2010
Mothers Receiving Prenatal Care in First Trimester
Chart: North Hawaii Outcomes Project - June 2008 Source: Department of Health - Office ofHealth Status Monitoring, 2000 - 2007
Healthy People 2010 Goal

Consequences of Inadequate Access
• Delayed Care & Increased suffering
• Higher ER utilization
• Higher hospital utilization
• Increased costs
• Less focus on Prevention- Life style
• Less recommended screening
• Poorer outcomes

Improving Population Health -- How?
Socioeconomic Determinants1.Economic Development
•Health sector: policy change & planning•Education/ Science sectors•Energy sector
Health-Related Behaviors1.Environmental AND Individual Strategies
•Smoking cessation, physical activity, improved access to fruits & vegetables
• Identifying and addressing problem drinking
Health Systems1.Primary Care Workforce Development
•Grow our own, Policy, Broader Team, Redesign care delivery, Engage community
Improved
Population
Health Outcomes

Consequences of Improved Access
• Timely Care & Decreased suffering• Lower ER utilization• Lower hospital utilization• Decreased costs• More focus on prevention & life style• More recommended screening• Better outcomes & Quality of Life• Improved productivity/business environment• Improved community wellbeing

Hawaii Island Healthcare Alliance• Island wide, voluntary, collaborative group of
stakeholders• Goal to improve health & health care in Hawaii County
by increasing healthcare workforce & financial sustainability of providers
• Endorses:– Growing own providers, – Broader primary care team– Collaboration to align policy efforts,
• Friends of the Future is 501(c )(3) Fiscal Agent


