Download - HEALTH AND OLD AGE PENSIONS IN RUSSIA

SOCIAL SECURITY, INCOME VOLATILITY AND HEALTH:
EVIDENCE FROM THE RUSSIAN PENSION CRISIS*
Robert T. Jensen
John F. Kennedy School of Government Harvard University
and National Bureau of Economic Research
Kaspar Richter
STICERD/London School of Economics and World Bank
Abstract: We explore whether health is vulnerable to income shocks, focusing on a recent crisis in Russia during
which many pensioners were not paid for an extended period of time. Using panel data spanning the
crisis, we find that among affected pensioners, poverty rates doubled, and the intake of calories and
protein and the use of health services and medications declined significantly. These pensioners were also
5 percent more likely to die in the two years following the crisis. However, households responded in ways
that mitigated the impact of the crisis, replacing one-fifth of lost pension income through increased labor
supply and asset sales.
JEL CLASSIFICATIONS: H55, I12, I38, J14. KEYWORDS: Insurance; Pensions/Social Security; Health/Mortality; Poverty; Elderly; Russia.
* [email protected]. We would like to thank Chris Avery, Clemens Grafe, Michael Greenstone, Alan Manning, Imran Rasul, Richard Zeckhauser, Elena Zotova and seminar participants at the NBER Aging Summer Institute, New Economic School, Moscow and Higher School of Economics, Moscow, for valuable discussions and comments. We also thank Laura Henderson for assistance with the data, and Elena Romanova for excellent research assistance. Jensen would also like to thank STICERD/LSE for graciously hosting him as a visitor.

1
1. INTRODUCTION
Throughout the world, households face income risks and volatility, for example due to job loss
and unemployment, or unanticipated health shocks. There has been a great deal of research on the ability
to smooth consumption in the face of income fluctuations, and the mechanisms through which this is
accomplished.1 However, there has been little research on the consequences, especially for health, of
imperfect consumption smoothing and incomplete insurance. Understanding the health consequences is
important not only because health is as important an indicator of well-being as consumption, but also
because of the potential for �vicious cycles,� wherein economic shocks leads to worse health, which in
turn lead to diminished earnings capacity or even another income shock, such as job loss.
Ironically, in many parts of the world, public social insurance programs themselves are
increasingly becoming sources of income volatility at the household level. For example, many countries
face concerns over the stability of their pension systems, especially due to population aging, system
financing or management. Further, there have recently been several cases of major pension crises (for
example, Argentina, China, Poland and Russia), resulting either in extended periods of non-payment of
benefits, or the erosion of entitlements to below subsistence levels. This instability can be expected to
directly affect the well-being of the elderly, who are typically highly dependent on pensions as their
largest, or only, source of income. In this paper, we focus on the welfare and health consequences of the
failure of the Russian pension system in 1996, and what strategies households employed in order to cope
with the loss of income.
Prior to 1996, Russia�s generous state pension system was fairly stable; pension fund revenues,
collected primarily through payroll taxes, were broadly sufficient to cover outlays. However, poor
economic performance, weakened tax enforcement and a wave of tax amnesties and exemptions leading
up to the Presidential elections in 1996 resulted in a sharp decline in payroll tax collection, compromising
the financial stability of the fund. As a result, approximately 14 million of the 39 million pensioners
underwent a sudden, prolonged period during which they did not receive any payments (�in arrears�).

2
Our interest focuses around two major themes. The first is whether the loss of the pension
adversely affected health. Given the great dependency of the elderly on the pension system, one might
expect that a pension failure would lead to worsened health, especially because of the diminished ability
to purchase the inputs into health (for example, nutrition, medication and the use of medical services). In
this spirit, our work adds to the growing literature concerned with the impacts of socioeconomic status on
health.2 An advantage over previous studies is that we exploit an exogenous income shock, so the
direction of causality is clear, and directly examine the use of specific health inputs which could lead to
changes in health outcomes. For Russia specifically, this study also provides an important link for
understanding the dramatic decline in health that followed economic transition and the subsequent
economic decline. Russia in the 1990�s experienced one of the largest peacetime (non-epidemic) declines
in health in human history (McKee 1998).3 This paper fills an important gap, because while the health
and economic crises have separately received considerable attention from researchers, the links between
the two are less well explored.
The second major theme we explore is the ability of households to respond to the loss of pension
income. When an economic shock causes a decline in income, there are a variety of strategies that
households can employ to maintain consumption, including changes in labor supply, adjustments to the
stock of savings, credit and borrowing, or relying on private cash transfers from family and friends.
The essence of the general empirical strategy is to compare the outcome variables of interest
(health and nutrition, labor supply, etc.) for households who were not paid their pensions with suitable
�control� or comparison groups of pensioner households that were. The strategy relies on two sources of
variation in the incidence of pension arrears to identify the effects. The first is created by the regionally-
decentralized structure of the pension system. Each of Russia�s 89 administrative regions or oblasts are
independently responsible for collecting taxes and making payments to pensioners. Since no given oblast
has an exact match between receipts and entitlements, the system relies on the redistribution of surplus
1 See Besley (1994) and Morduch (1998) for summaries of this literature. 2 For example, Fuchs 1993, Marmot 1994, McIntyre 1997, and Smith and Kington 1997.

3
revenues from regions with a high tax base relative to pension entitlements to those with a lower tax base.
When payroll tax collection declined for both �debtor� and �donor� regions, the fiscally weak regions had
lower revenues of their own and received reduced surpluses from the donors. Accordingly, while nearly
all pensioners in wealthier regions continued to be paid, between one-third and one-half of pensioners in
debtor regions experienced pension arrears. We also exploit variation within debtor regions created by
program rules which establish a system of priorities for which pensioners should be paid in the event of
revenue shortfall.
We use panel data from the Russian Longitudinal Monitoring Survey (RLMS), a nationally-
representative household survey of approximately 4,000 households, covering the period before and after
the pension crisis.4 The data are well-suited to the present purposes, containing detailed information on
income and expenditures. There is also a 24-hour food intake diary for all individuals, which when
matched with food-conversion formulae, provide measures of consumption of specific nutrients such as
calories and protein.
We find that the pension crisis had a large impact on living standards, with income declining by
over one-third for pensioner households, and poverty rates tripling to over 50 percent. There was also a
significant decline in the purchase of inputs into health; daily intake of both calories and protein declined
on average by 10 percent per person, and the use of medication and visits to doctors declined significantly
as well. Finally, male pensioners in arrears were 5 percent more likely to die in the two years following
the crisis, an increase in mortality risk comparable to being a smoker. These dramatic consequences arise
despite the fact that households were able to respond in ways that mitigated the impacts of the shock.
Households were able to replace on average approximately 20 percent of the lost pension income through
greater working hours, asset sales, and borrowing. They also reduced substantially their private transfers
to other individuals.
3 A special issue of World Development, November 1998 contains several articles on the health crisis. 4 The survey is coordinated by the Carolina Population Center at the University of North Carolina at Chapel Hill. Further description of the data can be found at www.cpc.unc.edu/projects/rlms/rlms_home.html

4
The remainder of the paper proceeds as follows. Section 2 discusses the Russian pension system
and describes the crisis of 1996. We devote significant attention to the structure of the system and causes
of the crisis, since they form an important part of the identification strategy for the empirical analysis.
Section 3 examines the impact of pension arrears on living standards and poverty. Section 4 discusses the
empirical strategy, identification issues and presents the results of the effects of the pension on health
inputs and outcomes. Section 5 tests for evidence of coping mechanisms, while section 6 concludes.
2. THE RUSSIAN PENSION SYSTEM AND THE CRISIS OF 1996
A. Details of the System5
Russia�s current old age pension system originates from the Soviet period, when it was part of a
comprehensive social insurance program (Barr 1992). Under the system, women over the age of 55 and
men over 60 receive a monthly cash transfer from the Pension Fund of Russia (PFR). Eligibility is not
affected by current employment status; as a result, prior to the crisis nearly 98 percent of individuals
simply age-qualified for the pension reported receiving one.
Pension levels are set at 55% of the average wage the individual earned during either the last two
years of employment, or any continuous working period of 60 months. However, benefits cannot fall
below the minimum wage nor exceed three times that value. The average benefit level in 1996 was 1,700
Ruble ($66 U.S.), which was just below the mean per capita household income among all Russians. By
statute, pension levels are also related to current earnings, but the means test is generous, and not widely
applied in practice. The RLMS data confirm these observations; in a regression of the level of pension
received, the coefficient on current non-pension income is small, positive, and not statistically significant.
Given the general unresponsiveness of benefit levels to current earnings and employment, the system
does not create the labor supply disincentives associated with many other social programs (aside from an
income effect).
5 This section describes the main features of the pension system up to 1996. The system has been partly reformed since that time (Denisova, Gorban and Yudaeva 1999).

5
In 1995, the Pension Fund had 38 million beneficiaries (26% of the population), with total outlays
amounting to 5.7% of GDP. The system is financed on a pay-as-you-go basis by a payroll tax amounting
to 29% of employee wages,6 operated and administered independent of any government budget. The
system is largely decentralized, consisting of one federal, 89 regional and 2,342 local departments.
Despite this decentralization, however, there is a uniform �vertical� structure throughout the regions.
Local pension offices collect payroll tax revenues from firms and pass them to accounts of the regional
pension fund. Social Welfare Offices (SWO�s) in the local pension districts draw funds directly from
these regional accounts to make payments to pensioners. Each regional pension department then transfers
to the central fund any surplus tax revenues beyond what is needed to meet entitlements in their region,
which the central fund then redistributes across regions. The funds obtained by the center from
approximately 15 �donor� regions, which have a large payroll tax base relative to pension entitlements,
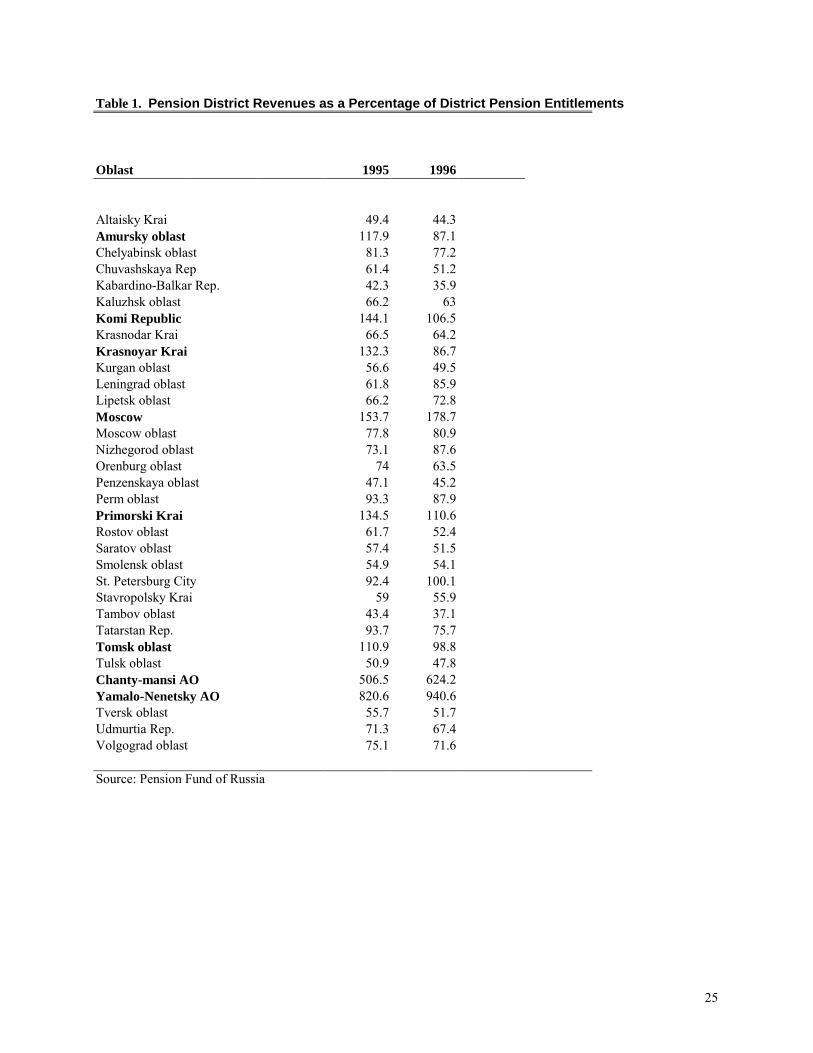
are redistributed in order to finance pension payments in 74 �debtor� regions. Column 1 of table 1 shows
PFR estimates of regional �self-sufficiency�, i.e., the ratio of payroll tax receipts to total benefit
entitlements, with donor regions characterized by ratios above 100. The data confirm that many districts
collect revenues far short of needs, while a few regions like Moscow City have surpluses.
B. The Arrears Crisis of 1996
Before 1996, Pension Fund revenues were just sufficient to meet entitlements, with no excess
funds to ensure future payments. In 1996, a significant funding crisis developed. The crisis was caused in
part by a sudden decline in economic output due to an uncertain political climate created by the
impending presidential election.7 Thus, there was a large reduction of the tax base, especially for the
payroll taxes financing the pension system. Payroll tax revenues also fell because of a series of tax
exemptions and amnesties throughout major sectors of the economy, also associated with the elections.
6 The statutory incidence is 28% on the employer, 1% on the employee. 7 Enterprises and investors were postponing decisions and waiting to observe the outcome of the elections in July. The uncertainty was caused in part by the poor performance of pro-government parties in parliamentary elections in December 1995. Also, polls showed President Yeltsin trailing his Communist opponent in the elections, including single-digit approval ratings.

6
Tax collection shortfalls were exacerbated by the emergence of non-monetary forms of settling tax
obligations,8 which could not be transferred across regions.
The decline in payroll tax revenues and use of non-monetary forms of tax settlement led to a
breakdown in the redistributive system from donor to debtor regions. Table 1 shows that between 1995
and 1996, pension offices in most regions experienced a decline in their tax revenues relative to
entitlements. Donor regions used their receipts to fund their own pension payments, and the residual sums
transferred for redistribution to other regions were insufficient to prevent sharp increases in pension
arrears in debtor regions. While there are no official data on pension arrears, press releases of the PFR in
the Moscow Times report national arrears of R14trn by December 1996. Lacking official statistics, the
RLMS can provide estimates of arrears at aggregated geographic levels. Table 2 reports the percent of
individuals who report being qualified for a pension but not receiving one. Overall arrears increased from
approximately 9 percent at the end of 1995 to 34 percent in 1996. Variation across the eight geographical
groupings is considerable. Not surprisingly, regions such as the Metropolitan area, which includes
primarily the donor districts of Moscow and St. Petersburg, had only minimal pension arrears, with very
little change between the two periods. However, all other areas had large increases, with between 28 and
55 percent of pensioners in arrears in 1996. These geographic aggregations also hide significant variation
at the regional level.9
C. Which Pensioners Went into Arrears?
When it became clear that revenues would fall short of the amount needed to make payments to
all pensioners, the central PFR adopted guidelines suggesting priority be given to first paying pensioners
with entitlements less than the minimum subsistence level, followed by non-working and single
pensioners, since these groups were perceived to be the �most vulnerable.� However, as the system is
decentralized, in addition to these two criteria some regions also chose to prioritize very old or disabled
pensioners. (Only one region, Orenburg oblast, made reduced payment to all pensioners, rather than
8 These included barter, payment in goods, and �veksel’ (Guriev and Ickes 1999). 9 Unfortunately, the RLMS sampling frame does not allow for inference at the regional level.

7
paying some pensioners in full and paying others nothing). Regional authorities typically applied pre-
crisis attributes in determining priority; thus it is unlikely that individuals engaged in behavior intended to
increase their likelihood of payment (i.e., changes in labor supply or marital status).
For the purposes of understanding pension arrears and their impact on well-being, it is important
to explore further the incidence of pension arrears across and within regions. Using the RLMS data, in
Table 3 we estimate probit regressions for the probability of pension receipt (among pensioners) in 1996
(marginal effects reported in the table).10 Column 1 begins by regressing pension receipt on the self-
sufficiency ratio in the oblast of residence. The effect is positive and statistically significant, confirming
that the arrears crisis was concentrated in areas with low pension fund revenues and dependence on
redistribution. In column 2 we add indicators for the various priority characteristics for payment during
the crisis. In accord with the rules suggested by the PFR, pensioners with the lowest pensions were 5
percent more likely to be paid and single pensioners were 10 percent more likely. The set of priority
criteria are jointly statistically significant, with an F-statistic of 12.84. In column 3, we add a set of
individual and household characteristics aside from the official priority criteria. We find little evidence
that they affect the probability of pension receipt, once the priority characteristics are controlled for. In
particular, pre-crisis, non-pension income is not statistically significant, consistent with a lack of means
testing in determining arrears.
In columns 4-6, we restrict the sample to only those pensioners living in debtor regions. Even
conditional on residing in a debtor region, the coefficient on the sufficiency ratio shows that being in a
region that is less dependent on redistribution makes it more likely that an individual was paid. The
priority variables are jointly significant, as lower pension benefits and being single made it more likely
that an individual was paid. And again, household characteristics other than the priority characteristics are
neither individually nor jointly significant. Overall, the regressions confirm that the collapse of the
redistributive system accounts for the incidence of pension arrears, and within debtor regions, specific
10 In the table, we use 1995 characteristics. Similar results obtain using �pre-crisis� characteristics.

8
indicators determined which pensioners were paid. Furthermore, household and individual characteristics
aside from the specified priority characteristics did not affect the probability of pension receipt.
3. THE IMPACT OF PENSION ARREARS ON INCOME AND POVERTY
The dramatic impact of the pension crisis on living standards can be seen in the bottom panel of
table 4. We split the RLMS pensioner-household sample into three groups: households that were in
arrears; all pensioner households not in arrears; and the subset of non-arrears pensioner households living
in debtor regions. The latter split is designed to reduce some of the heterogeneity among non-arrears
pensioners, by distinguishing those who live in wealthier regions. Poverty rates were high even before the
crisis, with over 20 percent of all three groups living below the poverty line.11 The share of total
expenditures devoted to food is very high, at nearly two-thirds. This budget share is itself often used as an
indicator of living standards, and in the present case also demonstrates that food consumption is likely to
suffer when households lose a large source of income like the pension.
Households are very dependent on the pension; in the pre-crisis year of 1995, across all three
groups of households the average income share of the pension was over 40 percent. Thus, not
surprisingly, the crisis had a large impact on household welfare. Household income declined on average
by 1,815 ruble (24 percent) for the arrears group, whereas the income of the other pensioner groups
increased slightly. The poverty rate increased to over 50% among pensioner households in arrears, and
dropped among non-arrears households. Figure 1 provides nonparametric (kernel) density estimates for
(log) income per capita for the arrears and non-arrears (debtor and donor regions combined) pensioner
households. The right-hand graphs present the differences between the estimated densities. The vertical
line represents the (log) poverty line. Overall, we see that pension arrears caused a large shift of mass in
the income density, especially from around the middle of the pre-crisis distribution into the lower end.
11 We use the official poverty line of the Russian Federation, adjusted for regional price differences. It was developed by pricing a food basket constructed on the basis of nutritional criteria, with food shares in overall expenditures separately estimated for each age-gender group. Thus, poverty lines vary by demographic composition

9
Arrears lead to a large reduction in households just above the poverty line and a large increase in the
percentage below that line. There is also a large increase in the dispersion of incomes, since prior to the
crisis pensions accounted for a large fraction of total household income, and there was not a great deal of
variation in pension levels. The estimated density for the non-arrears group changed only slightly over
this period, with more mass in the density significantly above the poverty line and less just above and just
below the line.
4. THE IMPACT OF THE PENSION CRISIS ON HEALTH
Aside from material living standards, one particular concern with the loss of income is whether it
leads to reductions in health. Following a standard �demand for health� framework (as inspired by
Grossman 1972a, b), reduced income may lead to reduced purchases of all goods, including health (or the
inputs into health). Rather than explicitly modeling the production process, we first trace changes in the
use of health inputs (daily intake of calories and protein, and use of medical services and medicines), and
then examine the reduced-form effects of pension loss on health outcomes (mortality).
A. Estimation Strategy and Identification
We compare changes in the various health-related variables (inputs and outcomes) for the group
of pensioners who went into arrears relative to those who continued to be paid. In doing so, we rely on the
variation in pension arrears across regions (created by the decentralized funding structure) and within
regions (created by the pension priority criteria). In order to isolate the impact of the loss of income on the
health measures, the identifying assumption is that in the absence of the crisis, the arrears and non-arrears
groups would not have experienced differential change with regard to the variables of interest, and that
aside from the pension nothing else that could affect health changed differentially for these two groups.
Momentarily deferring discussion of this assumption, table 5 presents the essence of the basic strategy. In
this table, we present the average daily caloric intake for men living in arrears and non-arrears pension
households. All individuals completed a personal, 24-hour individual recall of food intake, which was
and regional location. Further analyses of poverty in the Russian Federation can be found in Mroz and Popkin

10
then converted into calorie and protein intake by researchers at UNC using standard food-calorie
conversion charts Using the panel element of the data, households are categorized by whether they were
in arrears in 1996; so for instance the data for the �arrears group� in 1995 is average daily caloric intake in
1995 among men living in households that received a pension that year but were in arrears in 1996.
Focusing on panel A, we see that prior to the crisis, individuals living in households that would
later go into arrears consumed on average 80 more calories per day than individuals who continued to be
paid in both periods. However, there is a striking change in 1996, where average daily caloric intake of
the arrears group declines by 243 calories. The non-arrears households declined as well, but only by 22
calories. There could be a common factor that lead to some of the decline for both groups, such as the
normal declining needs with age, relative price changes, or expectations.12 Overall, the arrears group
declined by 221 calories more per day than the non-arrears group, 10 percent of the original intake, which
is our estimate of the impact of the loss of pension income, under the identifying assumption.
More detail on the changes in caloric intake can be seen by examining the distributions of caloric
intake rather than just the means. Figure 2 shows kernel estimates of the density of (log) caloric intake
for the arrears and non-arrears groups before and after the crisis. The diagrams in the second column
show the differences in the estimated densities, and the figure in the third column shows the difference in
the differences. These figures demonstrate that there was an extremely large change in the distribution of
caloric intake for the arrears group, with a large shift in mass from the middle and upper part of the pre-
crisis distribution to the lower part. The vertical line represents the recommended (log) 2,000 calories per
day. While exact caloric requirements vary across individuals by gender, age and level of physical
activity, we can see that for any threshold around 2,000 calories, there is a substantial increase in the
(1995), Klugman and Braithwaite (1998) and Lokshin and Popkin (1999). 12 It may also be the case that the control group reduced their caloric intake, in anticipation of the that the pension crisis might soon affect them. The survey asked two questions about expectations more generally, namely whether they expect their financial situation to get better or worse in the next 12 months (1 to 5 scale), and whether they anticipate having difficulties in having enough money to meet basic needs in the next 12 months (1 to 5). While many non-arrears pensioners felt things would get worse, equally as many felt the same way in the year prior to the crisis. Thus, if reported expectations are useful indicators, any adjustment in response to these expectations were the same before and after the crisis.

11
fraction of individuals in the arrears group not meeting that requirement after the crisis, with a much
smaller change for the non-arrears group. The differential change for the two groups is large and striking.
In order to control for differences in other covariates relevant to health, below we estimate
�treatment-effects� regressions of the form,13
(1) ititit uXArrArrh +β+α+α+α+α= *1996***1996* 3210
( )1996,1995=t , ( ).,..,1 Ni =
where hit is the health-related variable of interest, Arr is an indicator for whether a pensioner was in
arrears, 1996 indicates the observation is from after the crisis, and X is a vector of individual and
household characteristics thought to affect the health measure. The effect of arrears is captured by the
interaction term α3. For health-related variables, we use daily intake of calories and protein, two of the
most important nutrients (especially for the elderly);14 whether the person was currently taking medication
(conditional on having a chronic condition prior to the crisis); whether the individual visited a doctor in
the pervious month for a check-up; and whether the individual died by the time of a follow-up survey two
years after the crisis.
We restrict our sample to households containing pensioners, and in order to isolate the impact of
the pension crisis in 1996, we drop households that incurred pension arrears in 1995 (though there were
few of them, and their exclusion does not affect the results appreciably). The sample includes all
individuals living in households with a pensioner in order to capture the effects of arrears on the entire
household. We also perform the regressions separately for various age and gender groups rather than
assuming the mean effect is the same across all individuals.
13 An alternative estimation strategy would be to regress changes in the outcome variables on changes in pension receipt, or to add individual fixed-effects (or fixed-effects interacted with the other independent variables) directly to the treatment-effects regression (1). Both of these alternative approaches would control for individual-specific fixed effects, observable and unobservable. Results for these alternate specifications are also reported below, but are nearly identical, so for the purposes of exposition and facilitating discussion of the identifying assumption, we use this treatment-effects framework. 14 Ex., protein deficiency can lead to muscle wasting, oedema and anemia (Ahmed 1992, Blumberg 1997).

12
B. The Identifying Assumption
Our primary interest is in isolating the effects of the loss of pension income on nutritional status
and health. By comparing the change in caloric intake for arrears pensioners relative to non-arrears
pensioners, we are controlling for economy-wide changes (declines in the health system, pollution and the
quality of environment, price changes or other macroeconomic shocks) that affected all individuals, or all
individuals living with pensioners. However, we know that assignment of arrears is correlated with living
in a debtor region and having certain attributes, such as a higher pre-crisis pension level, having a job, or
being married. A key part of the identifying assumption is that the factors determining the assignment of
arrears should not in themselves be correlated with changes in the outcomes of interest, so that that in the
absence of the crisis, the arrears and non-arrears groups would not have changed differentially.
The first concern is whether other factors changed for debtor regions that would have an
independent effect on the health variables, especially changes in economic conditions or the health
system. To treat this issue, in panel B of table 5 we restrict the sample of non-arrears pensioners to only
those living in debtor regions. Relative to the full control group, the initial level of caloric intake of this
group is closer to the arrears pensioner group. However, the decline in caloric intake is nearly identical
for both control groups, and the overall differential change between treatment and control groups is very
similar, supportive of the identifying assumption.
We can also explore whether, within debtor regions, the characteristics associated with going into
pension arrears are on their own correlated with declining caloric intake.15 We use probit estimates of the
determinants of pension arrears for individuals living in debtor regions (as in table 3) to fit the
probabilities of arrears among pensioners living in donor regions. Thus, one way to view this exercise is
that if there was concern that assignment of pension arrears was correlated with characteristics which
would have lead to a greater decline in caloric intake even without the loss of the pension, then even in
donor regions we should see the same relative decline in caloric intake among those pensioners with

13
similar characteristics as the arrears group. Panel C of table 5 shows that there was no such relative
decline in donor regions for individuals with high and low probability of arrears, again supportive of the
identifying assumption.16
While it is not possible to observe the true counterfactual, i.e, what would have happened in the
absence of the crisis, we can merge the 1995-96 panel data with data from an earlier round of the survey
(collected one year before the data used above) to provide a composite �pre-test� of the identifying
assumption that in the absence of the arrears crisis the paths of caloric intake would have been �parallel�
for the various groups.17 Figure 3 reveals that the paths of changes were very similar for the 3 groups in
the pre-crisis rounds. Just as striking is the magnitude of the drop for the arrears group following the
crisis, which seems out of line with previous changes, and makes it more convincing that the pension
crisis caused the decline in caloric intake.
One aspect of the identifying assumption which remains is that there may have been other factors
within debtor regions that changed differentially for arrears and non-arrears households. The most natural
candidate is whether additional social spending or assistance was also lost to arrears individuals, or
whether arrears households were targeted for additional benefits or programs. While records from the
social welfare offices do not show any evidence of such changes,18 we can also approach the issue using
the RLMS. Table 6 reports whether households received any transfers or benefits from the government
(cash transfers, fuel or apartment benefits, or subsidized medication or visits to the doctor) or private
charities. The likelihood of receiving the various benefits was fairly similar for arrears and non-arrears
pensioner households in both periods. The only program with a large percentage of participants and
15 Of course, households that went into arrears were chosen because they were seen to be more robust and less vulnerable (higher pension, employed, married) and thus we might expect that this group would have had a smaller decline in caloric intake had the crisis not occurred, and our estimates would be understated. 16 The fact that there was no relative decline for the high arrears probability group also suggests that our earlier results are not likely to be significantly understated as suggested in the previous footnote. 17 The RLMS was carried out for 5 rounds prior to the two used here. Unfortunately, the earlier rounds constituted a panel in the sense that the same physical dwellings were re-visited, rather than families or individuals. It was only in the 1995 and 1996 rounds that individuals and families were followed. Thus, attrition from a �true panel� is great in the early rounds, and change of residence is likely to be non-random.

14
moderate change over this period was the public payment of medical insurance premiums. However, the
increase was the same for all pensioner groups. Overall, there is no evidence that there were any
differential changes in other programs that could explain our results.
A final concern for inference is whether individuals changed residence in response to the arrears
problem, in particular relocating from high- to low-arrears pension regions in order to receive payments.
However, official statistics reveal that mobility is extremely low (Chudinovskikh 1998), especially due to
a number of substantial administrative, legal, economic and practical impediments.19 And to the extent
that movement occurred at all, official or unofficial, it would not have enabled pensioners to increase their
likelihood of receiving a pension, since payment is tied to original region of residence. Thus, selective
migration is not an important concern for the empirical analysis, nor an important strategy for coping with
the crisis.
C. Regression Results
Table 4, used earlier, presents summary statistics for the sample. The most notable differences
across groups are consistent with the payment priority rules, namely that arrears households are larger on
average, more likely to have a working pensioner, and have higher pre-crisis benefit levels. Despite the
regional differences and variation within regions in who was paid, arrears and non-arrears pensioners and
their households are fairly similar along most other dimensions. Education levels are slightly lower for the
arrears pensioners, even relative to other pensioners within debtor regions. Only 11 percent of pensioner
households have only one member, while an additional 20 percent are households containing only
pensioners. The large household size may work to the advantage of the elderly if younger household
18 There were some small-scale programs targeted more generally towards all pensioners, regardless of arrears status, in some regions. However, most were implemented after the time of our survey, and provided only modest benefits, for example free transportation on city buses and trains. 19 There are several reasons for lack of mobility. First, housing poses a substantial impediment; many pensioners live in housing belonging to their past or current employer, or in housing they own as a result of privatization. In either case, housing is often tied to the region of residence. And aside from the direct costs, there is a shortage of housing in major metropolitan (low-arrears) areas. Second, low-arrears regions like Moscow restrict migration through an official registration system. While some individuals may move illegally, without legal residence they would not be able to collect pensions; in fact, the greater distance from home might jeopardize payment of the pension at the original residence. Additionally, individuals may receive in-kind benefits (aside from housing) from

15
members are able to contribute more to the household when the pension income declines (akin to the
�added worker� effect).
Table 7 shows the regression results for caloric intake of men. Column 1 mirrors the strategy in
panel A of table 5 and regression equation (1), using the total sample of pensioners, and includes as
explanatory variables the individual�s age, education and employment status, as well as household
demographic characteristics. Pension arrears were associated on average with a reduced caloric intake of
239 calories for the arrears group relative to the control group, again representing approximately 10
percent of the pre-crisis intake. The estimate is very close to the tabular results in the previous section,
suggesting that the assignment of pension arrears was uncorrelated with other characteristics of the
household which might affect caloric intake. The decline in caloric intake is large from a nutritional
perspective. Such a daily reduction of caloric intake would result in weight loss of two pounds per month.
Column 2 adds non-pension income as a regressor, excluded from the original regression because
of concerns over endogeneity. As would be expected, higher non-pension income is correlated with
higher caloric intake. However, inclusion of this income has little effect on the coefficient on pension
arrears. In an additional specification, instrumenting for income using various demographic
characteristics of the household head, and occupation and industry if employed, yields similar results.20
Column 3 adds an indicator for whether anyone in the household was in arrears on wage
payments from their employers. Since economic transition in 1992, Russian firms have frequently
experienced difficulties in paying wages, leaving workers in arrears on wage payments. For our analysis,
there may be concern that wage arrears are more likely to occur in areas with high pension arrears (since
firms that had difficulties paying wages are likely to also have had difficulty paying payroll taxes).
Therefore we include an indicator for whether any workers in the household were not paid wages in the
previous month (we also included a �stock of arrears� variable, the total amount of wages owed, with
similar results). As expected, wage arrears themselves are associated with a substantially reduced caloric
their past employer. These benefits could also be lost with a change of residence. Finally, the worsening of the pension crisis was too sudden to have led to widespread pensioner migration, at least at the time of the survey.

16
intake, nearly three-quarters as large as for the pension. However, the effect of pension arrears is
unchanged. Finally, column 4 performs regressions where the change in caloric intake is regressed on
whether the individual went into pension arrears between 1995 and 1996, and changes in all other
individual and household characteristics. This specification has the advantage of eliminating
unobservable, fixed differences. The results are nearly identical to the treatment-effects regressions in
columns 1 to 3.
Columns 5 through 8 present the same regressions, where the sample is restricted to households
in debtor regions. The estimated treatment effects, and nearly all the other coefficients, are largely
unchanged using this restricted control group, consistent with the tabular results earlier and with the
conclusion that region-specific shocks or changes did not cause the sharp change in caloric intake for the
pension arrears group. In alternate specifications, we estimated separate regressions for urban and rural
households, with similar results.
Overall, the estimated effects for men�s caloric intake are extremely robust across specifications
and control groups. Therefore, for the remainder of the results, we apply only the specification in column
3, which includes income and wage arrears. Table 8 presents the estimated effects of the pension (α3 in
the regression above; full results available from the authors) on the other health-input variables of interest.
The impacts of the crisis are smaller for women than men, with pension arrears associated with a decline
of 163 calories on average. However, average male caloric intake is around 2100, whereas for women it
is around 1800, so as a percentage of original intake, the results are fairly similar. For both men and
women, daily intake of protein declines by about 4 to 5 grams per person. These declines represent a
reduction of around 5 to 10 percent of the original levels. The recommended daily intake of protein is
about 1 gram per kilogram of weight, or a US RDA of about 65 to 70 grams for men and 50 for women.
Following the crisis, the rate of protein deficiency among arrears pensioners increased by 7 percentage
points for men and 4 percentage points for women, while the rate among non-arrears pensioners were
largely unchanged.
20 The instruments have adequate predictive power in the first stage regression (F-statistic of 28.4)

17
The bottom three rows of the table show that the use of medical services was also slightly
reduced for the arrears households relative to the non-arrears households. While Russia has a national
health system, at the time of the crisis most visits, consultations, and medication involved at least some
small fee. For the use of medication, we focus on individuals with chronic health conditions (heart attack,
stroke, diabetes) who were taking medication prior to the crisis. We find that men and women were 4 to 5
percent less likely to report taking medications after the crisis, though the effect is only statistically
significant for men. Since these conditions are chronic, and the decline in income would not be expected
to improve them, this result suggests that the loss of income causes some individuals to forgo medications
they would otherwise use. Regarding preventative care, we find that pension arrears decreased the
likelihood of seeing a doctor for a check-up or physical within the past year by around 5 percent for men,
with little change for women. Finally, among those individuals who visited a doctor in the previous
month, arrears pensioners were more likely to go to a public facility, where the fees are lower, rather than
a private doctor. While there is no available research on quality differentials between public and private
doctors, the common perception is that the latter are dramatically preferred; the observed switch to the
former is another form of adjustment in the face of lost pension income.
C. Mortality
The decline in nutrition and use of health services and medication could lead to worsened health
and increased mortality rates, especially among the elderly. While we are unable to untangle the specific
contributions of these various factors, we investigate in reduced-form whether the crisis lead to an
increase in mortality rates, merging the 1995-96 panel with RLMS data collected 2 years after the arrears
crisis. Table 9 presents results from probit regressions in which the dependent variable is whether the
individual died in those two years. We restrict the sample to individuals aged 50 or older. Aside from an
indicator for pension arrears, as additional regressors we include age and indicators for various mortality
risk factors (obesity,21 whether an individual smokes, the number of years the person has smoked, and
alcohol consumption) and potentially undiagnosed health problems (whether the person had chest pains,

18
and chest pains lasting longer than 30 minutes) in 1996. These factors represent long-term, chronic risk
and health factors likely to affect the probability of dying, but the presence of which in 1996 is unlikely to
have already been caused by the pension. Finally, to account for possibly unmeasured health conditions,
we include an index of physical limitations. This index ranges between 0 and 8, with one point for each
activity (for example, walking 1 kilometer, or climbing a flight of stairs) the individual is either unable to
perform, or can only perform with great difficulty.22
Pension arrears increased the likelihood that the individual died within the next two years by
nearly 6 percent for men an effect comparable to being a smoker. For women, the effect is smaller, and
not statistically significant. This result is consistent with the finding that women do not reduce as much
the use of medicines or health services when they lose their pension, and also supports other research
which finds that mortality rates increased more dramatically for men than women in Russia, despite
exposure to similar health risks (Shkolnikov et al. 1998). The signs of most of the predictors of mortality
are in accord with expectations, though few are statistically significant. The ADL index, smoking and
years smoked (for men) are all correlated with an increased likelihood of mortality. Since mortality may
be correlated with attributes which determine pension arrears, in alternate regressions (not shown), we
compare mortality rates for pensioners in donor regions who would have high and low probability of
being arrears if they lived in debtor regions; we find no significant difference in the likelihood of death.
5. COPING STRATEGIES
As stated earlier, there are several ways households may respond to counteract the adverse effects
of an income shock, for example changes by adjusting labor supply, savings or assets, or through private
transfers from family or friends. Beyond their importance for understanding how households cope with
21 Individuals are defined as obese if their Body Mass Index (weight divided by height squared) is >30. 22 The index ranges from 0 to 8, with one added for every activity of daily living (ADL) which the respondent indicates they either cannot do, or can do but only with difficulty (possible responses were 1 to 5; 1. Not at all difficult; 2. Slightly difficult; 3. Somewhat difficult; 4. Very difficult, but possible; 5. Cannot do it). Activities were: walk across a room; walk 200 meters; walk 1 kilometer; run 1 kilometer; sit for 2 hours; stand up after sitting; lie down and get up from a bed unassisted; climb one flight of stairs; climb several flights of stairs; lift and carry a weight of about 5 kilograms; squat, crouch or kneel.

19
income shocks, the magnitude of such private behavioral responses is important for the design and reform
of social programs. If public programs largely �crowd out� private support activities, the net value of
public safety nets and programs is reduced (see Jensen 2000).
Table 10 explores the various mechanisms households may use to cope. We present both mean
values for the variables of interest, as well as coefficients from treatment-effects regressions similar to
those above, where we control for other household and individual characteristics; in almost all cases, the
regression results mimic the changes in means, so we only discuss the latter.
Labor Supply
Following the standard labor supply model where an individual has preferences over consumption
and leisure, we would predict that a decline in income should lead to a decrease in the demand for leisure,
and thus an increase in labor supply. Since the assignment of pension arrears was based on pre-crisis
characteristics, and since we saw earlier that there is effectively no means test, there should be no
negative work incentives created by the pension. And provided that household members share income in
any way, the decline in pension income could affect the labor supply of non-pensioners living with
pensioners as well as the pensioners themselves. Table 10 reveals that in both periods a slightly greater
percent of households in arrears have an individual employed, where we include both formal and informal
sector employment. However, there was little change in employment rates for either group, indicating that
the households who went into arrears did not compensate by getting jobs. However, this may have been
due to the inability to obtain employment, rather than the desire to work. Employment rates were in
general declining during this period, and in this context re-entry into the labor market may not have been
feasible.23 However, consistent with expectations, conditional on having a job before the crisis, total
household labor supply (in all activities, by all members) increased by almost 6 hours per week more for
arrears households relative to non-arrears households. The result was a relative increase in monthly wages
of 250 rubles for pension arrears households, representing over 10 percent of the average lost pension

20
income. The magnitude of the response is even more striking since this is the effect for all households; the
average household with a worker actually increased wage earnings by 350 ruble (16 percent of lost
pension income), while the 35 percent of households without a worker had no adjustment.
Savings, Wealth and Borrowing
When faced with an income shock, the permanent income and life-cycle theories of consumption
both predict that households should spend out of savings, or if they have no savings, should borrow on
credit markets. How much they obtain through either source will of course depend on whether the shock
is viewed as transitory or permanent. For a transitory negative shock, households should dissave/borrow
enough to bring current consumption up to permanent income, which will be the old permanent income
minus the income shock divided by the number of expected periods of life remaining. For a permanent
shock, the household revises downward the estimate of permanent income to a greater extent, and thus
dissaves /borrows the difference between this new, lower threshold and current income. Thus, shocks
perceived to be permanent should be met with a smaller reduction in savings than transitory shocks.
There are numerous difficulties in measuring a household�s stock of wealth. Wealth can take many
forms; in Russia, very few households keep money in banks because of years of high inflation and
concern for bank failures. Further, financial markets were still young at this time, and inaccessible to most
households. Many Russians thus hold U.S. dollars, durable goods, jewelry, and housing as wealth. The
lack of savings instruments and investment opportunities may have exacerbated the impact of the crisis,
as most wealth was fairly illiquid, and the elderly had few options for saving or financing their retirement.
Households in the survey were asked to report sales of durable goods, and assets such as jewelry,
currency, bonds, stocks, and other financial assets. Table 10 reveals that the percentage of households
engaging in sales of these assets increased dramatically for the arrears group, from 8.5 percent before the
crisis to 16 percent after the crisis, with little change for the non-arrears group. In regressions, the result is
statistically significant, indicating that households who went into arrears were significantly more likely to
23 The survey asked individuals whether they are looking for work. There was a slightly larger increase in the percentage looking for work for those who went into arrears. However, looking for work itself reflects perceptions

21
engage in asset sales. The total income generated from these sales increased by approximately 350 ruble
between 1995 and 1996, though the increase relative to the non-arrears group was 192 ruble. While
expectations are difficult to measure, in the period following the crisis nearly 60 percent of pensioners in
arrears report that they do not expect things to get better in the next 12 months, suggesting a belief that
the shock was more permanent. Households responded to the perception of the permanence of the shock
in ways that are broadly consistent with the life-cycle model; asset sales by those arrears pensioners who
perceive the shock to be permanent (think things will either stay the same as at present or get worse in the
next 12 months) are less frequent and in smaller amounts on average than those who expect things to
improve (results available from the authors). The latter group increased asset sales by 500 rubles,
compared to 150 rubles for the former.
Households also engaged in significant borrowing (mostly from family, friends and neighbors,
rather than formal credit markets) in response to arrears. The percentage of households in arrears who
borrowed money in the previous month increased from 12 percent to 19 percent, while there was little
change for the non-arrears group. The average sale value also increased, though the increase relative to
the non-arrears group is not statistically significant.
Private transfers
Private transfers from family and friends, aside from loans, are another common mechanism
through which households may cope with income shocks. Altruistically-linked households, where non-
coresident members have utility functions that contain the consumption of the other members, should
share income (see for example Becker 1974). Briefly, if an individual i is utility interdependent with
another individual -i, as in )](,)([),( CVCVUCCU iiiiiiii −−− = , the first-order conditions for utility
maximization require that the (weighted) marginal utilities of consumption of the two parties be equal.
This in turn will imply that a decline in income of one party should be met with increases in transfers
that employment is available, as in the �discouraged worker� effect.

22
received from the other, or reduced transfers sent to others. Several authors have explored the relationship
between household income and the level of private transfers received.24
Table 10 reveals that private transfers are extremely widespread in Russia, with 30 to 40 percent
of households with pensioners either sending, receiving or both. More than twice as many households
with pensioners sent remittances as received. Over this time period the incidence of receipt of private
transfers increased among all pensioners, with no differential improvement for the arrears pensioners in
terms of receipt or levels. However, pension arrears households reduced their private transfers to other
households much more dramatically than non-arrears households. Almost one-third fewer arrears
households sent transfers after the crisis relative to before the crisis, (compared to a 15 percent reduction
among non-arrears pernsioners), and the amount sent conditional on sending was 125 less relative to the
non-arrears group, accounting for 5 percent of the lost pension income for those households that sent
remittances. This suggests not only that individuals do share income even when not coresident, but also
that the effects of the pension crisis would be felt outside of pension households, since pensioners were
previously supporting others elsewhere.
6. DISCUSSION AND CONCLUSION
This paper has shown that Russia�s financially unstable pension system, characterized by
irregular payments and adjustments in pension levels, can take a large toll on the financial and physical
well-being of the elderly and their dependents. There are important implications for the numerous
countries where pension systems are proving increasingly unstable. In cases where reform of the
retirement pension system become necessary, it will be important to pay attention to ensuring that
households are able to cope during the transition phase, including efforts to identify and design alternate
safety nets for the most vulnerable households. While there were significant adverse consequences of
24 Altonji, Hayashi and Kotlikoff 1992, 1997, Cox 1987, Cox and Jimenez 1990, Jensen 2000. Using RLMS data from before the crisis, Cox, Eser and Jimenez (1997) find that private transfers are widespread, but that private transfer levels monotonically decline with age. They note that this may be due to the fact that at the time pensioners were among the better-off groups in Russia. They simulate that a one ruble loss of income such as from pension elimination could result in an increase in private transfers of .23 ruble.

23
pension loss, households responded to the income shock in rational ways that are consistent with
economic theory. Between increased hours of work and sale of assets, households replaced on average
almost 20 percent of the lost pension income. In the absence of such adjustments, the impacts on health
most likely would have been worse. However, households where the pensioner is not able to work, or
where there are no other co-resident members who can work, and where there are few assets, are likely to
be hurt more by the loss of an income source. In the longer run, households may be better able to cope
because they have more time to identify potential responses and adjust, or they may be worse-off because
some coping strategies soon become strained themselves (ex. assets and savings eliminated). Institutions
which enable individuals to smooth consumption and self-insure, such as secure financial instruments,
could prove valuable for assisting households in coping with economic shocks.

24
References: Ahmed, FE (1992). �Effect of Nutrition on the Health of the Elderly,� Journal of the American Dietetic
Association, 92(9), p. 1102-8. Altonji, Joseph, Fumio Hayashi and Lawrence J. Kotlikoff (1992). �Is the Extended Family Altruistically Linked?
Direct Tests Using Micro Data,� American Economic Review, 82(5), p.1177-1198. --, -- and -- (1997), �Parental Altruism and Intervivos Transfers: Theory and Evidence,� Journal of Political
Economy, 105 (6), p. 1121-1166.. Barr, Nicholas (1992). Income Transfers and the Social Safety Net in Russia. Washington D.C.: World Bank. Becker, Gary S. (1974). �A Theory of Social Interactions,� Journal of Political Economy 82, p. 1063-94. Blumberg, J. (1997). �Nutritional Needs of Seniors,� Journal of the American College of Nutrition, 16(6), p. 517-
23. Case, Anne and Angus Deaton (1999) "Large cash transfers to the elderly in South Africa," Economic Journal
108(450), p. 1330-61. Cox, Donald (1987). �Motives for Private Income Transfers,� Journal of Political Economy 95(3) p. 508-46. -- and Emmanuel Jimenez (1990), "Achieving Social Objectives Through Private Transfers: A Review,� World
Bank Research Observer 5(2), p. 205-218. --, -- and Zekeriya Eser, and -- (1997). �Family Safety Nets During Economic Transition,� in Klugman, Jeni, ed.,
Poverty in Russia: Public Policy and Private Responses, The World Bank, Washington, D.C. Denisova, Irina, Maria Gorban and Ksenia Yudaeva (1999). �Social Policy in Russia: Pension Fund,� Russian
Economic Trends. Fuchs, Victor (1993). �Poverty and Health: Asking the Right Questions,� in Rogers, David and Eli Ginzburg, eds.,
Medical Care and the Health of the Poor, Westview Press, Boulder, Colorado. Grossman, M (1972a). The Demand For Health: A Theoretical and Empirical Investigation. National Bureau of
Economic Research, New York. -- (1972b). �On the Concept of Health Capital and the Demand for Health,� Journal of Political Economy, 80, p.
223-255. Guriev, Sergei and Barry Ickes (1999). �Barter in Russian Enterprises: Myths vs. Empirical Evidence,� Russian
Economic Trends. Jensen, Robert T. (2000). �Do Public Transfers Displace the Benefits of Private Transfers? Evidence from South
Africa,� mimeo, John F. Kennedy School of Government, Harvard University. Klugman, Jeni and Jeanine Braithwaite (1998). �Poverty in Russia During the Transition: An Overview,� World
Bank Research Observer, 13(1), p. 37-58. Kolesnik, A. (1995). �State Pension Insurance Finance Management,� Economics and Life, 33. Lokshin, Michael and Barry Popkin (1999). �The Emerging Underclass in the Russian Federation: Income
Dynamics, 1992-1996,� Economic Development and Cultural Change, p. 803-829. McIntyre, Sally (1997). �The Black Report and Beyond: What are the Issues?” Social Science and Medicine, 44, p.
723-45. Marmot, Michael G. (1994). �Social Differences in Health Within and Between Populations,� Daedalus, 123, p.
197-216. Mroz, Thomas and Barry Popkin (1995). �Poverty and the Economic Transition in the Russian Federation,�
Economic Development and Cultural Change, p.1-31. Richter, Kaspar (1999). �Government Cash Transfers and Household Consumption,� mimeo, London School of
Economics. Smith, James P. and Raynard Kington (1997). �Demographic and Economic Correlates of Health in Old Age,�
Demography, 34(1), p. 159-170.
25
Table 1. Pension District Revenues as a Percentage of District Pension Entitlements
Oblast 1995 1996
Altaisky Krai 49.4 44.3 Amursky oblast 117.9 87.1 Chelyabinsk oblast 81.3 77.2 Chuvashskaya Rep 61.4 51.2 Kabardino-Balkar Rep. 42.3 35.9 Kaluzhsk oblast 66.2 63 Komi Republic 144.1 106.5 Krasnodar Krai 66.5 64.2 Krasnoyar Krai 132.3 86.7 Kurgan oblast 56.6 49.5 Leningrad oblast 61.8 85.9 Lipetsk oblast 66.2 72.8 Moscow 153.7 178.7 Moscow oblast 77.8 80.9 Nizhegorod oblast 73.1 87.6 Orenburg oblast 74 63.5 Penzenskaya oblast 47.1 45.2 Perm oblast 93.3 87.9 Primorski Krai 134.5 110.6 Rostov oblast 61.7 52.4 Saratov oblast 57.4 51.5 Smolensk oblast 54.9 54.1 St. Petersburg City 92.4 100.1 Stavropolsky Krai 59 55.9 Tambov oblast 43.4 37.1 Tatarstan Rep. 93.7 75.7 Tomsk oblast 110.9 98.8 Tulsk oblast 50.9 47.8 Chanty-mansi AO 506.5 624.2 Yamalo-Nenetsky AO 820.6 940.6 Tversk oblast 55.7 51.7 Udmurtia Rep. 71.3 67.4 Volgograd oblast 75.1 71.6 Source: Pension Fund of Russia

26
Table 2: Regional Incidence of Pension Arrears (% of pensioners who reported not receiving their pension)
1995 1996 Overall
9 34
Geographic Regions Metropolitan 6 4
Northern and North Western 6 28
Central and Central Black-Earth 9 29
Volga-Vaytski and Volga Basin 8 38
North Caucasian 13 55
Ural 9 31
Western Siberian 20 45
Eastern Siberian and Far Eastern 1 30

27
Table 3: Determinants of Pension Receipt in 1996
FULL PENSIONER GROUP DEBTOR REGIONS ONLY (1) (2) (3) (4) (5) (6) Marginal
Effect
t-stats Marginal
Effect
t-stats Marginal
Effect
t-stats Marginal
Effect
t-stats Marginal
Effect
t-stats Marginal
Effect
t-stats Local/ Regional Characteristics
Sufficiency Ratio 0.0021 5.3 .003 10.68 0.0021 5.31 0.0077 9.16 .0077 9.9 0.0082 9.43
Payment Priority Low pre-crisis pension .054 1.21 0.067 1.86 .095 1.7 0.13 2.24 Single .097 2.82 0.093 1.96 .099 2.35 0.076 1.71 Elderly .053 .68 0.062 0.08 .24 1.9 0.20 1.57 Working -.033 -.92 -0.022 -0.59 -.067 1.5 -0.068 -1.48 Disabled .127 1.35 0.115 1.19 .023 .13 0.011 0.06
Individual and Household Characteristics
Income w/o Pensions 2.3E-06 1.11 4.0E-07 1.40 Household Size -0.0119 -1.07 -0.0072 -0.52 # of Children 0 - 16 0.0118 0.49 -0.015 -0.5 Male 0.0247 1.15 0.044 1.43 Years of Education 0.003 1.25 0.0029 0.96
F-test Rules 12.84 8.46 15.66 13.5 Log Likelihood -1146 -1170 -1139 -955 -1002 -938 Number of Obs. 2066 2066 2066 1627 1627 1627
Source: RLMS. Probit regressions, with marginal effects reported.

28
Table 4: Summary Statistics of Members of Pensioner Households by Pension Arrears Status
Pension Arrears Non-Arrears Pensioners Non-Arrears Pensioners, Debtor Regions Only (1) (2) (3) (4) (5) (6) 1995 1996 1995 1996 1995 1996 Mean SE Mean SE Mean SE Mean SE Mean SE Mean SE
Individual Characteristics
Male 0.43 0.01 0.43 0.01 0.40 0.01 0.40 0.01 0.4 0.012 0.4 0.01
Years of Education 7.8 0.22 7.9 0.21 8.7 0.12 8.8 0.12 8.4 0.13 8.5 0.12
Currently Employed? (%) 0.38 0.01 0.39 0.02 0.38 0.01 0.37 0.01 0.32 0.01 0.33 0.01
Wage Arrears (%) 0.08 0.01 0.10 0.01 0.06 0.01 0.08 0.01 0.06 0.01 0.09 0.01
Household Characteristics
Household Size 3.5 0.15 3.5 0.15 3.3 0.09 3.3 0.09 3.3 0.04 3.4 0.04
Household Contains Only Pensioners 0.29 0.01 0.30 0.01 0.26 0.01 0.28 0.01 0.35 0.01 0.33 0.01
# Pensioners in household 1.5 0.04 1.5 0.04 1.5 0.02 1.5 0.03 1.2 0.01 1.3 0.01
# Children up to 16 years 0.63 0.07 0.63 0.08 0.59 0.04 0.58 0.04 0.65 0.03 0.61
Economic Characteristics of HH
Income 7620 218 5805 263 7231 192 7726 189 7130 257 7439 216
Pension Income 2434 60 0 .00 2389 50 2460 58 2312 262 2620 71
Share of Expenditure on Food 0.67 0.00 0.71 0.01 0.66 0.00 0.65 0.00 0.67 0.00 0.66 0.00
Poverty Rate 0.17 0.01 .54 0.03 .20 0.02 0.17 0.02 0.22 0.02 0.18 0.01
Source: RLMS. All monetary figures in ruble.

29
Figure 1. Per Capita Income Densities
Log (per capita income) Log (per capita income)
ARREARS
NON-ARREARS
1996
1996
1995
1995
0 .1
.2
.3
.4
.5
.3
.2
.1 0
-.1
-.2
-.3
3 4 5 6 7 8 9 10 110 .1
.2
.3
.4
.5
3 4 5 6 7 8 9 10 11
.3
.2
.1 0
-.1
-.2
-.3

30
Table 5. Daily Caloric Intake of Male Members of Households with Pensioners
A. Full Sample of Pensioners 1995 1996 Difference
Arrears Pensioners
(�treatment�)
2213 (48)
1970 (38)
-243
Non-Arrears Pensioners (�control 1�)
2133 (33)
2111 (33)
-22
Difference +80
-141 -221 (51)
B. Debtor Regions Only 1995 1996 Difference
Arrears Pensioners
(�treatment�)
2213 (52)
1970 (31)
-243
Non-Arrears Pensioners (�control 2�)
2147 (43)
2130 (37)
-17
Difference +66 -160
-226 (44)
C. High vs. Low Probability Arrears Groups--Donor Regions
1995 1996 Difference
Likely Arrears
2179 (52)
2186 (47)
+7
Non-Likely
1969 (31)
1953 (42)
-16
Difference +210 -233 +23 (48)
Standard errors in parentheses.

31
Figure 2. Caloric Intake Densities
NON-ARREARS
1996
1996
ARREARS
6 7 8 90
6 7 8 9 -.5
0
.5
6 7 8 9 0 6 7 8 9
-.5
0
.5
6 7 8 9-.5
0
.5
1995
1995
Difference-in-DifferenceLog (caloric intake) Log (caloric intake)

32
Figure 3. Calorie Trends 1994-96, Treatment and Control Groups
1800
18501900
19502000
2050
21002150
22002250
2300
1993 1994 1995 1996 1997
Treatment (arrears)
Control 1 (full sample)
Control 2 (debtor only)

33
Table 6: Receipt of Government and Private Assistance, by Pension Arrears Status Pension Arrears Non-Arrears Pensioners Non-Arrears Pensioners, Debtor Regions Only (1) (2) (3) (4) (5) (6) 1995 1996 1995 1996 1995 1996 Mean SE Mean SE Mean SE Mean SE Mean SE Mean SE
Receipt of services and assistance Get fuel benefits? .018 .004 .024 .004 .008 .002 .010 .002 .010 .002 .007 .002 Get apartment benefits? .043 .006 .048 .006 .083 .006 .116 .007 .082 .007 .104 .008 Get stipend? .052 .007 .023 .005 .044 .004 .038 .004 .046 .005 .039 .005 Medical insurance paid by govt? .25 .014 .32 .015 .36 .011 .442 .011 .36 .013 .43 .013 Eligible for medicine discount? .061 .007 .056 .007 .092 .006 .105 .006 .082 .007 .089 .007 Received assistance from private
organization? .023 .005 .027 .005 .027 .003 .028 .003 .026 .004 .023 .004
Source: RLMS.

34
Table 7. Regressions for Caloric Intake: Men Total Sample
OLS (1)
Total Sample OLS (2)
Total Sample OLS (3)
Total Sample Fixed Effects
(4)
Debtor Only OLS (5)
Debtor Only OLS (6)
Debtor Only OLS (7)
Debtor Only Fixed Effects
(8)
Pension Arrears*1996 -239 -226 -228 -258 -232 -227 -224 -221 (73.8)
(77.0) (76.3) (53.2) (79.9) (83.7) (82.7) (58.7)
Pension Arrears 145 144 146 146 146.2 147 (64.1)
(64.1) (63.9) (71.2) (72.5) (72.0)
1996 30.1 21.5 29.6 27.5 21.2 27.3 (45.6)
(45.0) (45.6) (55.9) (56.3) (56.5)
Household Size 32.7 24.4 24.1 27.2 56.5 39.1 38.1 26.9 (26.7)
(25.7) (25.4) (35.1) (30.3) (29.3) (29.0) (36.7)
# children 0-16 1.07 17.5 16.0 -49.4 -11.4 -12.8 (51.0)
(49.4) (48.5) (58.3) (56.9) (55.8)
Age 1.5 2.3 2.2 2.2 2.9 2.7 (1.2)
(1.2) (1.2) (1.4) (1.4) (1.4)
Years of Education 34.8 32.6 32.1 32.9 32.7 32.4 (4.6)
(4.7) (4.6) (6.0) (5.9) (5.8)
Employed? 198 184.4 236.3 49.3 192.3 161.2 215 -3.0 (48.7)
(52.3) (56.0) (88.1) (56.9) (58.3) (62.8) (98.2)
Household Income w/o Pension .065 .056 .009 .074 .064 .024 (.019) (.019)
(.028) (.023) (.022) (.032)
Household in wage arrears? -167 -46.2 -178 -101 (75.7)
(18.1) (80.5) (92.4)
Urban -31.8 -21.3 -27.3 -41.5 -28.1 -35.2 (58.5)
(55.6) (54.0) (62.8) (59.8) (59.5)
Constant 1485 1376 1390 37.2 1450 1352 1376 1221
(112) (116) (117) (1276) (143) (145) (146) (1608)
Number of Observations 1958 1958 1958 1958 1532 1532 1532 1532 Standard errors in parentheses.

35
Table 8. Regression Results, Impact of Pension Arrears on Health Inputs Independent Variable
Men
Women
Caloric Intake (kcal/day) -228 -163 (76.3)
(73.2)
Protein Intake (g/day) -4.3 -4.7 (1.79)
(1.8)
Take medication last week? -.045 -.041 (if chronic condition, and taking before crisis). (.025)
(.034)
Had Check-up in past year? -.05 -.02 (.027)
(.015)
Doctor public, if saw doctor? -.09 -.06 (.022)
(.041)
Number of Observations 1958 2054 Notes: The numbers in the table are coefficients and standard errors on α3 in regression
ititit uXArrArrh +β+α+α+α+α= *1996***1996* 3210 . For rows 3-5, we report marginal effects from probit regressions.

36
Table 9. Determinants of Mortality
Men
Women
Pension Arrears .058 .01 (.030)
(.01)
Age .004 .001 (.002)
(.0004)
Obese .021 .014 (.026)
(.077)
Has experienced chest pain .018 .001 (.020)
(.006)
ADL Index .013 .0063 (.004)
(.0028)
Smoker .065 .001 (.029)
(.021)
# years smoked .0012 -.008 (.0007)
(.016)
Drinks .001 -.001 (.021)
(.006)
Household income .022 -.003 (.034)
(.0021)
Number of Observations 642 1240 Notes: Marginal effects from probit regressions, dependent variable is whether individual died between 1996 and 1998 surveys. Sample restricted to individuals over the age of 50, in households containing at least one pensioner. Standard errors in parentheses. The ADL Index ranges from 0 to 8, with a one unit increase for every activity of daily living for which the respondent indicates they either can not do, or can do but it is very difficult (possible responses were 1 to 5; 1. Not at all difficult; 2. Slightly difficult; 3. Somewhat difficult; 4. Very difficult, but possible; 5. Cannot do it). Activities were: walk across a room; walk 200 meters; walk 1 kilometer; run 1 kilometer; sit for 2 hours; stand up after sitting; lie down and get up from a bed unassisted; climb one flight of stairs; climb several flights of stairs; lift and carry a weight of about 5 kilograms; squat, crouch or kneel.

37
Table 10. Coping Mechanisms Arrears Non-Arrears
Coeff.
(α3) 1995 1996 1995 1996 Employment Status
Anyone in Household Working? .65 .64 .60 .60 -.006 (.01) (.02) (.01) (.01)
(.021)
Hours worked per week (>0) 65.4 71.8 68.3 68.6 5.9 (total, all household members) (.81) (1.4) (1.15) (1.22)
(1.29)
Total wage earnings, month 2710 2905 3135 3080 250.1 (200.4)
(204.3) (109.8) (102.1) (109.9)
Assets, savings
Sold jewelry or property .085 .16 .088 .090 .43 (.01)
(.01) (.01) (.01) (.13)
Value of amount sold 717 1052 498 650 192 (199)
(131) (50) (104) (41)
Borrowing
Borrowed money past 30 days? .12 .19 .15 .16 .15 (.01)
(.01) (.01) (.01) (.025)
Amount borrowed 300 369 403 382 108 (37.1)
(34.5) (54.2) (53.7) (91.2)
Private transfers
Received transfers? .12 .16 .10 .15 -.10 (.02)
(.02) (.02) (.02) (.081)
Amount receive 399 422 288 303 18 (244)
(129) (94.5) (71.2) (12)
Sent transfers? .26 .18 .25 .21 -.21 (.03)
(.03) (.02) (.02) (.055)
Amount sent 610 392 493 399 125 (213) (115) (128) (119) (43) In column 4, numbers for �Coeff� are coefficients α3 from treatment effects regressions where the varible indicated is the dependent variable in, ititit uXArrArry +β+α+α+α+α= *1996***1996* 3210 , representing the effect of pension arrears on that specific activity. Other regressors in the regression: #household members, # children, # elderly, household income excluding the pension, and region indicators. Standard errors in parentheses. For probits, marginal effects, evaluated at sample means, reported.


