HeadHunter Group PLC Announces Second Quarter 2021 Financial Results
MOSCOW, Russia, August 16, 2021 – HeadHunter Group PLC (Nasdaq: HHR, MOEX: HHRU) announced
today its financial results for the quarter ended June 30, 2021. As used below, references to “we,” “our,”
“us” or the “Company” or similar terms shall mean HeadHunter Group PLC.
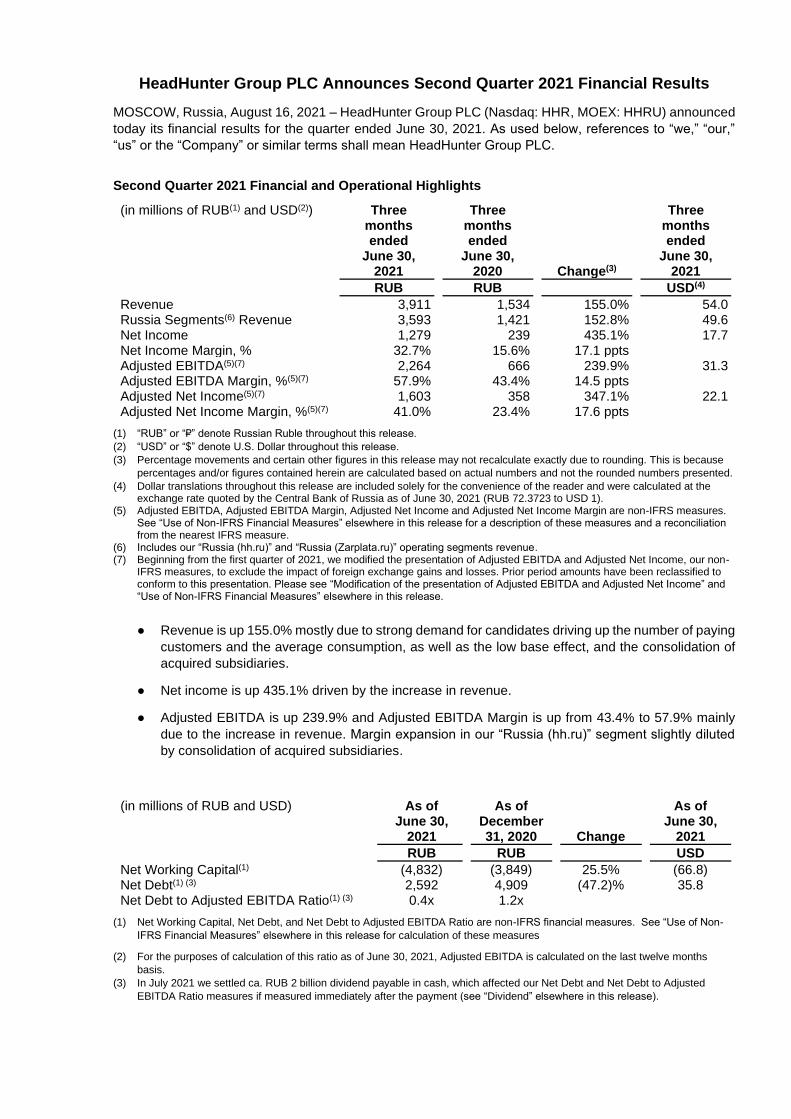
Second Quarter 2021 Financial and Operational Highlights
(in millions of RUB(1) and USD(2)) Three months ended
June 30, 2021
Three months ended
June 30, 2020 Change(3)
Three months ended
June 30, 2021
RUB RUB USD(4)
Revenue 3,911 1,534 155.0% 54.0 Russia Segments(6) Revenue 3,593 1,421 152.8% 49.6 Net Income 1,279 239 435.1% 17.7 Net Income Margin, % 32.7% 15.6% 17.1 ppts Adjusted EBITDA(5)(7) 2,264 666 239.9% 31.3 Adjusted EBITDA Margin, %(5)(7) 57.9% 43.4% 14.5 ppts Adjusted Net Income(5)(7) 1,603 358 347.1% 22.1 Adjusted Net Income Margin, %(5)(7) 41.0% 23.4% 17.6 ppts
(1) “RUB” or “₽” denote Russian Ruble throughout this release.
(2) “USD” or “$” denote U.S. Dollar throughout this release.
(3) Percentage movements and certain other figures in this release may not recalculate exactly due to rounding. This is because
percentages and/or figures contained herein are calculated based on actual numbers and not the rounded numbers presented.
(4) Dollar translations throughout this release are included solely for the convenience of the reader and were calculated at the exchange rate quoted by the Central Bank of Russia as of June 30, 2021 (RUB 72.3723 to USD 1).
(5) Adjusted EBITDA, Adjusted EBITDA Margin, Adjusted Net Income and Adjusted Net Income Margin are non-IFRS measures. See “Use of Non-IFRS Financial Measures” elsewhere in this release for a description of these measures and a reconciliation from the nearest IFRS measure.
(6) Includes our “Russia (hh.ru)” and “Russia (Zarplata.ru)” operating segments revenue. (7) Beginning from the first quarter of 2021, we modified the presentation of Adjusted EBITDA and Adjusted Net Income, our non-
IFRS measures, to exclude the impact of foreign exchange gains and losses. Prior period amounts have been reclassified to conform to this presentation. Please see “Modification of the presentation of Adjusted EBITDA and Adjusted Net Income” and “Use of Non-IFRS Financial Measures” elsewhere in this release.
● Revenue is up 155.0% mostly due to strong demand for candidates driving up the number of paying
customers and the average consumption, as well as the low base effect, and the consolidation of
acquired subsidiaries.
● Net income is up 435.1% driven by the increase in revenue.
● Adjusted EBITDA is up 239.9% and Adjusted EBITDA Margin is up from 43.4% to 57.9% mainly
due to the increase in revenue. Margin expansion in our “Russia (hh.ru)” segment slightly diluted
by consolidation of acquired subsidiaries.
(in millions of RUB and USD) As of June 30,
2021
As of December 31, 2020 Change
As of June 30,
2021
RUB RUB USD
Net Working Capital(1) (4,832) (3,849) 25.5% (66.8) Net Debt(1) (3) 2,592 4,909 (47.2)% 35.8 Net Debt to Adjusted EBITDA Ratio(1) (3) 0.4x 1.2x
(1) Net Working Capital, Net Debt, and Net Debt to Adjusted EBITDA Ratio are non-IFRS financial measures. See “Use of Non-
IFRS Financial Measures” elsewhere in this release for calculation of these measures
(2) For the purposes of calculation of this ratio as of June 30, 2021, Adjusted EBITDA is calculated on the last twelve months
basis.
(3) In July 2021 we settled ca. RUB 2 billion dividend payable in cash, which affected our Net Debt and Net Debt to Adjusted
EBITDA Ratio measures if measured immediately after the payment (see “Dividend” elsewhere in this release).
● Net Working Capital as of June 30, 2021 decreased by ₽983 million, or 25.5%, compared to
December 31, 2020, primarily due to (i) an increase in contract liabilities by ₽583 million from
customer prepayments, (ii) an increase in trade and other payables (current portion), and (iii) ₽155
million consideration payable for the acquisition of a 9.97% stake in Skillaz.
● Net Debt decreased by ₽2,317 million, or 47.2%, primarily due to cash generated from operating
activities (see “Cash Flows”).
● Net Debt to Adjusted EBITDA Ratio decreased from 1.2x to 0.4x, due to the decrease in Net Debt
and the increase in Adjusted EBITDA.
Mikhail Zhukov, Chief Executive Officer of HeadHunter Group PLC: "We had an exceptionally strong
quarter, where we demonstrated the scalability of our business model and our commitment to long-term
product development. We look forward to remaining the most effective digital recruitment solution for many
thousands of clients as they recover from last year’s turbulence and now face an unprecedented labor
supply scarcity.”
Acquisition of Zarplata.ru and Skillaz
In December 2020, we acquired 100% ownership interest in LLC “Zarplata.ru” (“Zarplata.ru”), a job
classified platform with a strong footprint in certain Russian regions, such as Siberia and Ural. From January
1, 2021, our statement of income and comprehensive income includes results of Zarplata.ru. This affects
year-on-year comparisons of our revenue, operating expenses, and other metrics in 2021. For the purposes
of analysis of our key performance indicators, such as the number of paying customers and the average
revenue per customer (“ARPC”), we combine our “Russia (hh.ru)” and “Russia (Zarplata.ru)” (collectively
“Russia segments”) revenues, as we believe that our combined ARPC and combined number of paying
customers allows us to assess better our results and position on Russian online recruitment market, on
which both these segments operate.
As of March 31, 2021, we obtained control over LLC “Skillaz”, a Russian HR technology company which
automates and enhances recruitment processes by delivering sophisticated and flexible software as a
service (“SaaS”) solutions (“Skillaz”), as our call option to acquire a further 40.01% ownership interest in
Skillaz (in addition to our 25.01% stake already acquired) became beneficial. On May 26, 2021, we
exercised the option and acquired the 40.01% stake, and on June 28, 2021 we acquired additional 9.97%,
thus increasing our total ownership interest in Skillaz to 74.99%. From April 1, 2021, our statement of
income and comprehensive income includes results of Skillaz. This affects year-on-year comparisons of
our revenue and operating expenses in 2021. For the purposes of analysis of our key performance
indicators, such as the number of paying customers and the average revenue per customer (“ARPC”), we
included Skillaz in our “Other segments”.
Modification of the presentation of Adjusted EBITDA and Adjusted Net Income
Beginning from the first quarter of 2021, we modified the presentation of Adjusted EBITDA and Adjusted
Net Income, our non-IFRS measures, to exclude the impact of foreign exchange gains and losses as the
nature of such gains and losses is not operational. We believe this revised presentation will provide a better
understanding of our operating performance and a more meaningful comparison of our results between
periods.
Prior period amounts have been reclassified to conform to this presentation. These changes have no impact
on any of the previously reported IFRS results for any periods presented.
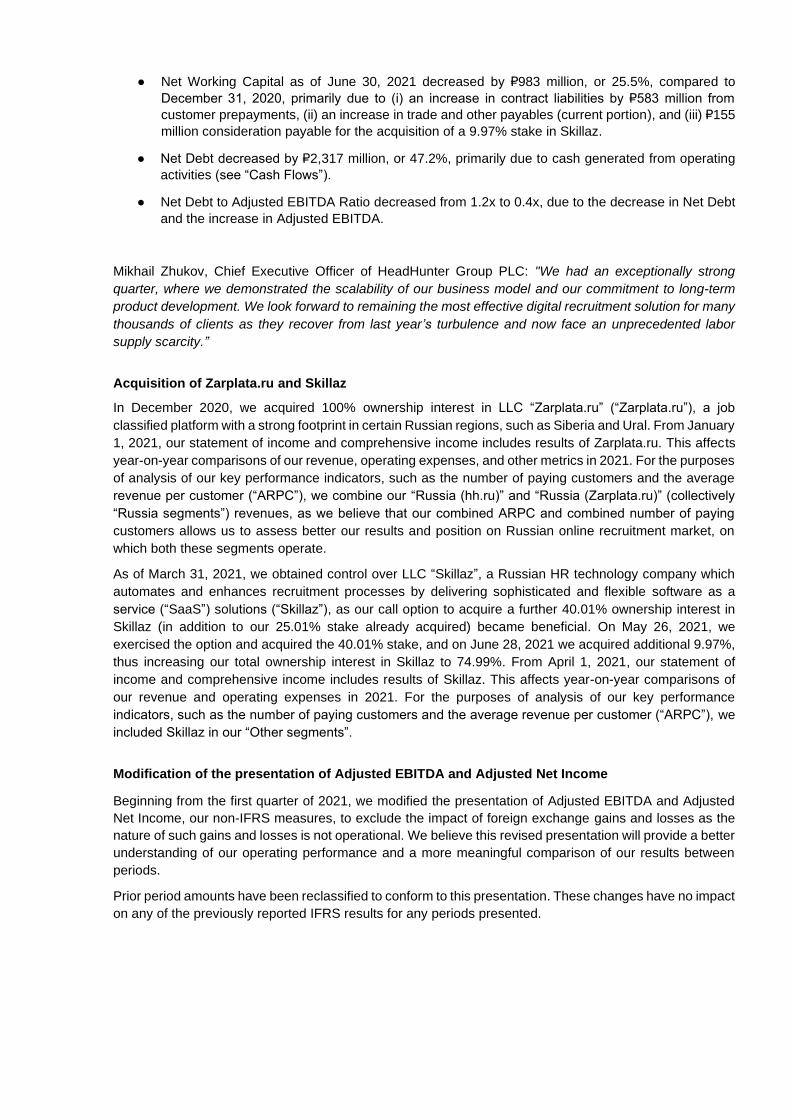
The following tables present the effects of the changes on the presentation of non-IFRS measures as
reflected in the Company's previous reports:
(in millions of RUB) For the three months ended June 30, 2020
Non-IFRS Prior
Presentation
Net foreign exchange
gain and related
income tax effect
Non-IFRS Revised
Presentation
Adjusted EBITDA 685 (19) 666 Adjusted EBITDA Margin, % 44.7% (1.3%) 43.4%
Adjusted Net Income 412 (54) 358 Adjusted Net Income Margin, % 26.9% (3.5%) 23.4%
(in millions of RUB) For the six months ended June 30, 2020
Non-IFRS Prior
Presentation
Net foreign exchange
gain and related
income tax effect
Non-IFRS Revised
Presentation
Adjusted EBITDA 1,731 (95) 1,636 Adjusted EBITDA Margin, % 49.1% (2.7%) 46.4%
Adjusted Net Income 1,025 (85) 940
Adjusted Net Income Margin, % 29.1% (2.4%) 26.7%
(in millions of RUB) For the year ended December 31, 2020
Non-IFRS Prior
Presentation
Net foreign exchange
gain and related
income tax effect
Non-IFRS Revised
Presentation
Adjusted EBITDA 4,187 (83) 4,104 Adjusted EBITDA Margin, % 50.6% (1.1%) 49.5% Adjusted Net Income 2,733 (50) 2,683 Adjusted Net Income Margin, % 33.0% (0.6%) 32.4%
Impact of COVID-19 on Our Operations and Financial Position
The ongoing COVID-19 pandemic can affect our financial results mostly via decrease in business activity
in Russia, especially on the back of measures taken by authorities to curb spread of the disease, such as
shelter-in-place orders, non-working days announcements and businesses closures. A decrease in
business activity may result in a decrease in a number of job postings advertised by our customers and the
number of CV database subscriptions purchased or renewed, leading to a decrease in our revenues.
The most severe restrictions in Russia were in place from March 30, 2020 to May 11, 2020, when a nation-
wide period of non-working days was introduced, and shelter-in-place orders were in effect in Moscow. This
affected our revenue in the end of the first quarter of 2020 and in the second quarter of 2020. A gradual
recovery of business activities followed in the third and fourth quarters of 2020, resulting in a recovery in
our KPIs.
No such restrictions had been introduced since, except until a period of four working days from May
4, 2021 to May 7, 2021 was announced as a period of non-working days. This was a similar but much
smaller measure to the period of non-working days in 2020. Accordingly, we have seen no measurable
impact of COVID-19 on our financial results for the second quarter of 2021 and our financial position as of
June 30, 2021. Year-to-year comparison of our financial results for the second and, prospectively, third
quarter of 2021 is colored by the low base effect of the corresponding periods in 2020. However, our
financial position, results and liquidity may be affected in the future by any further adverse developments
related to COVID-19.
Operating Segments
For management purposes, we are organized into operating segments based on the geography of our
operations or other subdivisions as presented in internal reporting to our chief operating decision-maker
(“CODM”). Our operating segments include “Russia (hh.ru),” “Russia (Zarplata.ru),” “Belarus,”
“Kazakhstan”, “Skillaz” and other segments. As each segment, other than “Russia (hh.ru)” and “Russia
(Zarplata.ru)”, individually comprises less than 10% of our revenue, for reporting purposes we combine all
segments other than “Russia (hh.ru)” and “Russia (Zarplata.ru)” into the “Other segments” category.
Customers
We sell our services predominantly to businesses that are looking for job seekers to fill vacancies inside
their organizations. We refer to such businesses as “customers.” In Russia, we divide our customers into
(i) Key Accounts and (ii) Small and Medium Accounts, based on their annual revenue and employee
headcount. We define “Key Accounts” as customers who, according to the Spark-Interfax database, have
an annual revenue of ₽2 billion or more or a headcount of 250 or more employees and have not marked
themselves as recruiting agencies on their page on our website. We define “Small and Medium Accounts”
as customers who, according to the Spark-Interfax database, have both an annual revenue of less than ₽2
billion and a headcount of less than 250 employees and have not marked themselves as recruiting agencies
on their page on our website. Our website allows several legal entities and/or natural persons to be
registered, each with a unique identification number, under a single account page (e.g., a group of
companies). Each legal entity registered under a single account is defined as a separate customer and is
included in the number of paying customers metric. Natural persons registered under a single account are
assumed to be employees of the legal entities of that account and thus, are not considered separate
customers and are not included in the number of paying customers metric. However, in a specific reporting
period, if only natural persons used our services under such account, they are collectively included in the
number of paying customers as one customer.
Seasonality
Revenue
We generally do not experience seasonal fluctuations in demand for our services and, prior to COVID-19,
our revenue remained relatively stable throughout each quarter. However, our customers are predominately
businesses and, therefore, use our services mostly on business days. As a result, our quarterly revenue is
affected by the number of business days in a quarter, with the exception of our services that represent
“stand-ready” performance obligations, such as subscriptions to access our curriculum vitae (“CV”)
database, which are satisfied over the period of subscription, including weekends and holidays.
Public holidays in Russia predominantly fall during the first quarter of each year, which results in lower
business activity in that quarter. Accordingly, our first quarter revenue is typically slightly lower than in the
other quarters. For example, our first quarter revenue in our “Russia (hh.ru)” segment in 2019 was 21.6%
(in 2020, this metric was not indicative due to COVID-19).
The number of business days in a quarter may also be affected by calendar layout in a specific year. In
addition, the Government of Russia decides on an annual basis how public holidays that occur on weekends
will be reallocated to business days throughout the year as a requirement of the Labor Code of Russia. As
a result, the number of business days in a quarter may be different in each year (while the total number of
business days in a year usually remains the same). Therefore, the comparability of our quarterly results,
including with respect to our revenue growth rate, may be affected by this variance. In addition, when a
calendar layout in a specific year provides for several consecutive holidays or a small number of business
days between holidays or holidays adjacent to weekends, HR managers of our customers may take short
vacations, further contributing to the decrease in business activities in these periods.
The following table illustrates the number of business days by quarter for the years 2019 to 2021. In 2021,
compared to 2020, there is one business day less in the first quarter and in the total year, two business
days more in the second quarter, and two business days less in the fourth quarter, meaning that a negative
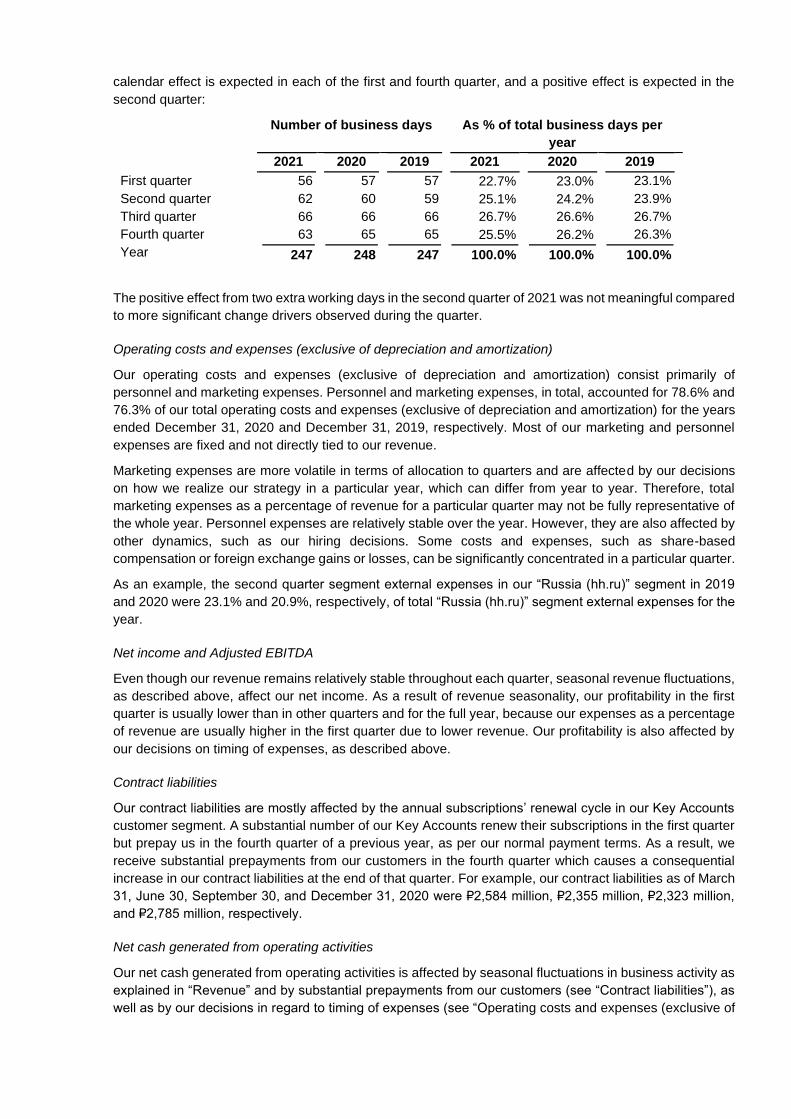
calendar effect is expected in each of the first and fourth quarter, and a positive effect is expected in the
second quarter:
Number of business days As % of total business days per
year
2021 2020 2019 2021 2020 2019
First quarter 56 57 57 22.7% 23.0% 23.1%
Second quarter 62 60 59 25.1% 24.2% 23.9%
Third quarter 66 66 66 26.7% 26.6% 26.7%
Fourth quarter 63 65 65 25.5% 26.2% 26.3%
Year 247 248 247 100.0% 100.0% 100.0%
The positive effect from two extra working days in the second quarter of 2021 was not meaningful compared
to more significant change drivers observed during the quarter.
Operating costs and expenses (exclusive of depreciation and amortization)
Our operating costs and expenses (exclusive of depreciation and amortization) consist primarily of
personnel and marketing expenses. Personnel and marketing expenses, in total, accounted for 78.6% and
76.3% of our total operating costs and expenses (exclusive of depreciation and amortization) for the years
ended December 31, 2020 and December 31, 2019, respectively. Most of our marketing and personnel
expenses are fixed and not directly tied to our revenue.
Marketing expenses are more volatile in terms of allocation to quarters and are affected by our decisions
on how we realize our strategy in a particular year, which can differ from year to year. Therefore, total
marketing expenses as a percentage of revenue for a particular quarter may not be fully representative of
the whole year. Personnel expenses are relatively stable over the year. However, they are also affected by
other dynamics, such as our hiring decisions. Some costs and expenses, such as share-based
compensation or foreign exchange gains or losses, can be significantly concentrated in a particular quarter.
As an example, the second quarter segment external expenses in our “Russia (hh.ru)” segment in 2019
and 2020 were 23.1% and 20.9%, respectively, of total “Russia (hh.ru)” segment external expenses for the
year.
Net income and Adjusted EBITDA
Even though our revenue remains relatively stable throughout each quarter, seasonal revenue fluctuations,
as described above, affect our net income. As a result of revenue seasonality, our profitability in the first
quarter is usually lower than in other quarters and for the full year, because our expenses as a percentage
of revenue are usually higher in the first quarter due to lower revenue. Our profitability is also affected by
our decisions on timing of expenses, as described above.
Contract liabilities
Our contract liabilities are mostly affected by the annual subscriptions’ renewal cycle in our Key Accounts
customer segment. A substantial number of our Key Accounts renew their subscriptions in the first quarter
but prepay us in the fourth quarter of a previous year, as per our normal payment terms. As a result, we
receive substantial prepayments from our customers in the fourth quarter which causes a consequential
increase in our contract liabilities at the end of that quarter. For example, our contract liabilities as of March
31, June 30, September 30, and December 31, 2020 were ₽2,584 million, ₽2,355 million, ₽2,323 million,
and ₽2,785 million, respectively.
Net cash generated from operating activities
Our net cash generated from operating activities is affected by seasonal fluctuations in business activity as
explained in “Revenue” and by substantial prepayments from our customers (see “Contract liabilities”), as
well as by our decisions in regard to timing of expenses (see “Operating costs and expenses (exclusive of
depreciation and amortization)”), and to a lesser extent by payment terms provided to us by our largest
suppliers, such as TV advertising agencies and others.
Net Working Capital
Our Net Working Capital is primarily affected by changes in our contract liabilities. As our contract liabilities
have usually been highest in the fourth quarter, our Net Working Capital has usually been lowest in the
fourth quarter. For example, our Net Working Capital of March 31, June 30, September 30, and December
31, 2020 was ₽ (3,130) million, ₽ (2,865) million, ₽ (3,111) million, and ₽ (3,849) million, respectively.
Second Quarter 2021 Results
Our revenue was ₽3,911 million for the three months ended June 30, 2021 compared to ₽1,534 million for
the three months ended June 30, 2020. Revenue for the three months ended June 30, 2021 increased by
₽2,377 million, or 155.0%, while the compound average growth rate(*) (“CAGR”) from 2019 to 2021 in the
second quarter of 2021 was 43.4%, reflecting acceleration of growth compared to historical averages.
Revenue has increased primarily due to the increase in all key operating metrics across customer segments
on the back of strong demand for candidates, as well as due to low base effect, our monetization initiatives,
and consolidation of acquired subsidiaries.
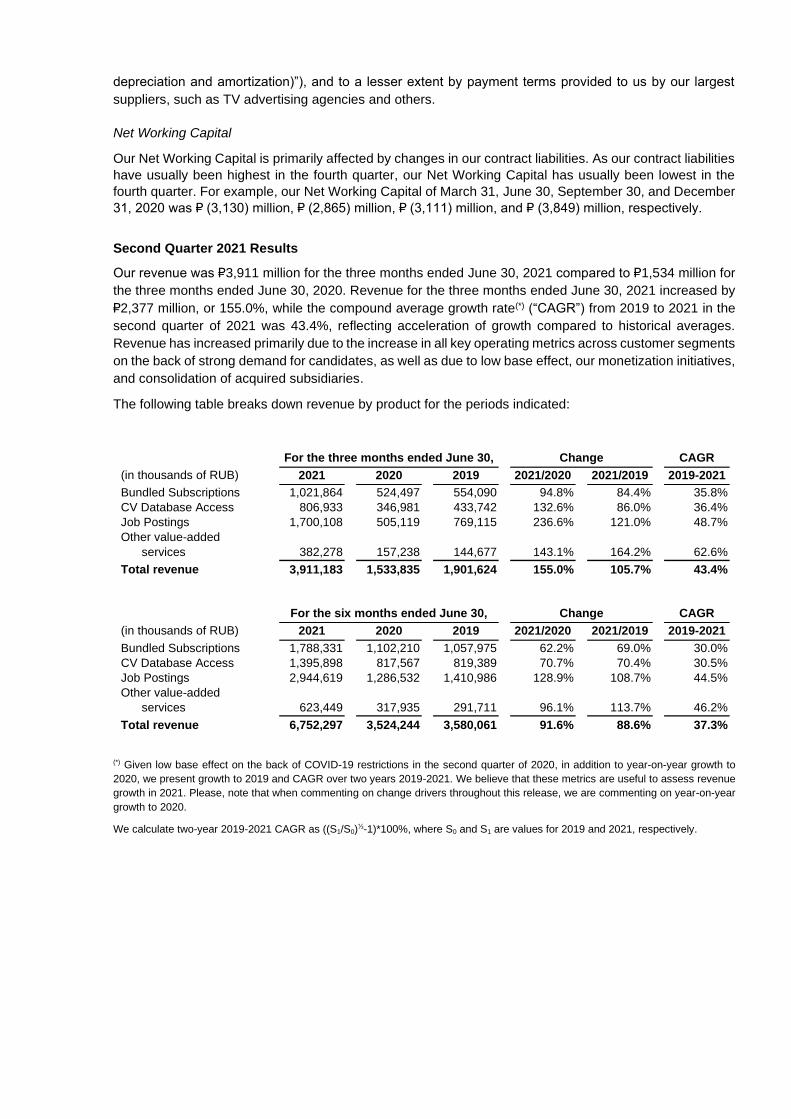
The following table breaks down revenue by product for the periods indicated:
For the three months ended June 30, Change CAGR
(in thousands of RUB) 2021 2020 2019 2021/2020 2021/2019 2019-2021
Bundled Subscriptions 1,021,864 524,497 554,090 94.8% 84.4% 35.8%
CV Database Access 806,933 346,981 433,742 132.6% 86.0% 36.4%
Job Postings 1,700,108 505,119 769,115 236.6% 121.0% 48.7%
Other value-added
services 382,278 157,238 144,677 143.1% 164.2% 62.6%
Total revenue 3,911,183 1,533,835 1,901,624 155.0% 105.7% 43.4%
For the six months ended June 30, Change CAGR
(in thousands of RUB) 2021 2020 2019 2021/2020 2021/2019 2019-2021
Bundled Subscriptions 1,788,331 1,102,210 1,057,975 62.2% 69.0% 30.0%
CV Database Access 1,395,898 817,567 819,389 70.7% 70.4% 30.5%
Job Postings 2,944,619 1,286,532 1,410,986 128.9% 108.7% 44.5%
Other value-added
services 623,449 317,935 291,711 96.1% 113.7% 46.2%
Total revenue 6,752,297 3,524,244 3,580,061 91.6% 88.6% 37.3%
(*) Given low base effect on the back of COVID-19 restrictions in the second quarter of 2020, in addition to year-on-year growth to
2020, we present growth to 2019 and CAGR over two years 2019-2021. We believe that these metrics are useful to assess revenue
growth in 2021. Please, note that when commenting on change drivers throughout this release, we are commenting on year-on-year
growth to 2020.
We calculate two-year 2019-2021 CAGR as ((S1/S0)½-1)*100%, where S0 and S1 are values for 2019 and 2021, respectively.
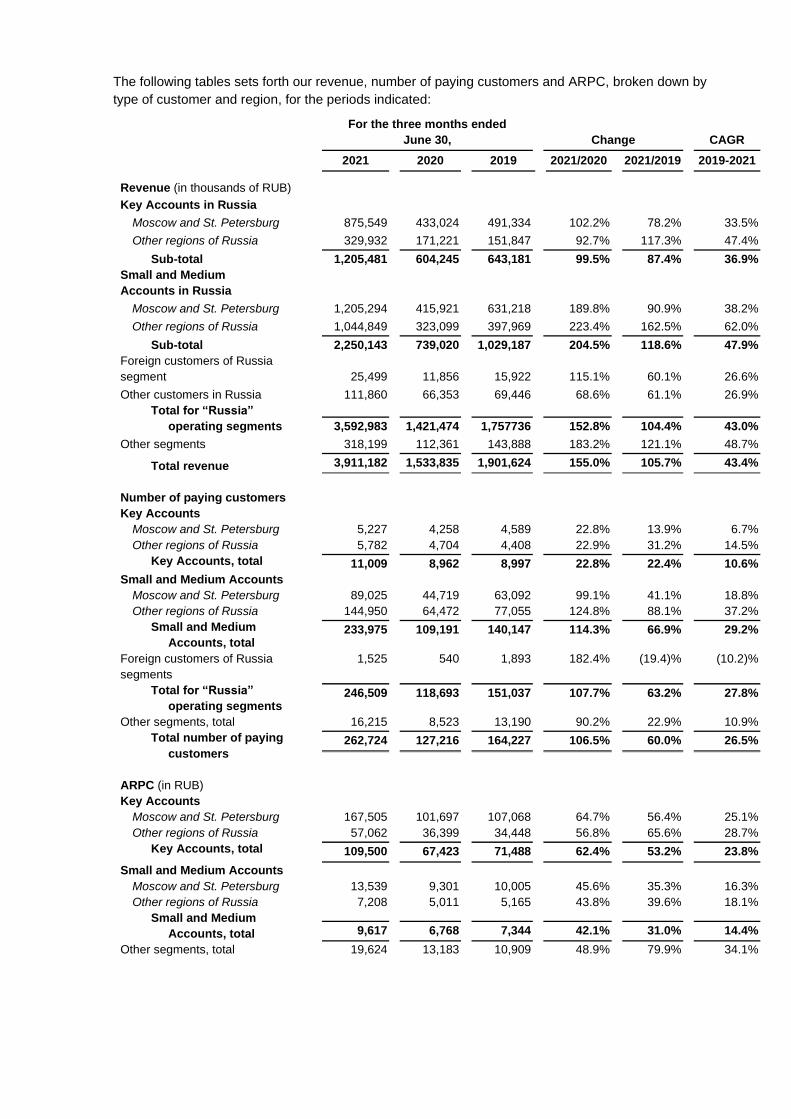
The following tables sets forth our revenue, number of paying customers and ARPC, broken down by
type of customer and region, for the periods indicated:
For the three months ended
June 30, Change CAGR
2021 2020 2019 2021/2020 2021/2019 2019-2021
Revenue (in thousands of RUB)
Key Accounts in Russia
Moscow and St. Petersburg 875,549 433,024 491,334 102.2% 78.2% 33.5%
Other regions of Russia 329,932 171,221 151,847 92.7% 117.3% 47.4%
Sub-total 1,205,481 604,245 643,181 99.5% 87.4% 36.9%
Small and Medium
Accounts in Russia
Moscow and St. Petersburg 1,205,294 415,921 631,218 189.8% 90.9% 38.2%
Other regions of Russia 1,044,849 323,099 397,969 223.4% 162.5% 62.0%
Sub-total 2,250,143 739,020 1,029,187 204.5% 118.6% 47.9%
Foreign customers of Russia
segment 25,499 11,856 15,922 115.1% 60.1% 26.6%
Other customers in Russia 111,860 66,353 69,446 68.6% 61.1% 26.9%
Total for “Russia”
operating segments 3,592,983 1,421,474 1,757736 152.8% 104.4% 43.0%
Other segments 318,199 112,361 143,888 183.2% 121.1% 48.7%
Total revenue 3,911,182 1,533,835 1,901,624 155.0% 105.7% 43.4%
Number of paying customers
Key Accounts
Moscow and St. Petersburg 5,227 4,258 4,589 22.8% 13.9% 6.7%
Other regions of Russia 5,782 4,704 4,408 22.9% 31.2% 14.5%
Key Accounts, total 11,009 8,962 8,997 22.8% 22.4% 10.6%
Small and Medium Accounts
Moscow and St. Petersburg 89,025 44,719 63,092 99.1% 41.1% 18.8%
Other regions of Russia 144,950 64,472 77,055 124.8% 88.1% 37.2%
Small and Medium
Accounts, total 233,975 109,191 140,147 114.3% 66.9% 29.2%
Foreign customers of Russia
segments
1,525 540 1,893 182.4% (19.4)% (10.2)%
Total for “Russia”
operating segments 246,509 118,693 151,037 107.7% 63.2% 27.8%
Other segments, total 16,215 8,523 13,190 90.2% 22.9% 10.9%
Total number of paying
customers 262,724 127,216 164,227 106.5% 60.0% 26.5%
ARPC (in RUB)
Key Accounts
Moscow and St. Petersburg 167,505 101,697 107,068 64.7% 56.4% 25.1%
Other regions of Russia 57,062 36,399 34,448 56.8% 65.6% 28.7%
Key Accounts, total 109,500 67,423 71,488 62.4% 53.2% 23.8%
Small and Medium Accounts
Moscow and St. Petersburg 13,539 9,301 10,005 45.6% 35.3% 16.3%
Other regions of Russia 7,208 5,011 5,165 43.8% 39.6% 18.1%
Small and Medium
Accounts, total 9,617 6,768 7,344 42.1% 31.0% 14.4%
Other segments, total 19,624 13,183 10,909 48.9% 79.9% 34.1%
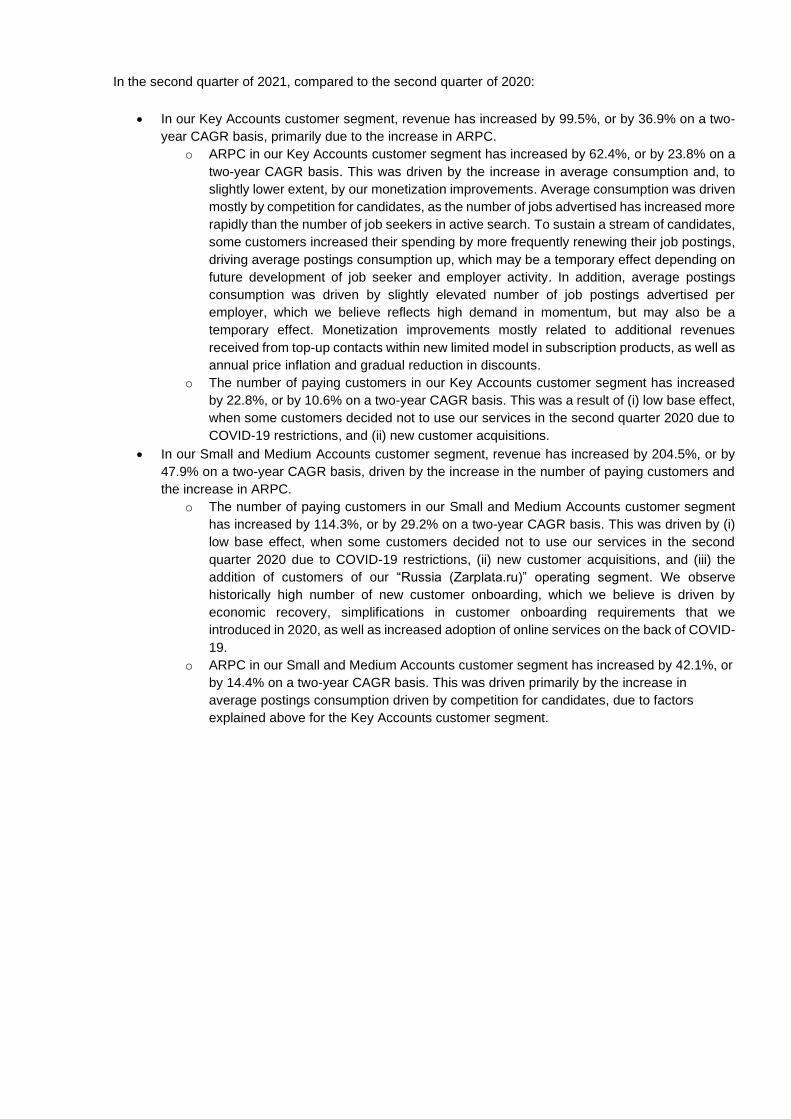
In the second quarter of 2021, compared to the second quarter of 2020:
• In our Key Accounts customer segment, revenue has increased by 99.5%, or by 36.9% on a two-
year CAGR basis, primarily due to the increase in ARPC.
o ARPC in our Key Accounts customer segment has increased by 62.4%, or by 23.8% on a
two-year CAGR basis. This was driven by the increase in average consumption and, to
slightly lower extent, by our monetization improvements. Average consumption was driven
mostly by competition for candidates, as the number of jobs advertised has increased more
rapidly than the number of job seekers in active search. To sustain a stream of candidates,
some customers increased their spending by more frequently renewing their job postings,
driving average postings consumption up, which may be a temporary effect depending on
future development of job seeker and employer activity. In addition, average postings
consumption was driven by slightly elevated number of job postings advertised per
employer, which we believe reflects high demand in momentum, but may also be a
temporary effect. Monetization improvements mostly related to additional revenues
received from top-up contacts within new limited model in subscription products, as well as
annual price inflation and gradual reduction in discounts.
o The number of paying customers in our Key Accounts customer segment has increased
by 22.8%, or by 10.6% on a two-year CAGR basis. This was a result of (i) low base effect,
when some customers decided not to use our services in the second quarter 2020 due to
COVID-19 restrictions, and (ii) new customer acquisitions.
• In our Small and Medium Accounts customer segment, revenue has increased by 204.5%, or by
47.9% on a two-year CAGR basis, driven by the increase in the number of paying customers and
the increase in ARPC.
o The number of paying customers in our Small and Medium Accounts customer segment
has increased by 114.3%, or by 29.2% on a two-year CAGR basis. This was driven by (i)
low base effect, when some customers decided not to use our services in the second
quarter 2020 due to COVID-19 restrictions, (ii) new customer acquisitions, and (iii) the
addition of customers of our “Russia (Zarplata.ru)” operating segment. We observe
historically high number of new customer onboarding, which we believe is driven by
economic recovery, simplifications in customer onboarding requirements that we
introduced in 2020, as well as increased adoption of online services on the back of COVID-
19.
o ARPC in our Small and Medium Accounts customer segment has increased by 42.1%, or
by 14.4% on a two-year CAGR basis. This was driven primarily by the increase in
average postings consumption driven by competition for candidates, due to factors
explained above for the Key Accounts customer segment.
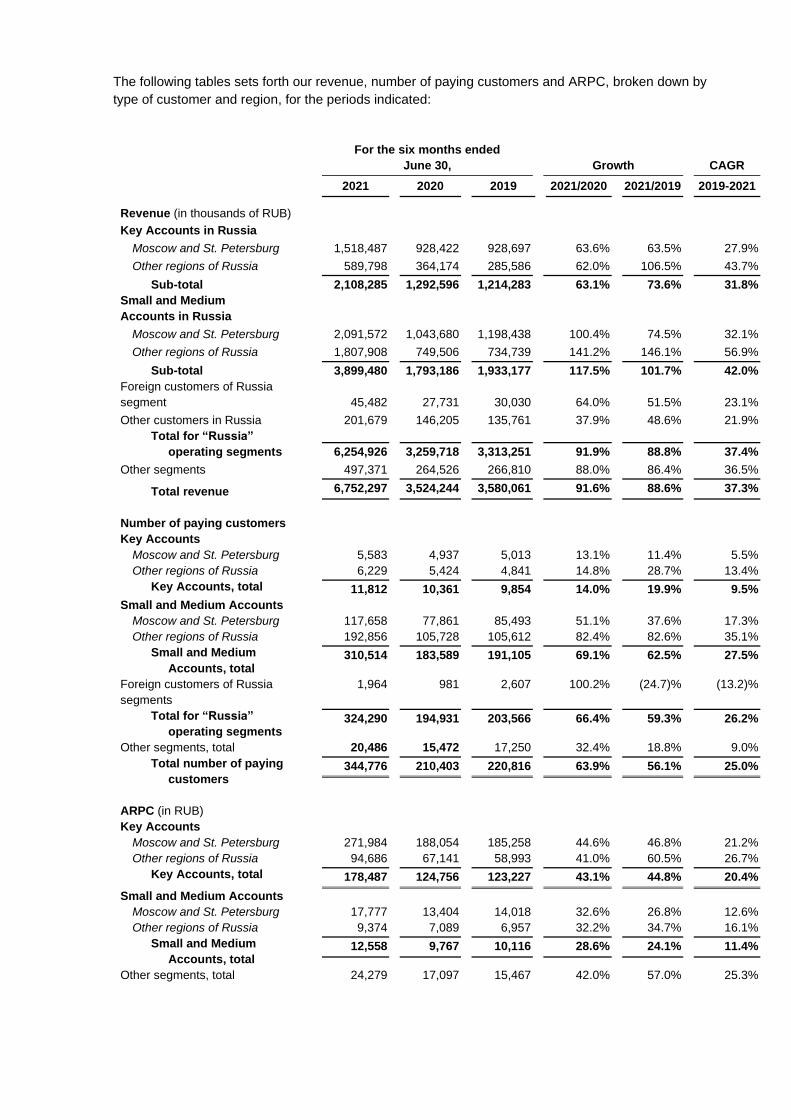
The following tables sets forth our revenue, number of paying customers and ARPC, broken down by
type of customer and region, for the periods indicated:
For the six months ended
June 30, Growth CAGR
2021 2020 2019 2021/2020 2021/2019 2019-2021
Revenue (in thousands of RUB)
Key Accounts in Russia
Moscow and St. Petersburg 1,518,487 928,422 928,697 63.6% 63.5% 27.9%
Other regions of Russia 589,798 364,174 285,586 62.0% 106.5% 43.7%
Sub-total 2,108,285 1,292,596 1,214,283 63.1% 73.6% 31.8%
Small and Medium
Accounts in Russia
Moscow and St. Petersburg 2,091,572 1,043,680 1,198,438 100.4% 74.5% 32.1%
Other regions of Russia 1,807,908 749,506 734,739 141.2% 146.1% 56.9%
Sub-total 3,899,480 1,793,186 1,933,177 117.5% 101.7% 42.0%
Foreign customers of Russia
segment 45,482 27,731 30,030 64.0% 51.5% 23.1%
Other customers in Russia 201,679 146,205 135,761 37.9% 48.6% 21.9%
Total for “Russia”
operating segments 6,254,926 3,259,718 3,313,251 91.9% 88.8% 37.4%
Other segments 497,371 264,526 266,810 88.0% 86.4% 36.5%
Total revenue 6,752,297 3,524,244 3,580,061 91.6% 88.6% 37.3%
Number of paying customers
Key Accounts
Moscow and St. Petersburg 5,583 4,937 5,013 13.1% 11.4% 5.5%
Other regions of Russia 6,229 5,424 4,841 14.8% 28.7% 13.4%
Key Accounts, total 11,812 10,361 9,854 14.0% 19.9% 9.5%
Small and Medium Accounts
Moscow and St. Petersburg 117,658 77,861 85,493 51.1% 37.6% 17.3%
Other regions of Russia 192,856 105,728 105,612 82.4% 82.6% 35.1%
Small and Medium
Accounts, total 310,514 183,589 191,105 69.1% 62.5% 27.5%
Foreign customers of Russia
segments
1,964 981 2,607 100.2% (24.7)% (13.2)%
Total for “Russia”
operating segments 324,290 194,931 203,566 66.4% 59.3% 26.2%
Other segments, total 20,486 15,472 17,250 32.4% 18.8% 9.0%
Total number of paying
customers 344,776 210,403 220,816 63.9% 56.1% 25.0%
ARPC (in RUB)
Key Accounts
Moscow and St. Petersburg 271,984 188,054 185,258 44.6% 46.8% 21.2%
Other regions of Russia 94,686 67,141 58,993 41.0% 60.5% 26.7%
Key Accounts, total 178,487 124,756 123,227 43.1% 44.8% 20.4%
Small and Medium Accounts
Moscow and St. Petersburg 17,777 13,404 14,018 32.6% 26.8% 12.6%
Other regions of Russia 9,374 7,089 6,957 32.2% 34.7% 16.1%
Small and Medium
Accounts, total 12,558 9,767 10,116 28.6% 24.1% 11.4%
Other segments, total 24,279 17,097 15,467 42.0% 57.0% 25.3%
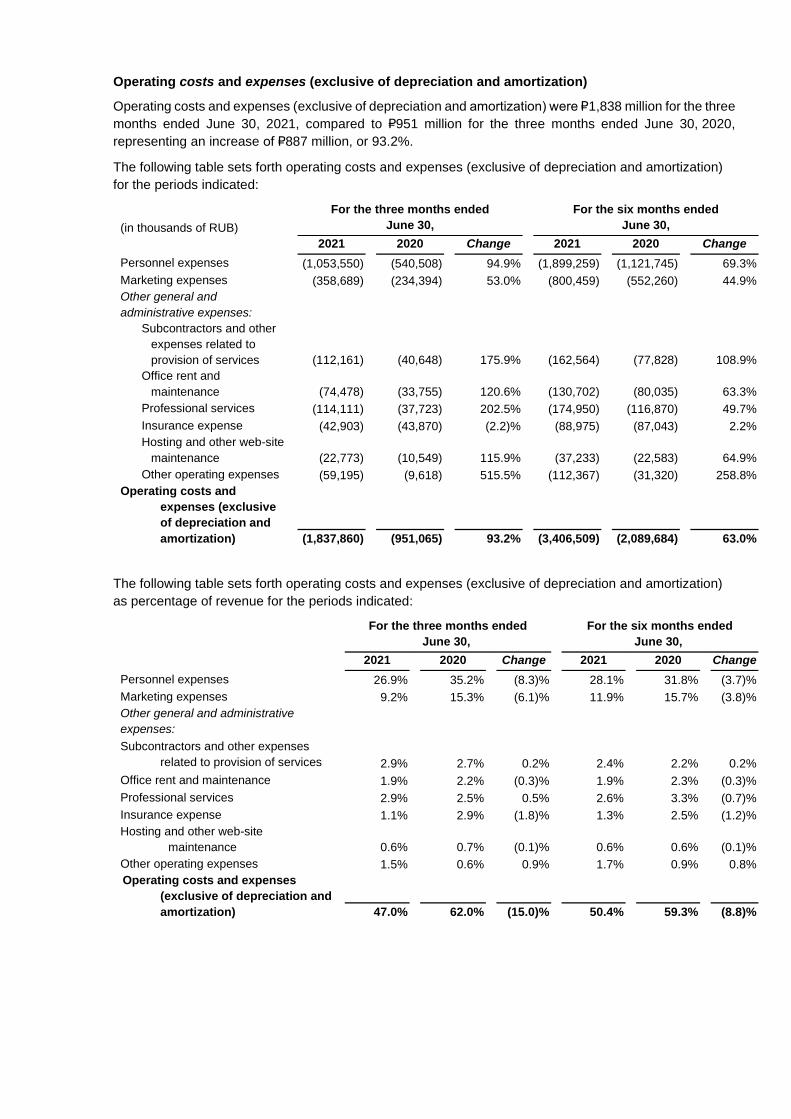
Operating costs and expenses (exclusive of depreciation and amortization)
Operating costs and expenses (exclusive of depreciation and amortization) were ₽1,838 million for the three
months ended June 30, 2021, compared to ₽951 million for the three months ended June 30, 2020,
representing an increase of ₽887 million, or 93.2%.
The following table sets forth operating costs and expenses (exclusive of depreciation and amortization)
for the periods indicated:
(in thousands of RUB)
For the three months ended
June 30,
For the six months ended
June 30,
2021 2020 Change 2021 2020 Change
Personnel expenses (1,053,550) (540,508) 94.9% (1,899,259) (1,121,745) 69.3%
Marketing expenses (358,689) (234,394) 53.0% (800,459) (552,260) 44.9%
Other general and
administrative expenses:
Subcontractors and other
expenses related to
provision of services (112,161) (40,648) 175.9% (162,564) (77,828) 108.9%
Office rent and
maintenance (74,478) (33,755) 120.6% (130,702) (80,035) 63.3%
Professional services (114,111) (37,723) 202.5% (174,950) (116,870) 49.7%
Insurance expense (42,903) (43,870) (2.2)% (88,975) (87,043) 2.2%
Hosting and other web-site
maintenance (22,773) (10,549) 115.9% (37,233) (22,583) 64.9%
Other operating expenses (59,195) (9,618) 515.5% (112,367) (31,320) 258.8%
Operating costs and
expenses (exclusive
of depreciation and
amortization) (1,837,860) (951,065) 93.2% (3,406,509) (2,089,684) 63.0%
The following table sets forth operating costs and expenses (exclusive of depreciation and amortization)
as percentage of revenue for the periods indicated:
For the three months ended
June 30,
For the six months ended
June 30,
2021 2020 Change 2021 2020 Change
Personnel expenses 26.9% 35.2% (8.3)% 28.1% 31.8% (3.7)%
Marketing expenses 9.2% 15.3% (6.1)% 11.9% 15.7% (3.8)%
Other general and administrative
expenses:
Subcontractors and other expenses
related to provision of services 2.9% 2.7% 0.2% 2.4% 2.2% 0.2%
Office rent and maintenance 1.9% 2.2% (0.3)% 1.9% 2.3% (0.3)%
Professional services 2.9% 2.5% 0.5% 2.6% 3.3% (0.7)%
Insurance expense 1.1% 2.9% (1.8)% 1.3% 2.5% (1.2)%
Hosting and other web-site
maintenance 0.6% 0.7% (0.1)% 0.6% 0.6% (0.1)%
Other operating expenses 1.5% 0.6% 0.9% 1.7% 0.9% 0.8%
Operating costs and expenses
(exclusive of depreciation and
amortization) 47.0% 62.0% (15.0)% 50.4% 59.3% (8.8)%
Personnel expenses
Personnel expenses for the three months ended June 30, 2021 increased by ₽513 million, or 94.9%,
compared to the three months ended June 30, 2020 primarily due to: (i) addition of personnel expenses of
Zarplata.ru and Skillaz; (ii) low base effect, including our cost savings initiatives in the second quarter of
2020 not occurring in the second quarter of 2021, and our sales team bonuses reaching bottom-end in the
second quarter of 2020 on the back of significant underperformance in revenue relative to sales teams’
targets, and top-end in the second quarter of 2021 on the back of significant overperformance relative to
the targets; (iii) the increase in headcount by 120 people (not including increase in personnel headcount
due to acquisition of Zarplata.ru and Skillaz) from June 30, 2020 to June 30, 2021, primarily in our
development, sales and support teams; and (iv) SPO-related and acquisitions-related bonuses in the
second quarter of 2021 not occurring in the second quarter of 2020.
Personnel expenses as a percentage of revenue decreased from 35.2% in the second quarter of 2020 to
26.9% in the second quarter of 2021 on the back of the increase in revenue.
Personnel expenses (excluding share-based compensations and other items) as a percentage of revenue
decreased from 31.4% in the second quarter of 2020 to 23.1% in the second quarter of 2021 on the back
of the increase in revenue. See “Use of Non-IFRS Financial Measures” elsewhere in this release for a
reconciliation of personnel expenses (excluding share-based compensations and other items) from the
nearest IFRS measure.
Our headcount has increased to 1,280 people as of June 30, 2021 from 832 people as of December 31,
2020, mostly due to addition Zarplata.ru and Skillaz personnel.
Marketing expenses
Marketing expenses increased by ₽124 million, or 53.0%, for the three months ended June 30, 2021
compared to the three months ended June 30, 2020 primarily due to increase in marketing expense in our
“Russia (hh.ru)” segment across various channels in line with our marketing strategy, as well as due to
addition of marketing expenses of Zarplata.ru.
Marketing expenses as a percentage of revenue decreased from 15.3% in the second quarter 2020 to 9.2%
in the second quarter 2021, on the back of the increase in revenue.
Other general and administrative expenses
Total other general and administrative expenses increased by ₽249 million, or 141.6%, primarily due to: (i)
the addition of Zarplata.ru and Skillaz other general and administrative expenses; (ii) low base effect,
including out cost savings in the second quarter of 2020 not occurring in the second quarter of 2021 and
an increase in subcontractor costs in our “Russia (hh.ru)” segment on the back of the increase in revenue
from other value-added services; and (iii) SPO-related costs in the second quarter 2021 not occurring in
the second quarter of 2020.
Total other general and administrative expenses as a percentage of revenue have decreased to 10.9% in
the second quarter 2021 from 11.5% in the second quarter 2020, on the back of the increase in revenue.
Total other general and administrative expenses (excluding items unrelated to our core business activities)
as a percentage of revenue were 9.9% in the second quarter of 2021, flat compared to 10.0% in the second
quarter of 2020, as the increase in revenue was offset by increase in expenses for the reasons described
above. See “Use of Non-IFRS Financial Measures” elsewhere in this release for a reconciliation of other
general and administrative expenses (excluding items unrelated to our core business activities) from the
nearest IFRS measure.
Net foreign exchange gain
Net foreign exchange gain was ₽9 million for the three months ended June 30, 2021, compared to a
₽19 million for the three months ended June 30, 2020.
Depreciation and amortization
Depreciation and amortization were P289 million for the three months ended June 30, 2021, compared to
₽184 million for the three months ended June 30, 2020. The increase by 57.3% or ₽105 million mainly
relates to amortization of intangible assets of Zarplata.ru and Skillaz measured at fair values on acquisition.
Finance income and costs
Finance income was ₽43 million for the three months ended June 30, 2021 compared to ₽9 million for the
three months ended June 30, 2020, primarily due to an increase in interest income on cash deposits.
Finance costs were ₽157 million for the three months ended June 30, 2021, compared to ₽109 million for
the three months ended June 30, 2020. The increase of ₽49 million was primarily due to ₽64 million interest
accrued on non-convertible bonds issued in the fourth quarter 2020 to finance Zarplata.ru acquisition, partly
offset by a decrease in interest accrued on the bank loan due to a decrease in the key rate of the Central
Bank of Russia.
Income tax expense
Income tax expense increased to P414 million for the three months ended June 30, 2021 from ₽75 million
for the three months ended June 30, 2020, following an increase in revenue resulting in an increase in
taxable income.
The effective tax rate was 24.5% for the three months ended June 30, 2021, which is relatively flat
compared to 23.9% for the three months ended June 30, 2020.
Net income, Adjusted EBITDA and Adjusted Net Income
In the three months ended June 30, 2021 compared to the three months ended June 30, 2020, our net
income has increased by 435.1% to ₽1,279 million, our Adjusted EBITDA has increased by 239.9% to
₽2,264 million, and our Adjusted Net Income has increased by 347.1% to ₽1,603 million, primarily due to
the reasons described above.
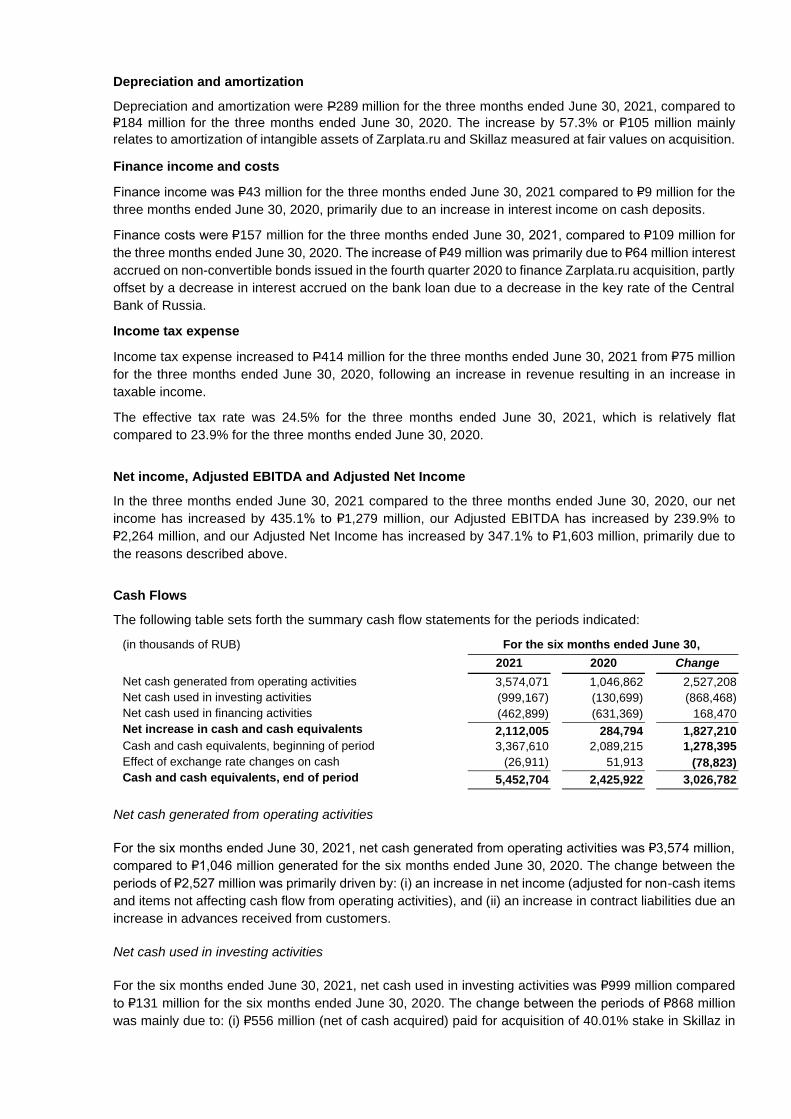
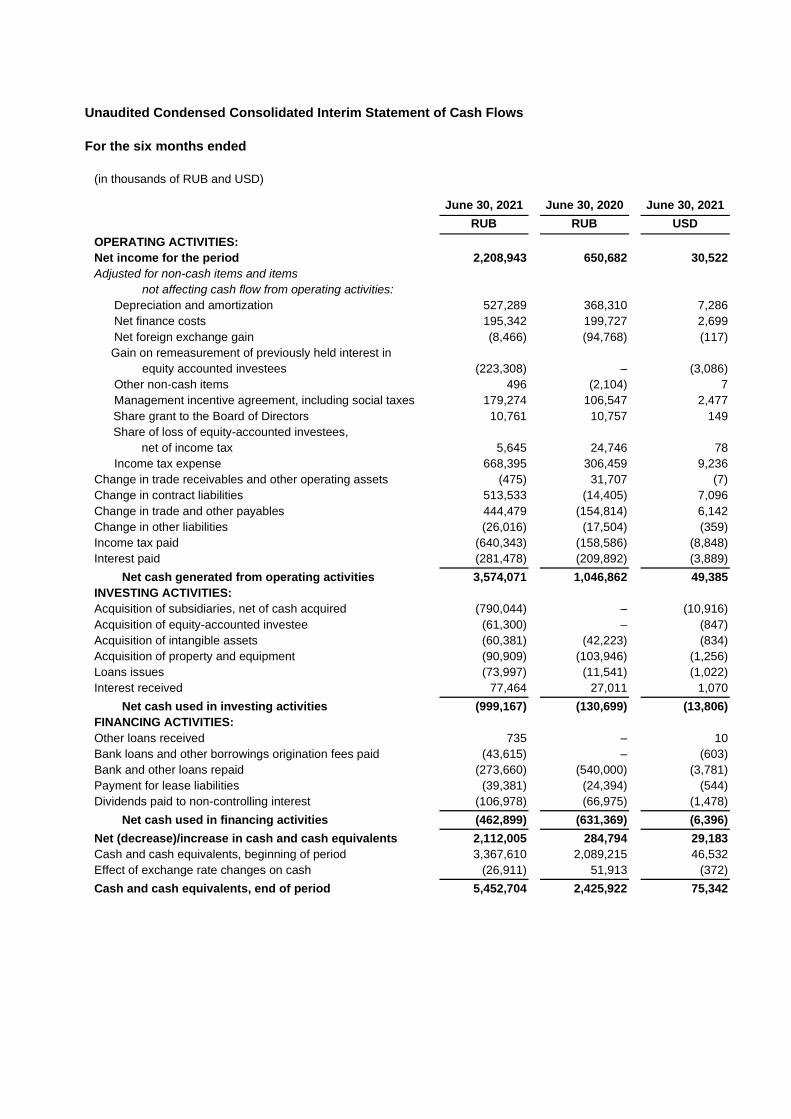
Cash Flows
The following table sets forth the summary cash flow statements for the periods indicated:
(in thousands of RUB) For the six months ended June 30,
2021 2020 Change
Net cash generated from operating activities 3,574,071 1,046,862 2,527,208
Net cash used in investing activities (999,167) (130,699) (868,468)
Net cash used in financing activities (462,899) (631,369) 168,470
Net increase in cash and cash equivalents 2,112,005 284,794 1,827,210
Cash and cash equivalents, beginning of period 3,367,610 2,089,215 1,278,395
Effect of exchange rate changes on cash (26,911) 51,913 (78,823)
Cash and cash equivalents, end of period 5,452,704 2,425,922 3,026,782
Net cash generated from operating activities
For the six months ended June 30, 2021, net cash generated from operating activities was ₽3,574 million,
compared to ₽1,046 million generated for the six months ended June 30, 2020. The change between the
periods of ₽2,527 million was primarily driven by: (i) an increase in net income (adjusted for non-cash items
and items not affecting cash flow from operating activities), and (ii) an increase in contract liabilities due an
increase in advances received from customers.
Net cash used in investing activities
For the six months ended June 30, 2021, net cash used in investing activities was ₽999 million compared
to ₽131 million for the six months ended June 30, 2020. The change between the periods of ₽868 million
was mainly due to: (i) ₽556 million (net of cash acquired) paid for acquisition of 40.01% stake in Skillaz in
the second quarter of 2021; (ii) ₽234 million deferred consideration paid in the first quarter of 2021 for
acquisition of Zarplata.ru; (iii) ₽61 million paid in the second quarter of 2021 for acquisition of 25% in the
charter capital of Dream Job LLC (Russia); and (iv) issue of a loan to a third party in May 2021 in the
amount of ₽74 million on market conditions.
Net cash used in financing activities
For the six months ended June 30, 2021, net cash used in financing activities was ₽463 million compared
to ₽631 million for the six months ended June 30, 2020. The change between the periods of ₽168 million
was primarily due to the decrease in bank and other loans repaid due to the change in our bank loan
amortization schedule in 2020, which was partly offset by the increase of dividends paid to non-controlling
interest by ₽40 million.
Capital Expenditures
Our additions to property and equipment and intangible assets for the six months ended June 30, 2021
were ₽699 million compared to ₽143 million for the six months ended June 30, 2020, representing an
increase of ₽556 million primarily due to acquisition of intangible assets relating to Skillaz in the amount of
₽552 million.
Dividend
In July 2021 we have settled the previously announced dividend for the year ended December 31, 2020 of
$0.55 per share representing approximately 75% of our Adjusted Net Income for the year ended December
31, 2020.
2021 RSU Plan
On July 30, 2021, we established a new HeadHunter Group PLC 2021 Restricted Stock Units Plan (the
"2021 RSU Plan") to provide a more straight-forward, predictable, and competitive long-term motivation
model to our key talent. Prior to this, our management incentive program has included the 2016 Unit Option
Plan (the “2016 Plan”), which is focused mostly on our top management level, , as well as the 2018 Unit
Option Plan (the “2018 Plan”). There are no awards remaining for granting under the 2016 Plan and awards
outstanding under the 2016 Plan have vesting dates through May 2023. In connection with the
establishment of the 2021 RSU Plan, our Board of Directors determined that certain awards previously
granted under the 2018 Plan shall be replaced with awards under the 2021 RSU Plan.
Under the 2021 RSU Plan, the Company shall issue restricted stock units (“RSUs”) carrying the right to
receive either ordinary shares or ADSs representing such ordinary shares. The maximum number of shares
provided under the 2021 RSU Plan is 6% of the fully diluted aggregate number of ordinary shares issued
and outstanding from time to time. Awards under the 2021 RSU Plan are expected to be granted in tranches
during the 4-year period expiring August 1, 2025. Each grant will be subject to approval by our Board of
Directors upon the recommendation of our management and the Compensation Committee, based on
certain selection criteria. RSUs granted under the 2021 RSU Plan vest over 4-year period commencing on
the grant date, with the first vesting occurring on the first anniversary of the grant date. The 2021 RSU Plan
will reward, among others, our key talent in development, product, sales and marketing teams.
We plan to fund the 2021 RSU Plan through a combination of a buy-back program, as was recently
approved by our shareholders, and new share issuance and allotment.
The establishment of the 2021 RSU Plan had no impact on our financial results for the second quarter of
2021.
Financial Outlook
The following forward-looking statement reflects our expectations as of August 16, 2021:
We currently expect our revenue to grow in the range of 63% to 68% in year 2021 year-over-year compared
to the year 2020.
This outlook reflects our current view, based on the trends that we see at this time, and may change
considering market, economic and social developments in jurisdictions in which we operate.
Second Quarter 2021 Financial Results Conference Call
HeadHunter will host a conference call and webcast to discuss its results at 9:00 a.m. U.S. Eastern Time
(4:00 p.m. Moscow time, 2:00 p.m. London time) the same day.
We recommend to use the dial-in option only if you would like to ask questions. In this case please dial in
at least 15 minutes prior to the call start time and clearly state the requested information. For listen only
mode, please use the webcast link. The earnings release can be accessed through our website
at https://investor.hh.ru/. Following the call, a replay will be available on our website.
To participate in the conference call, please use the following details: Standard International: +44 (0) 2071 928338 UK (local): +44 (0) 8444 819752 UK (toll free): 0800 279 6619 USA (local): +1 646 741 3167 USA (toll free): +1 877 870 9135 Russian Federation (local): +7 495 249 9851 Russian Federation (toll free): 810 800 2114 4011 Conference ID: 5579793 Webcast: https://edge.media-server.com/mmc/p/spm5gzm3 Contacts: Investor Inquiries Arman Arutyunian E-mail: [email protected] Media Inquiries Alexander Dzhabarov E-mail: [email protected]
About HeadHunter Group PLC
HeadHunter is the leading online recruitment platform in Russia and the Commonwealth of Independent
States focused on providing comprehensive talent acquisition services, such as access to extensive CV
database, job postings (jobs classifieds platform) and a portfolio of value-added services.
USE OF NON-IFRS FINANCIAL MEASURES
To supplement our consolidated financial statements, which is prepared in accordance with International
Financial Reporting Standards (“IFRS”) as issued by the International Accounting Standards Board
(“IASB”), we present the following non-IFRS1 financial measures: Adjusted EBITDA, Adjusted Net Income,
Adjusted EBITDA Margin, Adjusted Net Income Margin, Adjusted Operating Costs and Expenses
(Exclusive of Depreciation and Amortization), Net Working Capital, Net Debt and Net Debt to Adjusted
EBITDA Ratio. The presentation of these financial measures is not intended to be considered in isolation
or as a substitute for, or superior to, the financial information prepared and presented in accordance with
IFRS. For more information on these non-IFRS financial measures, please see the tables captioned
“Reconciliations of non-IFRS financial measures from the nearest comparable IFRS measures”, included
following the accompanying financial tables. We define the various non-IFRS financial measures we use
as follows:
● “Adjusted EBITDA” as net income/(loss) plus: (1) income tax expense; (2) net interest costs; (3)
depreciation and amortization; (4) expenses related to equity-settled awards, including related
social taxes; (5) secondary public offering (“SPO”) related costs; (6) transaction costs related to
business combinations; (7) insurance expenses related to IPO; (8) (income) from the depositary;
(9) net foreign exchange loss gain; (10) (Gain) on remeasurement of previously held interest in
equity-accounted investees; (11) net (gain)/loss on financial assets measured at fair value through
profit and loss; (12) share of (profit)/loss of equity-accounted investees.
● “Adjusted Net Income” as net income/(loss) plus: (1) ) expenses related to equity-settled awards,
including related social taxes; (2) secondary public offering (“SPO”) related costs; (3) transaction
costs related to business combinations; (4) insurance expenses related to IPO; (5) (income) from
the depositary; (6) net foreign exchange gain; (7) (gain) on remeasurement of previously held
interest in equity-accounted investees; (8) net (gain)/loss on financial assets measured at fair value
through profit and loss; (9) share of (profit)/loss of equity-accounted investees; (10) amortization of
intangible assets recognized in business combinations; (11) tax effect on adjustments.
● “Adjusted EBITDA Margin” as Adjusted EBITDA divided by revenue.
● “Adjusted Net Income Margin” as Adjusted Net Income divided by revenue.
● “Adjusted Operating Costs and Expenses (Exclusive of Depreciation and Amortization)” as
operating costs and expenses (exclusive of depreciation and amortization) plus: (1) expenses
related to equity-settled awards, including related social taxes; (2) insurance expenses related to
IPO; (3) transaction costs related to business combinations; (4) secondary public offering (“SPO”)
related costs.
● “Net Working Capital” calculated as a sum of: (1) Trade and other receivables and (2) Prepaid
expenses and other current assets; less a sum of: (1) Contract liabilities (current); (2) Trade and
other payables (current) and (3) Other current liabilities.
● “Net Debt” calculated as a sum of current and non-current part of Loans and borrowings minus
Cash and cash equivalents.
● “Net Debt to Adjusted EBITDA Ratio” calculated by dividing Net Debt by Adjusted EBITDA.
Adjusted EBITDA, Adjusted Net Income, Adjusted EBITDA Margin, Adjusted Net Income Margin and
Adjusted Operating Costs and Expenses (Exclusive of Depreciation and Amortization) are used by our
management to monitor the underlying performance of the business and its operations. Adjusted EBITDA,
1 Denotes International Financial Reporting Standards as issued by the International Accounting Standards Board (“IASB”).
Adjusted Net Income, Adjusted EBITDA Margin, Adjusted Net Income Margin and Adjusted Operating
Costs and Expenses (Exclusive of Depreciation and Amortization) are used by different companies for
differing purposes and are often calculated in ways that reflect the circumstances of those companies. You
should exercise caution in comparing Adjusted EBITDA, Adjusted Net Income, Adjusted EBITDA Margin,
Adjusted Net Income Margin and Adjusted Operating Costs and Expenses (Exclusive of Depreciation and
Amortization) as reported by us to Adjusted EBITDA, Adjusted Net Income, Adjusted EBITDA Margin,
Adjusted Net Income Margin and Adjusted Operating Costs and Expenses (Exclusive of Depreciation and
Amortization) as reported by other companies. Adjusted EBITDA, Adjusted Net Income, Adjusted EBITDA
Margin, Adjusted Net Income Margin and Adjusted Operating Costs and Expenses (Exclusive of
Depreciation and Amortization) are unaudited and have not been prepared in accordance with IFRS or any
other generally accepted accounting principles.
Adjusted EBITDA, Adjusted Net Income, Adjusted EBITDA Margin, Adjusted Net Income Margin and
Adjusted Operating Costs and Expenses (Exclusive of Depreciation and Amortization) are not
measurements of performance under IFRS or any other generally accepted accounting principles, and you
should not consider Adjusted EBITDA, Adjusted Net Income, Adjusted EBITDA Margin, Adjusted Net
Income Margin and Adjusted Operating Costs and Expenses (Exclusive of Depreciation and Amortization)
as alternatives to net income, operating profit or other financial measures determined in accordance with
IFRS or other generally accepted accounting principles. Adjusted EBITDA, Adjusted Net Income, Adjusted
EBITDA Margin, Adjusted Net Income Margin and Adjusted Operating Costs and Expenses (Exclusive of
Depreciation and Amortization) have limitations as analytical tools, and you should not consider them in
isolation. Some of these limitations are:
● Adjusted EBITDA, Adjusted Net Income, Adjusted EBITDA Margin, Adjusted Net Income Margin
and Adjusted Operating Costs and Expenses (Exclusive of Depreciation and Amortization) do not
reflect our cash expenditures or future requirements for capital expenditures or contractual
commitments,
● Adjusted EBITDA, Adjusted Net Income, Adjusted EBITDA Margin, Adjusted Net Income Margin
and Adjusted Operating Costs and Expenses (Exclusive of Depreciation and Amortization) do not
reflect changes in, or cash requirements for, our working capital needs, and
● the fact that other companies in our industry may calculate Adjusted EBITDA, Adjusted Net Income,
Adjusted EBITDA Margin, Adjusted Net Income Margin and Adjusted Operating Costs and
Expenses (Exclusive of Depreciation and Amortization) differently than we do, which limits their
usefulness as comparative measures.
The tables at the end of this release provide detailed reconciliations of each non-IFRS financial measure
we use from the most directly comparable IFRS financial measure.
We provide earnings guidance on a non-IFRS basis and do not provide earnings guidance on an IFRS
basis. A reconciliation of our Adjusted EBITDA Margin guidance to the most directly comparable IFRS
financial measure cannot be provided without unreasonable efforts and is not provided herein because of
the inherent difficulty in forecasting and quantifying certain amounts that are necessary for such
reconciliations, including depreciation and amortization, expenses related to equity-settled awards and the
other adjustments reflected in our reconciliation of historical non-IFRS financial measures, the amounts of
which, could be material.
Adjusted Operating Costs and Expenses (Exclusive of Depreciation and Amortization)
Adjusted Operating Costs and Expenses (Exclusive of Depreciation and Amortization) is a financial
measure not defined under IFRS. We believe that Adjusted Operating Costs and Expenses (Exclusive of
Depreciation and Amortization) is a useful metric to assess our operating activities. We excluded expenses
incurred in connection with potential financing and strategic transactions, including IPO and SPO- related
expenses that are not indicative of our ongoing expenses. We also excluded equity-settled awards as these
are non-cash expenses and highly dependent on our share price at the time of equity award grants.
Therefore, we believe that it is useful for investors and analysts to see operating costs and expenses
financial measures excluding the impact of these charges in order to obtain a clearer picture of our operating
activity. Other companies in our industry may calculate these measures differently than we do, limiting their
usefulness as comparative measures. See the tables at the end of this release providing the calculation of
Adjusted Operating Costs and Expenses (Exclusive of Depreciation and Amortization).
Net Working Capital
Net Working Capital is a financial measure not defined under IFRS. We believe that Net Working Capital is
a useful metric to assess our ability to service debt, fund new investment opportunities, distribute dividends
to our shareholders and assess our working capital requirements. Other companies in our industry may
calculate these measures differently than we do, limiting their usefulness as comparative measures. See
the tables at the end of this release providing the calculation of Net Working Capital.
Net Debt and Net Debt to Adjusted EBITDA Ratio
Net Debt and Net Debt to Adjusted EBITDA Ratio are financial measures not defined under IFRS. We
believe that Net Debt and Net Debt to Adjusted EBITDA Ratio are important measures that indicate our
ability to repay outstanding debt. These measures should not be considered in isolation or as a substitute
for any standardized measure under IFRS. Other companies in our industry may calculate these measures
differently than we do, limiting their usefulness as comparative measures. See the tables at the end of this
release providing the calculation of Net Debt and discussion of Net Debt to Adjusted EBITDA Ratio.
FORWARD-LOOKING STATEMENTS
This press release contains forward-looking statements within the meaning of the Private Securities
Litigation Reform Act of 1995. All statements contained in this release that do not relate to matters of
historical fact should be considered forward-looking statements, including, without limitation, statements
regarding our expected financial performance and operational performance for the year ending December
31, 2021, the anticipated impact of the COVID-19 pandemic on our business and results of operations, the
sufficiency of our resources and our ability to finance our operations for the foreseeable future, as well as
statements that include the words “expect,” “intend,” “plan,” “believe,” “project,” “forecast,” “estimate,”
“may,” “should,” “anticipate” and similar statements of a future or forward-looking nature. These forward-
looking statements are based on management’s current expectations. Actual results may differ materially
from the results predicted or implied by such statements, and our reported results should not be considered
as an indication of future performance. The potential risks and uncertainties that could cause actual results
to differ from the results predicted or implied by such statements include, among others, significant
competition in our markets, our ability to maintain and enhance our brand, our ability to improve our user
experience and product offerings, our ability to respond to industry developments, our reliance on Russian
Internet infrastructure, macroeconomic and global geopolitical developments affecting the Russian
economy or our business, including the impact of the COVID-19 pandemic, changes in the political, legal
and/or regulatory environment, privacy and data protection concerns and our need to expend capital to
accommodate the growth of the business, as well as those risks and uncertainties included under the
caption “Risk Factors” in our Annual Report on Form 20-F for the year ended December 31, 2020, as such
factors may be updated from time to time in our other filings with the U.S. Securities and Exchange
Commission (“SEC”), each of which is on file with the SEC and is available on the SEC website at
www.sec.gov. In addition, we operate in a very competitive and rapidly changing environment. New risks
emerge from time to time. It is not possible for our management to predict all risks, nor can we assess the
impact of all factors on our business or the extent to which any factor, or combination of factors, may cause
actual results to differ materially from those contained in any forward-looking statements that we may make.
In light of these risks, uncertainties and assumptions, the forward-looking events and circumstances
discussed in this release are inherently uncertain and may not occur, and actual results could differ
materially and adversely from those anticipated or implied in the forward-looking statements. Accordingly,
you should not rely upon forward-looking statements as predictions of future events. In addition, the
forward-looking statements made in this release relate only to events or information as of the date on which
the statements are made in this release. Except as required by law, we undertake no obligation to update
or revise publicly any forward-looking statements, whether as a result of new information, future events or
otherwise, after the date on which the statements are made or to reflect the occurrence of unanticipated
events.
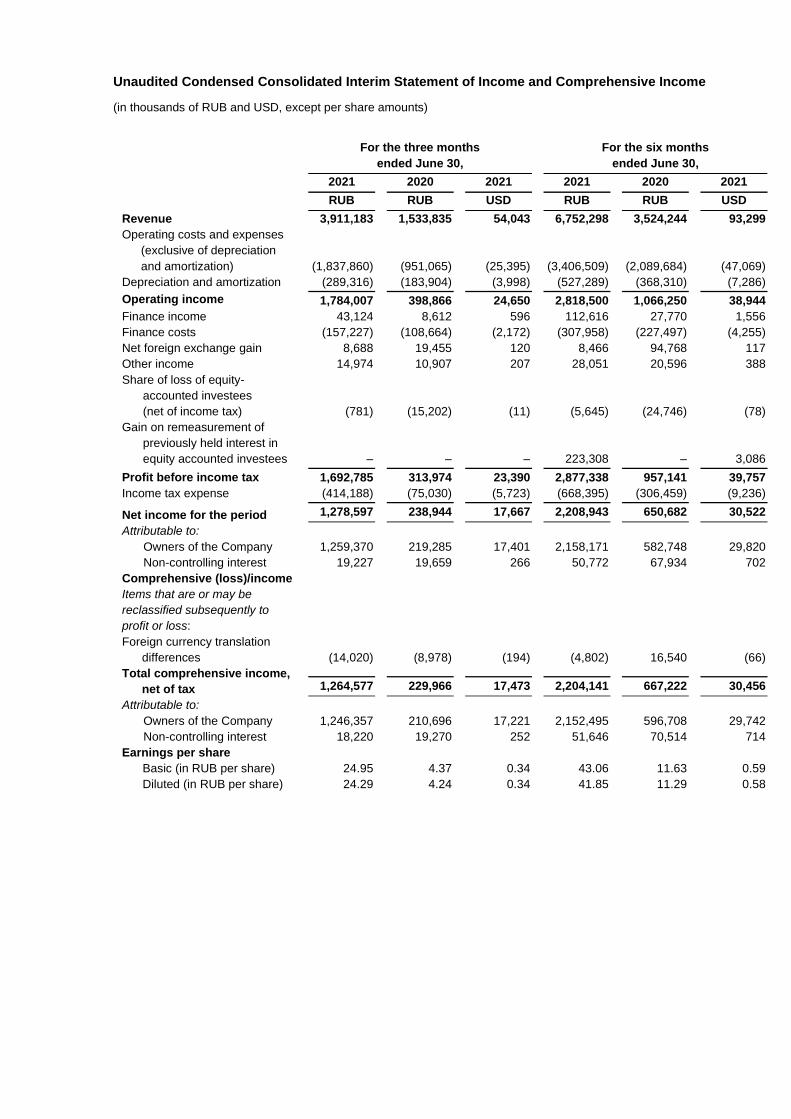
Unaudited Condensed Consolidated Interim Statement of Income and Comprehensive Income
(in thousands of RUB and USD, except per share amounts)
For the three months
ended June 30,
For the six months
ended June 30,
2021 2020 2021 2021 2020 2021
RUB RUB USD RUB RUB USD
Revenue 3,911,183 1,533,835 54,043 6,752,298 3,524,244 93,299
Operating costs and expenses
(exclusive of depreciation
and amortization) (1,837,860) (951,065) (25,395) (3,406,509) (2,089,684) (47,069)
Depreciation and amortization (289,316) (183,904) (3,998) (527,289) (368,310) (7,286)
Operating income 1,784,007 398,866 24,650 2,818,500 1,066,250 38,944
Finance income 43,124 8,612 596 112,616 27,770 1,556
Finance costs (157,227) (108,664) (2,172) (307,958) (227,497) (4,255)
Net foreign exchange gain 8,688 19,455 120 8,466 94,768 117
Other income 14,974 10,907 207 28,051 20,596 388
Share of loss of equity-
accounted investees
(net of income tax) (781) (15,202) (11) (5,645) (24,746) (78)
Gain on remeasurement of
previously held interest in
equity accounted investees – – – 223,308 – 3,086
Profit before income tax 1,692,785 313,974 23,390 2,877,338 957,141 39,757
Income tax expense (414,188) (75,030) (5,723) (668,395) (306,459) (9,236)
Net income for the period 1,278,597 238,944 17,667 2,208,943 650,682 30,522
Attributable to:
Owners of the Company 1,259,370 219,285 17,401 2,158,171 582,748 29,820
Non-controlling interest 19,227 19,659 266 50,772 67,934 702
Comprehensive (loss)/income
Items that are or may be
reclassified subsequently to
profit or loss:
Foreign currency translation
differences (14,020) (8,978) (194) (4,802) 16,540 (66)
Total comprehensive income,
net of tax 1,264,577 229,966 17,473 2,204,141 667,222 30,456
Attributable to:
Owners of the Company 1,246,357 210,696 17,221 2,152,495 596,708 29,742
Non-controlling interest 18,220 19,270 252 51,646 70,514 714
Earnings per share
Basic (in RUB per share) 24.95 4.37 0.34 43.06 11.63 0.59
Diluted (in RUB per share) 24.29 4.24 0.34 41.85 11.29 0.58
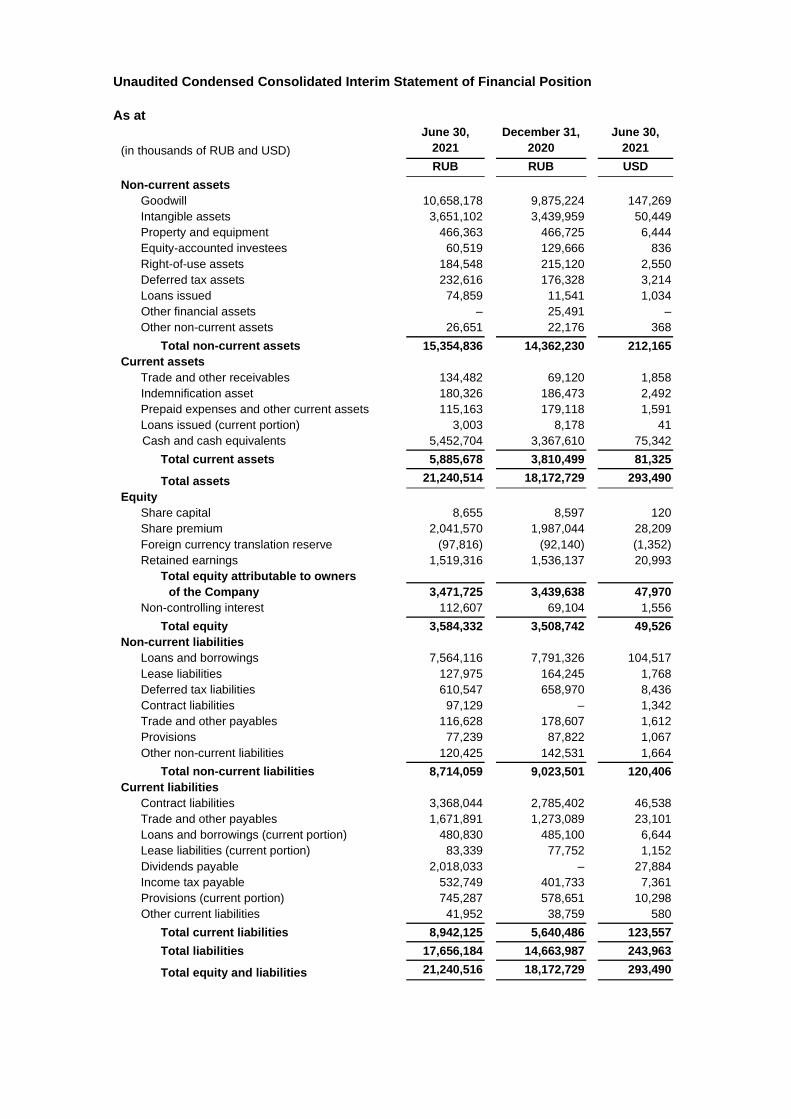
Unaudited Condensed Consolidated Interim Statement of Financial Position
As at
(in thousands of RUB and USD)
June 30,
2021
December 31,
2020
June 30,
2021
RUB RUB USD
Non-current assets
Goodwill 10,658,178 9,875,224 147,269
Intangible assets 3,651,102 3,439,959 50,449
Property and equipment 466,363 466,725 6,444
Equity-accounted investees 60,519 129,666 836
Right-of-use assets 184,548 215,120 2,550
Deferred tax assets 232,616 176,328 3,214
Loans issued 74,859 11,541 1,034
Other financial assets – 25,491 –
Other non-current assets 26,651 22,176 368
Total non-current assets 15,354,836 14,362,230 212,165
Current assets
Trade and other receivables 134,482 69,120 1,858
Indemnification asset 180,326 186,473 2,492
Prepaid expenses and other current assets 115,163 179,118 1,591
Loans issued (current portion) 3,003 8,178 41
Cash and cash equivalents 5,452,704 3,367,610 75,342
Total current assets 5,885,678 3,810,499 81,325
Total assets 21,240,514 18,172,729 293,490
Equity
Share capital 8,655 8,597 120
Share premium 2,041,570 1,987,044 28,209
Foreign currency translation reserve (97,816) (92,140) (1,352)
Retained earnings 1,519,316 1,536,137 20,993
Total equity attributable to owners
of the Company 3,471,725 3,439,638 47,970
Non-controlling interest 112,607 69,104 1,556
Total equity 3,584,332 3,508,742 49,526
Non-current liabilities
Loans and borrowings 7,564,116 7,791,326 104,517
Lease liabilities 127,975 164,245 1,768
Deferred tax liabilities 610,547 658,970 8,436
Contract liabilities 97,129 – 1,342
Trade and other payables 116,628 178,607 1,612
Provisions 77,239 87,822 1,067
Other non-current liabilities 120,425 142,531 1,664
Total non-current liabilities 8,714,059 9,023,501 120,406
Current liabilities
Contract liabilities 3,368,044 2,785,402 46,538
Trade and other payables 1,671,891 1,273,089 23,101
Loans and borrowings (current portion) 480,830 485,100 6,644
Lease liabilities (current portion) 83,339 77,752 1,152
Dividends payable 2,018,033 – 27,884
Income tax payable 532,749 401,733 7,361
Provisions (current portion) 745,287 578,651 10,298
Other current liabilities 41,952 38,759 580
Total current liabilities 8,942,125 5,640,486 123,557
Total liabilities 17,656,184 14,663,987 243,963
Total equity and liabilities 21,240,516 18,172,729 293,490
Unaudited Condensed Consolidated Interim Statement of Cash Flows
For the six months ended
(in thousands of RUB and USD)
June 30, 2021 June 30, 2020 June 30, 2021
RUB RUB USD
OPERATING ACTIVITIES:
Net income for the period 2,208,943 650,682 30,522
Adjusted for non-cash items and items
not affecting cash flow from operating activities:
Depreciation and amortization 527,289 368,310 7,286
Net finance costs 195,342 199,727 2,699
Net foreign exchange gain (8,466) (94,768) (117)
Gain on remeasurement of previously held interest in
equity accounted investees (223,308) – (3,086)
Other non-cash items 496 (2,104) 7
Management incentive agreement, including social taxes 179,274 106,547 2,477
Share grant to the Board of Directors 10,761 10,757 149
Share of loss of equity-accounted investees,
net of income tax 5,645 24,746 78
Income tax expense 668,395 306,459 9,236
Change in trade receivables and other operating assets (475) 31,707 (7)
Change in contract liabilities 513,533 (14,405) 7,096
Change in trade and other payables 444,479 (154,814) 6,142
Change in other liabilities (26,016) (17,504) (359)
Income tax paid (640,343) (158,586) (8,848)
Interest paid (281,478) (209,892) (3,889)
Net cash generated from operating activities 3,574,071 1,046,862 49,385
INVESTING ACTIVITIES:
Acquisition of subsidiaries, net of cash acquired (790,044) – (10,916)
Acquisition of equity-accounted investee (61,300) – (847)
Acquisition of intangible assets (60,381) (42,223) (834)
Acquisition of property and equipment (90,909) (103,946) (1,256)
Loans issues (73,997) (11,541) (1,022)
Interest received 77,464 27,011 1,070
Net cash used in investing activities (999,167) (130,699) (13,806)
FINANCING ACTIVITIES:
Other loans received 735 – 10
Bank loans and other borrowings origination fees paid (43,615) – (603)
Bank and other loans repaid (273,660) (540,000) (3,781)
Payment for lease liabilities (39,381) (24,394) (544)
Dividends paid to non-controlling interest (106,978) (66,975) (1,478)
Net cash used in financing activities (462,899) (631,369) (6,396)
Net (decrease)/increase in cash and cash equivalents 2,112,005 284,794 29,183
Cash and cash equivalents, beginning of period 3,367,610 2,089,215 46,532
Effect of exchange rate changes on cash (26,911) 51,913 (372)
Cash and cash equivalents, end of period 5,452,704 2,425,922 75,342
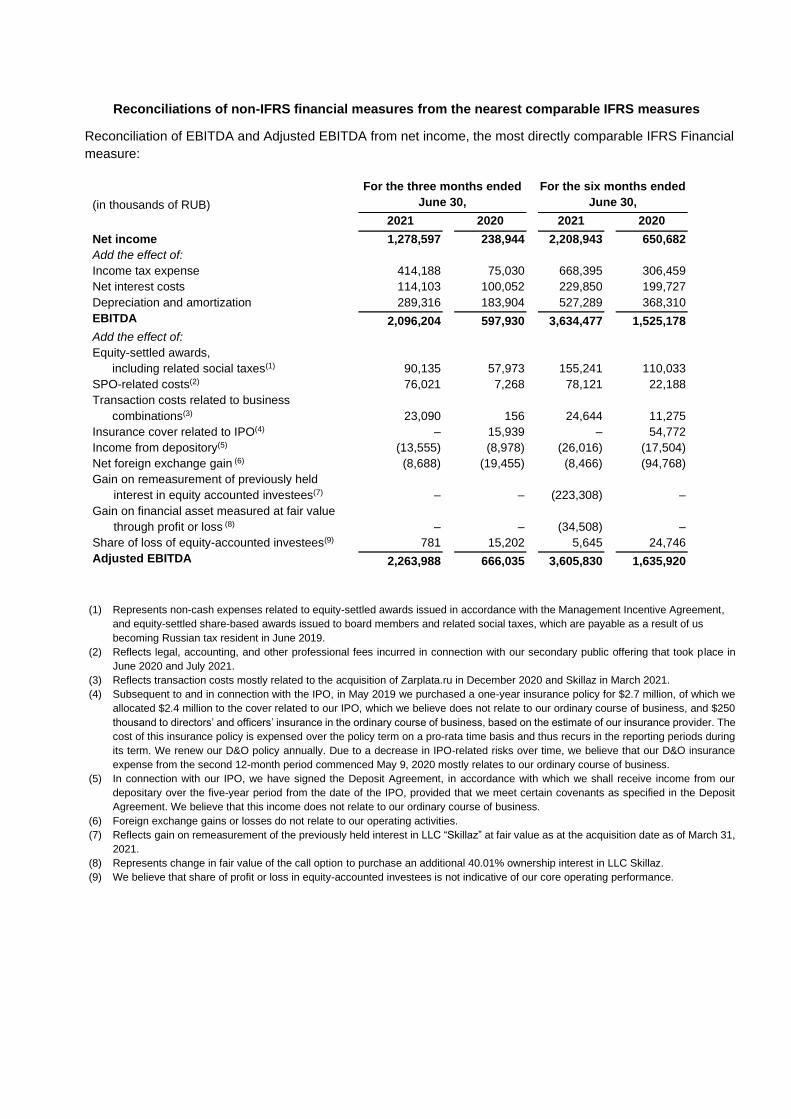
Reconciliations of non-IFRS financial measures from the nearest comparable IFRS measures
Reconciliation of EBITDA and Adjusted EBITDA from net income, the most directly comparable IFRS Financial
measure:
(in thousands of RUB)
For the three months ended
June 30,
For the six months ended
June 30,
2021 2020 2021 2020
Net income 1,278,597 238,944 2,208,943 650,682
Add the effect of:
Income tax expense 414,188 75,030 668,395 306,459
Net interest costs 114,103 100,052 229,850 199,727
Depreciation and amortization 289,316 183,904 527,289 368,310
EBITDA 2,096,204 597,930 3,634,477 1,525,178
Add the effect of:
Equity-settled awards,
including related social taxes(1) 90,135 57,973 155,241 110,033
SPO-related costs(2) 76,021 7,268 78,121 22,188
Transaction costs related to business
combinations(3) 23,090 156 24,644 11,275
Insurance cover related to IPO(4) – 15,939 – 54,772
Income from depository(5) (13,555) (8,978) (26,016) (17,504)
Net foreign exchange gain (6) (8,688) (19,455) (8,466) (94,768)
Gain on remeasurement of previously held
interest in equity accounted investees(7) – – (223,308) –
Gain on financial asset measured at fair value
through profit or loss (8) – – (34,508) –
Share of loss of equity-accounted investees(9) 781 15,202 5,645 24,746
Adjusted EBITDA 2,263,988 666,035 3,605,830 1,635,920
(1) Represents non-cash expenses related to equity-settled awards issued in accordance with the Management Incentive Agreement,
and equity-settled share-based awards issued to board members and related social taxes, which are payable as a result of us
becoming Russian tax resident in June 2019.
(2) Reflects legal, accounting, and other professional fees incurred in connection with our secondary public offering that took place in
June 2020 and July 2021.
(3) Reflects transaction costs mostly related to the acquisition of Zarplata.ru in December 2020 and Skillaz in March 2021.
(4) Subsequent to and in connection with the IPO, in May 2019 we purchased a one-year insurance policy for $2.7 million, of which we
allocated $2.4 million to the cover related to our IPO, which we believe does not relate to our ordinary course of business, and $250
thousand to directors’ and officers’ insurance in the ordinary course of business, based on the estimate of our insurance provider. The
cost of this insurance policy is expensed over the policy term on a pro-rata time basis and thus recurs in the reporting periods during
its term. We renew our D&O policy annually. Due to a decrease in IPO-related risks over time, we believe that our D&O insurance
expense from the second 12-month period commenced May 9, 2020 mostly relates to our ordinary course of business.
(5) In connection with our IPO, we have signed the Deposit Agreement, in accordance with which we shall receive income from our
depositary over the five-year period from the date of the IPO, provided that we meet certain covenants as specified in the Deposit
Agreement. We believe that this income does not relate to our ordinary course of business.
(6) Foreign exchange gains or losses do not relate to our operating activities.
(7) Reflects gain on remeasurement of the previously held interest in LLC “Skillaz” at fair value as at the acquisition date as of March 31,
2021.
(8) Represents change in fair value of the call option to purchase an additional 40.01% ownership interest in LLC Skillaz.
(9) We believe that share of profit or loss in equity-accounted investees is not indicative of our core operating performance.
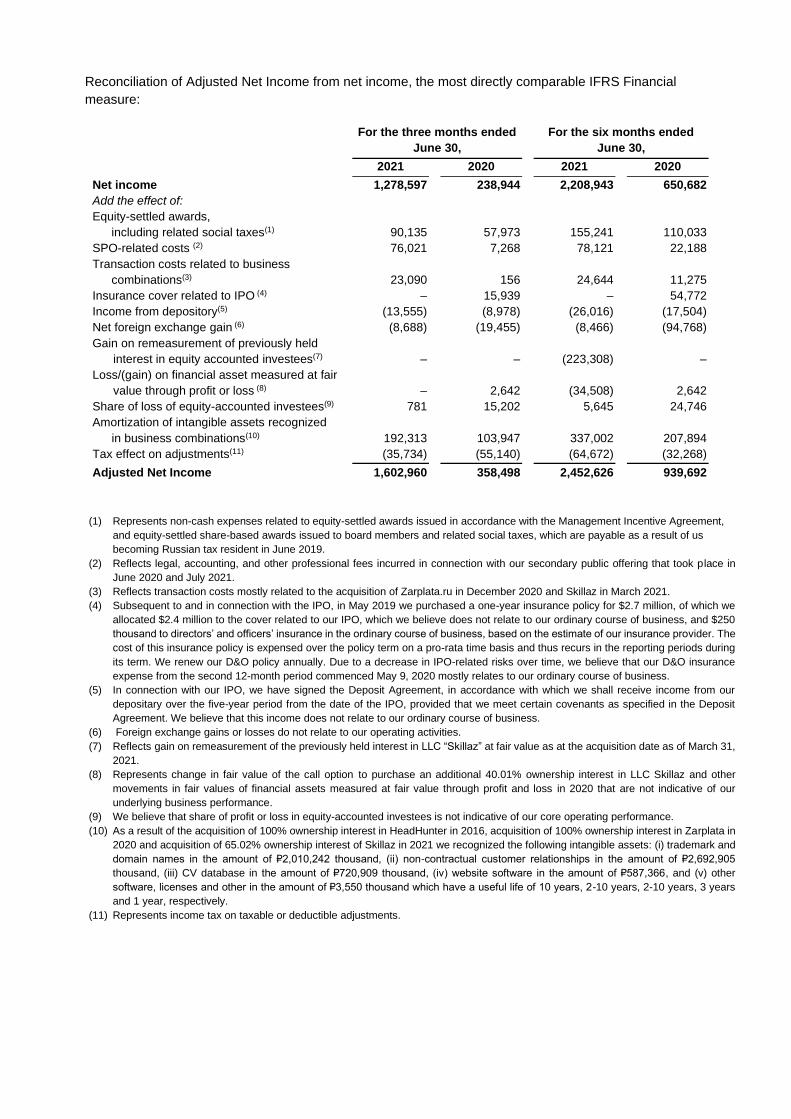
Reconciliation of Adjusted Net Income from net income, the most directly comparable IFRS Financial
measure:
For the three months ended
June 30,
For the six months ended
June 30,
2021 2020 2021 2020
Net income 1,278,597 238,944 2,208,943 650,682
Add the effect of:
Equity-settled awards,
including related social taxes(1) 90,135 57,973 155,241 110,033
SPO-related costs (2) 76,021 7,268 78,121 22,188
Transaction costs related to business
combinations(3) 23,090 156 24,644 11,275
Insurance cover related to IPO (4) – 15,939 – 54,772
Income from depository(5) (13,555) (8,978) (26,016) (17,504)
Net foreign exchange gain (6) (8,688) (19,455) (8,466) (94,768)
Gain on remeasurement of previously held
interest in equity accounted investees(7) – – (223,308) –
Loss/(gain) on financial asset measured at fair
value through profit or loss (8) – 2,642 (34,508) 2,642
Share of loss of equity-accounted investees(9) 781 15,202 5,645 24,746
Amortization of intangible assets recognized
in business combinations(10) 192,313 103,947 337,002 207,894
Tax effect on adjustments(11) (35,734) (55,140) (64,672) (32,268)
Adjusted Net Income 1,602,960 358,498 2,452,626 939,692
(1) Represents non-cash expenses related to equity-settled awards issued in accordance with the Management Incentive Agreement,
and equity-settled share-based awards issued to board members and related social taxes, which are payable as a result of us
becoming Russian tax resident in June 2019.
(2) Reflects legal, accounting, and other professional fees incurred in connection with our secondary public offering that took place in
June 2020 and July 2021.
(3) Reflects transaction costs mostly related to the acquisition of Zarplata.ru in December 2020 and Skillaz in March 2021.
(4) Subsequent to and in connection with the IPO, in May 2019 we purchased a one-year insurance policy for $2.7 million, of which we
allocated $2.4 million to the cover related to our IPO, which we believe does not relate to our ordinary course of business, and $250
thousand to directors’ and officers’ insurance in the ordinary course of business, based on the estimate of our insurance provider. The
cost of this insurance policy is expensed over the policy term on a pro-rata time basis and thus recurs in the reporting periods during
its term. We renew our D&O policy annually. Due to a decrease in IPO-related risks over time, we believe that our D&O insurance
expense from the second 12-month period commenced May 9, 2020 mostly relates to our ordinary course of business.
(5) In connection with our IPO, we have signed the Deposit Agreement, in accordance with which we shall receive income from our
depositary over the five-year period from the date of the IPO, provided that we meet certain covenants as specified in the Deposit
Agreement. We believe that this income does not relate to our ordinary course of business.
(6) Foreign exchange gains or losses do not relate to our operating activities.
(7) Reflects gain on remeasurement of the previously held interest in LLC “Skillaz” at fair value as at the acquisition date as of March 31,
2021.
(8) Represents change in fair value of the call option to purchase an additional 40.01% ownership interest in LLC Skillaz and other
movements in fair values of financial assets measured at fair value through profit and loss in 2020 that are not indicative of our
underlying business performance.
(9) We believe that share of profit or loss in equity-accounted investees is not indicative of our core operating performance.
(10) As a result of the acquisition of 100% ownership interest in HeadHunter in 2016, acquisition of 100% ownership interest in Zarplata in
2020 and acquisition of 65.02% ownership interest of Skillaz in 2021 we recognized the following intangible assets: (i) trademark and
domain names in the amount of ₽2,010,242 thousand, (ii) non-contractual customer relationships in the amount of ₽2,692,905
thousand, (iii) CV database in the amount of ₽720,909 thousand, (iv) website software in the amount of ₽587,366, and (v) other
software, licenses and other in the amount of ₽3,550 thousand which have a useful life of 10 years, 2-10 years, 2-10 years, 3 years
and 1 year, respectively.
(11) Represents income tax on taxable or deductible adjustments.
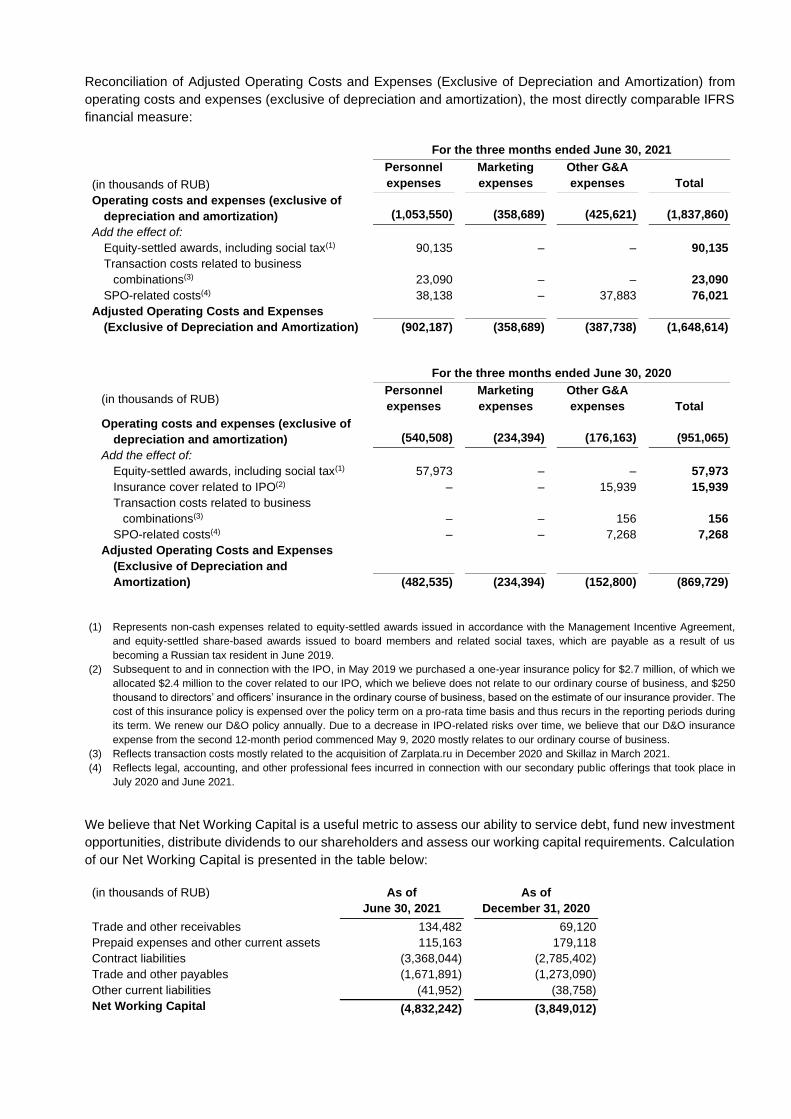
Reconciliation of Adjusted Operating Costs and Expenses (Exclusive of Depreciation and Amortization) from
operating costs and expenses (exclusive of depreciation and amortization), the most directly comparable IFRS
financial measure:
For the three months ended June 30, 2021
(in thousands of RUB)
Personnel
expenses
Marketing
expenses
Other G&A
expenses Total
Operating costs and expenses (exclusive of
depreciation and amortization) (1,053,550) (358,689) (425,621) (1,837,860)
Add the effect of:
Equity-settled awards, including social tax(1) 90,135 – – 90,135
Transaction costs related to business
combinations(3) 23,090 – – 23,090
SPO-related costs(4) 38,138 – 37,883 76,021
Adjusted Operating Costs and Expenses
(Exclusive of Depreciation and Amortization) (902,187) (358,689) (387,738) (1,648,614)
For the three months ended June 30, 2020
(in thousands of RUB) Personnel
expenses
Marketing
expenses
Other G&A
expenses Total
Operating costs and expenses (exclusive of
depreciation and amortization) (540,508) (234,394) (176,163) (951,065)
Add the effect of:
Equity-settled awards, including social tax(1) 57,973 – – 57,973
Insurance cover related to IPO(2) – – 15,939 15,939
Transaction costs related to business
combinations(3) – – 156 156
SPO-related costs(4) – – 7,268 7,268
Adjusted Operating Costs and Expenses
(Exclusive of Depreciation and
Amortization) (482,535) (234,394) (152,800) (869,729)
(1) Represents non-cash expenses related to equity-settled awards issued in accordance with the Management Incentive Agreement,
and equity-settled share-based awards issued to board members and related social taxes, which are payable as a result of us
becoming a Russian tax resident in June 2019.
(2) Subsequent to and in connection with the IPO, in May 2019 we purchased a one-year insurance policy for $2.7 million, of which we
allocated $2.4 million to the cover related to our IPO, which we believe does not relate to our ordinary course of business, and $250
thousand to directors’ and officers’ insurance in the ordinary course of business, based on the estimate of our insurance provider. The
cost of this insurance policy is expensed over the policy term on a pro-rata time basis and thus recurs in the reporting periods during
its term. We renew our D&O policy annually. Due to a decrease in IPO-related risks over time, we believe that our D&O insurance
expense from the second 12-month period commenced May 9, 2020 mostly relates to our ordinary course of business.
(3) Reflects transaction costs mostly related to the acquisition of Zarplata.ru in December 2020 and Skillaz in March 2021.
(4) Reflects legal, accounting, and other professional fees incurred in connection with our secondary public offerings that took place in
July 2020 and June 2021.
We believe that Net Working Capital is a useful metric to assess our ability to service debt, fund new investment
opportunities, distribute dividends to our shareholders and assess our working capital requirements. Calculation
of our Net Working Capital is presented in the table below:
(in thousands of RUB) As of
June 30, 2021
As of
December 31, 2020
Trade and other receivables 134,482 69,120
Prepaid expenses and other current assets 115,163 179,118
Contract liabilities (3,368,044) (2,785,402)
Trade and other payables (1,671,891) (1,273,090)
Other current liabilities (41,952) (38,758)
Net Working Capital (4,832,242) (3,849,012)
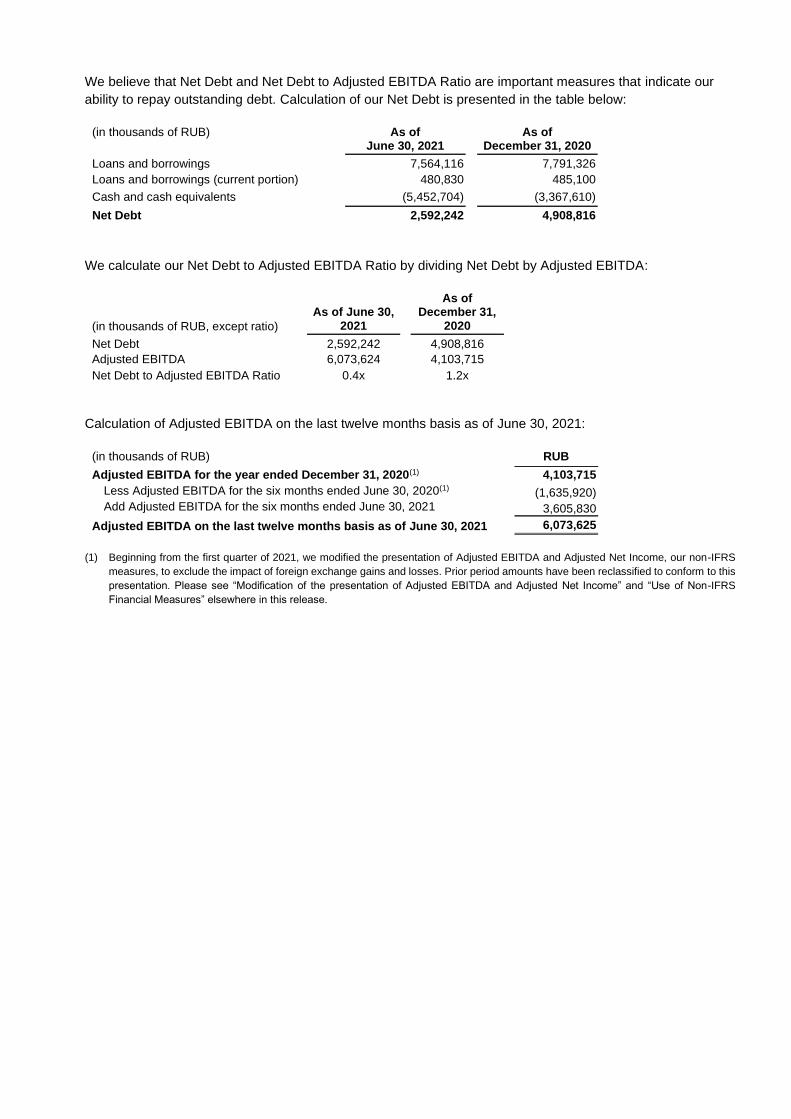
We believe that Net Debt and Net Debt to Adjusted EBITDA Ratio are important measures that indicate our
ability to repay outstanding debt. Calculation of our Net Debt is presented in the table below:
(in thousands of RUB) As of June 30, 2021
As of December 31, 2020
Loans and borrowings 7,564,116 7,791,326
Loans and borrowings (current portion) 480,830 485,100
Cash and cash equivalents (5,452,704) (3,367,610)
Net Debt 2,592,242 4,908,816
We calculate our Net Debt to Adjusted EBITDA Ratio by dividing Net Debt by Adjusted EBITDA:
(in thousands of RUB, except ratio)
As of June 30, 2021
As of December 31,
2020
Net Debt 2,592,242 4,908,816
Adjusted EBITDA 6,073,624 4,103,715
Net Debt to Adjusted EBITDA Ratio 0.4x 1.2x
Calculation of Adjusted EBITDA on the last twelve months basis as of June 30, 2021:
(in thousands of RUB) RUB
Adjusted EBITDA for the year ended December 31, 2020(1) 4,103,715
Less Adjusted EBITDA for the six months ended June 30, 2020(1) (1,635,920) Add Adjusted EBITDA for the six months ended June 30, 2021 3,605,830
Adjusted EBITDA on the last twelve months basis as of June 30, 2021 6,073,625
(1) Beginning from the first quarter of 2021, we modified the presentation of Adjusted EBITDA and Adjusted Net Income, our non-IFRS
measures, to exclude the impact of foreign exchange gains and losses. Prior period amounts have been reclassified to conform to this
presentation. Please see “Modification of the presentation of Adjusted EBITDA and Adjusted Net Income” and “Use of Non-IFRS
Financial Measures” elsewhere in this release.
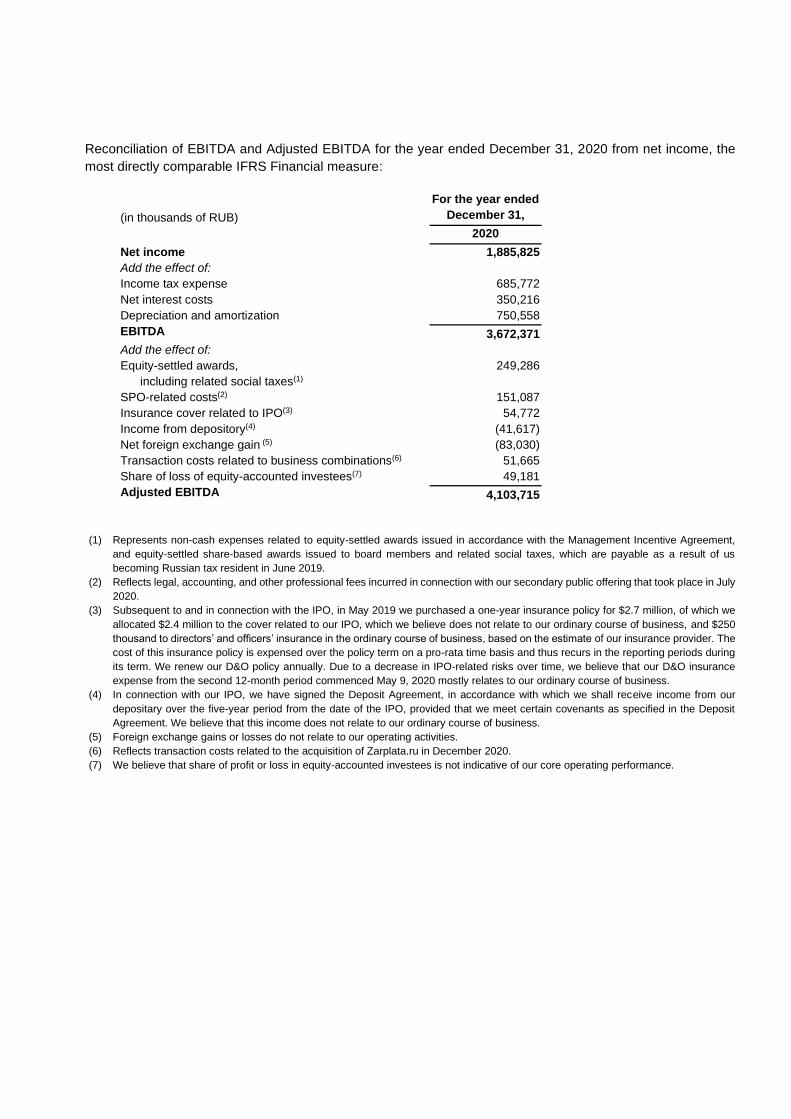
Reconciliation of EBITDA and Adjusted EBITDA for the year ended December 31, 2020 from net income, the
most directly comparable IFRS Financial measure:
(in thousands of RUB)
For the year ended
December 31,
2020
Net income 1,885,825
Add the effect of:
Income tax expense 685,772
Net interest costs 350,216
Depreciation and amortization 750,558
EBITDA 3,672,371
Add the effect of:
Equity-settled awards,
including related social taxes(1)
249,286
SPO-related costs(2) 151,087
Insurance cover related to IPO(3) 54,772
Income from depository(4) (41,617)
Net foreign exchange gain (5) (83,030)
Transaction costs related to business combinations(6) 51,665
Share of loss of equity-accounted investees(7) 49,181
Adjusted EBITDA 4,103,715
(1) Represents non-cash expenses related to equity-settled awards issued in accordance with the Management Incentive Agreement,
and equity-settled share-based awards issued to board members and related social taxes, which are payable as a result of us
becoming Russian tax resident in June 2019.
(2) Reflects legal, accounting, and other professional fees incurred in connection with our secondary public offering that took place in July
2020.
(3) Subsequent to and in connection with the IPO, in May 2019 we purchased a one-year insurance policy for $2.7 million, of which we
allocated $2.4 million to the cover related to our IPO, which we believe does not relate to our ordinary course of business, and $250
thousand to directors’ and officers’ insurance in the ordinary course of business, based on the estimate of our insurance provider. The
cost of this insurance policy is expensed over the policy term on a pro-rata time basis and thus recurs in the reporting periods during
its term. We renew our D&O policy annually. Due to a decrease in IPO-related risks over time, we believe that our D&O insurance
expense from the second 12-month period commenced May 9, 2020 mostly relates to our ordinary course of business.
(4) In connection with our IPO, we have signed the Deposit Agreement, in accordance with which we shall receive income from our
depositary over the five-year period from the date of the IPO, provided that we meet certain covenants as specified in the Deposit
Agreement. We believe that this income does not relate to our ordinary course of business.
(5) Foreign exchange gains or losses do not relate to our operating activities.
(6) Reflects transaction costs related to the acquisition of Zarplata.ru in December 2020.
(7) We believe that share of profit or loss in equity-accounted investees is not indicative of our core operating performance.


