Hazard 3: Excess Heat
Housing Health and Safety Rating System
2013 1

Description of the Hazard
• This category covers threats from excessively high indoor temperatures.
• Those 65 years old or older are the most vulnerable populations
Department of Housing and Urban Development, Office of Healthy Homes and Lead Hazard Control. (year). Healthy Home Rating System – Operating Guidance (DHHS Publication No. ). Washington, DC: U.S. Government Printing Office.
2013 2
More on Excess Heat
• Mortality rates in urban areas increase approximately 3.74% during heat events.1
• The isolated, poor and elderly are particularly vulnerable to excess heat.2
• Those who cannot afford fans or air conditioning (or high electric bills), the disabled, and those who fear “street dangers” face acute threats.2
2013 3
1. Anderson, G. Brooke, and Michelle L. Bell. 2011. “Heat Waves in the United States: Mortality Risk during Heat Waves and Effect Modification by Heat Wave Characteristics in 43 U.S. Communities.” Environmental Health Perspectives 2. Klinenberg, Eric. 2005. “Heat Wave: A Social Autopsy of Disaster in Chicago.” University of Chicago Press
Contribution of Housing
• Lack of cooling systems, or fans
• Inability to open windows
• Poor ventilation
• Orientation of the home and presence of tree canopy or shade
• Upper-level bedrooms (heat rises)
• Poor insulation
• Size
• Presence of glazing and/or shutters or blinds
2013 4
Complicating Factors
• Heat can lead to failures in the electric grid
• Opening of fire hydrants can lead to reduced water pressure, especially for those in multi-story buildings
2013 5
Klinenberg, Eric. 2005. “Heat Wave: A Social Autopsy of Disaster in Chicago.” University of Chicago Press
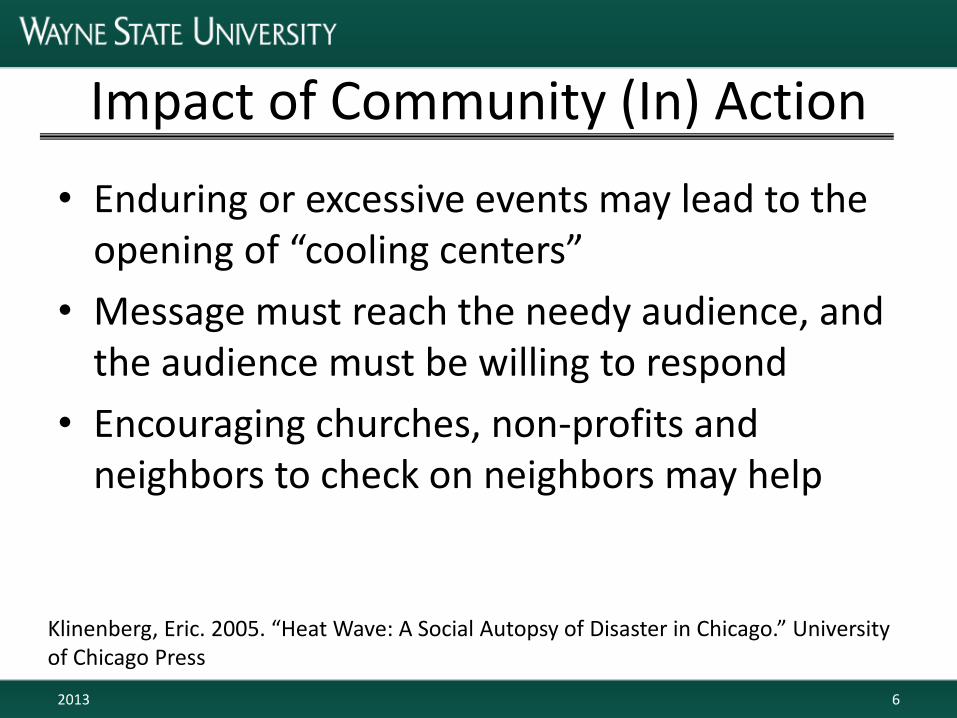
Impact of Community (In) Action
• Enduring or excessive events may lead to the opening of “cooling centers”
• Message must reach the needy audience, and the audience must be willing to respond
• Encouraging churches, non-profits and neighbors to check on neighbors may help
2013 6
Klinenberg, Eric. 2005. “Heat Wave: A Social Autopsy of Disaster in Chicago.” University of Chicago Press
Health Impacts
• Dehydration
• Heat stroke or illness
• Cardiovascular complications
• Stroke
• Exacerbation of existing conditions
2013 7

Additional Impacts
• Road surface failure
• Transformer explosion
• Water-line failure
• Drought and Dust
• Wildfire
• Violent crime
• Industrial accidents
• Air quality
2013 8

Potential for Harm
• The elderly are more vulnerable to excessive heat
• Some medications increase risk from heat.
2013 9
2013 10
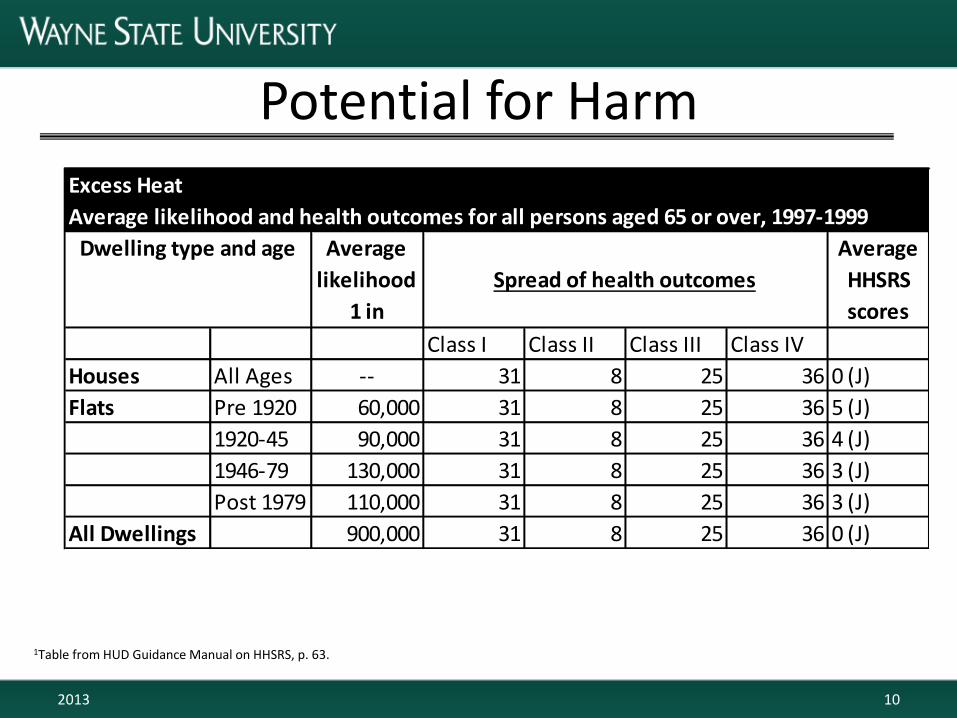
Potential for Harm
1Table from HUD Guidance Manual on HHSRS, p. 63.
Excess Heat
Average likelihood and health outcomes for all persons aged 65 or over, 1997-1999
Average
likelihood
1 in
Average
HHSRS
scores
Class I Class II Class III Class IV
Houses All Ages -- 31 8 25 36 0 (J)
Flats Pre 1920 60,000 31 8 25 36 5 (J)
1920-45 90,000 31 8 25 36 4 (J)
1946-79 130,000 31 8 25 36 3 (J)
Post 1979 110,000 31 8 25 36 3 (J)
All Dwellings 900,000 31 8 25 36 0 (J)
Spread of health outcomes
Dwelling type and age
2013 11
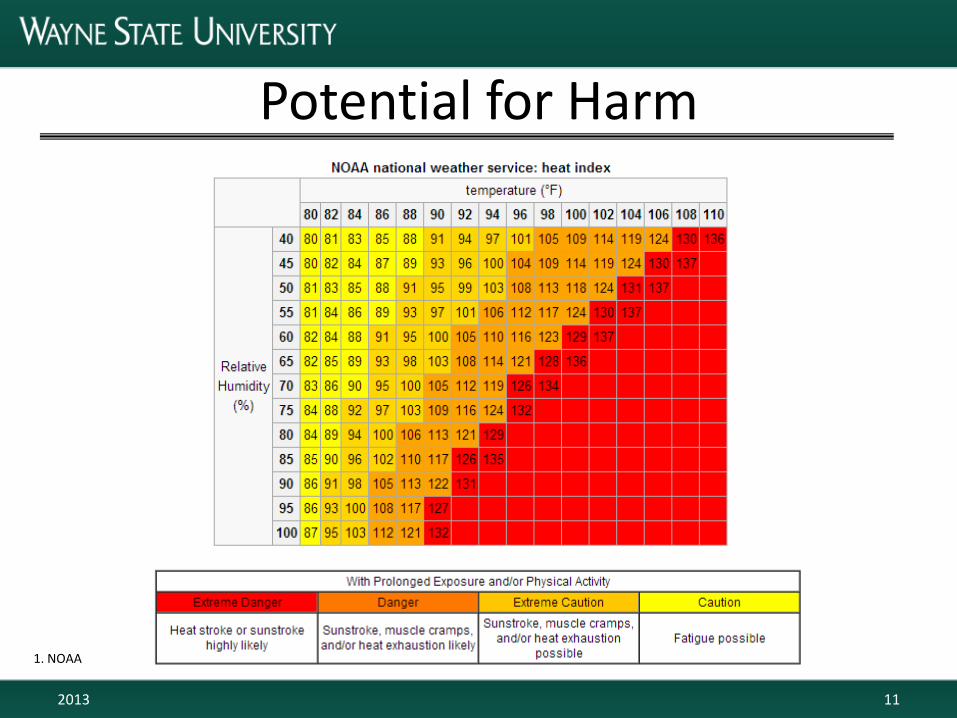
Potential for Harm
1. NOAA
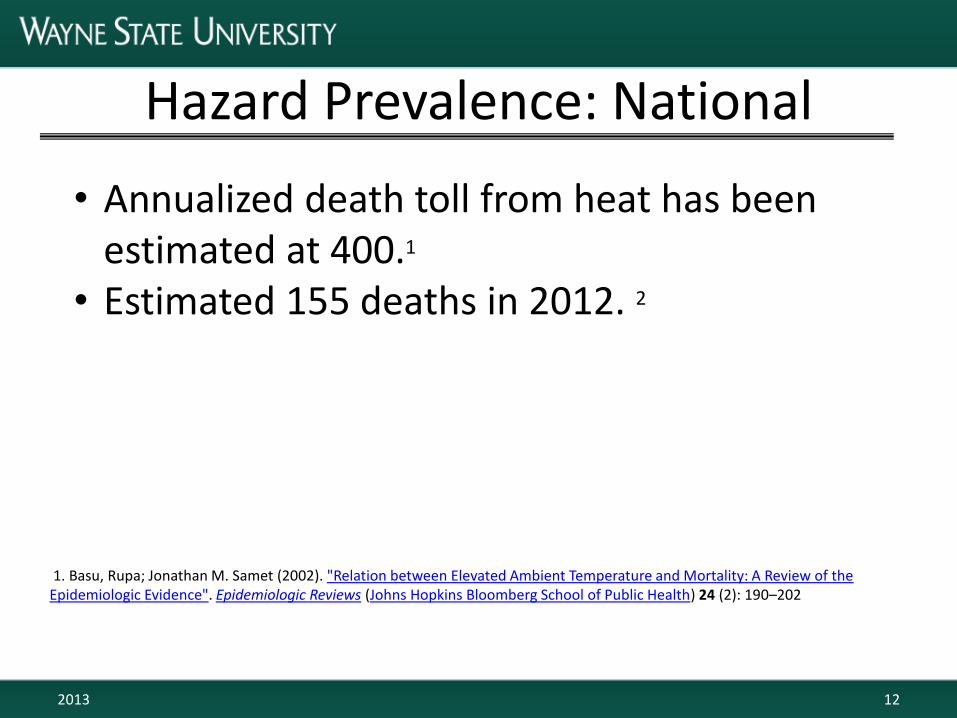
Hazard Prevalence: National
2013 12
1. Basu, Rupa; Jonathan M. Samet (2002). "Relation between Elevated Ambient Temperature and Mortality: A Review of the Epidemiologic Evidence". Epidemiologic Reviews (Johns Hopkins Bloomberg School of Public Health) 24 (2): 190–202
• Annualized death toll from heat has been estimated at 400.1
• Estimated 155 deaths in 2012. 2

Hazard Prevalence: National
2013 13
• Deadliest heat waves in U.S. (death toll)
1. 1936 2. 2011 3. 2012 4. 2010 5. 2013
• Hottest summers on record in the U.S.
1. 1980 Plains States (10,000) 2. 1936 North America (>5,000) 3. 1972 Northeast (900) 4. 1995 Chicago (600) 5. 1999 Mid-Atlantic/Appalachians (502)
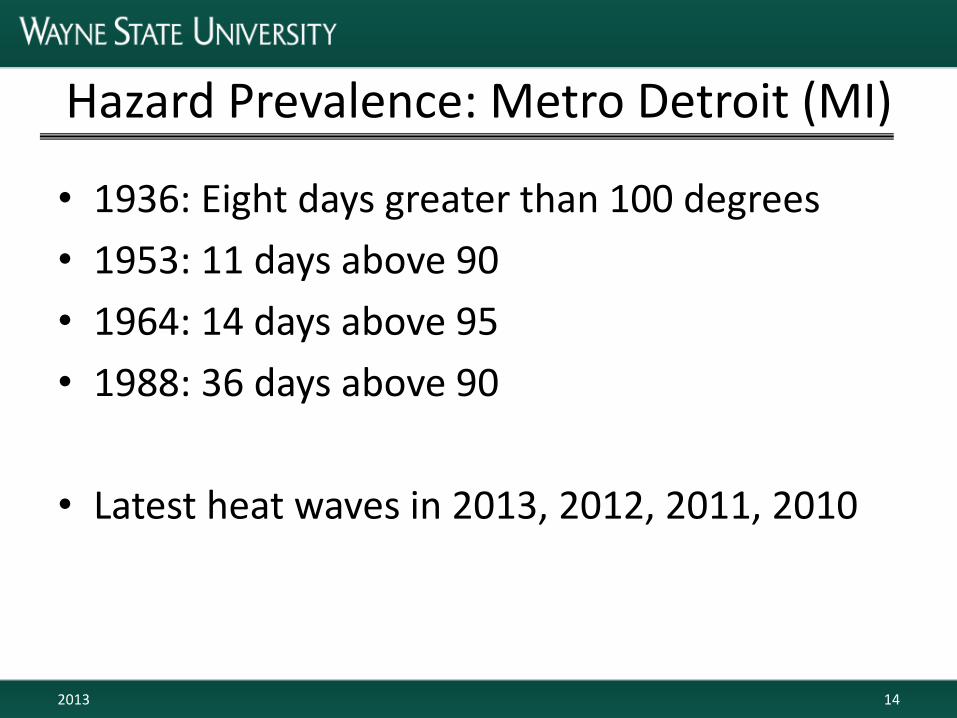
Hazard Prevalence: Metro Detroit (MI)
• 1936: Eight days greater than 100 degrees
• 1953: 11 days above 90
• 1964: 14 days above 95
• 1988: 36 days above 90
• Latest heat waves in 2013, 2012, 2011, 2010
2013 14

Hazard Prevalence: Oakland (CA)
2013 15
• 2006: 4 days greater than 110 degrees
• 1972: 2 days above 110
• Latest heat waves in 2013, 2012, 2010, 2009,

Hazard Prevalence: Greensboro (NC)
2013 16
• 2007: 4 consecutive new-high-temp days
• 1977: 4 consecutive new-high-temp days
• Latest heat waves in 2011, 2006, 20007
Outcome Data: National
2013 17
• No outcome data at a national level
18
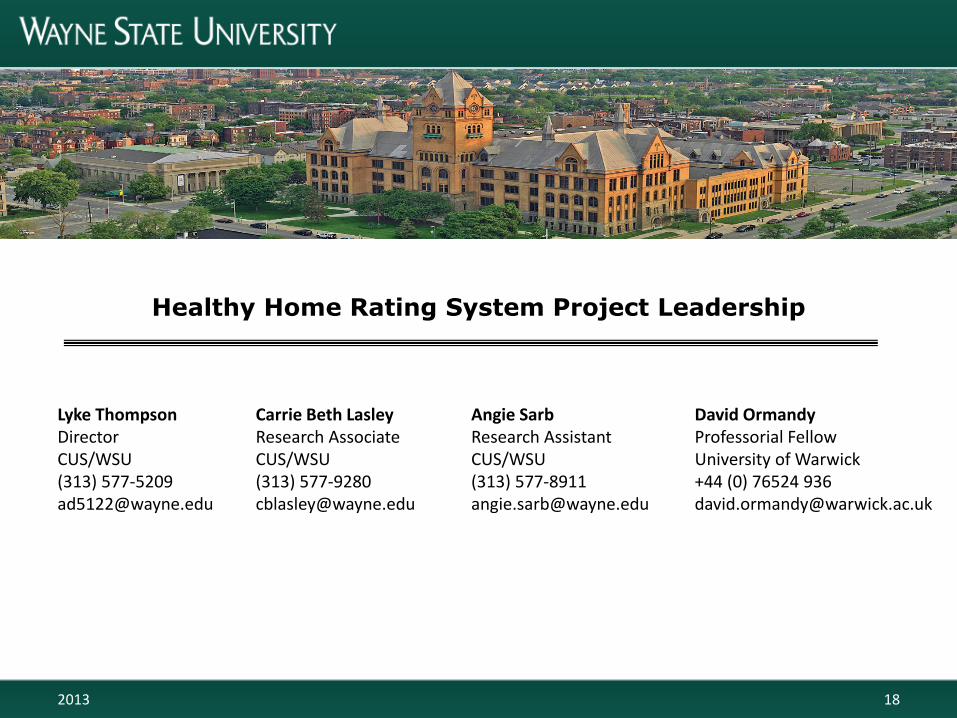
Healthy Home Rating System Project Leadership
2013
Lyke Thompson Director CUS/WSU (313) 577-5209 [email protected]
Carrie Beth Lasley Research Associate CUS/WSU (313) 577-9280 [email protected]
Angie Sarb Research Assistant CUS/WSU (313) 577-8911 [email protected]
David Ormandy Professorial Fellow University of Warwick +44 (0) 76524 936 [email protected]


