HALF YEARLY REPORTFor the Period Ended
31 December 2015

Half Yearly Report 2015 1
CONTENTS
Company Information 2 Directors’ Review 3
Independent Auditor’s Report on Review of Condensed Interim Financial Information to the Members 4
Condensed Interim Balance Sheet 5
Condensed Interim Profit and Loss Account 6
Condensed Interim Statement of Comprehensive Income 7
Condensed Interim Cash Flow Statement 8
Condensed Interim Statement of Changes in Equity 9
Notes to the Condensed Interim Financial Statements 10
Condensed Interim Consolidated Financial Statements 19

2
COMPANY INFORMATION
Board of DirectorsMr. Maqbool H. H. Rahimtoola - ChairmanDr. Mahmood Ahmad - Chief ExecutiveMr. Hamid Masood SohailMr. Muhammad NaseemMr. Ilyas SharifMr. Shahzad M. HusainMr. Zafar A. Osmani
Audit CommitteeMr. Hamid Masood Sohail - ChairmanMr. Maqbool H. H. RahimtoolaMr. Muhammad Naseem
Human Resource CommitteeMr. Zafar A. Osmani - ChairmanDr. Mahmood AhmadMr. Shahzad M.Husain
CFO & Company SecretaryMr. Abdul Wahid Qureshi
BankersAl-Baraka Bank LimitedBank Al-Habib LimitedFaysal Bank LimitedHabib Bank LimitedHabib Metropolitan Bank LimitedJS Bank LimitedMCB Bank LimitedSummit Bank LimitedUnited Bank LimitedNational Bank of Pakistan Limited
AuditorsKPMG Taseer Hadi & Co.Chartered Accountants
SolicitorsSurridge & Beecheno
Company RegistrarTHK Associates Private Limited
Registered Office36 Industrial EstateKot Lakhpat, Lahore

Half Yearly Report 2015 3
DIRECTORS’ REvIEW
The directors of the Company are pleased to present their review along with the interim financial statements of the Company for the half-year ending 31 December, 2015.
Operational Results
The period turned out to be quite encouraging. The Sales volumes increased by 23 % over the same period of the previous year. Translated financially, sales rose to Rs. 2.54 billion compared to Rs. 2.07 billion of the same period of the previous year. Gross profit accordingly grew to Rs. 738.5 million against Rs. 538.4 million for the corresponding period of the previous year. These results became possible primarily for two reasons; the decrease in the prices of raw material including petroleum products and a timely increase in prices of our products.
Selling, Marketing and Administrative expenses stood at Rs. 568 million compared to Rs. 413 million of the same period last year. The increase is mainly due to the freight and marketing expenses caused as a direct result of the increased sales volumes. Financial costs for the period stood at Rs. 47.3 million compared with Rs. 81.8 million of the corresponding period of the previous year; lower financial charges were mainly due to the reduction in interest rates by about 200 basis points and somewhat improved working capital management.
The Company ended the half year with a profit after tax of Rs. 85.8 million compared to Rs. 38.2 million for the corresponding period of the previous year.
Future Outlook
As a result of a general slowdown in the global economy, the prices of commodities and petroleum products came down over the last six months while on the other hand the rupee lost almost five percent against the dollar tending to increase the cost of imported raw material. Positive signs of improvement in law and order situation and the power supply position are healthy factors to predict a better future but any adverse change would directly affect our performance.
The Directors would like to place on record their appreciation of the hard work and dedication continuously displayed by all members of the staff including the employees as well as the management. The Directors also wish to thank our valued customers, distributors, dealers, bankers and other stakeholders for the trust reposed by them in the Company.
On behalf of the Board
Lahore Dr. Mahmood AhmadDated: 22 February 2016 Chief Executive

4
Auditors’ Report to the Members on Review of Interim Financial Information
Introduction
We have reviewed the accompanying condensed interim unconsolidated balance sheet of Berger Paints Pakistan Limited (“the Company”) as at 31 December 2015 and the related condensed interim unconsolidated profit and loss account, condensed interim unconsolidated statement of comprehensive income, condensed interim unconsolidated cash flow statement, condensed interim unconsolidated statement of changes in equity and notes to the accounts for the six month period then ended (herein-after referred as the “interim unconsolidated financial information”). Management is responsible for the preparation and presentation of this condensed interim unconsolidated financial information in accordance with approved accounting standards as applicable in Pakistan for interim financial reporting. Our responsibility is to express a conclusion on this condensed interim unconsolidated financial information based on our review.
Scope of review
We conducted our review in accordance with International Standard on Review Engagements 2410, “Review of Interim Financial Information Performed by the Independent Auditor of the Entity.” A review of condensed interim unconsolidated financial information consists of making inquiries, primarily of persons responsible for financial and accounting matters, and applying analytical and other review procedures. A review is substantially less in scope than an audit conducted in accordance with International Standards on Auditing and consequently does not enable us to obtain assurance that we would become aware of all significant matters that might be identified in an audit. Accordingly, we do not express an audit opinion.
Conclusion
Based on our review, nothing has come to our attention that causes us to believe that the accompanying condensed interim unconsolidated financial information is not prepared, in all material respects, in accordance with approved accounting standards as applicable in Pakistan for interim financial reporting.
Other Matter
The figures of the condensed interim unconsolidated profit and loss account and condensed interim unconsolidated statement of comprehensive income for the quarter ended 31 December 2015 and 31 December 2014, have not been reviewed and we do not express a conclusion on them.
KPMG Taseer Hadi & Co.Lahore Chartered AccountantsDate: 22 February 2016 (M. Rehan Chughtai))

Half Yearly Report 2015 5
Condensed Interim Unconsolidated Balance Sheet (Un-audited)As on 31 December 2015 31 December 30 June 2015 2015 (Rupees in thousand)
NON- CURRENT ASSETS Property, plant and equipment 5 1,032,052 1,045,323 Intangibles 42,810 44,467 Investments - related parties 6 50,968 12,528 Long term loans 45,589 32,472 Long term deposits 16,431 17,925 Deferred taxation 1,161 36,745 1,189,011 1,189,460 CURRENT ASSETS Stores 12,448 7,056 Stock in trade 7 874,607 717,550 Trade debts 1,179,656 1,093,739 Loans and advances 87,788 79,877 Trade deposits and short term prepayments 16,531 25,829 Other receivables 11,617 23,050 Income tax - net 239,760 209,166 Short term investments - 10,018 Cash and bank balances 8 281,271 191,738 2,703,678 2,358,023 TOTAL ASSETS 3,892,689 3,547,483 EqUITy AND LIABILITy
SHARE CAPITAL AND RESERvES Authorized share capital 25,000,000 (June 2015: 25,000,000) ordinary shares of Rs. 10 each 250,000 250,000 18,186,409 (June 2015: 18,186,409) ordinary shares of Rs. 10/- each 181,864 181,864 Reserves 535,352 444,701 717,216 626,565 Surplus on revaluation of fixed assets - net of tax 537,509 559,773 NON-CURRENT LIABILITIES Long term financing 9 1,650 41,950 Staff retirement and other long term benefits 88,622 76,420 Liabilities against assets subject to finance lease - 849 90,272 119,219 CURRENT LIABILITIES Trade and other payables 1,220,711 1,062,745 Current maturity of long term financing 9 80,600 105,600 Current maturity of liabilities against assets subject to finance lease - 2,434 Accrued finance cost 16,839 27,379 Short term borrowings- secured 1,229,542 1,043,768 2,547,692 2,241,926 CONTINGENCIES AND COMMITMENTS 10 TOTAL EqUITy AND LIABILITIES 3,892,689 3,547,483 The annexed notes 1 to 16 form an integral part of this condensed interim unconsolidated financial information.
Chief Financial Officer Chief Executive Director
6
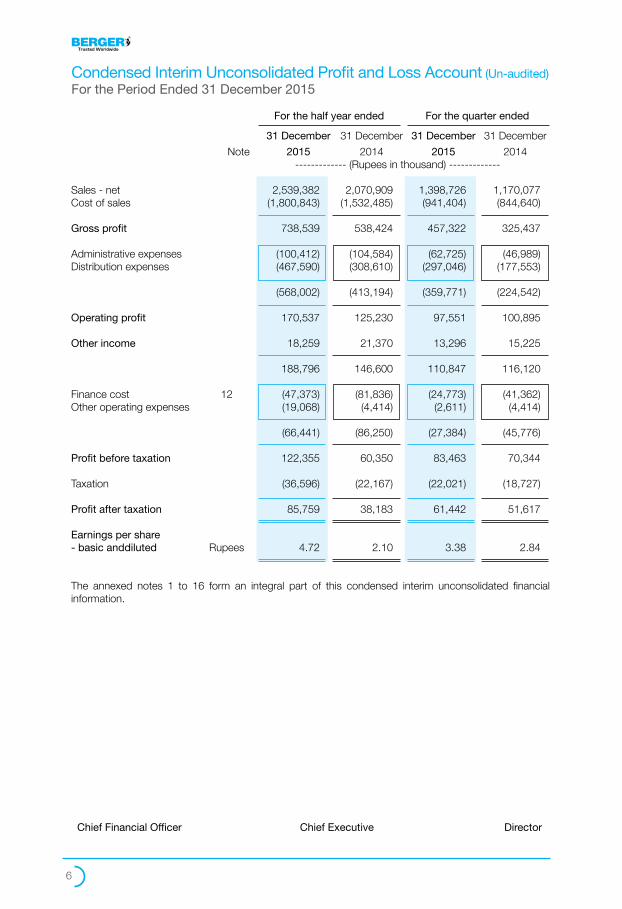
Condensed Interim Unconsolidated Profit and Loss Account (Un-audited)For the Period Ended 31 December 2015
Chief Financial Officer Chief Executive Director
For the half year ended For the quarter ended
31 December 31 December 31 December 31 December Note 2015 2014 2015 2014 ------------- (Rupees in thousand) ------------- Sales - net 2,539,382 2,070,909 1,398,726 1,170,077 Cost of sales (1,800,843) (1,532,485) (941,404) (844,640)
Gross profit 738,539 538,424 457,322 325,437 Administrative expenses (100,412) (104,584) (62,725) (46,989)Distribution expenses (467,590) (308,610) (297,046) (177,553)
(568,002) (413,194) (359,771) (224,542)
Operating profit 170,537 125,230 97,551 100,895 Other income 18,259 21,370 13,296 15,225
188,796 146,600 110,847 116,120 Finance cost 12 (47,373) (81,836) (24,773) (41,362)Other operating expenses (19,068) (4,414) (2,611) (4,414)
(66,441) (86,250) (27,384) (45,776)
Profit before taxation 122,355 60,350 83,463 70,344 Taxation (36,596) (22,167) (22,021) (18,727) Profit after taxation 85,759 38,183 61,442 51,617 Earnings per share - basic anddiluted Rupees 4.72 2.10 3.38 2.84 The annexed notes 1 to 16 form an integral part of this condensed interim unconsolidated financial information.
Half Yearly Report 2015 7
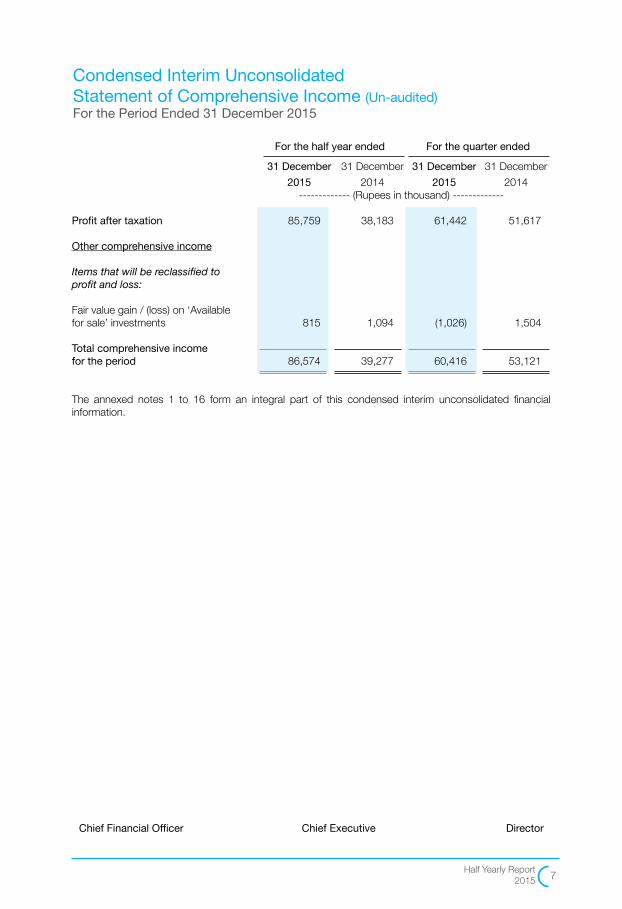
Condensed Interim Unconsolidated Statement of Comprehensive Income (Un-audited)For the Period Ended 31 December 2015
Chief Financial Officer Chief Executive Director
For the half year ended For the quarter ended
31 December 31 December 31 December 31 December 2015 2014 2015 2014 ------------- (Rupees in thousand) ------------- Profit after taxation 85,759 38,183 61,442 51,617 Other comprehensive income Items that will be reclassified to profit and loss: Fair value gain / (loss) on ‘Available for sale’ investments 815 1,094 (1,026) 1,504 Total comprehensive income for the period 86,574 39,277 60,416 53,121
The annexed notes 1 to 16 form an integral part of this condensed interim unconsolidated financial information.

8
31 December 31 December 2015 2014
(Rupees in thousand)CASH FLOWS FROM OPERATING ACTIvITIES Profit before taxation 122,355 60,350 Adjustments for non-cash items: Depreciation on property, plant and equipment 65,893 35,677 Amortization on intangibles 2,611 2,586 Provision against slow moving stock - 3,879 Provision against bad debts 3,674 14,540 Gain on disposal of property, plant and equipment (1,826) (4,524)Finance costs 47,373 81,836 117,725 133,994 Operating profit before working capital changes 240,080 194,344 (Increase) / decrease in current assets: Stores (5,392) 2,525 Stocks in Trade (157,057) (17,441)Trade debts (89,591) 77,390 Loans and advances (7,911) 17,916 Trade deposits and short-term prepayments 9,298 (3,438)Others receivables 11,433 (11,013) (239,220) 65,939 Increase / (decrease) in current liabilities: Trade and other payables 169,200 (27,912) Cash generated from operations 170,060 232,371 Finance cost paid (57,913) (82,733)Income tax paid (31,606) (57,369)Staff retirement and other long term benefits paid 12,202 8,707 Long term loans - net (13,117) (7,087)Long term deposits - net 1,495 (413) (88,939) (138,895) Net cash generated from operating activities 81,121 93,476 Cash flows from investing activities Fixed capital expenditure (54,983) (50,625)Sale proceeds on disposal of property, plant and equipment 3,233 5,987 Long term investments made (37,625) -Short term investments 10,018 - Net cash used in investing activities (79,357) (44,638) Cash flows from financing activities Repayment of long term financing (65,300) (52,800)Dividend Paid (29,422) (17,825)Short term borrowings - net 350,000 (58,000)Lease rentals paid (3,283) (1,121) Net cash generated from/(used in) financing activities 251,995 (129,746) Net increase/(decrease) in cash and cash equivalents 253,759 (80,908)Cash and cash equivalents at beginning of the period (802,030) (783,114) Cash and cash equivalents at end of the period 11 (548,271) (864,022) The annexed notes 1 to 16 form an integral part of this condensed interim unconsolidated financial information.
Condensed Interim Unconsolidated Cash Flow Statement (Un-audited)For the Period Ended 31 December 2015
Chief Financial Officer Chief Executive Director
Half Yearly Report 2015 9
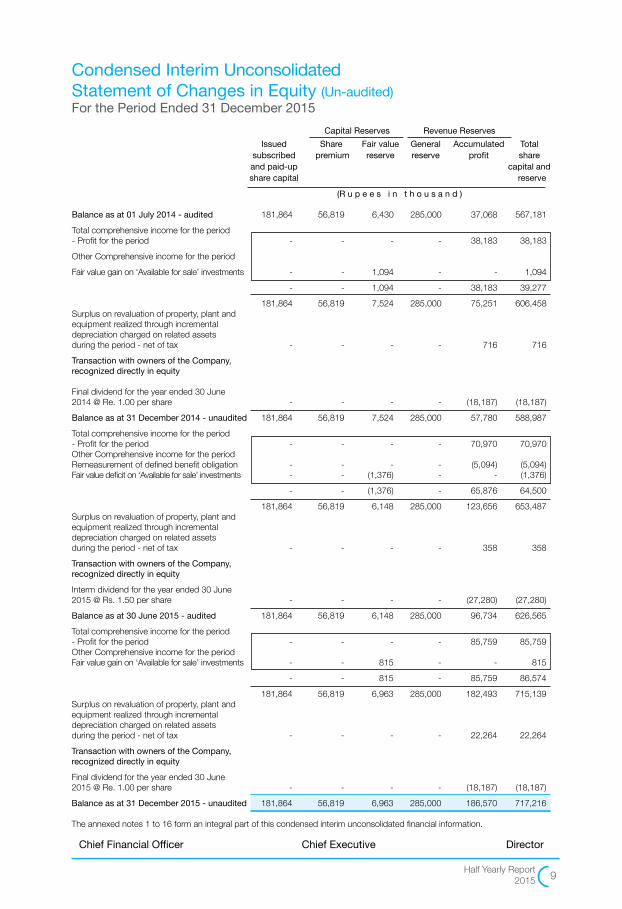
Capital Reserves Revenue Reserves Issued Share Fair value General Accumulated Total subscribed premium reserve reserve profit share and paid-up capital and share capital reserve
(R u p e e s i n t h o u s a n d ) Balance as at 01 July 2014 - audited 181,864 56,819 6,430 285,000 37,068 567,181 Total comprehensive income for the period - Profit for the period - - - - 38,183 38,183 Other Comprehensive income for the period Fair value gain on ‘Available for sale’ investments - - 1,094 - - 1,094 - - 1,094 - 38,183 39,277 181,864 56,819 7,524 285,000 75,251 606,458 Surplus on revaluation of property, plant and equipment realized through incremental depreciation charged on related assets during the period - net of tax - - - - 716 716 Transaction with owners of the Company, recognized directly in equity Final dividend for the year ended 30 June 2014 @ Re. 1.00 per share - - - - (18,187) (18,187) Balance as at 31 December 2014 - unaudited 181,864 56,819 7,524 285,000 57,780 588,987 Total comprehensive income for the period - Profit for the period - - - - 70,970 70,970 Other Comprehensive income for the period Remeasurement of defined benefit obligation - - - - (5,094) (5,094)Fair value deficit on ‘Available for sale’ investments - - (1,376) - - (1,376) - - (1,376) - 65,876 64,500 181,864 56,819 6,148 285,000 123,656 653,487 Surplus on revaluation of property, plant and equipment realized through incremental depreciation charged on related assets during the period - net of tax - - - - 358 358 Transaction with owners of the Company, recognized directly in equity Interm dividend for the year ended 30 June 2015 @ Rs. 1.50 per share - - - - (27,280) (27,280) Balance as at 30 June 2015 - audited 181,864 56,819 6,148 285,000 96,734 626,565 Total comprehensive income for the period - Profit for the period - - - - 85,759 85,759 Other Comprehensive income for the period Fair value gain on ‘Available for sale’ investments - - 815 - - 815 - - 815 - 85,759 86,574 181,864 56,819 6,963 285,000 182,493 715,139Surplus on revaluation of property, plant and equipment realized through incremental depreciation charged on related assets during the period - net of tax - - - - 22,264 22,264 Transaction with owners of the Company, recognized directly in equity Final dividend for the year ended 30 June 2015 @ Re. 1.00 per share - - - - (18,187) (18,187) Balance as at 31 December 2015 - unaudited 181,864 56,819 6,963 285,000 186,570 717,216
The annexed notes 1 to 16 form an integral part of this condensed interim unconsolidated financial information.
Condensed Interim Unconsolidated Statement of Changes in Equity (Un-audited)For the Period Ended 31 December 2015
Chief Financial Officer Chief Executive Director
10
1. THE COMPANy AND ITS OPERATIONS The company was incorporated in Pakistan on March 25, 1950 as a private limited company under
the Companies Act, 1913 ( now Companies Ordinance, 1984 ) and was subsequently converted into a public limited company. The company is listed on Pakistan Stock Exchange (formerly Karachi and Islamabad stock exchanges). The company is engaged in the manufacturing of paints, varnishes and other related items. Slotrapid Limited, based in British Virgin Island is the holding company. The registered office of the company is situated at 36-Industrial Estate Kot-Lakhpat, Lahore and the principal manufacturing facility of the company is situated at 28 Km Multan Road, Lahore.
2. BASIS OF PREPARATION 2.1 Basis of Accounting 2.1.1 This condensed interim financial information comprises the condensed interim unconsolidated
balance sheet of the Company as at 31 December 2015 and the related condensed interim unconsolidated profit and loss account, condensed interim unconsolidated statement of comprehensive income, condensed interim unconsolidated cash flow statement and condensed interim unconsolidated statement of changes in equity together with the notes forming part thereof.
2.1.2 This condensed interim financial information of the Company for the six months period ended
31 December 2015 has been prepared in accordance with the requirements of the International Accounting Standard (IAS) 34 - Interim Financial Reporting and provisions of and directives issued under the Companies Ordinance, 1984. In case where requirements differ, the provisions of or directives issued under the Companies Ordinance, 1984 have been followed.
2.1.3 This condensed interim financial information does not include all of the information required for full
annual financial statements and should be read in conjunction with the annual financial statements for the year ended 30 June 2015.
2.1.4 Comparative balance sheet numbers are extracted from the annual audited financial statements
of the Company for the year ended 30 June 2015, whereas comparative profit and loss account, statement of comprehensive income, cash flow statement and statement of changes in equity are stated from unaudited condensed interim financial information of the Company for the six months period ended 31 December 2014.
2.1.5 This condensed interim financial information is unaudited and being submitted to the shareholders
as required under Section 245 of the Companies Ordinance, 1984 and the Listing Regulations of Pakistan Stock Exchange Limited.
3. SIGNIFICANT ACCOUNTING POLICIES 3.1 Except as referred to in note 3.2, the accounting policies and the methods of computation adopted
in the preparation of this condensed interim unconsolidated financial information are same as those applied in the preparation of the unconsolidated financial statements for the year ended 30 June 2015. The Company has adopted IFRS 13 ‘Fair value Measurement’ during the period which became effective for financial periods beginning on or after 1 January 2015. The effect of IFRS 13 ‘Fair value Measurement’ is disclosed in notes 3.2 and 14 to this condensed interim unconsolidated financial information.
3.2 Change in Accounting Policy IFRS 13 Fair value measurement establishes a single framework for measuring fair value and making
disclosures about fair value measurements when such measurements are required and permitted by other IFRSs. It unifies the definition of fair value as the price that would be received to sell
Notes to the Condensed Interim Unconsolidated Financial Information (Un-audited)For the Period Ended 31 December 2015
Half Yearly Report 2015 11
an asset or paid to transfer a liability in an orderly transaction between the market participants on the measurement date. It replaces and expands the disclosure requirements about fair value measurement in other IFRSs, including IFRS 7 Financial Instruments: Disclosures. As a result the Company has added additional disclosures in this regard in note 14 to the condensed interim unconsolidated financial information. In accordance with the transitional provisions of IFRS 13, the Company has applied the new fair value measurement guidance prospectively and has not provided any comparative information for new disclosures. Notwithstanding the above, the change had no significant impacts on the measurements of the Company’s financial assets and liabilities.
4. ESTIMATES The preparation of the condensed interim unconsolidated financial information requires management
to make judgments, estimates and assumptions that affect the application of accounting policies and the reported amounts of assets and liabilities, income and expenses. Actual results may differ from these estimates. In preparing the condensed interim unconsolidated financial information, the significant judgments made by the management in applying accounting policies and the key sources of estimates were the same as those applied to the annual financial statements for the year ended 30 June 2015.
(Un-audited) (Audited) 31 December 30 June 2015 2015 Note (Rupees in thousand)
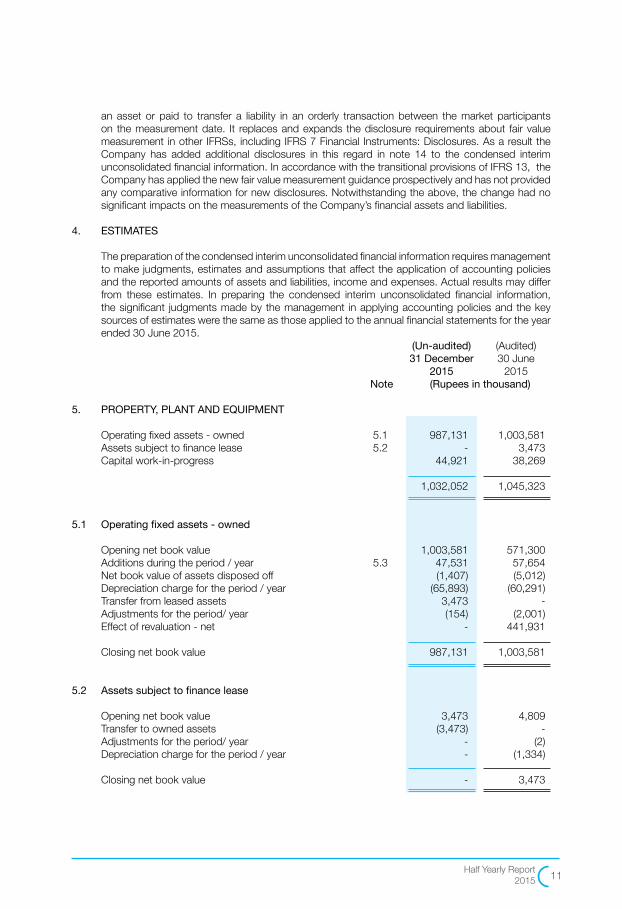
5. PROPERTY, PLANT AND EQUIPMENT
Operating fixed assets - owned 5.1 987,131 1,003,581 Assets subject to finance lease 5.2 - 3,473 Capital work-in-progress 44,921 38,269
1,032,052 1,045,323 5.1 Operating fixed assets - owned Opening net book value 1,003,581 571,300 Additions during the period / year 5.3 47,531 57,654 Net book value of assets disposed off (1,407) (5,012) Depreciation charge for the period / year (65,893) (60,291) Transfer from leased assets 3,473 - Adjustments for the period/ year (154) (2,001) Effect of revaluation - net - 441,931
Closing net book value 987,131 1,003,581 5.2 Assets subject to finance lease Opening net book value 3,473 4,809 Transfer to owned assets (3,473) - Adjustments for the period/ year - (2) Depreciation charge for the period / year - (1,334)
Closing net book value - 3,473
12
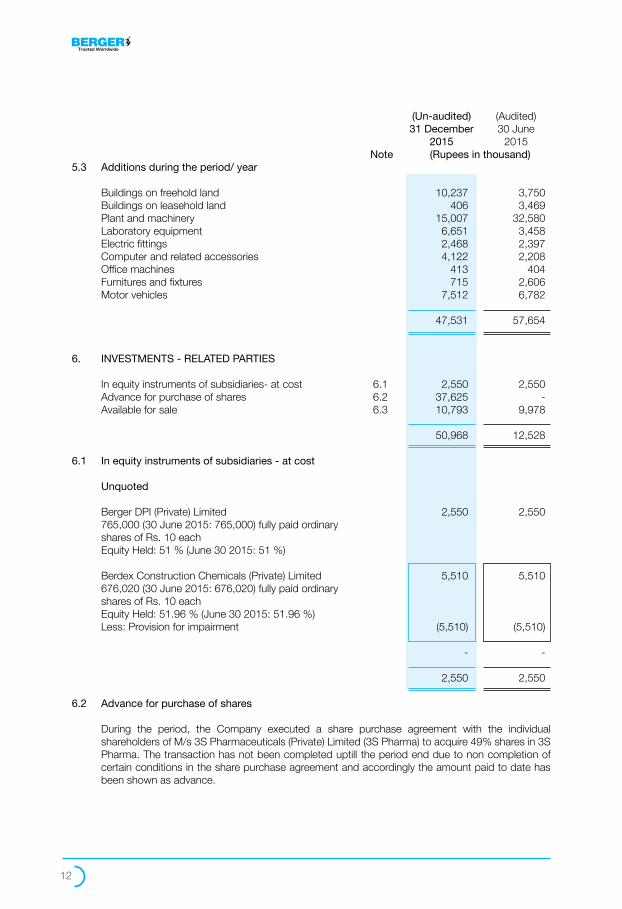
(Un-audited) (Audited) 31 December 30 June 2015 2015 Note (Rupees in thousand)5.3 Additions during the period/ year Buildings on freehold land 10,237 3,750 Buildings on leasehold land 406 3,469 Plant and machinery 15,007 32,580 Laboratory equipment 6,651 3,458 Electric fittings 2,468 2,397 Computer and related accessories 4,122 2,208 Office machines 413 404 Furnitures and fixtures 715 2,606 Motor vehicles 7,512 6,782
47,531 57,654
6. INvESTMENTS - RELATED PARTIES In equity instruments of subsidiaries- at cost 6.1 2,550 2,550 Advance for purchase of shares 6.2 37,625 - Available for sale 6.3 10,793 9,978
50,968 12,528 6.1 In equity instruments of subsidiaries - at cost Unquoted Berger DPI (Private) Limited 2,550 2,550 765,000 (30 June 2015: 765,000) fully paid ordinary shares of Rs. 10 each Equity Held: 51 % (June 30 2015: 51 %) Berdex Construction Chemicals (Private) Limited 5,510 5,510 676,020 (30 June 2015: 676,020) fully paid ordinary shares of Rs. 10 each Equity Held: 51.96 % (June 30 2015: 51.96 %) Less: Provision for impairment (5,510) (5,510)
- - 2,550 2,550 6.2 Advance for purchase of shares During the period, the Company executed a share purchase agreement with the individual
shareholders of M/s 3S Pharmaceuticals (Private) Limited (3S Pharma) to acquire 49% shares in 3S Pharma. The transaction has not been completed uptill the period end due to non completion of certain conditions in the share purchase agreement and accordingly the amount paid to date has been shown as advance.

Half Yearly Report 2015 13
(Un-audited) (Audited) 31 December 30 June 2015 2015 Note (Rupees in thousand)6.3 Available for sale Available for sale - at cost 6.3.1 9,978 3,830 Add: Cumulative fair value gain 6.3.2 815 6,148
10,793 9,978
6.3.1 Available for sale -at cost
Buxly Paints Limited 273,600 (30 June 2015: 273,600) fully paid ordinary shares of Rs. 10 each Equity Held: 19 % (June 30 2015: 19 %) 9,978 3,830 9,978 3,830 6.3.2 Cumulative fair value gain As at 01 July 6,148 6,430 Fair value gain/(loss) during the period/year 815 (282)
As at 31 December/30 June 6,963 6,148
7. STOCK IN TRADE Raw and packing material - in hand 472,822 383,790 - in transit 84,253 64,210 557,075 448,000 Semi processed goods 74,496 77,458 Finished goods 351,318 305,268 982,889 830,726 Provision for slow moving and obsolete stocks - Raw Material (86,302) (86,302) - Semi processed goods (3,698) (3,698) - Finished goods (18,282) (23,176)
(108,282) (113,176)
874,607 717,550 7.1 The amount charged to profit and loss account on account of write down of finished goods to net
realizable value amounted to Rs. 4.73 million (30 June 2015: Rs. 1.95 million). Included in finished goods stock are color bank machines costing Rs. 17.05 million (30 June 2015: Rs. 10.09 million).
14
(Un-audited) (Audited) 31 December 30 June 2015 2015 Note (Rupees in thousand)
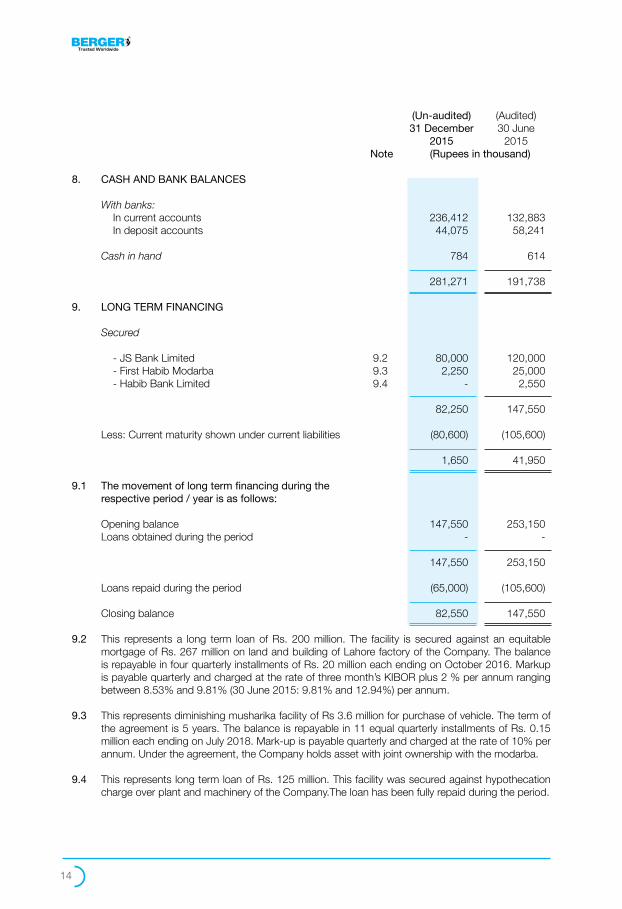
8. CASH AND BANK BALANCES
With banks: In current accounts 236,412 132,883 In deposit accounts 44,075 58,241 Cash in hand 784 614 281,271 191,738 9. LONG TERM FINANCING Secured
- JS Bank Limited 9.2 80,000 120,000 - First Habib Modarba 9.3 2,250 25,000 - Habib Bank Limited 9.4 - 2,550
82,250 147,550 Less: Current maturity shown under current liabilities (80,600) (105,600)
1,650 41,950
9.1 The movement of long term financing during the respective period / year is as follows: Opening balance 147,550 253,150 Loans obtained during the period - - 147,550 253,150 Loans repaid during the period (65,000) (105,600)
Closing balance 82,550 147,550 9.2 This represents a long term loan of Rs. 200 million. The facility is secured against an equitable
mortgage of Rs. 267 million on land and building of Lahore factory of the Company. The balance is repayable in four quarterly installments of Rs. 20 million each ending on October 2016. Markup is payable quarterly and charged at the rate of three month’s KIBOR plus 2 % per annum ranging between 8.53% and 9.81% (30 June 2015: 9.81% and 12.94%) per annum.
9.3 This represents diminishing musharika facility of Rs 3.6 million for purchase of vehicle. The term of
the agreement is 5 years. The balance is repayable in 11 equal quarterly installments of Rs. 0.15 million each ending on July 2018. Mark-up is payable quarterly and charged at the rate of 10% per annum. Under the agreement, the Company holds asset with joint ownership with the modarba.
9.4 This represents long term loan of Rs. 125 million. This facility was secured against hypothecation charge over plant and machinery of the Company.The loan has been fully repaid during the period.

Half Yearly Report 2015 15
10. CONTINGENCIES AND COMMITMENTS 10.1 Contingencies - There is no change in the status of contingencies as highlighted in the financial statements of
the Company for the year ended 30 June 2015. 10.2 Commitments - Outstanding letters of credit as at 31 December 2015 amounted to Rs. 279.57 million (30
June 2015: Rs. 367.98 million). - Outstanding letters of guarantee as at 31 December 2015 amounted to Rs. 71.97 million (30
June 2015: Rs. 55.62 million). 31 December 31 December 2015 2014 Note (Rupees in thousand)
11. CASH AND CASH EqUIvALENTS
Cash and bank balances 281,271 271,037 Short term running finance (829,542) (1,135,059)
(548,271) (864,022) 12. FINANCE COST Mark-up on: - Secured long term financing 4,455 14,447 - Secured short term financing 6,095 5,951 - Secured short term running finances 34,100 59,659 - Bank and other charges 2,722 1,779 47,373 81,836

16
13. TRANSACTIONS WITH RELATED PARTIES The related parties of the Company comprise holding company, subsidiaries, associated
undertakings, other related companies, post employment benefit plans, directors and key management personnel. There have been no guarantees provided or received for any related party receivable or payable.
Transaction during the Relationship with the Nature and description Balance As at half year ended Company of related party 31 December 30 June 31 December 31 December transaction 2015 2015 2015 2014 - - -- - - (Rupees in thousand) - - - --- - i. Holding Company Slotrapid Limited B.V.I. Royalty expense 16,820 27,514 16,820 14,400 ii. Subsidiary Company Berger Road Safety Debtors / Sales 72,796 37,519 78,331 45,274 (Private) Limited Rental Income and other service charges 1,796 2,798 1,038 1,038 Common expenditures incurred - - 14,941 14,717 iii. Related Party Buxly Paints Limited Debtors / Sales 59,754 61,057 66,652 44,592 Rental Income and other service charges - - 1,804 1,804 Royalty Expense 7,221 6,051 945 601 Toll Manufacturing - - 5,609 3,260 iv. Associate Dadex Eternit Limited Debtors / Sales 71 33 149 175 v. Post employment Expense charged in respect of - - 12,879 11,764 benefit plans retirement benefit plans Paid to gratuity and pension funds - - 1,000 1,546 vi. Remuneration of key management personnel - - 81,065 53,397
Half Yearly Report 2015 17
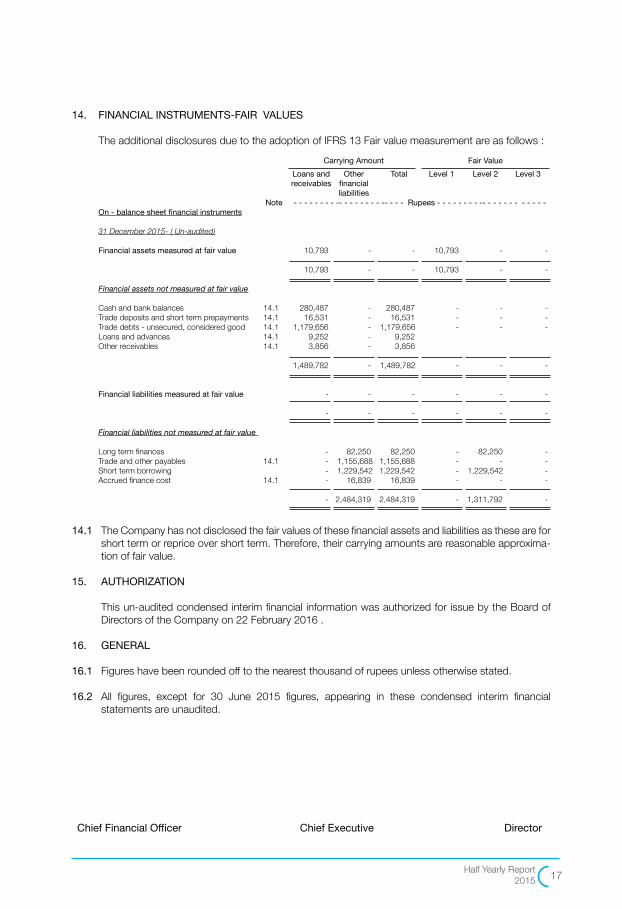
14. FINANCIAL INSTRUMENTS-FAIR vALUES The additional disclosures due to the adoption of IFRS 13 Fair value measurement are as follows : Carrying Amount Fair value Loans and Other Total Level 1 Level 2 Level 3 receivables financial liabilities Note - - - - - - - - -- - - - - - - - -- - - - Rupees - - - - - - - - -- - - - - - - - - - - - On - balance sheet financial instruments
31 December 2015- ( Un-audited) Financial assets measured at fair value 10,793 - - 10,793 - -
10,793 - - 10,793 - - Financial assets not measured at fair value Cash and bank balances 14.1 280,487 - 280,487 - - - Trade deposits and short term prepayments 14.1 16,531 - 16,531 - - - Trade debts - unsecured, considered good 14.1 1,179,656 - 1,179,656 - - - Loans and advances 14.1 9,252 - 9,252 Other receivables 14.1 3,856 - 3,856
1,489,782 - 1,489,782 - - - Financial liabilities measured at fair value - - - - - -
- - - - - - Financial liabilities not measured at fair value Long term finances - 82,250 82,250 - 82,250 - Trade and other payables 14.1 - 1,155,688 1,155,688 - - - Short term borrowing - 1,229,542 1,229,542 - 1,229,542 - Accrued finance cost 14.1 - 16,839 16,839 - - -
- 2,484,319 2,484,319 - 1,311,792 - 14.1 The Company has not disclosed the fair values of these financial assets and liabilities as these are for
short term or reprice over short term. Therefore, their carrying amounts are reasonable approxima-tion of fair value.
15. AUTHORIzATION This un-audited condensed interim financial information was authorized for issue by the Board of
Directors of the Company on 22 February 2016 . 16. GENERAL 16.1 Figures have been rounded off to the nearest thousand of rupees unless otherwise stated. 16.2 All figures, except for 30 June 2015 figures, appearing in these condensed interim financial
statements are unaudited.
Chief Financial Officer Chief Executive Director

18

Half Yearly Report 2015 19
CONDENSED INTERIM CONSOLIDATED FINANCIAL STATEMENTSFOR THE PERIOD ENDED
31 DECEMBER 2015

20
Condensed Interim Consolidated Balance Sheet (Un-audited)As on 31 December 2015 (Un-audited) (Audited) 31 December 30 June 2015 2015 (Rupees in thousand)ASSETSNON- CURRENT ASSETS Property, plant and equipment 1,042,201 1,053,935 Intangible 42,810 44,467 Investments - related parties 48,418 9,978 Long term loans 45,589 32,472 Long term deposits 19,135 20,404 Deferred taxation 947 36,525 1,199,100 1,197,781 CURRENT ASSETS Stores 12,448 7,056 Stock in trade 888,433 717,550 Trade debts 1,242,286 1,122,879 Loans and advances 107,284 88,212 Trade deposits and short term prepayments 16,531 25,829 Other receivables 9,821 22,354 Income tax - net 247,928 218,538 Short term investments - 10,018 Cash and bank balances 287,507 195,600 2,812,238 2,408,036 TOTAL ASSETS 4,011,338 3,605,817 EqUITy AND LIABILITIES SHARE CAPITAL AND RESERvES Authorised share capital 25,000,000 ordinary shares of Rs.10 each 250,000 250,000 Share capital 181,864 181,864 Reserves 551,387 458,805 733,251 640,669 NON-CONTROLLING INTEREST 19,901 18,045 SURPLUS ON REvALUATION OF FIXED ASSETS - NET OF TAX 537,509 559,773 NON-CURRENT LIABILITIES Long-term financing 1,650 41,950 Staff retirement benefits 88,622 76,420 Liabilities against assets subject to finance lease 6,797 6,181 CURRENT LIABILITIES Trade and other payables 1,295,259 1,082,230 Accrued finance cost 16,839 27,379 Current maturity of long-term financing 80,600 105,600 Current maturity of liabilities against assets subject to finance lease 1,368 3,802 Short term borrowings 1,229,542 1,043,768 2,623,608 2,262,779 2,720,677 2,387,330 TOTAL EqUITy AND LIABILITIES 4,011,338 3,605,817
Chief Financial Officer Chief Executive Director

Half Yearly Report 2015 21
Chief Financial Officer Chief Executive Director
Condensed Interim Consolidated Profit and Loss Account (Un-audited)For the Period Ended 31 December 2015
For the half year ended For the quarter ended
31 December 31 December 31 December 31 December 2015 2014 2015 2014 ------------- (Rupees in thousand) ------------- Sales - net 2,620,474 2,112,140 1,441,282 1,197,312 Cost of sales 1,847,352 1,560,163 965,420 863,184
Gross profit 773,122 551,977 475,862 334,128 Distribution expenses 488,595 312,980 308,464 179,993 Administrative expenses 103,985 106,927 55,055 48,372
592,580 419,907 363,519 228,365
Operating profit 180,542 132,070 112,343 105,763 Other income 17,262 20,387 12,795 14,727
197,804 152,457 125,138 120,490 Other charges 19,068 4,414 12,611 4,414 Finance cost 47,927 82,000 25,189 41,439
66,995 86,414 37,800 45,853 Profit before taxation 130,809 66,043 87,338 74,637 Taxation 41,262 24,256 26,125 20,365 Profit after taxation 89,547 41,787 61,213 54,272 Attributable to: Equity holders of the parent 87,691 39,199 60,663 52,403 Non-controlling interest 1,856 2,588 550 1,869 Earning per share - basic and diluted 4.82 2.16 3.34 2.88

22
Chief Financial Officer Chief Executive Director
Condensed Interim Unconsolidated Statement of Comprehensive Income (Un-audited)For the Period Ended 31 December 2015
For the half year ended For the quarter ended
31 December 31 December 31 December 31 December 2015 2014 2015 2014 ------------- (Rupees in thousand) ------------- Profit after taxation 89,547 41,787 61,213 54,272 Other comprehensive income for the period Fair value gain / (loss) on ‘Available for sale’ investments 815 1,094 (1,026) 1,504 Total comprehensive income for the period 90,362 42,881 60,187 55,776 Attributable to: Equity holder of the parent 88,506 40,293 59,637 53,907 Non-controlling interest 1,856 2,588 550 1,869

Half Yearly Report 2015 23
31 December 31 December 2015 2014 (Rupees in thousand) CASH FLOWS FROM OPERATING ACTIvITIES Cash generated from operations 177,730 243,336 Finance costs paid (58,467) (82,897)Income tax - net (35,074) (59,442)Staff Retirement Benefits 12,202 3,473 Long-term loans - net (13,117) (7,087)Long-term deposits - net 1,269 (413)
Net cash inflows from operating activities 84,543 96,970 CASH FLOWS FROM INvESTING ACTIvITIES Capital expenditure (57,496) (50,943)Sales proceeds from disposal of fixed assets 3,233 5,987 Long term investments made (37,625) - Short term investments 10,018 -
Net cash outflow from investing activities (81,870) (44,956) CASH FLOWS FROM FINANCING ACTIvITIES Short-term borrowings - net 350,000 (58,000)Dividend paid (29,422) (17,774)Lease rentals paid (1,818) (1,401)Repayment of long term financing (65,300) (52,800)
Net cash inflows / (outflow) from financing activities 253,460 (129,975) Net decrease in cash and cash equivalents 256,133 (77,961) Cash and cash equivalents at begining of the period (798,168) (776,660) Cash and cash equivalents at end of the period (542,035) (854,621)
Condensed Interim Consolidated Cash Flow Statement (Un-audited)For the Period Ended 31 December 2015
Chief Financial Officer Chief Executive Director

24
Chi
ef F
inan
cial
Offi
cer
Chi
ef E
xecu
tive
Dire
ctor
Cap
ital R
eser
ves
R
even
ue R
eser
ves
Is
sued
, S
hare
Fa
ir
Gen
eral
Ac
cum
ulat
ed
Tota
l equ
ity
Non
- To
tal
su
bscr
ibed
p
rem
ium
va
lue
rese
rve
pr
ofit
attri
buta
ble
cont
rollin
g sh
are
an
d pa
id-u
p
rese
rve
to s
hare
hold
ers
in
tere
st
capi
tal
sh
are
capi
tal
of p
aren
t
and
Com
pany
rese
rves
(R
u p
e e
s i
n
t h o
u s
a n
d )
Bala
nce
as a
t 1 J
uly
2014
1
81,8
64
56,
819
6
,430
2
85,0
00
50,
578
5
80,6
91
17,
474
5
98,1
65
Profi
t for
the
perio
d en
ded
31 D
ecem
ber 2
014
-
-
-
-
39,
199
3
9,19
9
2,5
88
41,
787
Oth
er C
ompr
ehen
sive
inco
me
for t
he p
erio
d
Fair
valu
e lo
ss o
n ‘A
vaila
ble
for s
ale’ i
nves
tmen
ts
-
-
1,0
94
-
-
1,0
94
-
1,0
94
Mea
sure
men
t of d
efine
d be
nefit
obl
igat
ion
-
-
-
-
-
-
-
-
-
-
1
,094
-
-
1
,094
-
1
,094
To
tal c
ompr
ehen
sive
loss
for t
he p
erio
d en
ded
31 D
ecem
ber 2
014
-
-
1,0
94
-
39,
199
4
0,29
3
2,5
88
42,
881
Surp
lus
on re
valu
atio
n of
pro
perty
plan
t and
equ
ipm
ent r
ealiz
ed th
roug
h inc
rem
enta
l dep
riciat
ion c
harg
ed o
n re
lated
ass
ets d
uring
the
perio
d - n
et o
f tax
-
-
-
-
716
7
16
-
716
Fi
nal d
ivide
nd fo
r the
yea
r end
ed 3
0 Ju
ne 2
014
@ R
e. 1
.00
per s
hare
-
-
-
-
(1
8,18
7)
(18,
187)
-
(1
8,18
7)
Ba
lanc
e as
at 3
1 De
cem
ber 2
014
181
,864
5
6,81
9
7,5
24
285
,000
7
2,30
6
603
,513
2
0,06
2
623
,575
Tr
ansa
ctio
n w
ith o
wne
rs o
f the
Com
pany
reco
gnize
d di
rect
ly in
equ
ity -
Dist
ribut
ions
Inte
rim d
ivide
nd fo
r the
yea
r end
ed 3
0 Ju
ne 2
015
@ R
s. 1
.50
per s
hare
-
-
-
-
(2
7,28
0)
(27,
280)
-
(2
7,28
0)
To
tal c
ompr
ehen
sive
profi
t for
the
perio
d en
ded
30 J
une
2015
Profi
t for
the
perio
d -
-
-
-
7
0,54
8
70,
548
(2
,017
) 6
8,53
1 O
ther
Com
preh
ensiv
e in
com
e fo
r the
per
iod
Fa
ir va
lue
gain
on
‘Ava
ilabl
e fo
r sale
’ inv
estm
ents
-
-
(1
,376
) -
-
(1
,376
) -
(1
,376
)Re
mea
sure
men
t of d
efine
d be
nefit
obl
igat
ion
-
-
-
-
(5,0
94)
(5,0
94)
-
(5,0
94)
-
-
(1
,376
) -
(5
,094
) (6
,470
) -
(6
,470
)
To
tal C
ompr
ehen
sive
inco
me
for t
he p
erio
d en
ded
30 J
une
2015
-
-
(1
,376
) -
6
5,45
4
64,
078
(2
,017
) 6
2,06
1 Su
rplu
s on
reva
luat
ion
of p
rope
rty p
lant a
nd e
quip
men
t rea
lized
thro
ugh
incre
men
tal d
epric
iation
cha
rged
on
relat
ed a
sset
s dur
ing th
e pe
riod
- net
of ta
x. -
-
-
-
3
58
358
-
3
58
Bala
nce
as a
t 30
June
201
5 1
81,8
64
56,
819
6
,148
2
85,0
00
110
,838
6
40,6
69
18,
045
6
58,7
14
Tran
sact
ion
with
ow
ners
of t
he C
ompa
ny re
cogn
ized
dire
ctly
in e
quity
- Di
strib
utio
ns
Fi
nal d
ivide
nd fo
r the
yea
r end
ed 3
0 Ju
ne 2
015
@ R
e. 1
.00
per s
hare
-
-
-
-
(1
8,18
7)
(18,
187)
-
(1
8,18
7)
Pr
ofit f
or th
e pe
riod
ende
d 31
Dec
embe
r 201
5 -
-
-
-
8
7,69
1
87,
691
1
,856
8
9,54
7
O
ther
Com
preh
ensiv
e in
com
e fo
r the
per
iod
Fa
ir va
lue
gain
on
‘Ava
ilabl
e fo
r sale
’ inv
estm
ents
-
-
8
15
-
-
815
-
8
15
Rem
easu
rem
ent o
f defi
ned
bene
fit o
blig
atio
n -
-
-
-
-
-
-
-
-
-
815
-
-
8
15
-
815
To
tal c
ompr
ehen
sive
inco
me
for t
he p
erio
d en
ded
31 D
ecem
ber 2
015
-
-
815
-
8
7,69
1
88,
506
1
,856
9
0,36
2 Su
rplu
s on
reva
luat
ion
of p
rope
rty p
lant a
nd e
quip
men
t rea
lized
thro
ugh
incre
men
tal d
epric
iation
cha
rged
on
relat
ed a
sset
s dur
ing th
e pe
riod
- net
of t
ax
-
-
-
-
22,
263
2
2,26
3
-
22,
263
Bala
nce
as a
t 31
Dece
mbe
r 201
5 1
81,8
64
56,
819
6
,963
2
85,0
00
202
,605
7
33,2
51
19,
901
7
53,1
52
Cond
ense
d In
terim
Con
solid
ated
Sta
tem
ent o
f Cha
nges
in E
quity
(Un-
audi
ted)
For t
he P
erio
d En
ded
31 D
ecem
ber 2
015