
Enabling Speed to Patient Starting in the Early Biologics Development Space
HENRIK ANDERSEN | BMS BIOLOGICS PROCESS DEVELOPMENT
2
BMS Biologics PortfolioBreakthrough Designation & CMC ChallengesGeneral Development Enablement OpportunitiesMolecule Design ConsiderationsClinical Qualification Case StudyHarmonization: Parts of Portfolio Example
PRESENTATION OUTLINE

3
BMS Biologics Pipeline
Early Late Marketed
ImmunoscienceImmuno-OncologyVirologyOncologyMetabolicsGenetic Diseases
Indications
Source: www.bms.com Expression Systems: CHO, NS0, and E. coli
4
CMC TIMELINE CHALLENGESACCELERATED PROGRAMS

5
Current Industry Biologics CMC Challenges
#Trending
IO Accelerate early-phase compounds into late-stage trials
DRIVER:Newer Treatment
Modalities to Patients QuicklyAIDED BY:
Breakthrough Therapy
Designation NNNNNivolumabRapid Progression
Basic Data Sets
In-Licensing
Small Investments
Limited Clinical Data
Expression cell lineCommercial process developmentAnalytical paradigmDesign space and PPQ statusResource considerations
Incomplete CMC
Package

6
Processes for Accelerated Approval
Category Applies to Impact toRegulatory Approval Potential CMC Impact
Accelerated Approval Pathway
Allows surrogate endpoint to be used for disease states with substantial unmet clinical need
Completion of confirmatory P3 studies still required
PPQShelf life/stability dataClinical qualification
Fast-TrackDesignation
Serious conditions and unmet medial need
Completion of confirmatory P3 studies still requiredRolling submission allowed
PPQShelf life/stability dataClinical qualification
BreakthroughTherapy Designation
Substantial improvement over existing therapies in early clinical trials
Commercial application does not need P3All benefits of fast-track designation built in(Engage FDA)
Commercial PDAssay validationPPQShelf life/stability dataClinical qualification
Priority ReviewDesignation(can be in parallel)
Filing of commercial application for drugs meeting any of above criteria
Review time is shortened from 10 to 6 months
Shelf life (additional stability data submission during review)
Reference: Adapted from Dye et al. (2015)
7
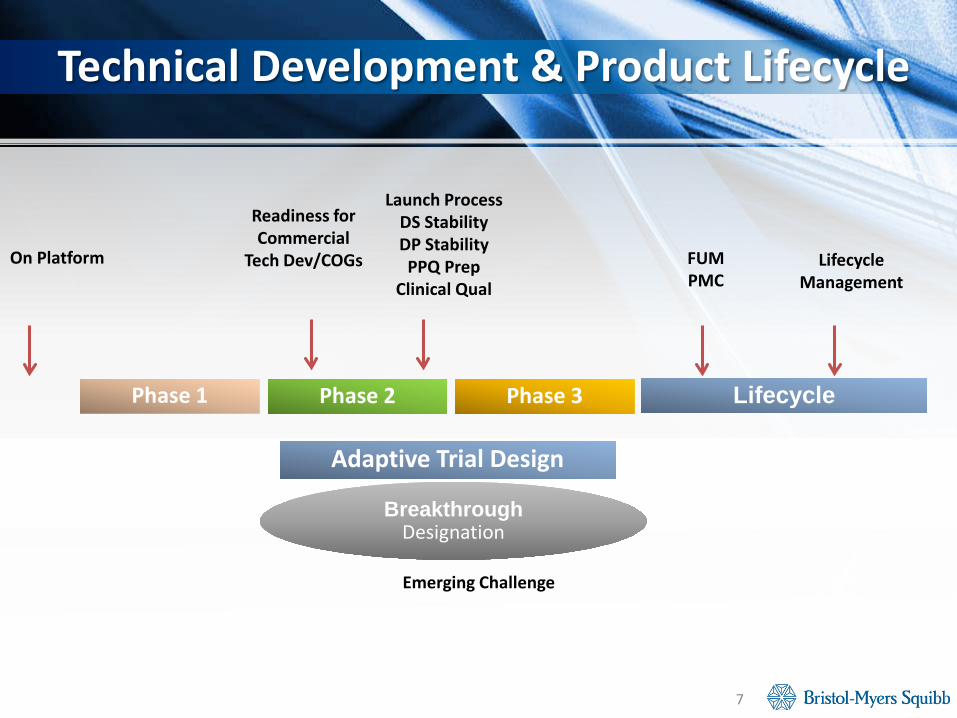
Technical Development & Product Lifecycle
Phase 1 LifecyclePhase 2 Phase 3
On Platform
Readiness forCommercial
Tech Dev/COGs FUMPMC
LifecycleManagement
Launch ProcessDS StabilityDP StabilityPPQ Prep
Clinical Qual
BreakthroughDesignation
Adaptive Trial Design
Emerging Challenge

8
Acceleration Challenges, Risks, & Mitigation
Enhance analytical and characterization paradigmExpand early understanding of pCQAs vs. CQAs and associated CPPsPlatform methods throughout development or utilize retainsAlign FIH and commercial process platforms (w/mfg network)Leverage all preclinical and clinical data (platform)Harmonize process and analytics for development programsIncreased interaction with FDA/regulators
Maintain Sensible Stage Appropriate Resource Spend
Commercial Process ReadinessCommercial Launch Site ReadinessStability Data from P3/Commercial Scale LotsProcess characterization/PVClinical Qualification/Support of Specifications
ACCELERATIONRISKS
MITIGATIONSTRATEGY

9
Enablement Considerations
Fast to Sequence versus Fast to FIH versus Speed to PatientDesigning the Molecule: DevelopabilityResearch versus Development ToolsInformation ContinuityHarmonizationResource Spending (at risk): Now versus LaterHTS Investment: Lean versus Resource NeutralEnable Clinical Experience: Clinical Qualification

10
Key Solutions
• Molecular design• Integrated PD, analytical development, manufacturing, and testing network• Co-operate/leverage Discovery data• Small/sufficient amounts of drug available quickly• Advanced platforms (cell line, methods, specs, processes)• Tox quantities & quality• Launch-capable CMC platform approach at Phase I• Commercial process evaluation• Global focus CM&C package• Platform formulation• Clinical qualification of CQAs• Harmonization of development portfolio (including pearls)• Transfer assets to commercial sites early
Presentation Focus
Strategic driver to stay resource neutral and create efficiencies

Monitored Parameter/
Attribute
PP/PA with alert ranges
11
Molecular Design with CMC Development in Mind
Mind your Ps and Qs – Example of IPC Decision Tree
Yes
Yes
Yes
No
No
No
Does the variable impact product CQA?
Variable impact process performance?
Easily Controlled?
CPP / CPA
PP/PA with action ranges
Stability:time, temperature, and concentration variables
12
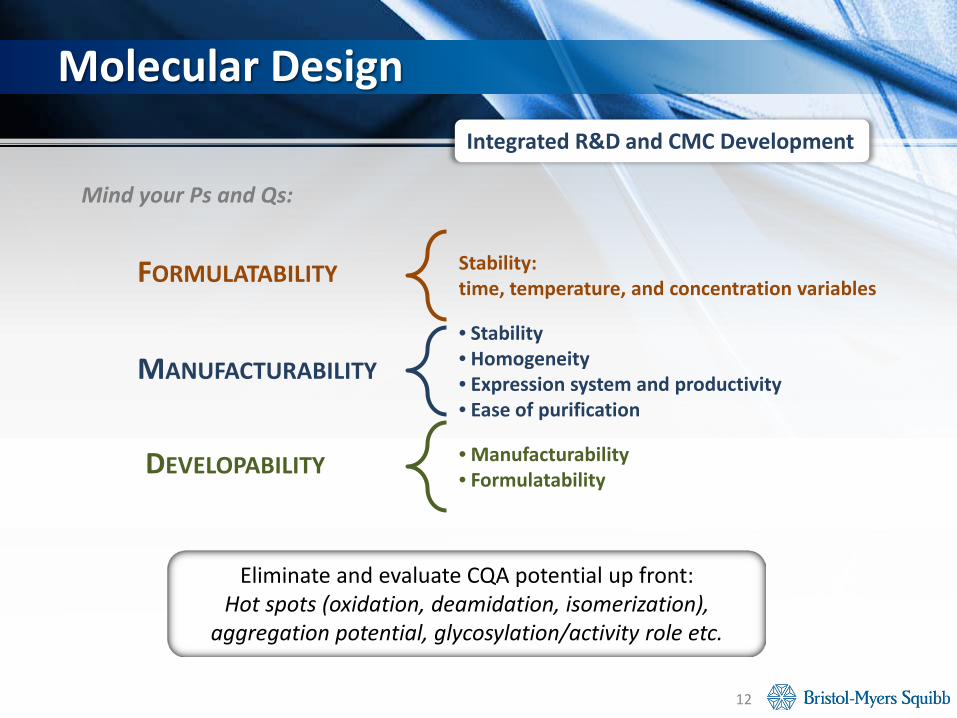
Molecular DesignIntegrated R&D and CMC Development
Mind your Ps and Qs:
Eliminate and evaluate CQA potential up front: Hot spots (oxidation, deamidation, isomerization),
aggregation potential, glycosylation/activity role etc.
FORMULATABILITY
MANUFACTURABILITY
DEVELOPABILITY
• Stability• Homogeneity• Expression system and productivity• Ease of purification
• Manufacturability• Formulatability

13
Design Considerations – mAbs (and ADCs)
Reference: Nature Reviews Immunology 10, 345-352 (May 2010)

14
CQA Litmus Test
British Dictionary Definition:1. a test to establish the acidity or alkalinity of a mixture2. a critical indication of future success or failure
Cell cultureHeat stressOxidation stressDesialylate/deglycosylate
Risk assess CQA per ICH Q6B
7.1e4 7.2e4 7.3e4 7.4e4 7.5e4 7.6e4 7.7e4 7.8e4 7.9e4 8.0e4 8.1e4 8.2e4Mass, Da
500
1000
1500
2000
2500
3000
3500
4000
4500
5000
5500
6000
6500
7000
7500
Intensi
ty, Co
unts
74869.3696
75031.1213
75187.6236
74915.119674097.7559
75559.508074262.5647 76176.949070916.8502 73937.6528 77733.169176279.6901 81614.129072753.5554 81045.451773636.3956
Reduced
HC G0F
HC G1F
HC G2F
Monitored Parameter/
Attribute
PP/PA with alert ranges
15
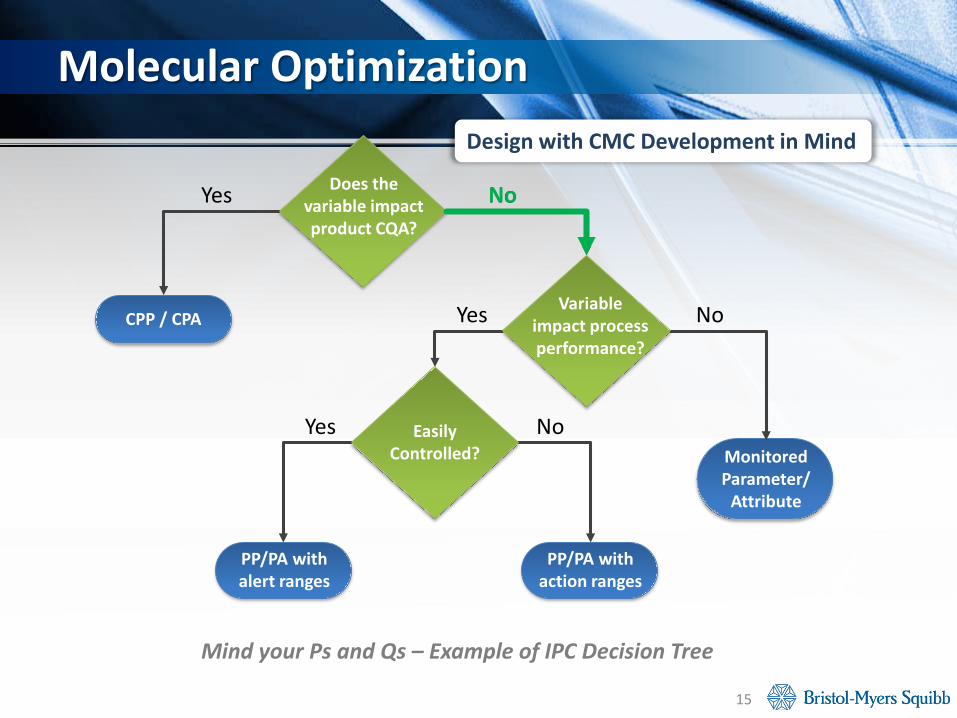
Molecular OptimizationDesign with CMC Development in Mind
Mind your Ps and Qs – Example of IPC Decision Tree
Yes
Yes
Yes
No
No
No
Does the variable impact product CQA?
Variableimpact process performance?
Easily Controlled?
CPP / CPA
PP/PA with action ranges
No

16
CQA Clinical Qualification – Case Study
BackgroundEnable commercial shelf of 2 years at 2-8 ͦC (liquid)Allow for 2 weeks interim storage at 25 ͦC during shipment and packagingMolecule contains “key liability” forming at 0.5% per month at 2-8 ͦC (isoAsp)Product related impurity versus product related substanceDS and DP levels at release are consistently ~ 1%
ChallengeSimple arithmetic: 1% + 24 mos. x 0.5%/mos. + X + Y = ~ 15%Experience and assay variabilityPatient experience at filing versus end of shelf life specifications

17
Product Related Substance Evaluation Part 1 - Structural
Dissociation Constants for Molecule P & Molecule P IsoAsp
Sample KD (nM) 95% CI (nM)Molecule P 34 26-43
Molecule P IsoAsp 39 31-47
CD Spectroscopy
Biacore Binding Data
Molecule PMolecule P IsoAsp
Molecule PMolecule P IsoAsp

18
Product Related Substance Evaluation Part 2 - Bioactivity
0
0.2
0.4
0.6
0.8
1
1.2
Rel.
to C
ontr
ol
Molecule P 20% IsoAspMolecule P
IsoAspMolecule P
Molecule P20% IsoAsp Molecule PIsoAsp Molecule P
Molecule PDegraded Molecule P
Molecule PIsoAsp Molecule P
Molecule P BioAssay Molecule P BioAssay
Molecule P Primary Cell Assay Molecule P Primary Cell Assay

19
Product Related Substance Evaluation Part 3 - PK
0 8 16 24 32 40 48 56 64 720.0001
0.001
0.01
0.1
1
10PEG-rIL-29IsoAsp PEG-rIL-29LLOQ
Time (h)
Mea
n PE
G-r
IL-2
9Se
rum
Con
c. ( µ
g/m
L)
Mea
n M
olec
ule
P Se
rum
Con
c.
(µg/
mL)
Molecule PMolecule P IsoAsp
0.01
0.1
1
10
100
0 7 14 21 28 35 42 49 56 63 70 77 84PE
G-rIL
-29
IsoA
sp(n
g/m
L)Time (d)
PEG-rIL-29 IsoAsp Concentration over Time
240 µg dose in man (DP at EOS)
2.5 mg/kg dose in monkey (DP with 1% IsoAsp)
Mol
ecul
e P
IsoAs
p(n
g/m
L)
Molecule P IsoAsp Concentration over Time
Human Dosing
Cyno Dosing

20
Product Related Substance Evaluation
The Tricky Part
Comparable properties as it relates to clinical efficacy and safety (including immunogenicity)
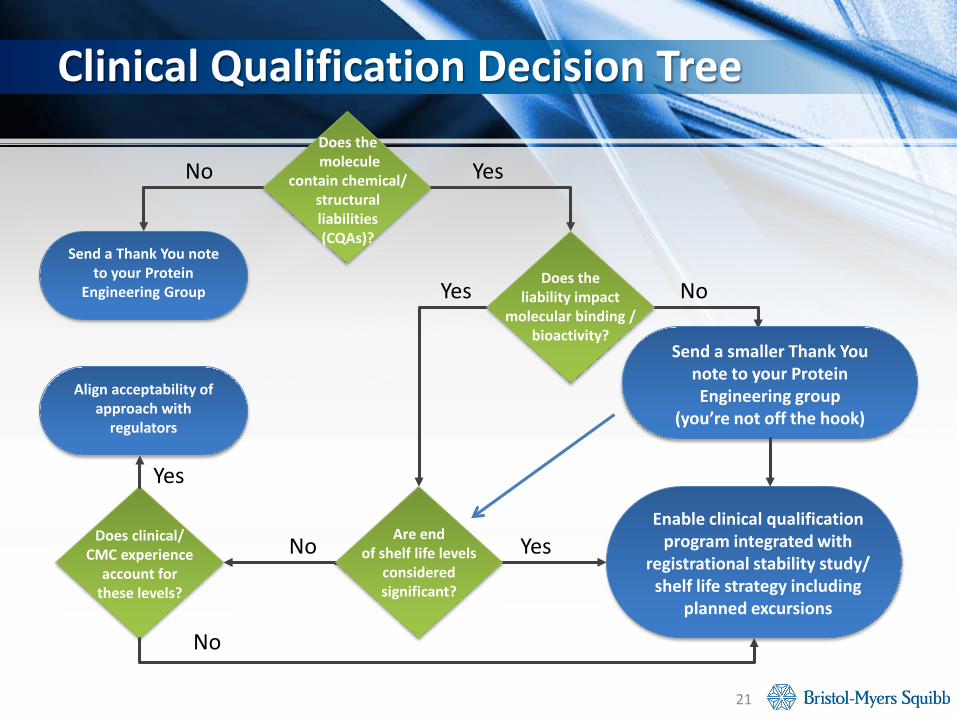
Enable clinical qualification program integrated with
registrational stability study/ shelf life strategy including
planned excursions
21
Clinical Qualification Decision Tree
No
Yes
No
Yes
Yes
No
Does themolecule
contain chemical/ structural liabilities (CQAs)?
Does the liability impact
molecular binding / bioactivity?
Send a Thank You note to your Protein
Engineering Group
Are end of shelf life levels
considered significant?
Align acceptability of approach with
regulators
Does clinical/ CMC experience
account for these levels?
Yes
No
Send a smaller Thank You note to your Protein Engineering group
(you’re not off the hook)
22
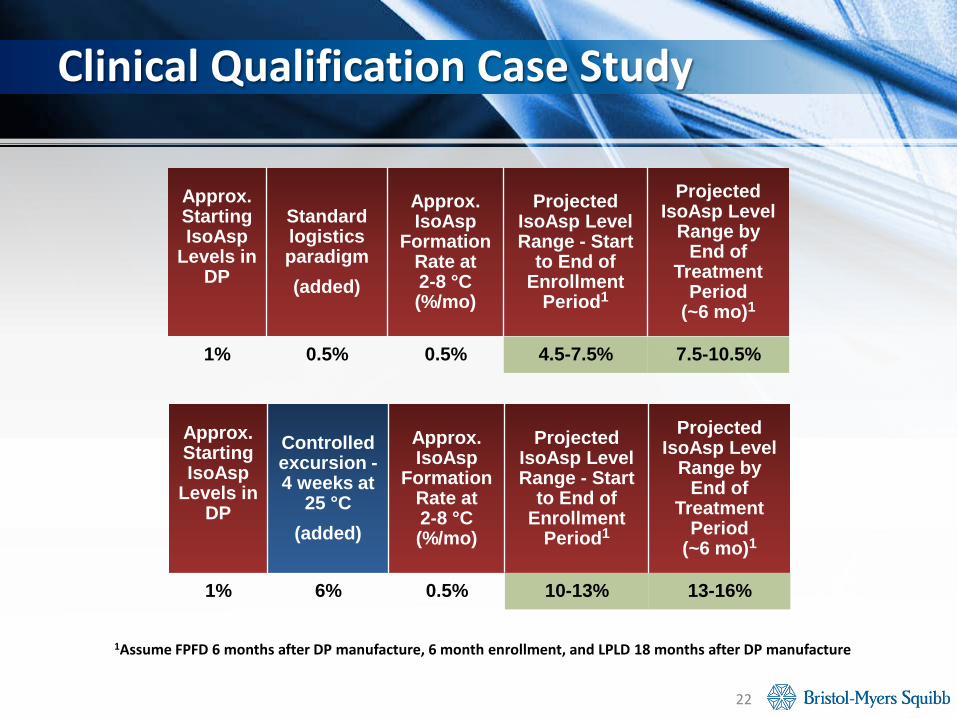
Clinical Qualification Case Study
1Assume FPFD 6 months after DP manufacture, 6 month enrollment, and LPLD 18 months after DP manufacture
Approx. Starting IsoAsp
Levels in DP
Standard logistics paradigm(added)
Approx. IsoAsp
Formation Rate at 2-8 °C (%/mo)
Projected IsoAsp Level Range - Start
to End of Enrollment
Period1
Projected IsoAsp Level
Range by End of
Treatment Period
(~6 mo)1
1% 0.5% 0.5% 4.5-7.5% 7.5-10.5%
Approx. Starting IsoAsp
Levels in DP
Controlled excursion -4 weeks at
25 °C(added)
Approx. IsoAsp
Formation Rate at 2-8 °C (%/mo)
Projected IsoAsp Level Range - Start
to End of Enrollment
Period1
Projected IsoAsp Level
Range by End of
Treatment Period
(~6 mo)1
1% 6% 0.5% 10-13% 13-16%

23
Clinical Qualification Enabler
Controlled excursion(s)
Clinical experience with relevant lots
Don’t be afraid to sacrifice weeks for years
24
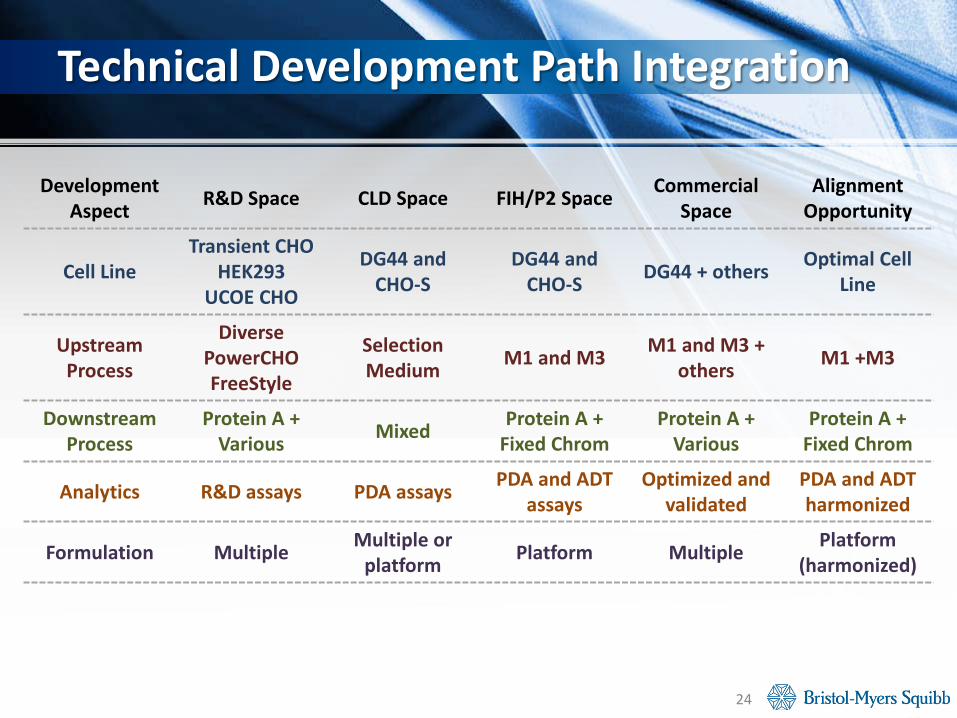
Technical Development Path Integration
Development Aspect R&D Space CLD Space FIH/P2 Space Commercial
SpaceAlignment
Opportunity
Cell LineTransient CHO
HEK293UCOE CHO
DG44 and CHO-S
DG44 and CHO-S DG44 + others Optimal Cell
Line
Upstream Process
DiversePowerCHOFreeStyle
Selection Medium M1 and M3 M1 and M3 +
others M1 +M3
DownstreamProcess
Protein A + Various Mixed Protein A +
Fixed ChromProtein A +
VariousProtein A +
Fixed Chrom
Analytics R&D assays PDA assays PDA and ADT assays
Optimized and validated
PDA and ADT harmonized
Formulation Multiple Multiple or platform Platform Multiple Platform
(harmonized)
25
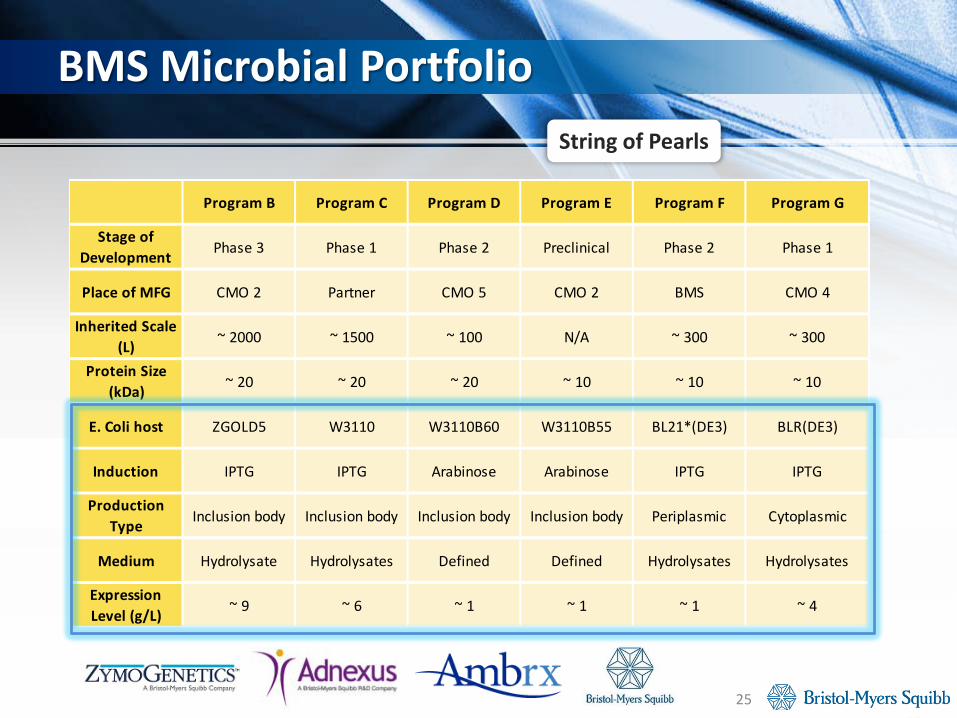
BMS Microbial Portfolio
Program B Program C Program D Program E Program F Program G
Stage of Development Phase 3 Phase 1 Phase 2 Preclinical Phase 2 Phase 1
Place of MFG CMO 2 Partner CMO 5 CMO 2 BMS CMO 4
Inherited Scale (L) ~ 2000 ~ 1500 ~ 100 N/A ~ 300 ~ 300
Protein Size (kDa) ~ 20 ~ 20 ~ 20 ~ 10 ~ 10 ~ 10
E. Coli host ZGOLD5 W3110 W3110B60 W3110B55 BL21*(DE3) BLR(DE3)
Induction IPTG IPTG Arabinose Arabinose IPTG IPTG
Production Type Inclusion body Inclusion body Inclusion body Inclusion body Periplasmic Cytoplasmic
Medium Hydrolysate Hydrolysates Defined Defined Hydrolysates Hydrolysates
Expression Level (g/L) ~ 9 ~ 6 ~ 1 ~ 1 ~ 1 ~ 4
String of Pearls

26
BMS Microbial PortfolioPartially Harmonized
Program B Program C Program D Program E Program F
Stage of Development Phase 3 Phase 1 Phase 2 Preclinical Phase 2
Place of MFG CMO 6 CMO 6 CMO 7 CMO 6 CMO 7
Fermentation Scale (L) ~ 2000 ~ 2000 ~ 3000 ~ 2000 ~ 3000
E. Coli host W3110 W3110 W3110 W3110 W3110
Induction IPTG IPTG Arabinose Arabinose IPTG
Production Type Inclusion body Inclusion body Inclusion body Inclusion body Inclusion body
Media Hydrolysates Hydrolysates Hydrolysates Hydrolysates TBD
Expression Level ~9 g/L ~ 6 g/L ~ 5 g/L ~ 5 g/L TBD
Testing SynergiesDNAHCP
Titer Assay
DNAHCP
Titer Assay
DNAHCP
Titer Assay
DNAHCP
Titer Assay
DNAHCP
Titer Assay
27
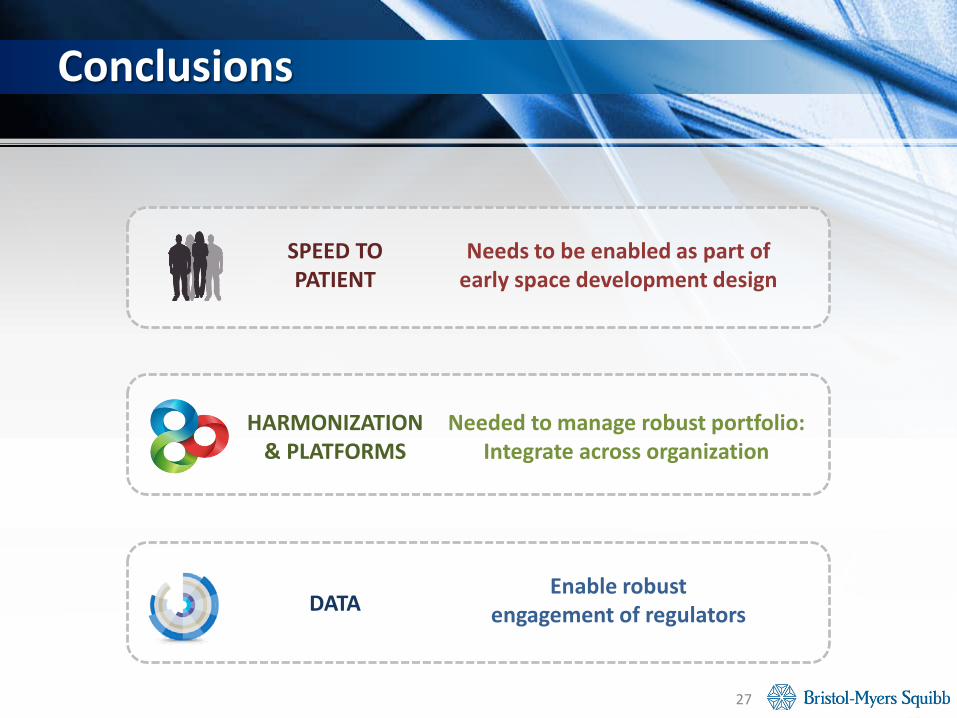
Conclusions
SPEED TO PATIENT
HARMONIZATION & PLATFORMS
DATA
Needs to be enabled as part of early space development design
Needed to manage robust portfolio: Integrate across organization
Enable robust engagement of regulators

Morrey Atkinson, Brendan Hughes, & Annie Sturgess
Leland Paul, Siegfried Rieble, Karen De Jongh & John Fann
Lori Burton, Mark Hill, & Jeff Meyer
Mitchell Tai, Gautam Nayar, & Teri Aldrich
28
Acknowledgments


