
Brains and Breakfast Guy Phillipson, CEO IAB UK

Three device lives: tablets in context

Objectives
To understand the ways in which people consume content across mobile, tablet and PC devices
Core Objective:
Through exploration of:
Differences in consumption between
devices
Appreciation of device optimised content on
each device
Interaction with advertising across the
three devices
… and crucially what this means for advertisers

The smartphone is used with the highest frequency
Which device did you use to access the internet or use an app?
PC+Smartphone Users
Tablet+PC+Smartphone Users
17% 21% 19% 79% 63%
Base: PC+Smartphone Users 413 / Tablet+PC+Smartphone Users 256

Each device has it’s moment during the day- the tablet particularly during the evening
0%
5%
10%
15%
20%
25%
30%
35%
Night Time 1-3am
Early Morning 4-6am
Morning 7-9am
Late morning 10am-12am
Early Afternoon 1pm-3pm
Afternoon 4-6pm
Early Evening 7-9pm
Late Evening 10-12pm
% o
f Int
erac
tions
Day in the Life of Device Usage - Weekday
Desktop Mobile Tablet
Base (number of check-ins): Desktop & Laptop 436 / Smartphone & Mobile 1544

0%
5%
10%
15%
20%
25%
30%
Night Time 1-3am
Afternoon 4-6pm
Morning 7-9am Late morning 10am-12am
Early Afternoon 1pm-3pm
Early Evening 7-9pm
Late Evening 10-12pm
% o
f Int
erac
tions
Day in the Life of Device Usage - Tablets
Weekday Weekend
Tablet usage peaks during non working hours
Base (number of check-ins): Desktop & Laptop 436 / Smartphone & Mobile 1544 / Tablet PC 185

Tablets are a multi-tasking device
51% Tablet usage with
TV 35%
Mobile usage with TV
33% Desktop
usage with TV
Source: IAB Three Device Lives: Tablets in context

Tablets are an entertainment device
Tablet, 49%
Mobile, 22%
PC, 29%
Which of your devices best allows you to be entertained?
Source: IAB Three Device Lives: Tablets in context

Tablet owners shop a lot
72%
purchase weekly
2:56 2:12
Source: IAB Mojo Study

Smartphones are changing the way we shop
E1b. When you have been out shopping have you ever used your mobile / smartphone to look for more information on products you were thinking of buying?
38% of respondents use their smartphone in store

Top 100 advertiser mobile websites
63% 37% Vs.
Non - Optimised Optimised
Source: IAB Optimised Site Study, GSMA Mobile Media Metrics (MMM) in partnership with comScore

The average minutes per visitor increased by 2 minutes on optimised sites
3
5
0
1
2
3
4
5
6
Non - optimised Optimised
Aver
age
Min
utes
per
Vis
itor
Definition: Average Minutes per Visitor The average number of minutes spent on the website during the month, per visitor.
Source: IAB Optimised Site Study, GSMA Mobile Media Metrics (MMM) in partnership with comScore

There are 33% more average pages per visitor on optimised sites
12
19
0 2 4 6 8
10 12 14 16 18 20
Non - optimised Optimised
Aver
age
Pag
es p
er V
isito
r
Definition: Average Pages per Visitor The average number of pages viewed during a month by persons visiting the website.
Source: IAB Optimised Site Study, GSMA Mobile Media Metrics (MMM) in partnership with comScore

Tablet Ad Formats Study

Methodology
• Quantitative • Ipsos ran a survey of 1,000
respondents completed on their tablet
• 9 ad formats embedded in a mock newspaper page from Celtra platform
• Qualitative • 4 day blogging exercise with 8
tablet owners • Respondents asked interact with a
range of static, animated and interactive ads on their tablets from publications including Wired, Vogue and Vanity Fair
Source: IAB Tablet Ad Format Study July 2012

The 9 formats
Static Dynamic Interactive
MPU
Leaderboard
Full Page
Source: IAB Tablet Ad Format Study July 2012

http://www.youtube.com/watch?v=IATv7_8nOQk
Interactive Example

39% Neutral
45% Agree
There is an expectation for advertisers to be on tablets
“I expect my favourite brands to be advertising
on tablet computers”
Source: IAB Tablet Ad Format Study July 2012

The more dynamic & interactive the tablet ad, the better they perform
Interactive 48% Animated 42%
Static 20%
Engaging
Interactive 40% Animated 33%
Static 21%
Memorable
Interactive 44% Animated 39%
Static 13%
Innovative
Interactive 19% Animated 21%
Static 32%
Boring
Interactive 32% Animated 36%
Static 56%
Ordinary
Source: IAB Tablet Ad Format Study July 2012
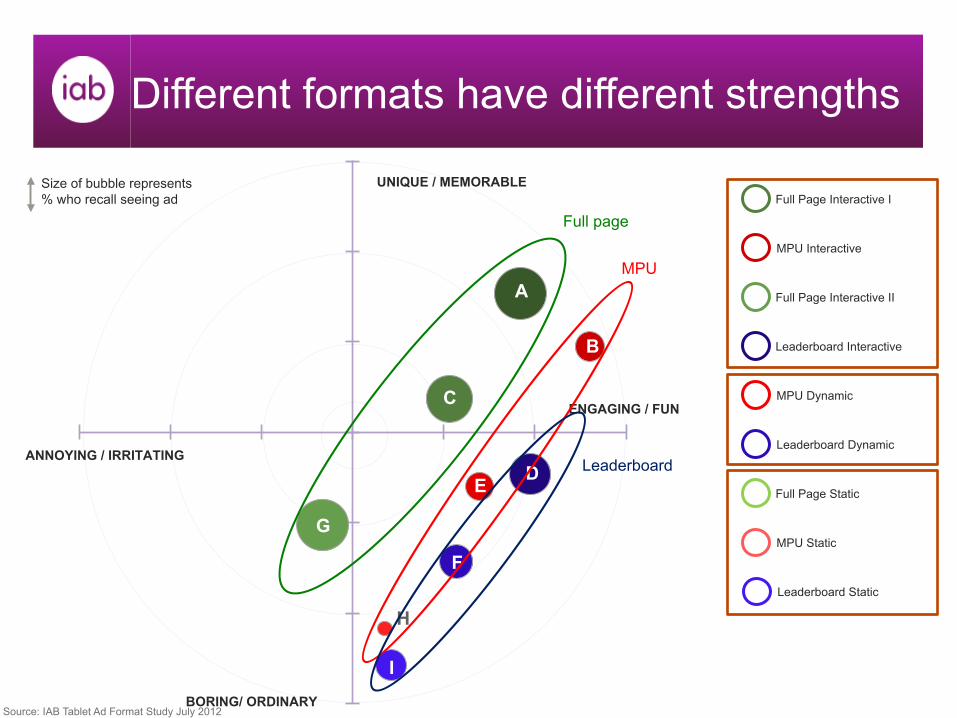
Different formats have different strengths
A Full Page Interactive I
B MPU Interactive
C Full Page Interactive II
D Leaderboard Interactive
E MPU Dynamic
F Leaderboard Dynamic
G Full Page Static
H MPU Static
I Leaderboard Static
Size of bubble represents % who recall seeing ad
A
C
B
D E
F
G
H
I BORING/ ORDINARY
ENGAGING / FUN
UNIQUE / MEMORABLE
ANNOYING / IRRITATING
Full page
MPU
Leaderboard
Source: IAB Tablet Ad Format Study July 2012

iabuk.net/contact
Summary
• Consumers already expect to see tablet ads and like ad funded models
• Interactive formats create a connection- consumers like to ‘get their hands dirty’ with tablets
• Although consumers expect more from tablet ads, the old rules of advertising still apply. Context is king.


