
Office of Research & Library ServicesWSDOT Research Report
Guidelines for Prioritization of Future Active Traffic Management Deployment
Mark E. HallenbeckDuane WrightJohn M. Ishimaru
WA-RD 808.1 January 2014
16-06-0256

Research Report Agreement T4118, Task 95
ATM Tool Testing
by
Mark E. Hallenbeck TRAC-UW Director
Duane Wright Systems Analyst Programmer
John M. Ishimaru Senior Research Engineer
Washington State Transportation Center (TRAC-UW) University of Washington, Box 354802 University District Building, Suite 535
1107 NE 45th Street Seattle, Washington 98105-4631
Washington State Department of Transportation Technical Monitor Bill Legg, State ITS Operations Engineer
Prepared for
The State of Washington Department of Transportation
Lynn A. Peterson
January 2014
GUIDELINES FOR PRIORITIZATION OF FUTURE ACTIVE TRAFFIC MANAGEMENT
DEPLOYMENT


1. REPORT NO. 2. GOVERNMENT ACCESSION NO. 3. RECIPIENT'S CATALOG NO.
WA-RD 808.1 4. TITLE AND SUBTITLE 5. REPORT DATE
GUIDELINES FOR PRIORITIZATION OF FUTURE January 2014 ACTIVE TRAFFIC MANAGEMENT DEPLOYMENT 6. PERFORMING ORGANIZATION CODE 7. AUTHOR(S) 8. PERFORMING ORGANIZATION REPORT NO.
John Ishimaru, Mark Hallenbeck, and Duane Wright 9. PERFORMING ORGANIZATION NAME AND ADDRESS 10. WORK UNIT NO.
Washington State Transportation Center (TRAC) University of Washington, Box 354802 University District Building; 1107 NE 45th Street, Suite 535
11. CONTRACT OR GRANT NO.
Seattle, Washington 98105-4631 Agreement T4118 Task 95 12. SPONSORING AGENCY NAME AND ADDRESS 13. TYPE OF REPORT AND PERIOD COVERED
Research Office Washington State Department of Transportation Transportation Building, MS 47372
Research Report
Olympia, Washington 98504-7372 14. SPONSORING AGENCY CODE
Project Manager: Doug Brodin, 360-705-7972 15. SUPPLEMENTARY NOTES
This study was conducted in cooperation with the U.S. Department of Transportation, Federal Highway Administration. 16. ABSTRACT:
This project tested the prototype software and procedures being developed in conjunction with the SHRP2 L08 project, called FREEVAL-ATDM, for estimating the benefits of improved operations to freeway reliability. That software, a version of the FREEVAL software, computes performance metrics by using algorithms from the 2010 Highway Capacity Manual and new software tools. This report describes the outcome of tests of the use of that software to estimate performance of I-5 in two locations: 1) northbound through Joint Base Ft. Lewis/McChord (JBLM) and 2) northbound approaching downtown Seattle starting just south of the I-405 interchange in Tukwila. The summary conclusions from these tests are that the model can produce the useful outputs for which it was intended, but it tends to under-estimate the travel times and delays actually experienced on the roadway, and it likely needs some additional calibration. 17. KEY WORDS 18. DISTRIBUTION STATEMENT
ATDM analysis, traffic operations modeling, modeling roadway reliability
No restrictions. This document is available to the public through the National Technical Information Service, Springfield, VA 22616
19. SECURITY CLASSIF. (of this report) 20. SECURITY CLASSIF. (of this page) 21. NO. OF PAGES 22. PRICE
None None


iii
DISCLAIMER
The contents of this report reflect the views of the authors, who are responsible
for the facts and the accuracy of the data presented herein. The contents do not
necessarily reflect the official views or policies of the Washington State Department of
Transportation or Federal Highway Administration. This report does not constitute a
standard, specification, or regulation.
iv
TABLE OF CONTENTS
Section Page
Introduction ......................................................................................................................................... 1
Background ........................................................................................................................................... 1
Project Objectives ............................................................................................................................... 2
Project Tasks ........................................................................................................................................ 3
Contents of this Document .............................................................................................................. 3
Model Development Process .......................................................................................................... 4 Overall Modeling Process ........................................................................................................................... 4 Key Reference Documents .......................................................................................................................... 5 Basic Data Requirements and Data Sources ....................................................................................... 6
Description of the Resulting Models ......................................................................................... 15 The JBLM Model ........................................................................................................................................... 15 The Seattle ATM Model ............................................................................................................................. 23
Operating and Testing the Models ............................................................................................ 29 JBLM Test Case ............................................................................................................................................. 31 Seattle Test Case .......................................................................................................................................... 37
Guidelines, Lessons Learned, and Future Enhancements ................................................. 41 Guidelines and Lessons Learned for FREEVAL-ATDM Model Development ..................... 41 Potential Enhancements to the FREEVAL-ATDM Tool Set ........................................................ 48
Conclusions ........................................................................................................................................ 49
v
FIGURES 1 Entry Volume for the Total PM Peak Period .............................................. 16
2 Comparison of Entry Volume Against Total JBLM Ramp Volumes ......... 18
3 Alternative Comparison of Entry Volume Against Total JBLM Ramp
Volumes ...................................................................................................... 18
4 Distribution of AM Peak Traffic Volumes on Seattle ATM Test Section . 25
5 Frequency of Congestion in the Seattle Test Corridor ................................ 39
TABLES 1 Initial JBLM Scenarios ............................................................................... 22
2 Seattle ATM Section Scenarios .................................................................. 28
3 JBLM Low Entry Volume Scenario Results .............................................. 33
4 JBLM High Entry Volume Scenario Results .............................................. 34
5 Seattle Scenario Results .............................................................................. 38

1
GUIDELINES FOR PRIORITIZATION OF FUTURE ACTIVE TRAFFIC MANAGEMENT DEPLOYMENT
INTRODUCTION
As demand and congestion grow on freeway corridors, travelers experience increasing
average travel times, as well as more unreliable travel times, i.e., greater variability in travel
times on a day to day or hour to hour basis. Higher congestion and demand also increase the
likelihood of collisions and other roadway incidents.
There is a need for useful procedures and tools that can help quantify problems with
average travel conditions, travel reliability, and incident occurrence, and analyze the effects of
particular operational strategies on those conditions. Such procedures would assist planners,
engineers, and decision makers in better allocating scarce resources to projects that offer the best
opportunity for enhancing traffic mobility and safety. The results of such procedures would also
provide useful input to the programming and prioritization process.
BACKGROUND
WSDOT has extensive experience with the use of various operational treatments on state
roadways, ranging from incident management to HOV and HOT lanes and ramp metering
systems. These strategies can produce traffic flow and safety benefits while being significantly
less expensive than many capacity improvement projects. As budget constraints continue to be a
significant issue, operational strategies can be effective tools for coping with congestion,
improving travel reliability, and reducing the occurrence of incidents.
In 2010, WSDOT began operation of its first urban Active Transportation and Demand
Management (ATDM) project, on I-5 in Seattle. This system uses a combination of operational
treatments including speed harmonization, lane controls, and queue warning systems to manage

2
traffic flow for northbound traffic heading toward downtown Seattle. Elsewhere in the Seattle
area, similar systems began operation on SR 520 in 2010 and on I-90 in 2011.
As operational treatments continue to be implemented in Washington state, there is a
need for procedures that can assist in a) quantifying the nature of a problem at a particular
location or corridor in terms of the average traffic conditions, the volatility (variability or
reliability) of traffic conditions, and safety issues, and b) analyzing the benefits of various
operational treatments. Having an established methodology for quantifying descriptions of
existing traffic conditions and issues will provide a means of prioritizing locations according to
their need for traffic and safety improvements and will also generate the data necessary to
support subsequent before-and-after evaluations of the effects of implementing particular
operational strategies. Quantified descriptions of traffic conditions will also provide valuable
input to the programming and prioritization process.
PROJECT OBJECTIVES
This project had several objectives. The first was to test a procedure that uses a
combination of existing data, defined performance metrics, nationally accepted algorithms, and
new software tools to estimate average mobility conditions, travel reliability (volatility),
collisions, and incident occurrence for a given area or project. The second was to use that
procedure to analyze a freeway corridor in Washington state and estimate the traffic and safety
characteristics of selected segments along that corridor. The third was to illustrate how the
effects of potential ATDM traffic flow and safety projects can be analyzed and to document any
guidelines developed and lessons learned about the modeling process during the project.

3
PROJECT TASKS
The primary activities of this research project focused on testing a new freeway
performance analysis methodology and tool set developed as part of the second Strategic
Highway Research Program (SHRP2). The tool set, called FREEVAL-ATDM, was designed to
evaluate freeway performance with a particular focus on travel reliability and the potential
effects of ATDM strategies. The research activities began with a review of the literature to
develop an understanding of the procedures and data requirements of the methodology. This was
followed by a review of sources of necessary data for Washington state freeways, as well as the
methods for acquiring and processing those data. With this information, the necessary data were
collected for two different test models in Washington state on the Interstate 5 corridor. Next,
models were developed with the new tool set for the two test locations. This required the
acquisition of all necessary model inputs, construction of the models within the SHRP2 tool set
structure, development of definitions for the alternative background scenarios that the tool set
uses to test performance variability, and testing of the models’ operation. The operational
models were then run, and their outputs were compared to other sources of performance data.
The results of the testing process were then reviewed to determine issues and opportunities
associated with using the new tools, including the process of collecting the input data and other
information necessary to construct the model and background scenarios, guidelines for using the
new methodology to evaluate baseline performance and expected benefits of ATDM operational
strategies, and other practical guidance associated with use of the tool set.
CONTENTS OF THIS DOCUMENT
This report summarizes the results of tests of a prototype sketch planning tool set, called
FREEVAL-ATDM, that can be used to quantify the nature and magnitude of existing

4
congestion and safety problems in a variety of scenarios and potentially analyze the benefits of
selected operational approaches. This report documents the following: 1) Results of testing the
prototype procedure using models developed for two segments of the Interstate 5 corridor in
Washington state as a testbed; 2) key data sources, procedures, and reference resources that
helped facilitate model development; 3) descriptions of the two models developed during this
research; 4) guidelines for model development, that arose from the work in this study; 5) lessons
learned during the research regarding the potential benefits of the prototype procedure; and 6)
potential new features of the prototype system that could enhance its usefulness as an ATDM
strategy evaluation tool.
MODEL DEVELOPMENT PROCESS
In this section we describe the process required to build and operate models with the
FREEVAL-ATDM tool set.. The descriptions, based on our experiences developing models for
two freeway facilities in Washington state, focus on the steps in the model development process,
basic input data requirements, sources for those data, and scenario development procedures.
Overall Modeling Process
The FREEVAL-ATDM tool set is an adaptation of the Excel Visual Basic-based
FREEVAL implementation of the 2010 Highway Capacity Manual (HCM) methods for freeway
performance evaluation. In the FREEVAL-ATDM adaptation, the FREEVAL spreadsheet tool
is the computational “engine” that evaluates freeway performance for a given set of inputs. The
FREEVAL tool has been adapted for use in analyzing ATDM techniques by including a batch
mode that allows the FREEVAL engine to process a series of different background conditions, or
“scenarios,” each of which is a variation of the FREEVAL model’s base conditions. Each
scenario represents a set of factors—a particular combination of demand level, incident status,
5
weather conditions, and/or work zone activity; users define these factors by adjusting the speed,
capacity, and or demand characteristics of the base conditions. Thus users explicitly account for
variability in background conditions by assigning a range of scenarios. This is especially
important for evaluating ATDM benefits, since ATDM strategies are often employed in
situations where they are intended to adapt to changes in background conditions.
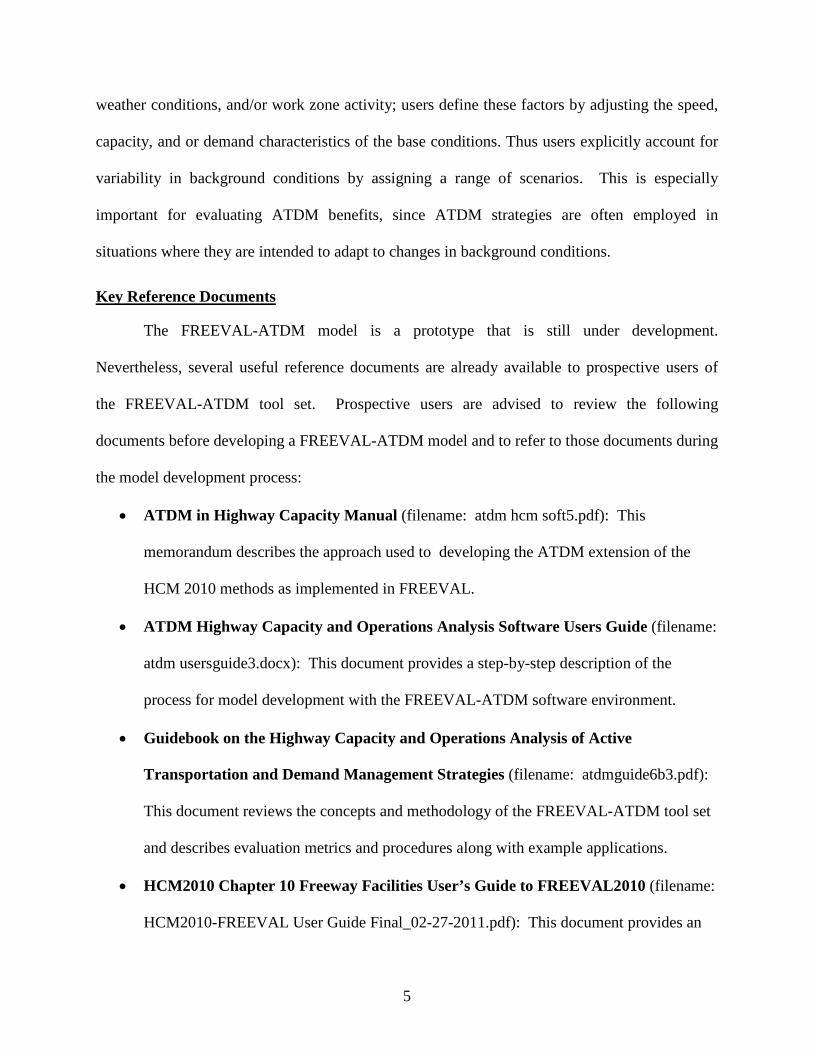
Key Reference Documents
The FREEVAL-ATDM model is a prototype that is still under development.
Nevertheless, several useful reference documents are already available to prospective users of
the FREEVAL-ATDM tool set. Prospective users are advised to review the following
documents before developing a FREEVAL-ATDM model and to refer to those documents during
the model development process:
• ATDM in Highway Capacity Manual (filename: atdm hcm soft5.pdf): This
memorandum describes the approach used to developing the ATDM extension of the
HCM 2010 methods as implemented in FREEVAL.
• ATDM Highway Capacity and Operations Analysis Software Users Guide (filename:
atdm usersguide3.docx): This document provides a step-by-step description of the
process for model development with the FREEVAL-ATDM software environment.
• Guidebook on the Highway Capacity and Operations Analysis of Active
Transportation and Demand Management Strategies (filename: atdmguide6b3.pdf):
This document reviews the concepts and methodology of the FREEVAL-ATDM tool set
and describes evaluation metrics and procedures along with example applications.
• HCM2010 Chapter 10 Freeway Facilities User’s Guide to FREEVAL2010 (filename:
HCM2010-FREEVAL User Guide Final_02-27-2011.pdf): This document provides an

6
overview of and step-by-step instructions for FREEVAL use. While the FREEVAL
version discussed in this guide differs from the FREEVAL-ATDM version, the guide
nevertheless provides useful modeling guidelines and examples.
While the above documents provide formal definitions and procedures for FREEVAL-
ATDM model development, the discussion below provides supplementary notes as an additional
resource for the user. These additional notes were developed while we constructed and tested
models with the FREEVAL-ATDM tool set during this research project. The notes focus on the
minimum requirements for FREEVAL-ATDM model development for the first-time user, as
well as Washington state-specific resources for the necessary input data. They include
information about data requirements, data sources, guidelines, and lessons that we learned during
this modeling process.
Basic Data Requirements and Data Sources
During the process of developing two test models, project researchers focused on
documenting the essential data requirements for modeling a freeway facility with the prototype
FREEVAL-ATDM tool set (version dated 3.5.13). This prototype has the following restrictions:
• The modeled facility must consist of exactly 20 segments. • Exactly 16 15-minute time periods (i.e., 4 hours) are modeled. • Exactly 30 scenarios are modeled.
The FREEVAL-ATDM modeling process includes 1) the development of a descriptive
model of the freeway facility, and 2) descriptions of various “scenarios,” or combinations of
background conditions, that can be used to explore variations in performance as a function of a
range of typically occurring situations. The freeway facility model and the scenarios both
require their own set of input data.

7
The following discussion begins with a description of data requirements and sources for a
freeway facility model, followed by a similar description of data required for the scenarios.
Freeway Facility Model
The user designs the freeway facility of interest as a series of connected mainline
segments and associated ramps. The segments are usually defined such that mainline conditions
(e.g., vehicle volumes) within each segment are generally uniform. A typical approach is to first
note the locations of on- and off-ramps and define their nearby “influence areas.” The remaining
segments are then defined as basic (non-ramp) model segments. In addition, the ramps
themselves are defined as segments in the freeway, enabling the FREEVAL model to estimate
the effects of ramps on mainline conditions near merging or exiting traffic.
In addition to defining the freeway segments on the basis of locations where significant
activity occurs (e.g., on- and off-ramps), there is also the practical consideration of the
availability of the data required to properly define each segment. So in this project, after
preliminary segments have been defined, the segment locations were compared with an overlay
of available traffic sensor locations to determine whether existing archives could be used to
provide the data necessary to fully define each segment in the model or alternative algorithms or
data sources had to be developed. The formal reference documents provide more information on
the segment definition process (see “Key Reference Documents”).
The minimum FREEVAL-ATDM data requirements for describing each segment of a
freeway facility include the following:
• Segment type: Each segment is defined as an On-Ramp, Off-Ramp, R segment (a
segment where the traffic influence of two consecutive on- and off-ramps overlaps),
Weaving segment (e.g., weaving on-ramp and off-ramp traffic), or Basic segment (a
mainline segment that is not within an area influenced by ramp traffic or weaving traffic).

8
• Segment length (ft): The length of each segment, in feet, is estimated.
• Number of lanes: The number of lanes of traffic in each segment is defined.
• Freeflow speed (mph): The freeflow speed of the facility segment is entered.
• Segment demand (vph): Upstream vehicle demand is defined, for each 15-minute time
period, in units of vehicles per hour. (This is defined for the first upstream segment of
the freeway facility.)
• Percentage of trucks and percentage of RVs: The percentage of the traffic stream that
consists of trucks and RVs is estimated.
• Lane width (ft) and lateral clearance (ft): Lane geometry is defined in terms of the
width of each traffic lane, and the width of the clearance area between the edge of the
outside lane and the closest obstructing object or structure.
• Ramp demand flows (vph): The ramp demand vehicle volume is defined, for each 15-
minute time period, in units of vehicles per hour.
• Number of lanes on each ramp: The number of lanes of traffic on each ramp is defined.
• Ramp metering (if present): Metering rate parameters are defined.
Note that while most of the attributes listed above are considered fixed over time for
modeling purposes (e.g., number of lanes in a segment), variations in demand volumes over time
for the mainline (from upstream of the study area) and ramps are modeled, and therefore they
must be defined for each 15-minute period.
Freeway Model Data Sources: For most of the data types listed above, sources were
available for developing facility- and time-specific estimates. In other cases, default values were
used. Specific sources of data for Washington state freeway facilities were as follows:
• Segment type: Segments were initially categorized by using information about the

9
roadway geometry in terms of the location and sequence of ramps, interchanges, and the
like. Such data were available from a variety of sources, including the following:
o WSDOT Northwest Region Ramp and Roadway Data Station Reference Guide: This
document provides a schematic diagram of each major freeway facility in the
WSDOT Northwest Region for which there is sensor instrumentation. While the
naming and relative positioning of sensors on the roadway are documented, the guide
is also invaluable as a source of information associated with roadway geometry
(number of lanes, on- and off-ramps, etc). The associated “Ramp and Roadway
Report” is formatted in the same way, with specific vehicle volume estimates. Both
documents can be found at
< http://www.wsdot.wa.gov/Northwest/TrafficVolume/>
o Google Maps: The map search component of Google.com provides overall and
specific views of a freeway facility including ramps, and interchanges, in graphical
and photographic forms. It is useful for confirming specifics about the geometry of a
freeway facility.
• Segment length (ft): Segment lengths was estimated by using GIS data linked to
WSDOT’s Linear Referencing System, which enables users to associate locations on a
map with facility mileposts (and therefore to develop segment lengths). Data files can be
accessed at
< http://www.wsdot.wa.gov/mapsdata/geodatacatalog/default.htm>
Segment lengths were also estimated by using RMDC.LST files associated with the
WSDOT’s FLOW freeway sensor data archives. The RMDC.LST file lists the cross-
street and milepost of each sensor cabinet location (which can then be used to develop

10
segment lengths). The Ramp and Roadway report (cited above) was also a convenient
source of milepost information for interchanges.
• Number of lanes: The number of lanes of traffic in each segment was determined by
using the two sources listed above for segment types (WSDOT Northwest Region Ramp
and Roadway Data Station Reference Guide, and Google Maps). Other statewide
information can be accessed at the State Highway Log:
<http://www.wsdot.wa.gov/mapsdata/roadway/statehighwaylog.htm>.
• Freeflow speed (mph): Users can choose their own freeflow speeds on the basis of
experience and local knowledge. The Guidebook on the Highway Capacity and
Operations Analysis of Active Transportation and Demand Management Strategies
(see Key Reference Documents) also provides guidance on setting the freeflow speed
under different conditions.
• Segment Demand (vph): The most convenient source of demand volumes on the
mainline was the TRACFLOW online datamart. The TRACFLOW system stores a
variety of data types at the spot location, corridor, and trip route levels for freeways
within the WSDOT Northwest Region and Olympic Region, based on data collected by
the WSDOT’s FLOW sensor data network. Specifically for segment demand, spot
volumes are available from the Loopgroup Data Retrieval component of TRACFLOW, at
http://trac29.trac.washington.edu/dotfreewaydata/loopgroup/location_data_map/. The data retrieval process utilizes a map-based interface that allows users to select
specific “loopgroups” (a collection of like sensors, such as “all northbound general
purpose lanes at milepost 170.01”) and then download an Excel-compatible data file for
that loopgroup containing average volume and speed conditions for a user-specified date

11
range, as well as day-by-day volume and speed data. Users can also specify desired days
of the week and lane type (e.g., GP or HOV, mainline or ramp, etc.). Data are presented
at 5-minute intervals over a 24-hour day and can therefore be aggregated into up to 15-
minute time periods (and converted to per-hour values), as required by the FREEVAL-
ATDM model. (The required model values are for the first model segment, i.e., the
segment farthest upstream; volumes for other segments are computed by adding or
subtracting ramp volumes to/from the adjacent upstream segment’s mainline volume.)
For locations outside of the FLOW sensor network, field data or other estimates can be
used.
• Percentage of trucks and percentage of RVs: The percentage of the traffic stream that
consists of trucks and RVs is estimated on the basis of field data or local experience. For
the test models developed by the project researchers, fixed default values were used.
• Lane width (ft) and lateral clearance (ft): Lane geometry was determined by using the
State Highway Log (mentioned above for information about the number of lanes at a
location).
• Ramp demand (vph): The ramp demand vehicle volume was determined by using the
TRACFLOW online datamart (see notes above for segment demand). When ramp data
are not available, volumes can sometimes be estimated by noting the changes in mainline
volume upstream and downstream of the ramp merge or exit location.
• Number of lanes on each ramp: The number of lanes of traffic on each ramp was
determined by using the sources listed above for number of lanes on mainline segments
(WSDOT Northwest Region Ramp and Roadway Data Station Reference Guide, Google
Maps, State Highway Log).

12
ATDM Scenarios
In addition to defining the freeway facility, the user of the FREEVAL-ATDM modeling
process also defines various background scenarios that are typically encountered on that facility.
Every scenario is a particular set of demand conditions, incident conditions, weather conditions,
and workflow conditions, each of which can affect capacity, demand, and speed on the facility.
The FREEVAL-ATDM model is then run for a subset of the possible background scenarios, and
those results are combined in a weighted fashion based on likelihood of occurrence to better
understand how background scenario variations may affect overall facility performance.
A scenario is defined by a combination of “sub-scenarios” (particular demand, incident,
weather, and workflow conditions). An example scenario might consist of “medium demand,”
“minor shoulder incident,” “no precipitation,” and “no work zone activity.” Each sub-scenario is
defined as a level with the range for that variable (e.g., the alternative demand sub-scenarios
might consist of low, medium, and high demand levels). For each level of each sub-scenario, the
user specifies the effect of that level on speed, capacity, and/or demand relative to the base
condition in the FREEVAL model. The minimum FREEVAL-ATDM data requirements and
sources of data for describing each sub-scenario include the following:
Demand Sub-scenarios: The range of vehicle volume demand can be defined on the
basis of the known variation in vehicle volumes over time (e.g., based on TRACFLOW data).
For example, different levels of demand can be defined on the basis of Nth percentile values,
where N can vary from a very low demand (e.g., 5th percentile) to very high demand (95th
percentile). For each level of demand, the user must, at a minimum, define a) the “adjustment
factor” for demand (i.e., how much that level of demand differs from the baseline “seed” demand
values used in the model) and b) the likelihood of occurrence of that level of demand. For
example, if the seed value used was the median volume, then the adjustment factor for demand

13
for the 50th percentile demand level would be 1.0. The likelihood of occurrence of each level can
be estimated by using day-by-day volume data. Demand variations can also be determined by
using other field data
Weather Sub-scenarios: Various weather sub-scenarios can be defined on the basis of
known variations in weather conditions over time. For example, different levels of precipitation,
temperature, wind, or visibility can be combined to form a weather sub-scenario (e.g., light rain
+ moderate temperatures + no wind + good visibility could equal the “light precipitation” sub-
scenario). For each weather sub-scenario, the user must, at a minimum, define a) the “adjustment
factors” for speed, capacity, and demand (i.e., how much those values are affected by the
particular sub-scenario) and b) the likelihood of occurrence. For example, the adjustment factor
for speed would be expected to decrease as severe weather conditions significantly affected
driving conditions (i.e., baseline speeds would be lower during more disruptive weather
conditions). For the models developed by the project researchers, demand was assumed to be
constant, while speed and capacity dropped with more severe weather conditions. (Note that a
particular weather sub-scenario is assumed to affect the entire facility being modeled.)
To determine the likelihood of occurrence of each weather scenario, data about local
weather conditions are required. This can be estimated from available field data. Alternatively,
data for a given location can be accessed online; the data provide an overview of weather
conditions and variations on a day-by-day basis. One such data source suggested by SHRP2
researchers is < http://www.wunderground.com/>.
To access a csv (comma delimited) data file of weather conditions from that website, use
the following steps:
From the wunderground.com home page,

14
• Enter a location in the location field, and “Search." • Scroll, and select the “Today’s Almanac” tab. • Select the “View more history” link. • Select the “Custom” tab, and enter a range of days, then “Go.” • Scroll, and select the comma delimited file link.
Then use Excel to open the file and summarize the results. Note that overall weather
conditions in that file are defined on a daily, not hourly basis, so it was assumed that any weather
events that were indicated (e.g., snow) affected the entire 4-hour time period of the entire model
area.
Incident Scenarios: Incident scenarios can be defined on the basis of data on known
incidents over time. The sub-scenarios can then be classified on the basis of the nature and
location of the incidents. For each incident scenario, the user must, at a minimum, define a) the
“adjustment factors” for speed, capacity, and demand (i.e., how much are those values affected
by the particular incident sub-scenario), b) the likelihood of occurrence, and c) the average
duration, location, and time of the incident. The scenarios are typically classified by the
significance of the incident, as well as the extent of any lane blockage. While the user can
specify the location and time of the incident, ideally the location should be downstream in the
facility and the time should be early in the period. (Another assumption is that there is one
incident per 4-hour period.)
To determine the likelihood of occurrence of each incident scenario, data about local
incidents are required. These can be estimated from the WSDOT’s incident database, using
Excel or other software to tabulate results.
Work Zone Scenarios: Work zone scenarios are defined much like incident scenarios
(blockage level, duration, location, and time of the work zone activity, along with demand and

15
speed adjustment factors and the likelihood of occurrence). Capacity per lane is also estimated.
This research project did not model work zones.
DESCRIPTION OF THE RESULTING MODELS
Two models were developed during this research project. One model looked at
northbound I-5 performance in the vicinity of Joint Base Lewis-McChord (JBLM), while the
other looked at northbound I-5 performance between Southcenter and the West Seattle bridge (an
area affected by the Seattle ATDM project).
The JBLM Model
The JBLM model covered the segment of I-5 that stretches from its southern end just
before the Nisqually River bridge at milepost 114.65 (after the on-ramp from Nisqually) to just
before the off-ramp to SR 512 (milepost 127.40). Road performance was modeled for
northbound traffic, for the PM peak periods for all weekdays in 2012.
Data available from loop sensors maintained by the Olympic Region were used to
develop mainline traffic volumes. Data from only one ramp sensor were available, so changes in
mainline volumes from sensor to sensor were used to estimate on- and off-ramp volumes for the
ramps leading to/from JBLM. Weather data were obtained from a website maintained by the
University of Washington’s Atmospheric Sciences Department.1 The size, duration and
attributes of incidents were obtained from the Washington Incident Tracking System (WITS).
Only incidents occurring in the study period (weekdays, PM peak period, northbound) were
included in the analysis. How each of these variables was converted into the input data used in
the ATDM model is discussed below.
1 https://www.atmos.washington.edu/data/

16
Volume Data
To understand variability in traffic volumes, total PM peak volumes were computed for
the mainline entry point to the study segment. These volumes were summarized as means,
standard deviations, and coefficients of variation, as well as sorted high to low and plotted to find
any obvious clusters of volume conditions (see Figure 1). As can be seen in Figure 1, no
clustering was obvious, and the volume pattern appeared to be nearly continuous, with the
exception of a limited number of extremely high and low volume days. The coefficient of
variation for these volumes was 0.079 (8 percent), indicating that day-to-day entry volume
variation was not high.
Figure 1: Entry Volumes for the Total PM Peak Period
Ignoring the few outlier days, a cluster analysis was used to compute a simple high and a
low volume condition for use in the model. The “seed” volume was set as equal to the lower
volume condition, which was 90 percent of the mean volume condition. The high volume
condition was then set at 120 percent of the seed volume (10 percent above the mean condition).

17
Given a simple cluster analysis, 55 percent of weekdays belonged to the “lower volume”
condition, and 45 percent belonged to the high volume condition.
To understand ramp volume variation, the “entry volume” for each specific day was
subtracted from the “exit volume” (e.g., the I-5 mainline volume just before SR 512) for the
facility for that day. This difference indicated the total number of vehicles entering the
northbound I-5 mainline minus the total number of vehicles exiting the mainline roadway during
the PM peak period as I-5 passes through JBLM. The mean increase in volume due to JBLM was
just over 3,300 vehicles during the PM peak period, but the coefficient of variation for the ramp
volumes was just under 60 percent, indicating that the daily ramp volume totals were highly
variable.
These daily volumes were then plotted against the mainline entry volume for each
specific day (see Figure 2). This graph shows that JBLM ramp volumes were not correlated with
the mainline entry volumes. That is, JBLM ramp volumes (mostly on-ramp volumes in the PM
peak period) ranged from very low (more vehicles exited the freeway than entered it) to very
high (I-5 gained more than 6,000 vehicles in the PM peak period as it passed through JBLM on
more than 20 days.) Another way to view the disconnect between I-5 entry volumes and the
JBLM ramp volumes was to sort the entry volumes high to low, as in Figure 1, and then plot the
JBLM ramp volumes for the day corresponding to those observations. This graphic is shown in
Figure 3.

18
Figure 2: Comparison of Entry Volumes with Total JBLM Ramp Volumes
Figure 3: Alternative Comparison of Entry Volumes with Total JBLM Ramp Volumes
These findings illustrate why the performance of I-5 through JBLM is so variable. On
some days, the base’s Striker Brigades are deployed out of the state, and the level of activity at
the base is low and ramp volumes are consequently very low. On those days, I-5 performs very

19
well unless a major crash occurs. On some days, a portion of the base’s brigades are on base but
other soldiers stationed at JBLM are physically located off base (e.g., at the Yakima Firing
Range); consequently, base activity levels are moderate, and the resulting PM peak period ramp
volumes can cause I-5 to be moderately congested. On still other days, all soldiers stationed at
JBLM are “in town,” and the base operates at full capacity; consequently, the PM peak period
ramp volumes are very high, and the result is high congestion levels on I-5. As can be seen in
figures 2 and 3, the variation in the JBLM volumes is not related to variations in I-5 entry
volumes. That is, when the I-5 entry volume is low, JBLM ramp volumes can be very low,
moderate, or very high. Similar variation is present for JBLM ramp volumes when I-5 volumes
are high entering the JBLM area.
Entering this variation into the ATDM model would be key to replicating the
performance of I-5 through JBLM. Unfortunately, the ATDM model was not designed to have
ramp volumes that are independent of mainline entry volumes. This is a major limitation
of the model in trying to replicate situations such as those on the freeway near JBLM.
Because of this limitation, the only way to replicate the JBLM volume variation was to
make several different model runs. That is, four sets of 30 scenarios were designed to replicate
JBLM conditions. One set of 30 scenarios represented low volume JBLM conditions, a second
set represented moderately low volume conditions, a third set of scenarios was for moderate
ramp volume conditions, and a final set was made for high ramp volumes. Each of these sets of
30 scenarios contained both high and low volume mainline volumes. The results of these models
were then combined manually to compute summary statistics such as vehicle hours of delay.

20
Weather Data
The weather for the study corridor was relatively mild in comparison to the options
provided by the model. Weather fell into only four basic conditions: clear, light rain, moderately
heavy rain, and snow/ice. Except for the snow and ice days, temperatures were mild.
Incident Data
WITS data allowed the project team to determine the total number of incidents occurring
within the PM peak period for all weekdays in 2012, as well as the characteristics of those
incidents, including their duration and the number of lanes blocked. A single incident during the
peak period occurred each of 63 days. An additional 36 days experienced more than one
incident. In trying to determine how to best replicate those days, the “worst” incident was
selected. The algorithm used to select the “worst” incident was as follows: 1) a lane blocking
incident was always selected over a non-lane blocking incident, and 2) the longest-duration
incident of a particular type was then selected.
Because no fatal crashes occurred in 2012 and few injury crashes occurred, we decided to
not use those incident categories in creating incident scenarios for the model. In addition,
because WITS provides detailed incident duration data, a more detailed set of incident duration
categories was possible. This added detail was used in place of the fatal/injury/PDO category
defined in the model. The incident duration categories selected were
1) less than 5 minutes, 2) 5 to less than 15 minutes, 3) 15 to less than 30 minutes, and 4) greater than 30 minutes.
Use of these categories, along with the presence of any lane blockages, allowed a more accurate
reflection of incident disruptions than the use of the default incident scenarios included in the
ATDM model. Unfortunately, the spreadsheet model does not allow the incident category names

21
to be overwritten. The spreadsheet does allow all of the key outcomes associated with each
incident sub-category to be changed by the user. Thus, it was possible to change the speed
adjustment, capacity adjustment, and duration values for each “type” of incident. As a result, we
could “repurpose” the incident categories to fit the available data, but we had to create a “cheat
sheet” to allow translation of the model names in order to select the appropriate scenarios for use
in the “30 scenarios” and to understand the final model outputs. For example, the “injury, shldr”
category provided by the model was actually used to represent a lane blocking incident that
lasted more than 30 minutes.
Scenario Creation
With these data, a single record was made for each day’s PM peak period in 2012. That
record included a variable that described whether the entry volume was high or low, whether the
ramp volumes were in one of five volume categories, which of the four weather categories
applied, and the occurrence and characteristics (lane or shoulder closure and duration) of the
worst incident that occurred that day in the PM peak period. Using these records, it was then
possible to directly compute the frequency of each combination of volume, incident, and
weather, rather than relying on the assumption of random events as is done within the ATDM
model.
Selecting just 30 scenarios was initially accomplished by aggregating some of the
individual scenarios. For example, the low and medium ramp volume alternatives for the same
incident/weather combination could be added together because they differed in volume by only a
modest amount. Similarly, if there was only one 5- to 15-minute lane closure incident, that
incident could be included in the 15- to 30-minute category, as it was the scenario that came
closest to replicating the delays found under the shorter incident condition. The initial 30
scenarios selected for the JBLM model are shown in Table 1.

22
When we discovered that these scenarios could not be entered into one model run,
because it was not possible to enter scenarios with ramp volumes that were not linearly related to
the mainline entry volumes, these scenarios were split into separate model runs. The summary
outcomes from specific scenarios were then extracted from those runs and manually added
together to obtain estimates of total delay.
Table 1: Initial JBLM Scenarios
Scenario Number
Entry Volume Ramp Volume Incident Weather
1 Low Low No Clear 2 Low Low No Rain 3 Low Medium No Clear 4 Low Medium No Light Rain 5 Low Medium No Snow 6 Low Medium + High No Clear 7 Low Medium + High No Light Rain 8 Low Medium + High No Snow 9 High Low + Medium No Clear
10 High Low + Medium No Medium Rain
11 High Medium No Clear 12 High Medium No Light Rain 13 High Medium + High No Clear 14 High Medium + High No Light Rain 15 High Low Lane Blocked 15 – 30 min Clear 16 Low Medium + High Lane Blocked 5 – 15 min Light Rain 17 High Medium + High Lane Blocked 15 – 30 min Light Rain 18 Low Medium Lane Blocked 0 – 5 min Light Rain 19 High Low Shoulder Inc. 0 - 5 min Clear 20 High Medium + High Shoulder Inc. 0 - 5 min Clear 21 Low Low Shoulder Inc. 0 - 5 min Light Rain 22 Low Medium + High Shoulder Inc. 0 - 5 min Light Rain 23 High Low Shoulder Inc. 30 - 90 min Light Rain 24 Low Medium Shoulder Inc. 30 - 90 min Light Rain 25 High Low Shoulder Inc. 5 - 15 min Light Rain 26 Low Medium + High Shoulder Inc. 5 - 15 min Light Rain 27 Low Medium + High Shoulder Inc. 0 - 5 min Light Snow 28 Low Low Shoulder Inc. 0 - 5 min Light Rain 29 High Medium + High Shoulder Inc. 0 - 5 min Light Rain 30 High Low Shoulder Inc. 0 - 5 min Clear

23
The Seattle ATM Model
The roadway section selected for testing runs north from S. 170th St. (milepost 152.9,
south of the I-405 interchange) to S. Lucille St. (milepost 162.57), which is just south of the exit
to the West Seattle Freeway and Columbia Way.
The Seattle ATM model differed from the JBLM model in several important aspects.
First, the AM peak period, rather than the PM peak, was the modeled time period, as the AM
peak is more congested on this section of roadway. Second, ramp volumes are not the primary
factor in the performance of the Seattle section as they are for the JBLM section. Performance of
the Seattle section of roadway is largely influenced by incidents and by the bottleneck that
occurs north of the defined study section.
A bottleneck routinely forms roughly 2 miles north of the study section where two traffic
lanes are dropped as I-5 enters downtown. The bottleneck is exacerbated by disruption caused
by weaving activity associated with on-ramps from the West Seattle Freeway and off-ramps to
Eastbound I-90. For this test, the project team specifically chose to end the northern portion of
the test section south of the most routinely congested portion of I-5 to avoid the worst of the
bottleneck delay. Unfortunately, the backup from that bottleneck does at times extend back into
the study section, so we had to remember in comparing model estimates of delay to actual
measured delay that the model would under-estimate delay because it would not include delay
caused by the downstream bottleneck.
However, the purpose of avoiding the segment of I-5 that routinely bottlenecks was to
allow the project to study the effects of the adjustment values used to estimate the impacts of
different kinds of incidents, as well as the benefits from various ATDM strategies. The intent
was to restrict as much as possible the observed delay caused by those factors, rather than having
delay result from the capacity bottleneck.

24
Data available from the NW Region’s ramp metering and surveillance, control, and driver
information system loop sensors were used to develop mainline and ramp traffic volumes.
Weather data were obtained as described earlier. The size, duration, and attributes of incidents
were obtained from the Washington Incident Tracking System (WITS). Only incidents
occurring in the study period (weekdays, AM peak period) were included in the analysis. These
data and how they were converted into the scenario inputs used by the ATDM model are
discussed below.
Volume Data
The AM peak period volumes were extracted from the TRACFLOW 5-minute data
archive for 2012. An analysis of those data showed that the AM peak period volume on I-5 was
relatively stable. The coefficient of variation for total AM peak period volume for non-holiday
weekdays was just over 7 percent. Figure 4 illustrates these volumes after they have been sorted
high to low. Only seven days had volumes of greater than 30,000 vehicles. Only 19 days had
volumes of less than 25,000, many of which occurred in the last few days of December, when
many commuters are taking vacation. The rest of the days fell within the 5,000 vehicle volume
range of 25,000 to 30,000 vehicles.

25
Figure 4: Distribution of AM Peak Traffic Volumes on Seattle ATM Test Section
Unlike the JBLM test section, volume data were available for the ramps in the study area
from the TRACFLOW data archive. Also unlike the JBLM test section, the variation in ramp
volumes was similar to that for the freeway mainlines. The ramp volumes had coefficients of
variation ranging from 5 to 8 percent.
As a result of the fairly continuous nature of the volume patterns and the similarity in
mainline and ramp volume patterns, we decided to use the ATDM model volume inputs as they
are presented in the model. The 5th, 15th, 30th, 50th, 70th, 85th, and 95th percentile volume
conditions were computed as a function of the mean condition.
Weather Data
As with the JBLM corridor, the weather for the study corridor was relatively mild in
comparison to the options provided by the model. For this set of scenarios, weather was divided
into clear days, days with rain, days with snow, and days with gusting winds. Clear weather was
26
further subdivided into cold (<34 degrees), cool (<50 degrees F), and warm (50+ degrees F)
temperatures. Rain was divided into light and medium rain. Only light snow was observed.
Clear days with wind speeds between 10 and 20 mph were also observed and entered as possible
occurrences in the model’s probability tables.
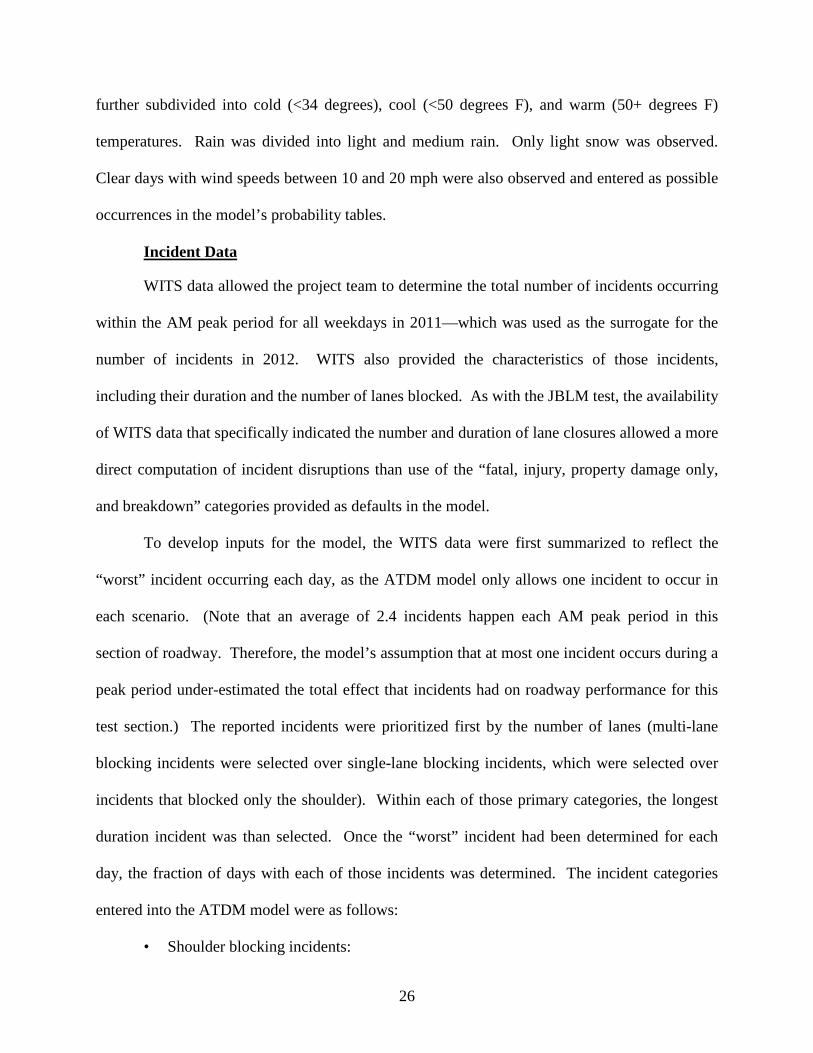
Incident Data
WITS data allowed the project team to determine the total number of incidents occurring
within the AM peak period for all weekdays in 2011—which was used as the surrogate for the
number of incidents in 2012. WITS also provided the characteristics of those incidents,
including their duration and the number of lanes blocked. As with the JBLM test, the availability
of WITS data that specifically indicated the number and duration of lane closures allowed a more
direct computation of incident disruptions than use of the “fatal, injury, property damage only,
and breakdown” categories provided as defaults in the model.
To develop inputs for the model, the WITS data were first summarized to reflect the
“worst” incident occurring each day, as the ATDM model only allows one incident to occur in
each scenario. (Note that an average of 2.4 incidents happen each AM peak period in this
section of roadway. Therefore, the model’s assumption that at most one incident occurs during a
peak period under-estimated the total effect that incidents had on roadway performance for this
test section.) The reported incidents were prioritized first by the number of lanes (multi-lane
blocking incidents were selected over single-lane blocking incidents, which were selected over
incidents that blocked only the shoulder). Within each of those primary categories, the longest
duration incident was than selected. Once the “worst” incident had been determined for each
day, the fraction of days with each of those incidents was determined. The incident categories
entered into the ATDM model were as follows:
• Shoulder blocking incidents:

27
- 0 < 5 minutes - 5 < 15 minutes - 15 < 30 minutes 30+ minutes
• Incidents blocking one lane:
- 0 < 5 minutes - 5 < 15 minutes - 15 < 30 minutes - 30+ minutes
• Incidents blocking more than one lane (assumes 2-lane blockage):
- 0 < 5 minutes - 5 < 15 minutes - 15 < 30 minutes - 30+ minutes
• No incident occurs. As with the JBLM scenarios, the definitions of the “incidents” were changed informally
to take advantage of the above data summaries, which accurately reflected the actual incident
condition within the study section. This included the ability to compute the actual mean duration
of incidents within each of the above categories, which was entered into the model.
Scenario Creation
Unlike the JBLM test case, for the Seattle case study the project team took advantage of
the “scenario generator” function within the model. This involves entering the fraction of days
that each volume condition, incident event, and weather event occurs. The ATDM model then
computes the fraction of days that each combination of those factors should be present, given the
assumption that those events are independent of each other. It is then possible to either select 30
of the scenarios randomly or select a specific set of scenarios.
For this test case, the model-generated scenarios were sorted, and initially the 30 most
common (highest probability) scenarios were selected. Because the ATDM model under-
estimated a number of factors that cause delay (e.g., the number of incidents occurring in the

28
peak period and the effect of the downstream bottleneck), we further decided to remove some of
the smaller delay scenarios (lower volume and clear conditions) and replace them with scenarios
that involved incidents. Still missing from this set of scenarios were most of the more significant
incidents (e.g., multi-lane and longer duration incidents). Even though this roadway experiences
many incidents, major incidents nevertheless are fairly rare, which limited their being selected
because of how the 30 scenarios were chosen. Table 2 illustrates the scenarios used in the model
runs.
Table 2: Seattle ATM Section Scenarios
Scenario Number Volume Condition Incident Location and Duration Weather
1 Low-Med None Clear 2 Med None Clear 3 Med-Hi None Clear 4 V.Low None Clear 5 Low None Clear 6 High None Clear 7 V.High None Clear 8 Low-Med Shoulder 0 < 5 min Clear 9 Med Shoulder 0 < 5 min Clear
10 Med-Hi Shoulder 0 < 5 min Clear 11 Low-Med None Lt.Rain 12 Med None Lt.Rain 13 Med-Hi None Lt.Rain 14 Low-Med Shoulder 5 < 15 min Clear 15 Med Shoulder 5 < 15 min Clear 16 Med-Hi Shoulder 5 < 15 min Clear 17 Low-Med None V.Lt.Snow 18 Med None V.Lt.Snow 19 Med-Hi None V.Lt.Snow 20 Low-Med None V.Lo.Vis. 21 Med None V.Lo.Vis. 22 Med-Hi None V.Lo.Vis. 23 Low-Med Shoulder 15 < 30 min Clear 24 Med Shoulder 15 < 30 min Clear 25 Med-Hi Shoulder 15 < 30 min Clear 26 V.Low Shoulder 0 < 5 min Clear 27 Low Shoulder 0 < 5 min Clear 28 High Shoulder 0 < 5 min Clear 29 V.High Shoulder 0 < 5 min Clear 30 Low-Med 1-lane blocked 5 < 15 min Clear
29
Allowing the random selection of 30 scenarios might result in more accurate estimation
of total annual delay, but that approach would under-estimate the impacts of the implementation
of specific ATDM activities, as those activities are normally most beneficial under “event”
conditions (e.g., incidents, work zones, or unusual volume conditions). Conversely, looking to
include specific incident scenarios in the 30 selected scenarios would likely bias the annual totals
computed by the model but would more likely provide a better estimate of the savings to be
gained from specific ATDM activities. For this test, we decided that it was better to select more
incident conditions, even if that biased the annual delay computations.
OPERATING AND TESTING THE MODELS
Once the scenarios for each test case had been developed, the model was run, and the
outputs from the model were compared to measured roadway performance data for the study
sections. This section describes those comparisons and discusses explanations for disparities
between the modeled and actual performance.
The comparison tests involved computing summary statistics from data collected by the
Olympic and Northwest region traffic management centers for all non-holiday weekdays in
2012. For the JBLM test section, summary statistics were computed for the 4-hour PM peak
period (3:00 PM to 7:00 PM). For the Seattle test section, summary statistics were computed for
the 4-hour AM peak period (6:00 AM to 10:00 AM.) The summary statistics computed and
compared included the following:
• the mean Travel Time Index for the entire peak period • the vehicle-hours of delay for the peak period • the vehicle miles of travel for the peak period • the average vehicle hours of travel • the maximum travel time observed/reported.

30
The initial set of “actual” computed roadway performance statistics was based on the average
condition (average volume and average speed by time of day) for all weekdays. The
TRACFLOW software produces estimates of average annual weekday volume and speed by
half-mile interval. These estimates can be used to compute the vehicle miles of travel, vehicle
hours of travel, and vehicle hours of delay for the corridor. They represent the average annual
condition and should fall within the bounds of “good” and “bad” days represented by the test
scenarios.
Travel time runs were then performed with the TRACFLOW software for all weekdays
of the year. The variation in travel time across days (as well as across time periods) was then
summarized and compared with the scenario results. This check was designed to allow
comparison of conditions revealed by the 30 scenarios examined as part of each model run with
the actual range of conditions observed in the field.
Additional delay comparisons were then made for specific days when the maximum
travel time was similar to one of the maximum travel times reported by the model for a specific
scenario. This set of simple comparisons was performed to compare estimated VMT, VHT, and
delay for specific days that had defined travel times with estimates of those measures by the
model to determine whether the model results were similar to measured results when travel time
conditions were similar.
The simple conclusion is that the model tended to under-estimate congestion on the tested
roadway sections. As a consequence of the lower estimates of congestion, the model described
roadway performance (average travel times, travel time reliability, and vehicle-hours of delay) as
better and more reliable than measured in the field. In some cases, differences in the model
output and the measured roadway performance can be blamed on the inability of the generalized

31
model inputs to accurately replicate the conditions on the roadway. (For example, the crashes
occurred in different places than expected in the model.) In other cases, the model did not
replicate external factors (e.g., downstream bottlenecks) that can add significantly to congestion.
However, it also appears possible that the two studied freeways do not operate as efficiently as
the Highway Capacity Manual theory predicts. That is, congestion forms before volumes reach
“capacity” for reasons not captured in the Highway Capacity Manual formulas.
The following subsections describe the results of the comparisons between the modeled
and actual conditions.
JBLM Test Case
Table 3 and Table 4 show the results for the 30 “final” scenarios for the JBLM test case.
Both tables are composites of the four actual “30 scenario” model runs needed to replicate the
highly variable JBLM ramp conditions. By running four different sets of 30 scenarios we were
able to expand the number of modeled conditions to account for the independent variation in
ramp volumes. To simulate this variation, three different linear adjustments were applied to the
initial “seed” ramp volumes. The seed volumes were set equal to the lowest of the four ramp
volume conditions. Each of the four sets of 30 scenarios then used one, and only one, of these
four ramp volume conditions. Low and high volume mainline volumes were present in all four
sets of 30 scenarios. Summary statistics for individual scenarios with the desired combination of
mainline and ramp volumes were then extracted from these four sets of 30 model runs to create
the desired final summary table.
The sizes of the three linear adjustments used to compute the different ramp volume
inputs were based on the differences between measured mainline traffic volume entering the test
section and the mainline volume exiting the test section after I-5 had passed through JBLM.

32
These measured volume changes ranged from a modest loss in volume (-400 vehicles) on I-5 to
an increase of over 7,000 vehicles from JBLM during the course of a PM peak period.
Table 3 includes the low mainline entry volume scenarios. Table 4 includes the high
mainline entry volume scenarios. The rows in each table indicate which of the variable ramp
volume scenarios was used, along with the basic weather and incident conditions modeled.
Tables 3 and 4 show that the sizeable changes in ramp volume levels resulted in
estimated changes in roadway performance, emulating what actually happens in the corridor.
However, for the highest ramp volume scenario, the vehicle-hours of delay estimates were
exceptionally high, even while the travel time indices increased only marginally and the
minimum speeds dropped only modestly for most of the individual scenarios.
Analysis of the reasons for these results determined that the adjustment factor used to
estimate the large ramp traffic volumes created ramp volumes at one ramp that significantly
exceeded the capacity of that ramp. As a result, for this set of scenarios, very large ramp delays
were estimated even when the freeway itself was flowing smoothly. The high ramp volumes
(those cars that could get onto the freeway) did create some congestion on the mainline, but a
much larger percentage of the delay increase appeared to come from the ramp delay. Because
the model is capable of tracking ramp delays, and the WSDOT sensor system does not measure
either ramp volumes or delays, this would increase the delay reported by the model relative to
the mainline delays computed with WSDOT sensor data. To check this finding, two additional
model runs were made. Those model runs used smaller ramp adjustment values for the highest
volume ramp condition. The “original” high volume multiplier was a factor of 9. The revised
values were 7 and 5.

33
Table 3: JBLM Low Entry Volume Scenario Results
Vehicle Miles
Traveled (VMT)
Vehicle Delay (Hrs)
Vehicle Hours
Traveled (VHT)
Maximum Travel Time (Min)
Mean TTI
Mean Speed (mph)
Alternative Ramp
Multiplier Ramp
Volume Weather Incidents 143322 154 2359 15.3 1.1 61 Low Clear No 143322 307 2512 16.7 1.1 57 Low Rain No 143322 210 2415 15.6 1.1 59 Low Lt Rain Shoulder 1 143322 210 2415 15.6 1.1 59 Low Lt Rain Shoulder 2 168714 229 2824 16.9 1.1 60 Med Clear No 168714 295 2891 17.1 1.1 58 Med Lt. Rain No 168714 576 3172 19.2 1.2 53 Med Lt. Snow No 168714 295 2891 17.1 1.1 58 Med Lt. Rain Lane Cl. 1 168714 294 2890 17.1 1.1 58 Med Lt Rain Shoulder 4 193204 18074 3407 16.6 1.1 57 9 Med-High Clear No 195988 3334 3365 17.3 1.1 58 7 181506 307 3072 17.7 1.1 59 5 193109 18232 3475 16.1 1.2 56 9 Med-High Lt. Rain No 195988 3415 3445 17.2 1.1 57 7 181506 383 3147 17.9 1.1 58 5 192147 19652 3727 17.9 1.3 52 9 Med-High Lt. Snow No 195988 3779 3764 19.3 1.3 52 7 181506 680 3445 20.0 1.2 53 5 193109 18232 3475 16.1 1.2 56 9 Med-High Lt. Rain Lane Cl. 1 195988 3415 3445 17.2 1.1 57 7 181506 383 3147 17.9 1.1 58 5 193109 18232 3475 16.1 1.2 56 9 Med-High Lt. Rain Shoulder 1 195988 3415 3445 17.2 1.1 57 7 181506 383 3147 17.9 1.1 58 5 192889 19250 3830 29.5 1.3 50 9 Med-High Lt. Rain Shoulder 3 195988 3943 3849 30.7 1.3 51 7 181506 714 3465 29.5 1.3 52 5 192147 19652 3727 17.9 1.3 52 9 Med-High Lt. Snow Shoulder 1 195988 3779 3764 19.3 1.3 52 7 181506 680 3445 20.0 1.2 53 5
Actual Measured Average Annual Corridor Performance 195,234 946 4,193 20.2 1.6 38

34
Table 4: JBLM High Entry Volume Scenario Results
Vehicle Miles
Traveled (VMT)
Vehicle Delay (Hrs)
Vehicle Hours
Traveled (VHT)
Maximum Travel
Time (Min) Mean TTI
Mean Speed (mph)
Alternative Ramp
Multiplier Ramp
Volume Weather Incidents 171987 571 3217 39.8 1.3 53 Low Clear Lane Cl. 2 171986 222 2868 17.6 1.1 60 Low Clear Shoulder 1 171986 300 2946 18.0 1.1 58 Low Lt. Rain Shoulder 4 171986 526 3172 24.9 1.2 54 Low Lt. Rain Shoulder 3 171986 222 2868 17.6 1.1 60 Low Clear Shoulder 2 190314 293 3221 18.8 1.1 59 Med Low Clear No 190314 511 3439 20.2 1.2 55 Med Low Rain No 202457 360 3474 19.5 1.1 58 Med Clear No 202457 445 3559 19.7 1.2 57 Med Lt. Rain No 211930 33101 3850 17.9 1.2 55 9 Med Hi Clear No 220829 9714 3944 19.4 1.2 56 7 217822 1221 3797 19.8 1.1 57 5 211594 33574 3895 17.1 1.2 54 9 Med Hi Lt. Rain No 220829 9895 4005 19.0 1.2 55 7 217822 1316 3890 19.8 1.2 56 5 211466 35458 4671 45.7 1.5 45 9 Med Hi Lt. Rain Lane Cl. 3 220824 11820 4945 47.2 1.5 45 7 217824 2575 4908 48.8 1.6 44 5 211930 33101 3850 17.9 1.2 55 9 Med Hi Clear Shoulder 1 220829 9714 3944 19.4 1.2 56 7 217822 1221 3797 19.8 1.1 57 5 211594 33574 3895 17.1 1.2 54 9 Med Hi Lt. Rain Shoulder 2 220829 9895 4005 19.0 1.2 55 7 217822 1316 3890 19.8 1.2 56 5
Actual Measured Average Annual Corridor Performance 195,234 946 4,193 20.2 1.6 38

35
In examining the details of the high volume ramp days, it became apparent that as JBLM
activity levels increase, traffic within the base redistributes itself to different freeway ramps, so
that the relationships between freeway on-ramp volumes change as total ramp volumes
associated with JBLM increase. (That is, as JBLM activity increases, a smaller percentage of
drivers use the Main Base entrance/exit.) When the two lower ramp volume adjustment
sensitivity tests were run, no attempt was made to “rebalance” the ramp volumes under these
revised inputs. Therefore, in all of the high volume cases, some ramps carried a disproportionate
fraction of base traffic.
The results from these two sensitivity tests are shown in tables 3 and 4 in italics in the
two lines directly below the scenario results from the original model run.
At the very bottom of the table is the average annual condition measured in the corridor.
It is possible, by using these two tables, to make the following conclusions based on comparisons
of the model outputs and measured roadway conditions.
The vehicle miles of travel statistic computed by the model was reasonably close to the
average annual condition. The lower volume scenarios tended to produce VMT estimates lower
than the average annual condition, while the higher volume scenarios produced estimates that
were higher than the average annual condition. This suggests that the ramp volumes that were
created from mainline detector stations computed a reasonably good estimate.
With the exception of the scenarios with the highest ramp volumes, the model under-
estimated the amount of delay present in the corridor. The measured value was over 940
vehicle-hours of delay. The majority of the scenario estimates for this statistic were under 500
vehicle-hours. On the other hand, the initial high-volume ramp scenarios estimated between
18,000 and 35,000 vehicle-hours of delay. Reducing the ramp adjustment from 9.0 to 7,0 cut

36
these delay estimates by a factor of between 3 and 5. The use of the 5.0 adjustment factor
reduced delay from its original value by a factor of from 13 to 58. Many of the decreased ramp
volume scenarios showed relatively modest changes in the mean TTI for the scenario, the mean
speed for the facility, or the maximum travel time computed. This means that the majority of the
delay occurred on the ramps, not on the mainline of the roadway.
The maximum travel time computed by the model also tended to be less than the
observed maximum travel time for the average annual condition.2 Only one of the low entry
volume scenarios had a maximum travel time that exceeded the actual average annual condition.
Three of the higher mainline entry volume scenarios had higher maximum travel times.
Interestingly, the sensitivity test of decreasing the initial ramp volumes for the scenario with the
highest ramp volumes caused many of those scenarios to have slower trips. For example, in
Table 4, the last scenario (high entry volume, medium-high ramp volumes, in light rain, and with
a 5- to 15-minute shoulder incident) shows an increase in maximum estimated travel time from
17.1 minutes to 19.0 for the 7.0 adjustment factor, and 19.8 for the 5.0 adjustment factor. These
results are assumed to illustrate the fact that the ramps perform better under lower volumes, and
therefore cause a greater mainline merge disruption, slowing the mainline.
The mean TTI and mean speed statistics confirmed that the model under-estimated
travel times in the JBLM test section. The observed mean TTI was around 1.6, while almost all
scenarios reported a mean TTI of between 1.1 and 1.3. Similarly, the measured mean speed was
38 mph, which was lower than all modeled mean speeds.
It is unclear at this time why the model under-estimated total mainline delay. It is
possible that the WSDOT sensors are routinely under-estimating traffic volume on the facility.
2 The average annual condition was based on the average of all PM peak period travel times computed from the mainline loop data.

37
The entry volumes were lower than what the authors expected, but they were not appreciably low
given the volumes found throughout the test section.
In terms of WSDOT using this model to estimate the benefits of deploying ATM in the
Joint Base area, the conclusion is that additional calibration of the model and its parameters is
needed before the model can be used for that purpose.
Seattle Test Case
The Seattle case study was more straightforward than the JBLM model. Unlike the
JBLM test section, the variability of the ramp volumes was not substantially different from that
of the mainline volumes. As a result, only one 30-scenario model run was required. Unlike the
JBLM corridor, the project team did not attempt to create 30 scenarios that represented the
majority of actual operating conditions in the corridor. Instead, the 30 scenarios were primarily
the “most common” of the different operating conditions, plus a limited number of higher delay
conditions.
The results of those 30 scenario runs are shown in Table 5. Also shown at the bottom of
Table 5 are the average annual conditions for the AM peak period, as measured by the WSDOT
traffic surveillance system, and the average condition computed by the model using the 30
scenarios. The average annual condition could be computed by the model because it does that
automatically for a single 30-scenario run. For JBLM, that was not possible because of the need
to perform several different model runs to account for the differences in ramp volume.

38
Table 5: Seattle Scenario Results
Scenario Number
Vehicle Miles
Traveled (VMT)
Vehicle Delay (Hrs)
Vehicle Hours
Traveled (VHT)
Maximum Travel Time (Min)
Mean TTI
Mean Speed (mph)
Minimum Speed Volume Weather Incidents
1 211,361 1,252 4,503 21.2 1.4 46.9 30.5 Low-Med Clear No 2 213,918 1,383 4,673 21.3 1.4 45.8 30.1 Med Clear No 3 215,671 1,596 4,913 21.3 1.5 43.9 28.6 Med-Hi Clear No 4 211,361 1,252 4,503 21.2 1.4 46.9 30.5 Low-Med Clear PDO-shl 5 213,918 1,383 4,673 21.3 1.4 45.8 30.1 Med Clear PDO-shl 6 215,671 1,596 4,913 21.3 1.5 43.9 28.6 Med-Hi Clear PDO-shl 7 209,803 1,372 4,599 21.3 1.4 45.6 30.5 Low-Med Cool No 8 212,522 1,519 4,789 21.4 1.5 44.4 30.1 Med Cool No 9 214,559 1,664 4,964 21.4 1.5 43.2 29.0 Med-Hi Cool No
10 209,803 1,372 4,599 21.3 1.4 45.6 30.5 Low-Med Cool PDO-shl 11 217,251 1,794 5,135 21.4 1.5 42.3 27.5 High Clear PDO-shl 12 219,303 2,177 5,550 21.5 1.6 39.5 27.3 V.High Clear PDO-shl 13 208,763 2,437 5,648 32.8 1.8 37.0 18.6 Low-Med Clear Injury-1 14 210,127 2,482 5,714 33.4 1.8 36.8 18.0 Med Clear Injury-1 15 213,330 2,515 5,796 34.4 1.8 36.8 17.3 Med-Hi Clear Injury-1 16 207,135 2,458 5,644 32.7 1.8 36.7 18.7 Low-Med Cool Injury-1 17 210,516 2,488 5,726 33.3 1.8 36.8 18.3 Med Cool Injury-1 18 211,864 2,531 5,790 33.9 1.8 36.6 17.7 Med-Hi Cool Injury-1 19 211,361 1,252 4,503 21.2 1.4 46.9 30.5 Low-Med Clear PDO-1 20 213,918 1,383 4,673 21.3 1.4 45.8 30.1 Med Clear PDO-1 21 215,671 1,596 4,913 21.3 1.5 43.9 28.6 Med-Hi Clear PDO-1 22 209,803 1,372 4,599 21.3 1.4 45.6 30.5 Low-Med Cool PDO-1 23 212,522 1,519 4,789 21.4 1.5 44.4 30.1 Med Cool PDO-1 24 214,559 1,664 4,964 21.4 1.5 43.2 29.0 Med-Hi Cool PDO-1 25 209,461 1,982 5,204 26.9 1.6 40.2 21.7 Low-Med Clear Inj-shldr 26 210,740 2,043 5,285 27.8 1.6 39.9 21.1 Med Clear Inj-shldr 27 191,902 4,301 7,026 118.9 3.3 27.3 5.4 Med-Hi Clear Fatal-1 28 209,803 1,372 4,599 21.3 1.4 45.6 30.5 Low-Med Lo.Wind PDO-shl 29 212,522 1,519 4,789 21.4 1.5 44.4 30.1 Med Lo.Wind PDO-shl 30 214,559 1,664 4,964 21.4 1.5 43.2 29.0 Med-Hi Lo.Wind PDO-shl
Actual Measured Average Annual Corridor Performance 234,736 1,894 5,352 23.0 2.3 25.9
Average Modeled Corridor Performance 211,790 1,831 5,081 27.4 1.6 42.2 25.9

39
In summary, the FREEVAL ATDM model did a better job of estimating this corridor’s
performance than it did the JBLM corridor. The model still tended to under-estimate many of
the travel time measures for the corridor, but it did a reasonable job of estimating total delay.
While the project team has not been able to dissect the model to explain this discrepancy, we
assume that the model actually under-estimated delay on the corridor because it did not include
the added delay due to queuing extending from downtown Seattle. At the same time, however,
the model also included estimates of ramp delays, which were not included in the measured
roadway performance delay computations. This may have compensated for the under-estimation
of mainline delay.
A review of the data describing actual roadway performance shows that the downtown
Seattle bottleneck does frequently extend to the northern end of this section of road, which would
increase the delays and travel times measured for this roadway section, whereas the model did
not include this delay. Figure 5 illustrates the actual frequency3 with which congestion forms on
the corridor.
Figure 5: Frequency of Congestion in the Seattle Test Corridor
3 The colors in Figure 5 represent the percentage of times LOS F congestion forms at a given time and location.

40
It can be seen in Figure 5 that the most common congestion pattern is for congestion to
form at the northern end of the test section and then extend upstream. Some of this congestion is
the result of the extension of queuing from downstream of the modeled section. Other
congestion in this section results from simply too much volume for the corridor. The details of
the comparison between measured and modeled roadway performance are presented below.
The vehicle miles of travel statistic computed by the model averaged roughly 10 percent
below the measured average annual condition. In part this occurred because the model computed
sufficient congestion in the corridor to limit throughput below demand. The measured demand
was not similarly restricted. Thus, in the model, only 87 percent of travel demand was served on
the corridor during the model runs. If the corridor had been able to serve that demand, the
estimated VMT would have been very close to what was measured.
The model estimated the amount of delay present in the corridor reasonably well. The
average annual delay condition estimated by the model was very close to that computed by
averaging the delay measured in the AM for each weekday. The various scenarios fell on both
sides of the average annual AM peak period delay measured for the corridor, depending on
whether that scenario had high or low levels of congestion. While the model may have under-
estimated mainline delay, it may have also compensated for that delay by adding ramp delay not
included in the field measurements.
The maximum travel times computed by the model for two thirds of the scenarios were
lower than the average of the observed maximum travel time for all AM peak periods in 2012.4
However, nine of the 30 scenarios produced maximum travel times that exceeded this average
condition. Seven of those scenarios created maximum travel times that exceeded the 85th
4 The average annual condition was based on the average of all AM peak period travel times computed from the mainline loop data.

41
percentile maximum travel time measured in 2012, which was just under 28 minutes. Of concern
is the fact that too many of the scenarios (21 of the 30) had a maximum travel time of between
21.2 and 21.5 minutes. This was true despite major changes in the characteristics of the
incidents being modeled. This suggests that the model is not as sensitive to incidents as desired.
The Seattle model and measured results for the mean TTI and mean speed statistics did
not match well. Only one scenario’s mean TTI exceeded the average annual condition as
measured in the field. The mean speed reported by the model was always higher than the
measured mean speed.
In terms of WSDOT using this model to estimate the benefits of deploying ATM, the
conclusion from this corridor, like that from the JBLM corridor, is that additional calibration of
the model and its parameters is needed before the model can be used for that purpose.
GUIDELINES, LESSONS LEARNED, AND FUTURE ENHANCEMENTS
During the process of developing FREEVAL-ATDM models, the project researchers
developed their own list of guidelines and lessons learned that could be useful for prospective
users of the FREEVAL-ATDM tool set in Washington state. In this section we summarize those
guidelines and lessons learned from the perspective of an analyst who is developing a
FREEVAL-ATDM model for a freeway facility in Washington state for the first time. The
discussion will also suggest potential enhancements to the FREEVAL-ATDM modeling
environment that could provide additional benefits to the user.
Guidelines and Lessons Learned for FREEVAL-ATDM Model Development
The following guidelines include reminders of the importance of key considerations
noted in the FREEVAL-ATDM documentation that might otherwise be easy to overlook, as well
42
as additional factors to consider based on the project researchers’ model development
experiences.
Overall Modeling Considerations
Some overall modeling considerations include the following:
• Follow the prescribed steps. The FREEVAL-ATDM tool set consists of two separate
yet interacting Excel macro files. Each file has a very helpful, step-by-step list on the
first worksheet (the “master” worksheet for atdmprocess.xlsm, and the “ATDM inputs”
worksheet for FREEVAL-ATDM.xlsm, respectively). Our experience as that it is
important to carefully follow those steps in order to avoid confusion and potentially
ambiguous results.
• Use a checklist to document steps in the process. The model development process
involves a series of steps that encompass both facility modeling and scenario modeling,
spanning two separate programs, with data transfers occurring between them. Despite the
careful list of steps (in the first worksheet of each program file, as noted above), the
process nevertheless involves a complex sequence of tasks that can be confusing; this
complexity and confusion are even more likely to be apparent during the inevitable
iterative model development. Therefore, it is important to keep track of the steps being
performed during model development to ensure that every step is performed fully and in
the right sequence. One way to keep track is to maintain a separate checklist of model
development steps and update the status of that list during the process.
• Keep track of separate model iterations and before/after versions. During the
development process, it can be easy for files for model design, input data, and model
outputs to become confused with one another, particularly during an iterative design and

43
testing process. File confusion can also occur during iterative sensitivity analyses and
between before and after tests. To avoid confusion and to clearly document results, keep
track of files associated with different model iterations and especially different baseline
input assumptions, by appropriately naming files and separating related files into their
own directories. (This is especially important because each model run concludes with the
option to saving the model output by overwriting previous results.)
Specific Modeling Considerations
Some specific modeling considerations include the following:
• Consider adding relevant scenarios involving ramp volumes. In one of the models
developed by the project researchers, a major activity area that was a large traffic
generator and attractor (JBLM) was located adjacent to the modeled freeway facility.
Therefore, we considered it important to analyze freeway performance as a function of
demand reflecting different combinations of a) the level of traffic activity to and from the
activity area (using on- and off-ramp volumes as a reflection of that activity level) and b)
the variations in upstream demand on the mainline. However, the scenario generation
process explicitly defines varying demand levels only for the latter factor (upstream
mainline volumes). To enable us to use a second independent set of adjustable demand
levels for the model ramps, while still using the existing FREEVAL-ATDM process, the
following modified approach was developed:
1. Define ramp volume levels. Define a simplified “Ramp Demand Sub-scenario”
that consists of a series of levels of ramp volumes, analogous to the Demand Sub-
scenario levels.
2. Define sub-scenarios based on varying ramp volumes. When defining the sub-
scenarios, factor in the variations in ramp volume by using the ramp volume

44
levels as a sub-scenario variable. For example, for a given level of demand
volume for the mainline, define separate sub-scenarios for each combination of
mainline demand level and ramp demand level.
3. Define individual model files. After the FREEVAL model has been finalized,
duplicate the FREEVAL-ATDM model files, one per ramp demand level. For
each duplicate file, enter the ramp volumes associated with that file’s ramp
demand level, for each time period worksheet (“t=”). (To simplify this step, a
constant factor was used to scale the baseline seed ramp volumes up or down on
the basis of the estimated range of volumes that occurred during varying levels of
activity at JBLM, and Excel formulas were used to streamline data entry.)
4. Run all scenarios for all ramp volume levels. For each of the duplicate model
files, run all 30 scenarios. Do this even though in some cases a scenario does
not use the ramp volume level represented by a particular model file. The
result will be model results for every combination of demand volume and ramp
volume, including those that do not match the desired definition of any
scenario.
5. Filter out the irrelevant scenarios. For each scenario, there will only be one
combination of mainline demand and ramp demand that matches the scenario’s
actual definition; the rest of the combinations will not be correct. Therefore, filter
out model outputs from the non-matching versions of the scenario, and prepare a
revised list of the true model outputs for each scenario. The outputs that are saved
for each of the “real” scenarios are taken from the right-side table of the ATDM
output worksheet for each particular scenario. (To simplify this filtering process,

45
we used an Excel spreadsheet with formulas that used the various model output
files as lookup tables, extracting the correct output from the correct model output
file on the basis of the ramp volume of each sub-scenario. For example, if
scenario 10 consisted of Very high demand + No incidents + Clear weather + No
work zones + Low ramp volumes, the output saved for scenario 10 would be
taken from the output file that used “Low ramp volumes” as a baseline seed for
ramp volumes.)
Review the results from the 30 correct scenario definitions. Once a list of the
30 true scenario outputs has been produced, evaluate the results. As an example,
the 30 individual scenario results can be grouped by similar characteristics and the
results averaged within each group. Or, for each combination of mainline demand
level and ramp demand level, the matching scenario results can be averaged, and
the results can be reviewed for any apparent trends (e.g., as demand volumes go
up, how do the output metrics respond).
Please note: As mentioned above, the only model outputs that are relevant with
this process are those on the right-side table of the ATDM output worksheet
(individual scenario results). Furthermore, those individual results generally
cannot be used to produce aggregate metrics across all 30 scenarios, such as those
listed on the left side of the ATDM output worksheet (e.g., delay, recurring/non-
recurring percentage). Also, this method is suggested only as a simple option for
evaluating the effects of varying ramp volumes; it does not include speed or
capacity adjustment factors, nor does it involve adjusting other ramp variables.
• Summarize demand volumes in a convenient fashion. For the two models developed

46
in this project, demand volumes were summarized in table form, for each combination of
time period (1 through 16) and segment (1 through 20). This enabled us to quickly
review all the demand volumes in one convenient format (associated data files, produced
by the TRACFLOW datamart were also archived for future reference).
• Exercise care when balancing desired segment definitions with the 20-segment
modeling requirement. At present, the prototype FREEVAL-ATDM tool set requires
that a facility be modeled with exactly 20 segments. This can introduce some constraints
in the modeling process, particularly for more complex urban facilities with many ramps
and geometric changes. In the case of non-urban locations or shorter facilities, where 20
segments might be considered more than sufficient, it is nevertheless important to avoid
“padding” the model with meaningless segments (e.g., segments outside the study area)
simply to reach the 20-segment requirement, since overall performance statistics in the
model output take into account the results of all 20 segments, even if those segments are
not actually part of the desired study area.
• Reminder: Keep in mind the requirements for segment definitions. As noted in the
FREEVAL user’s guide, models should be designed to have B (basic) segments for
segments 1 and 20 in order to function properly. The FREEVAL user’s guide provides
other helpful suggestions about model definitions.
Overall Observations
The use of a variety of data archives during model development led to the following
overall observation:
• WSDOT’s data-rich focus can yield a range of benefits. For the purposes of
developing FREEVAL ATDM models, WSDOT would be considered a comparatively

47
"data-rich" agency, with access to a variety of detailed data archives. This has several
advantages. First, WSDOT has the ability to specify more detailed FREEVAL-ATDM
model inputs than most users would and to reduce the use of default values that are not
location-specific. Second, detailed data provides more options for comparing model
outputs to other independently developed estimates of freeway performance. (For
example, the TRACFLOW-based travel times derived from FLOW sensor data archives
are useful as comparison data that can specifically match the locations and time periods
of the model.) Third, the availability of such data also means that WSDOT has the
general ability to analyze traffic performance at a sophisticated level and develop a
deeper understanding of the nature of the baseline (before) condition, independent of
modeling tools such as FREEVAL ATDM. Fourth, just the act of analyzing the data that
are needed to compute the FREEVAL ATDM inputs provides considerable insight into
the number of time periods during which different ATDM actions are likely to provide
benefits. For example, by combining hourly volume, with weather, incident, and
workzone data, it is possible to estimate the number of hours during which capacity is
exceeded by specific levels and thus when ATDM actions designed to increase effective
capacity would provide benefit.
To summarize, while existing data archives (TRACFLOW, incidents, weather) are very
useful for developing inputs to a modeling process such as FREEVAL, there are also
opportunities to independently exploit rich data sets such as the WSDOT FLOW freeway
sensor data and the TRACFLOW datamart and to extract maximum benefits from the
existing data collection network as well as future expansion of sensors in areas such as the
Olympic Region. With such data, WSDOT can also expand the use of travel time and other

48
(e.g., index-based) metrics throughout both the Northwest Region and Olympic Region, as
well as other areas with emerging sensor networks.
Potential Enhancements to the FREEVAL-ATDM Tool Set
Because the FREEVAL ATDM process is still under development, the project
researchers made note of possible future adjustments or enhancements to the FREEVAL ATDM
process. The following are potential features that could further enhance the utility of the
FREEVAL-ATDM tool set, given our experiences (please note that some of these suggestions
may already be under development, given that FREEVAL-ATDM work is still in progress):
• Enhance the software’s robustness. The researchers spent a very large amount of time
debugging input files to try to make the prototype software function as desired.
Improvements in the model’s robustness in working with a broad range of user inputs
will greatly decrease the cost of the modelling effort.
• Provide a mechanism for a ramp demand volume subscenario. The researchers’
experience developing the JBLM model pointed out the desirability of a method for
exploring the effects of varying ramp demand volumes produced by a major adjacent
activity area. The method developed in this project (as described above) could be
substantially improved to offer more user options and greater ease of use.
• Provide indicators of checklist completion within the tool set. One of the guidelines
suggested above was the use of a checklist to keep track of progress during model
development and operation. This feature could be implemented further by introducing
some type of indicator within the master and ATDM input worksheets to confirm which
steps have been completed. An accompanying reset button could allow the confirmation
indicators to be reinitialized when a new modeling process is begun. This would help the

49
user track modeling progress in a systematic and convenient way.
• Reintroduce FREEVAL features. Reintroducing some of the automated set-up features
of FREEVAL into the FREEVAL-ATDM software variant would increase convenience
for users. Also, it would be convenient if values that are fixed in every time period could
be duplicated in each “t=” worksheet automatically.
• Add “lookup table” functionality to the demand volume input process. Previously,
we suggested that users keep track of demand volumes in a tabular form for ease of
review. It would also be more convenient if FREEVAL-ATDM could optionally use the
tables as lookup tables, where demand volume values within the model (on the “t=”
worksheets) could be updated automatically whenever the table values were changed by
the user. This would also greatly facilitate initial input of ramp volumes.
CONCLUSIONS
The ATDM model based on FREEVAL (which is also used as the basis for the SHPR2
L08 freeway analysis tool) has potential as an analysis tool, but it also has significant limitations.
The primary benefit it provides to WSDOT is that it allows analysis of ATDM activities
on the basis of data that can be readily obtained or estimated. It allows direct computation of the
variation in roadway performance that occurs as a result of variations in traffic volume and
common roadway disruptions (incidents, weather, and work zones), and those computations can
be performed with considerably less effort than with other current alternative approaches. The
model is a good step in the right direction for understanding how roadway performance varies
over time and how that performance is likely to change, given different operating scenarios.
Because of its application of the equations found in the Highway Capacity Manual, the model is

50
capable of estimating the benefits of improved roadway operations from the application of
various operational activities.
The model does provide a mechanism for estimating the approximate size of “first order”
benefits from various ATDM activities. The model also has the obvious advantage of providing
estimates of reliability and changes in reliability even when relatively limited data are available.
This is particularly important to WSDOT for those freeways that are not yet fully instrumented,
or where incident management is not in place. The major downside of those computations is that
they depend on estimates of operational benefits that are not well known (changes in operational
capacity and/or vehicle speed) from each specific ATDM activity. The software provides “best
practice” values for many of these adjustments, but in many cases, the values for ATDM
improvements are not based on rigorous scientific study.
The model fits somewhere between very simple, limited ballpark estimates and complex
models or simulations with heavy, onerous time requirements and data needs. Its niche appears
to be for initial exploratory work (sensitivity analyses, etc.).
Unfortunately, there are several limitations with using the current FREEVAL model.
These disadvantages are as follows:
1) There is a substantial learning curve for getting the model up and operating. While
extensive instructions are supplied with the model, the complexities of the model, its data entry,
and its operation require considerable learning before users become proficient in its operation.
2) The model software is currently very “temperamental.” The research team spent many
hours attempting to debug macro software error messages. The considerable time spent working
through the potential causes of these errors significantly detracted from our ability to more fully
explore variations in output from the model based on changing the inputs and/or the model

51
assumptions. It is not yet clear to what extent the issues encountered were associated with
subtleties in the modeling process (e.g., sensitivity to the particular model input values specified
by the user) versus limitations in the macro’s own internal processing. Until this question is
resolved, the same difficulty will decrease the utility of the model to WSDOT for ATDM
evaluation. However, it is important to note that the FREEVAL-ATDM modeling tool set used
in this research project was a prototype version of a work in progress; therefore, its full utility to
WSDOT should be reassessed after software development has been completed.
3) Despite the ability to enter considerable data that describe current roadway conditions,
the model still has trouble modeling the conditions routinely found on the roadway. For
example, it was not possible to directly model the variations in ramp volumes occurring in the
JBLM section. While the variability of the volumes on JBLM’s ramps may be extreme, other
freeways undoubtedly have ramps whose traffic patterns are different than those of the mainline.
While a partial work-around was developed for this research project, that work-around did not
allow the model to automatically compute all of the summary statistics.
Similarly, in order to effectively use WSDOT’s extensive incident data, we had to “trick”
the model into accepting alternative categories of incidents than those that are hard coded into
the model. While the model did run, it was difficult to review the results because of the need to
“translate” what the model called the various scenarios into what we assigned those scenarios to
represent in terms of incident conditions.
4) The model is currently restricted to 4 hours of data. For these tests, the 4 hours
selected were the peak weekday commute hours. While this captures the majority of recurring
delay and major portions of non-recurring delay, it may not capture a significant amount of the
benefits from an automated ATDM system, which can respond to changes in roadway

52
performance even in the middle of the day or on weekends. In both of the test cases, WSDOT
sensor data showed that considerable delay occurred outside of the primary peak commute
period on those roadways. In the JBLM section, weekend congestion is of major concern, as that
section of I-5 serves both southbound and westbound weekend recreational movements from the
major Puget Sound population centers. For the Seattle section, the PM peak period is also
routinely congested, as are many weekend hours. Additional model runs would be needed to
capture the benefits from those times of day.
For example, one question posed by WSDOT about the possible deployment of active
traffic management at JBLM was the difference in benefits that could be gained by using hard
shoulder running at fixed times of the day (e.g., the PM peak period), which might only require
fixed signing, versus using hard shoulder running only when conditions warranted it, which
might include only some peak periods but could also include weekdays and weekends. The 4-
hour analysis window limits the ability of the model to answer this type of question. A more
flexible time period definition would be helpful in such cases.
One interesting finding from doing this project was that in “data rich” cases such as this
one, much can be learned about the potential benefits of simply collecting, aggregating, and
summarizing the data about operating conditions. For example, it is possible to determine the
number of hours each year—by day of week and time of day—when a given roadway is
operating within a given fraction of lane capacity. Combining this with the likelihood of an
incident or bad weather occurring yields a direct measure of the fraction of time during which an
operational improvement will have direct benefit. While such an “existing data” analysis does
not allow computation of the actual benefits from those proposed improvements, simply looking

53
at available data provides an excellent “first blush” analysis of the amount of time during which
such improvements would be beneficial
Consequently, the project team concludes that the FREEVAL model does provide benefit
to WSDOT. Part of that benefit comes from simply doing the data collection and analysis
necessary to supply inputs to the model. However, before WSDOT starts to use this model
routinely, the model does need to become more robust and easier to use, and prospective users
need to develop greater familiarity with the complexities of the associated modeling process.

Americans with Disabilities Act (ADA) Information: This material can be made available in an alternate format by emailing the Office of Equal Opportunity at [email protected] or by calling toll free, 855-362-4ADA(4232). Persons who are deaf or hard of hearing may make a request by calling the Washington State Relay at 711.
Title VI Statement to Public: It is the Washington State Department of Transportation’s (WSDOT) policy to assure that no person shall, on the grounds of race, color, national origin or sex, as provided by Title VI of the Civil Rights Act of 1964, be excluded from participation in, be denied the benefits of, or be otherwise discriminated against under any of its federally funded programs and activities. Any person who believes his/her Title VI protection has been violated, may file a complaint with WSDOT’s Office of Equal Opportunity (OEO). For additional information regarding Title VI complaint procedures and/or information regarding our non-discrimination obligations, please contact OEO’s Title VI Coordinator at (360) 705-7082.


