
Guidelines for Monitoring Land Fragmentation
Geo-Processing in Preparation for Calculating Metrics
Daniel Rutledge, Georgina Hart and Robbie Price Landcare Research SLT Presentation
21 July 2014
The GIS processing Steps
• Take the input layers and create a single layer to use for the metrics
• Underlying Data for Analysis – Parcels – LRI – LCDB – Topo Data
– PAN-NZ (Protected Areas) • Specify the AOI (one region)
Technologies
• ArcGIS 10.2.1 – ESRI File Geodatabase format – Model builder
• runs Python in background with ArcPy • Not Locked in: Other options
– Might be done in other commercial GIS packages
– Spatial databases with SQL • http://postgis.net
– GDAL + python – “R” statistical programming language (maybe)?

A series of models to run
1) Specify the AOI
2) Import the Underlying Data
4) Create Landscape Mosaics
5) Union (Combine) Layers
Some tools to do repetitive tasks
3) Create Masks

1. Specify the AOI
• Define the Area Of Interest
• Used for subsequent Imports

2. ) Import the Underlying Data
• Parcels • LRI • LCDB • PAN-NZ
2. ) Import the Underlying Data
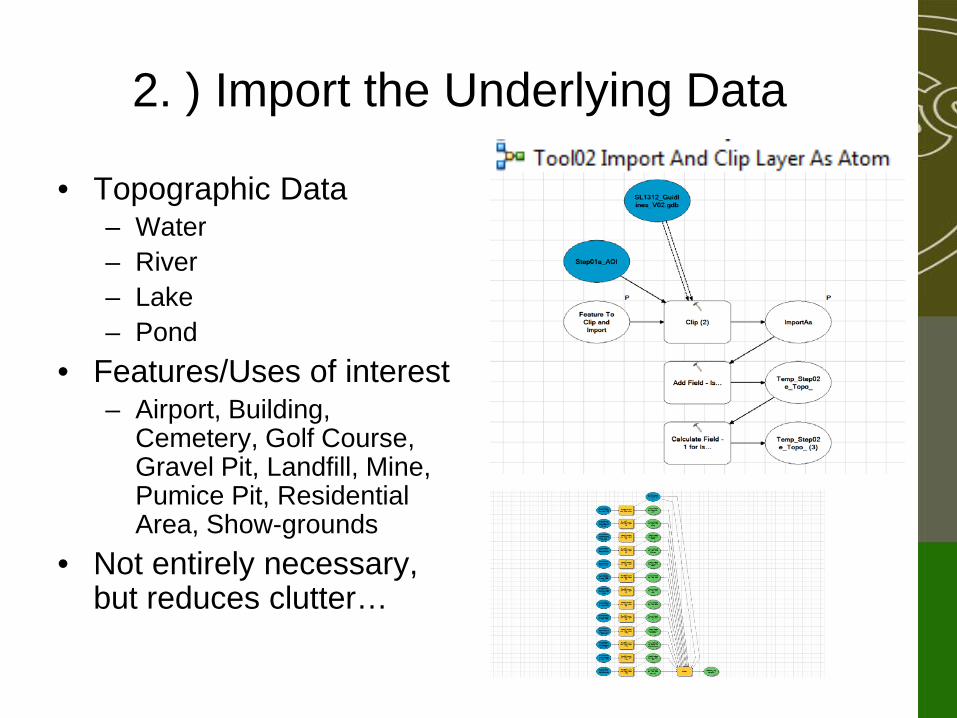
• Topographic Data – Water – River – Lake – Pond
• Features/Uses of interest – Airport, Building,
Cemetery, Golf Course, Gravel Pit, Landfill, Mine, Pumice Pit, Residential Area, Show-grounds
• Not entirely necessary, but reduces clutter…
3. Create Masks
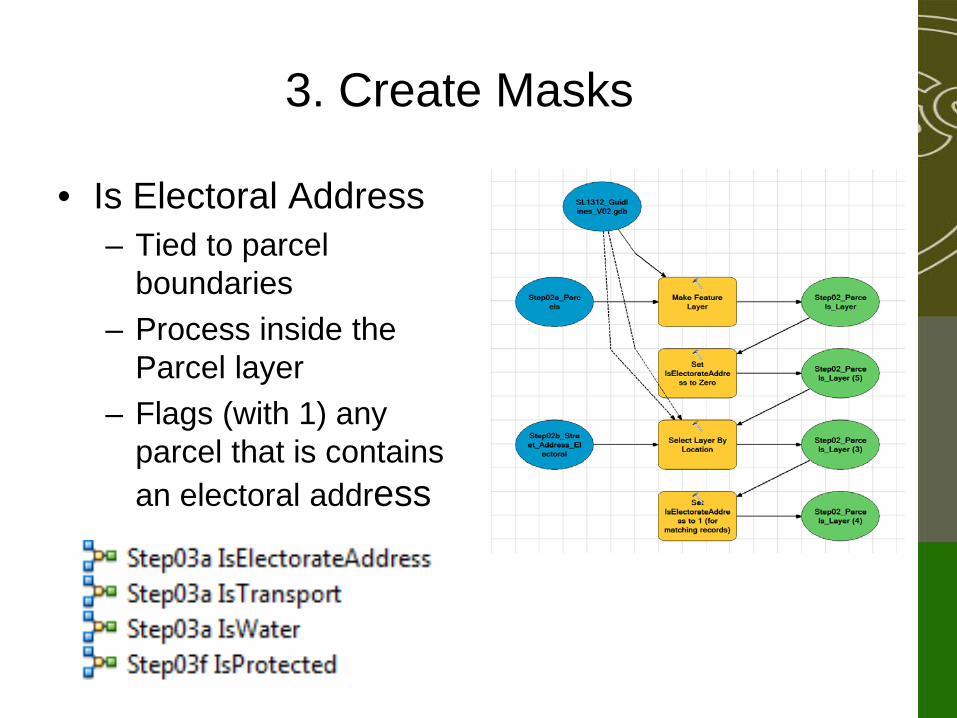
• Is Electoral Address – Tied to parcel
boundaries – Process inside the
Parcel layer – Flags (with 1) any
parcel that is contains an electoral address
3. Create Masks
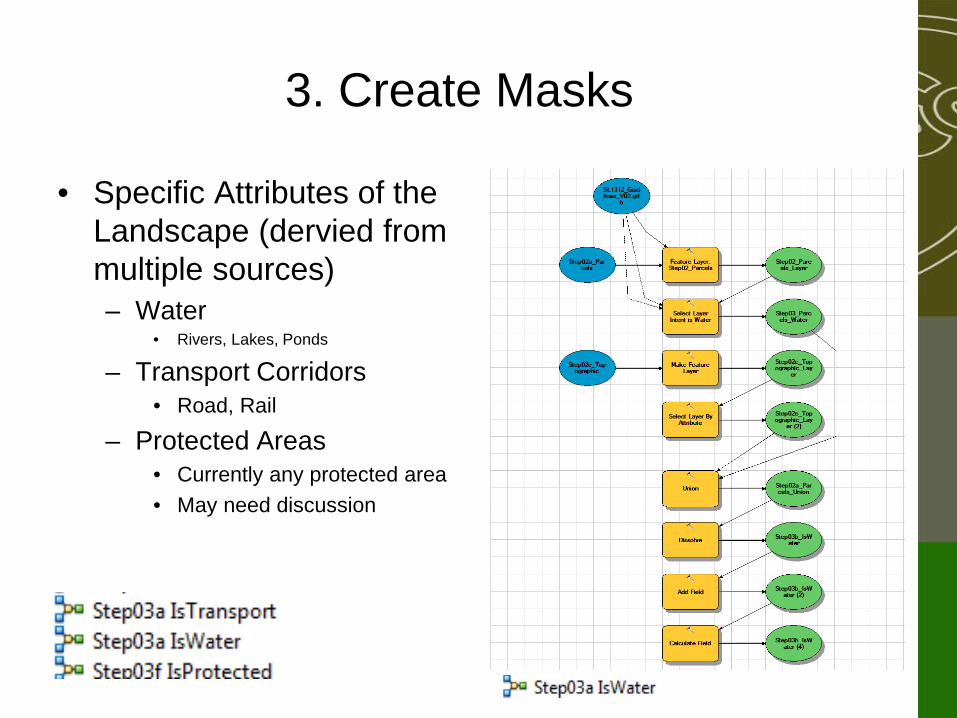
• Specific Attributes of the Landscape (dervied from multiple sources) – Water
• Rivers, Lakes, Ponds
– Transport Corridors • Road, Rail
– Protected Areas • Currently any protected area • May need discussion

3. Create Masks
Is Electorate Address • Based on parcel
boundaries • Flags each Parcel 1/0 • Used to determine if
probably a residential address
• Best indicator we could determine – not perfect
Landscape Mosaic
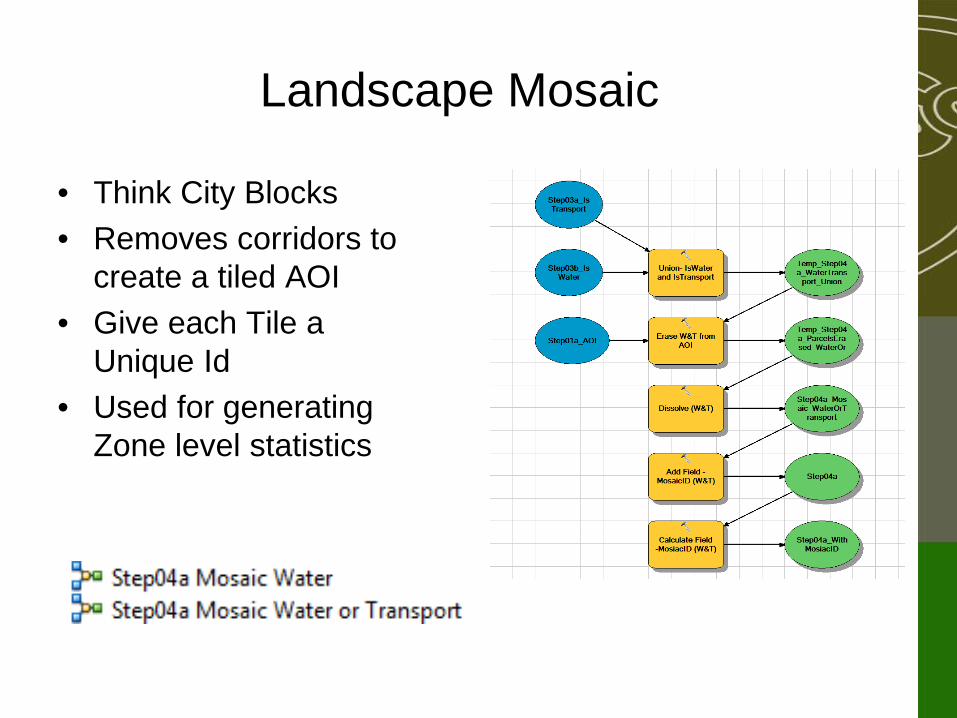
• Think City Blocks • Removes corridors to
create a tiled AOI • Give each Tile a
Unique Id • Used for generating
Zone level statistics
5. Union (Combine) Layers
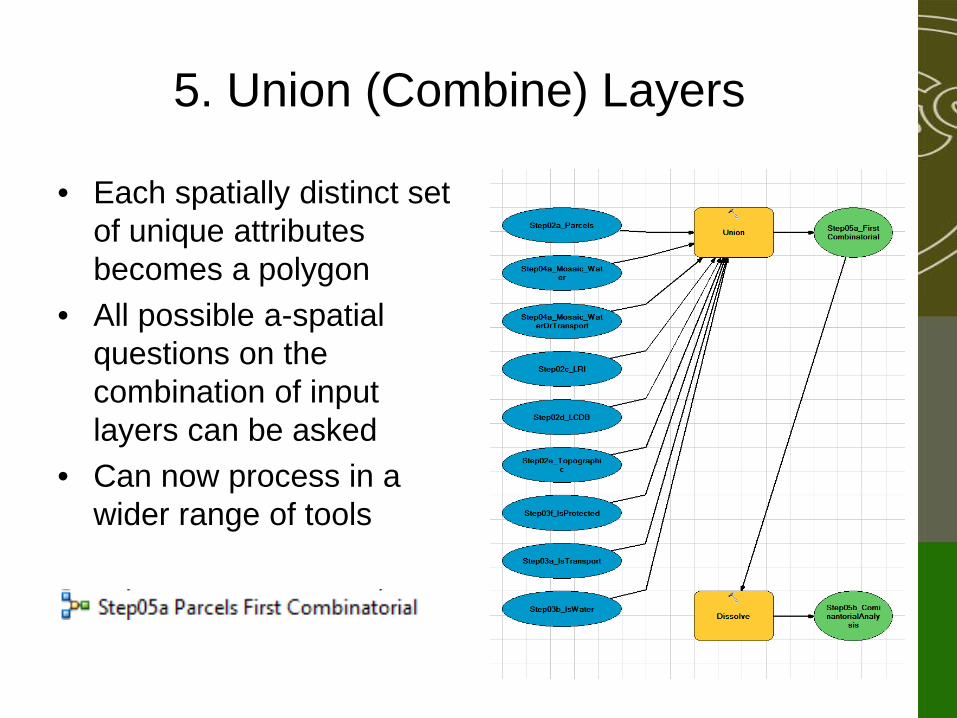
• Each spatially distinct set of unique attributes becomes a polygon
• All possible a-spatial questions on the combination of input layers can be asked
• Can now process in a wider range of tools
6. Export Result
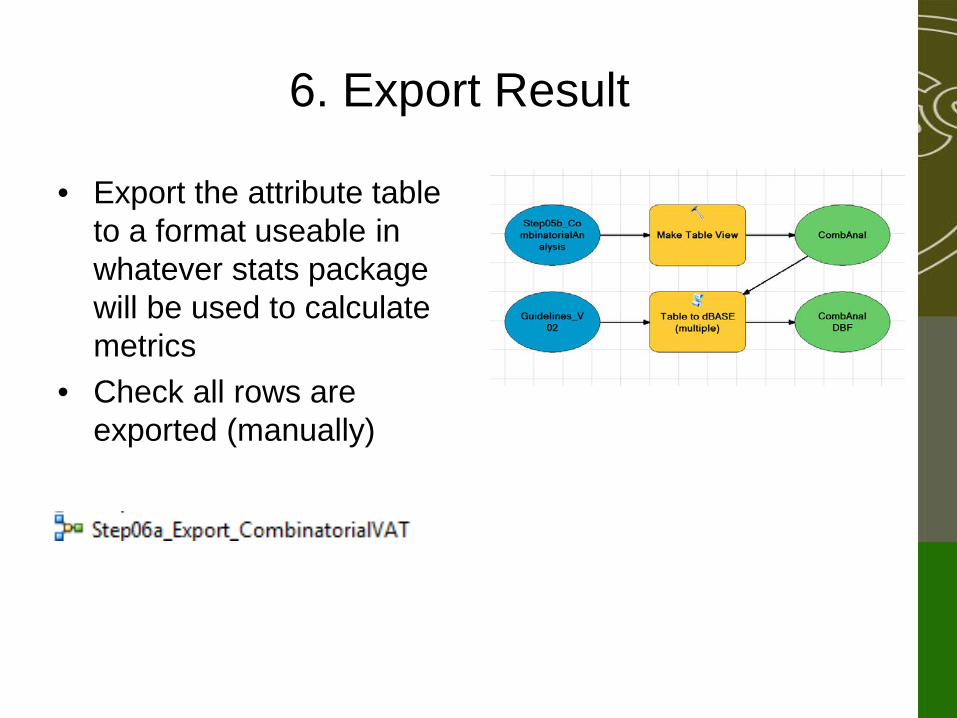
• Export the attribute table to a format useable in whatever stats package will be used to calculate metrics
• Check all rows are exported (manually)

Checking IsWater
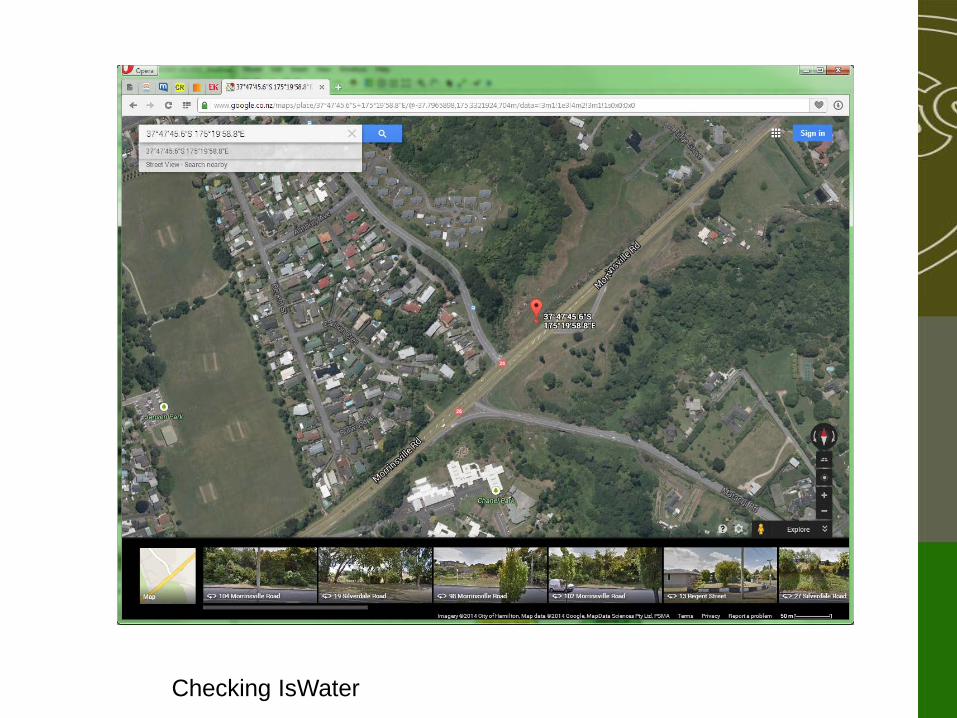
Checking IsWater


