
GUESTA Lean methodology for Management
Science and Operations Research
Prof. Guido PerboliEmail: [email protected]

Agenda
Why a Lean methodology GUEST Case studies Waste collection Car-sharing BMs and tariffs
2© 2015 G. Perboli - GUEST4OR - Montreal 2015-11-03

A little bit of history
GUEST: Lean Business methodology G. Perboli – Prof. in Strategic Magement and OR in Politecnico
di Torino R. Gentile – CEO of BDS, a consultancy company in Business
Development and Strategic Management What links startuppers and researchers
Jake: We're putting the band back together.Mr. Fabulous: Forget it. No way.Elwood: We're on a mission from God.
The Blues Brothers (1980) Only success stories are told What makes projects fail? www.autopsy.io Wrong customer, wrong implementation for the customer
3© 2015 G. Perboli - GUEST4OR - Montreal 2015-11-03

Macroscopic positioning
CLAIMCompanies need tool to efficiently manage their innovation and business
development processes, reduce the gap between business areas (e.g., managers and marketing) and operations and innovation and reduce to time to implement
their strategic decisions
GOALIntroduce lean concepts in business development, project management and
innovation management in a repeatable, sustainable and efficient way
VISIONMove from Lean Startup to Lean Business
Create an engineered process requiring a low learning curve based on Lean Startup
4© 2015 G. Perboli - GUEST4OR - Montreal 2015-11-03

Why we need GUEST?
As Is Different methodologies to speed up business
development and innovation management Require specific training Often domain dependent
WCMAgileLean StartupLean Production
To Be Single framework adaptable to different domains Can include different actors and different stakeholders Easy to manage and implement Low learning curve
5© 2015 G. Perboli - GUEST4OR - Montreal 2015-11-03

Definition
GUEST is a Lean Business methodology developed by G. Perboli and R. Gentilewith the aim of providing at firms an innovative structure for the businessmanagement.
The methodology supports firms that are at the end of the Start-up period, to the future developed of
their business models SMEs to implement new business Innovation projects
6© 2015 G. Perboli - GUEST4OR - Montreal 2015-11-03

Multi-Actor Complex System (MACS)
Support the actors in the control of their projects, from the idea of new productor service, to the implementation
Control the decisional process
Evaluate the decisions
Give a standardization of documents and tools used by different stakeholders,to connect in a common framework their vision, issues, results, problems andopportunities, but also to allow an easily following benchmark
7© 2015 G. Perboli - GUEST4OR - Montreal 2015-11-03

GUEST is divided in five consecutive steps:
1. Go2. Uniform3. Evaluate4. Solution5. Test
8© 2015 G. Perboli - GUEST4OR - Montreal 2015-11-03

GUEST
9© 2015 G. Perboli - GUEST4OR - Montreal 2015-11-03
Description of the environment
Standardize the information to define the solutioncanvas
Define the model(s) and the solution structure
Implement the solution
Test plan

1st Step: GO
The scope of this first step is to establish an approach with the firm, gather data andinformation for build a knowledge base and make a first evaluation of the project andbusiness potentiality.
Request of firstcontact with theowner or theProject Manager Kick off meeting with the Prospect and
face-to-face survey administration
Share surveys with team workof the firm and processing ofthe results
Second meeting with the Prospect toshow results and to define thecollaboration terms.
10© 2015 G. Perboli - GUEST4OR - Montreal 2015-11-03

GO SURVEY
For the qualitative data gathering is used a Standardize Survey that results from themerger of the Solution Canvas and the Basel II Guidelines for SMEs.
This survey provides a full description of a company profile and its environment.
CUSTOMER SURVEY ADVISORY SURVEYGeneral Information
ActivitiesCommercial Information
CustomersSuppliers
CompetitorsEvaluation
11© 2015 G. Perboli - GUEST4OR - Montreal 2015-11-03
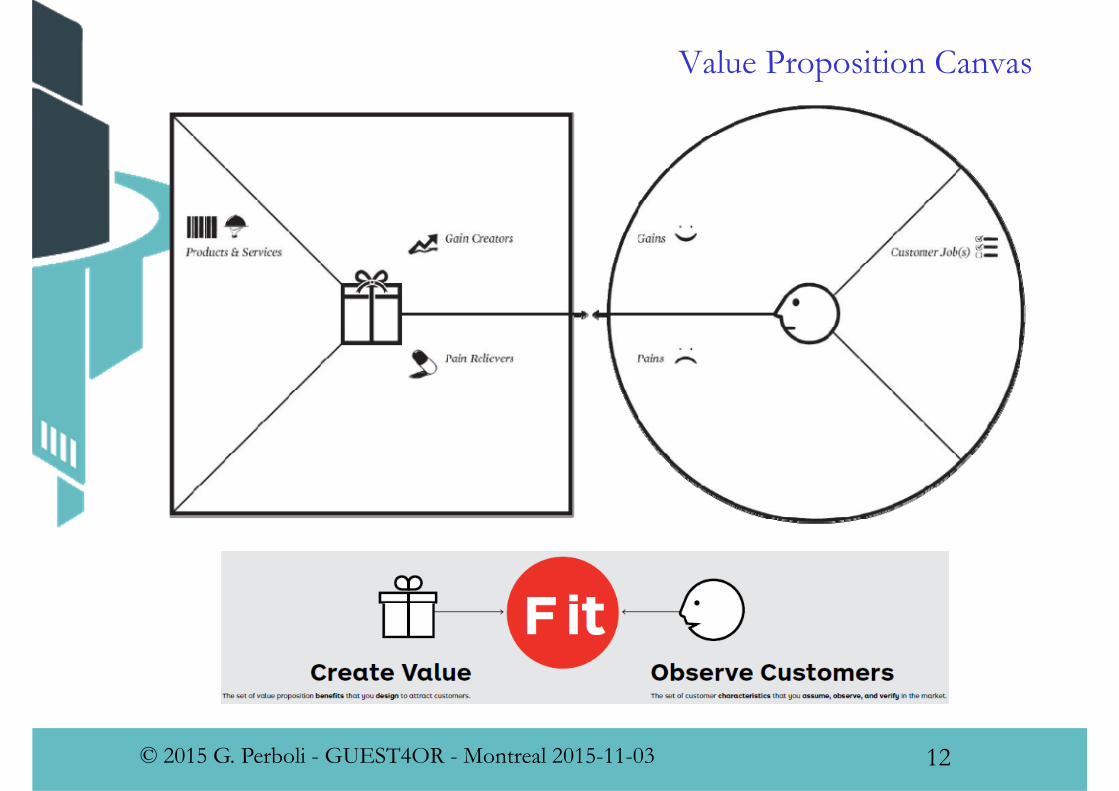
Value Proposition Canvas
12© 2015 G. Perboli - GUEST4OR - Montreal 2015-11-03
2nd Step: UNIFORM
Assess in a standard way, the information collected in Go phase Obtain a common vision of the MACS.
Assumption Governance and the state-of- the art of the company and its business
models are described Tool: Solution Canvas proposed by Perboli and Gentile
13© 2015 G. Perboli - GUEST4OR - Montreal 2015-11-03

Blue Ocean Strategy
Strategic model by Kim and Mobourgne Key points Create new business horizons Develop strategic and operational actions to create new
products/services Focusing on the value of the innovation
14© 2015 G. Perboli - GUEST4OR - Montreal 2015-11-03

Our implementation
Customers: users and decision makers (DMs) C-Cube rule Customers (that will pay for) Am I focusing on the right users/ DMs types? Customer hypotheses/validation
Customers (that would like to pay…but they don’t know yet) Who will pay for my OR&MS solution? Customer discovery
Customers (that will never pay for) Why they should pay for my OR&MS solution? Customer validation
15© 2015 G. Perboli - GUEST4OR - Montreal 2015-11-03

Canvas
16© 2015 G. Perboli - GUEST4OR - Montreal 2015-11-03

Canvas
17© 2015 G. Perboli - GUEST4OR - Montreal 2015-11-03

Solution canvas
18© 2015 G. Perboli - GUEST4OR - Montreal 2015-11-03

Solution canvas
19© 2015 G. Perboli - GUEST4OR - Montreal 2015-11-03
WhoWho
DMshierarchyDMshierarchy
SolutionconstraintsWhichactivitiesdoIneedtoimplementmysolution
ProblemconstraintCoreconstraintsTechnologyconstraintsSoftconstraints
SolutionconstraintsWhichactivitiesdoIneedtoimplementmysolution
ProblemconstraintCoreconstraintsTechnologyconstraintsSoftconstraints
Decisiontypes
Isthereapriority/hierarcy inthedecisions?
Howharethedecisionsimplemented?
Howlongtheylast?
Decisiontypes
Isthereapriority/hierarcy inthedecisions?
Howharethedecisionsimplemented?
Howlongtheylast?
Who
Usershierarchy
Who
Usershierarchy
User/DMsrelationship
DMsarealsousers’
User/DMsrelationship
DMsarealsousers’
Whichinfo/resourcesweneed
Whoisprovidingthem?
Uncertaintylevel?
Whichinfo/resourcesweneed
Whoisprovidingthem?
Uncertaintylevel?
Decisionchannels
Implementationchannels
Decisionchannels
Implementationchannels
Whicharetheobjectivesofthesolution
Timehorizonoftheobjectives
KPIs definition
Whicharetheobjectivesofthesolution
Timehorizonoftheobjectives
KPIs definition
Valueofthesolution(economic,social,ethical)
Profitgivenbythesolution(costreduction/revenueincrease)
Valueofthesolution(economic,social,ethical)
Profitgivenbythesolution(costreduction/revenueincrease)
Costsforintroducingthesolution
Costsofbuildingthesolution
Costsforintroducingthesolution
Costsofbuildingthesolution
Costsfornotintroducingthesolution
Costsofmaintainingthesolution
Costsfornotintroducingthesolution
Costsofmaintainingthesolution

3rd Step: EVALUATE
Build your model(s) LB MIP Stochastic
Check the feasibility of the solution Exact Heuristic…
Discuss the model by the Solution Canvas Define KPIs to evaluate your work OF is not enough
20© 2015 G. Perboli - GUEST4OR - Montreal 2015-11-03

4th Step: SOLVE
Implement the solution Integrate with other customers’ appliances Measure the KPIs
21© 2015 G. Perboli - GUEST4OR - Montreal 2015-11-03

5th Step: TEST
Build a test plan Define the expected outcomes Monitor the solution AND keep track of the issues
22© 2015 G. Perboli - GUEST4OR - Montreal 2015-11-03

Two case studies
Waste collection Car-sharing Business Models and Operations analysis
23© 2015 G. Perboli - GUEST4OR - Montreal 2015-11-03

ONDE UWC – Garbage collection
Waste collection in Turin Project funded by the Regional Council of Piedmont Issue: 9 months from the kickoff to the integration We used the GUEST methodology to reduce the time for
defining the optimization solution and the related models Objectives Optimization: build a scheduler for the weekly shifts reducing the
total costs Increase the awareness of the citizens about waste collection Collect field data and store in an Open Access form
24© 2015 G. Perboli - GUEST4OR - Montreal 2015-11-03

Go
Two technical meetings CIDIU President COO
Representatives of the other companies involved in the project Nord Engineering Moltosenso s.r.l.
2 full days with the workers
25© 2015 G. Perboli - GUEST4OR - Montreal 2015-11-03

Go – present situation
Periodic waste collection Periodicity not required by the contracts with the municipalities Used to simplify the shift creation
Different waste types 3 shifts with different costs Third shift is an extra shift: increment of +50% of the costs
KPIs Vehicles per shift: 1.5 in the mean Mean % volume used in the garbage bins: 28% Extra shifts impact: 12%
26© 2015 G. Perboli - GUEST4OR - Montreal 2015-11-03

Uniform
27© 2015 G. Perboli - GUEST4OR - Montreal 2015-11-03
Planning• COOLogistics• Foreman
Planning• COOLogistics• Foreman
DMshierarchy1. COO2. Foreman
DMshierarchy1. COO2. Foreman
SolutionconstraintsSolutiongiveninacoupleofminutes• Heuristicsolution
AvailableasSaS
ProblemconstraintSeenextslide
SolutionconstraintsSolutiongiveninacoupleofminutes• Heuristicsolution
AvailableasSaS
ProblemconstraintSeenextslide
Decisions
• Assignmentvehicle‐garbagetype– 1week
• Routeofthevehiclesineachshift– 1day
Decisions
• Assignmentvehicle‐garbagetype– 1week
• Routeofthevehiclesineachshift– 1day
Internal(fullview)• CIDIU
Management• Foreman• Drivers• Mobileapp
External(partialview)• BigData
platform• Citizensand
municipalities
Internal(fullview)• CIDIU
Management• Foreman• Drivers• Mobileapp
External(partialview)• BigData
platform• Citizensand
municipalities
COO‐>workers
DSS‐>BigDatainfrastructure
DSS‐>Municipalities
COO‐>workers
DSS‐>BigDatainfrastructure
DSS‐>Municipalities
Garbagegenerationdistributionperbin(highuncertain)Shifts/vehiclescharacteristicsLocationofgarbagebinsContracts
Garbagegenerationdistributionperbin(highuncertain)Shifts/vehiclescharacteristicsLocationofgarbagebinsContracts
Decisionchannels• Intranet• Mobileapp• Youtube
Implementationchannels• APIs• Digitalreports
Decisionchannels• Intranet• Mobileapp• Youtube
Implementationchannels• APIs• Digitalreports
Freeresourcestoexpandtheservicetoothermunicipalities
Usethesolutionforwhatifanalysis
Freeresourcestoexpandtheservicetoothermunicipalities
Usethesolutionforwhatifanalysis
Automaticcreationofweeklyshifts
Reducetheoperationalcosts
Minimizethetotalservicecost(includingenvironmentalcosts)
Automaticcreationofweeklyshifts
Reducetheoperationalcosts
Minimizethetotalservicecost(includingenvironmentalcosts)
Costsforinfrastructuremaintenance
Costfornotintroducingthesolution• Grant• Politicalaspects
Costsforinfrastructuremaintenance
Costfornotintroducingthesolution• Grant• Politicalaspects
Developmentcosts(piedmont)• Prototype• Integration
Fullintroduction
SpecificHWandSW(Gurobi)
Developmentcosts(piedmont)• Prototype• Integration
Fullintroduction
SpecificHWandSW(Gurobi)

Objectives
Minimize the costs Vehicle usage Vehicle tours
Limit the extra shifts Have space to manage bins with pickup problems in previous shifts
28© 2015 G. Perboli - GUEST4OR - Montreal 2015-11-03

Constraints
Empty the bins before they reach the 80% of the volume usage We break the periodicity We use the contract
Vehicles can pickup one garbage type per shift Vehicle tours limited to 6 hours Vehicle capacity Tours start at the depot, end to the specific garbage collection point
29© 2015 G. Perboli - GUEST4OR - Montreal 2015-11-03

Evaluate
MIP model with simplified routing Temporal/spatial network representation The size of the model explodes with the number of bins and the
shifts Hard to find good solutions with 24 hours of computation on a 12
cores parallel machine Model used to share with CIDIU some preliminary solutions and
check our hypotheses
30© 2015 G. Perboli - GUEST4OR - Montreal 2015-11-03

Solve
Optimization heuristic based on the usage of a series of simplified versions of the original MIP model Cluster the bins related to the garbage distribution Simplified model that builds the shifts on the clusters Creation of the tours
Implemented in C++/Gurobi
31© 2015 G. Perboli - GUEST4OR - Montreal 2015-11-03
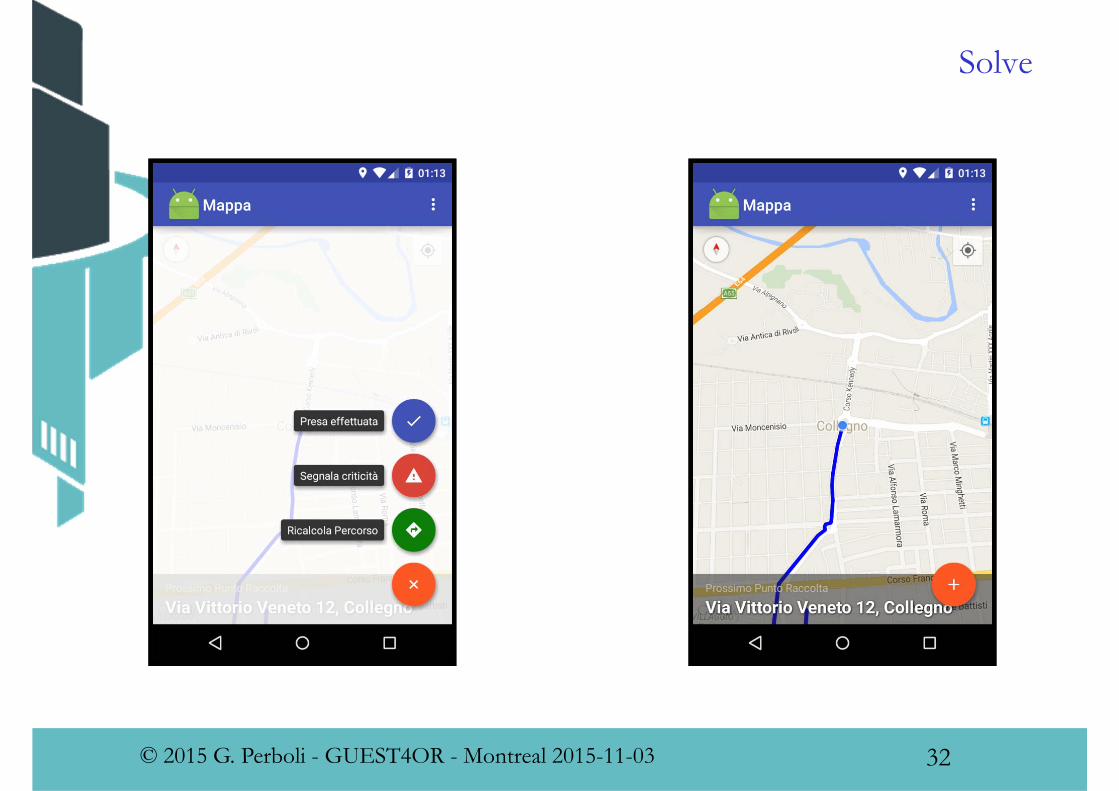
Solve
32© 2015 G. Perboli - GUEST4OR - Montreal 2015-11-03

Test - Results
New KPIs’ values Vehicles per shift: 1 Mean % volume used in the garbage bins: 70% Extra shifts impact: 3%
Some project KPIs # meetings before first model: 2 TimeToFirstModel: 1.5 months TimeToModel: 4 months (including test) MVP: less than 6 months
A small outcome Video in Youtube
33© 2015 G. Perboli - GUEST4OR - Montreal 2015-11-03
Car-sharing Business Models and Operations analysis
Car-sharing business Growing market Exiting from the pioneering phase Question: what can should we implement in a DSS to optimize
the process?
34© 2015 G. Perboli - GUEST4OR - Montreal 2015-11-03

GO – Current situation
Taxonomy of 15 years of literature Ferrero, F., Perboli, G., Vesco, A., Caiati, V., and Gobbato, L.
(2015). Car-sharing services: Taxonomy and annotated review. Technical Report CIRRELT-2015-47, CIRRELT.
A lot of work at the operational level Just a bit at strategic level 1 for the business part None about tariffs
Business environment is changing Reduced public funds Car-sharing must be a competitive market New tariff schemes similar to the mobile ones
35© 2015 G. Perboli - GUEST4OR - Montreal 2015-11-03

Uniform
36© 2015 G. Perboli - GUEST4OR - Montreal 2015-11-03
CEOCSMarketing
Publicstakeholders
CEOCSMarketing
Publicstakeholders
DMshierarchy1. Public
stakeholder/CEO
2. Marketing
DMshierarchy1. Public
stakeholder/CEO
2. Marketing
SolutionconstraintsSolutiongiveninacoupleofminutes• Simulation/Opti
mization
AvailableasSaS
ProblemconstraintsBuildrealisticsharingscenarios
Onetariffappliedtoeachtrip
Simulateonecityatatime
Obtaintraveltimesinseconds
SolutionconstraintsSolutiongiveninacoupleofminutes• Simulation/Opti
mization
AvailableasSaS
ProblemconstraintsBuildrealisticsharingscenarios
Onetariffappliedtoeachtrip
Simulateonecityatatime
Obtaintraveltimesinseconds
Decisions
• Tariffschemestoapply
Decisions
• Tariffschemestoapply
Internal(fullview)• Marketing
External(partialview)• Publicauthorities• Newcustomer
segments
Internal(fullview)• Marketing
External(partialview)• Publicauthorities• Newcustomer
segments
CEO>Marketing
Threat• Public
stakeholders
CEO>Marketing
Threat• Public
stakeholders
CityroadnetworkUserhabitsCityspeed profilesActual costs forusertype
CityroadnetworkUserhabitsCityspeed profilesActual costs forusertype
Decisionchannels• Internet• Mobileapp
Implementationchannels• APIs• Digitalreports
Decisionchannels• Internet• Mobileapp
Implementationchannels• APIs• Digitalreports
Evaluaterealcostsforcustomersegments
Increaseprofitandcompanyvalue
Usethesolutionforwhatifanalysis
Evaluaterealcostsforcustomersegments
Increaseprofitandcompanyvalue
Usethesolutionforwhatifanalysis
Validationofnewtariffs
Comparisonofthemarketsharewithothercompanies
Disseminationdoneforthepublicstakeholders
Validationofnewtariffs
Comparisonofthemarketsharewithothercompanies
Disseminationdoneforthepublicstakeholders
Costsforinfrastructuremaintenance
Maps,simulator
Costfornotintroducingthesolution
• Looseusersegments
• Closethecompany
Costsforinfrastructuremaintenance
Maps,simulator
Costfornotintroducingthesolution
• Looseusersegments
• Closethecompany
Developmentcosts• Prototype• Maps
Developmentcosts• Prototype• Maps

Solution
Better understanding of the user behaviours Survey to about 1500 potential customers
Better understanding of companies marketing 5 companies analyzed by means of their Business Model Canvas
Tariff simulation Monte Carlo based simulation
37© 2015 G. Perboli - GUEST4OR - Montreal 2015-11-03

Monte Carlo
Given a certain city, a set of tariffs described in terms of price per driving minute, price per parking minute (price paid by the customer if the car is rented, but in a parking slot), price per km, the customer preferences in terms of trips, trip types, kilometers traveled per year, and a list of possible trips Identify a set of potential routes. Create S scenarios with the random demands in term of customer trips,
their temporal distribution and type. For each scenario s and until the kilometers traveled per year are not
reached Extract a route from the routes list, assign a departure time according
to the user preferences and simulate it in terms of actual travel time and apply to it the more profitable tariffof the user type.
Given the scenario values in terms of cost paid to travel the kilometers traveled per year, compute the expected value of the cost.
Compute the distribution of the expected value.
38© 2015 G. Perboli - GUEST4OR - Montreal 2015-11-03

Scenarios
Trips Real traffic data gathered from the sensors in the city of Turin Empirical speed profiles for different types of route (central,
peri-urban, high speed)
User types Commuter, professional casual Differ in time intervals and O/D pairs KM/year ranging from 1000 to 15000
39© 2015 G. Perboli - GUEST4OR - Montreal 2015-11-03

Test
Battery of tests over the Turin area Comparison of 3 companies profiles Enjoy, Car2Go, CarcityClub
Some results Free flow is the best option for any type of user Car-sharing is presently an alternative up to 7000 km/year No marketing strategy for professional/SME users Unawareness of the users to ownership costs About 80% of the users think to pay for the ownership less than
2000 €/year
40© 2015 G. Perboli - GUEST4OR - Montreal 2015-11-03
Conclusion and future perspectives
Consolidation of the methodology both for OR/MS and Business Development
Link between OR/MS and management Introduced in some large scale projects SynchroNet EU project
Present KPIs Reduction of the time between first meeting and solution/model
delivery up to 50% ONDE-UWC 4 months to identify, discuss and test the model Car-sharing: 5 months to define and validate the solution
(including 3 months of literature analysis)
41© 2015 G. Perboli - GUEST4OR - Montreal 2015-11-03

42© 2015 G. Perboli - GUEST4OR - Montreal 2015-11-03


