Download - Group Performance Indicators 201314-201516
1
Group Performance Indicators 201314-201516

2
Predetermined objectives:Financial performance
STRATEGIC THEME EFFICIENT SUSTAINABLE BUSINESS THAT IS WELL DEFINED AND WELL COMMUNICATED TO THE PUBLICStrategic Goal Strategic objective Measure Strategic Plans 2014 Annual target Target
Q1
2014
Q2
2014
Q3
2014
Q4
2014Attain financial sustainability while delivering on Government social mandate
Improve financial performance
Growth in Group revenue by 4.6%
Grow Group revenue by 4.65% on prior year base of R6.105b Increase of R284m Increase of R70m Increase of R125m
Increase of R158m
Decrease of R69m
Grow Postbank non-interest revenue by 10.8% on prior year base of R359m
Increase of R38.8m
Increase of R9.7m Increase of R9.7mIncrease of
R9.7mIncrease of
R9.7m
Group operating profit/(Loss) before PRMA
Deliver sustainable returns through, revenue growth, cost optimization and enhancement of efficiencies
Loss of R85m Loss of R95m Loss of R102mAchieve profit of
R84mAchieve profit of
R28m
Strengthen the financial position
Growth in Postbank depositors book
Grow the Postbank depositors book from prior year base of R4.513b
Increase of R269m Increase of R94m Increase of R92mIncrease of
R44mIncrease of
R39m
Return on Assets (NP) Ensure achievement of target (0.8%) (0.9%) (1.0%) 0.8% 0.3%
Return on Equity (NP) Ensure achievement of target (3.0%) (3.6%) (3.7%) 3.2% 1.1%
Increase in Total Assets Increase in total assets by 2% from prior year base of R10.299b Increase of R208m
Increase of
R52mIncrease of R52m
Increase of R52m
Increase of R52m
Current Ratio Ensure achievement of target 1.26 1.26 1.26 1.26 1.26
Average Debtors days
Mail Ensure achievement of target
17 days average
17 days average for Q
17 days average for Q
17 days average for Q
17 days average for Q
Courier 45 days at year
end55 days average
for Q55 days average
for Q45 days
average for Q
45 days average for Q days average
for Q

3
Predetermined objectives:Financial performance (continued)
STRATEGIC THEME EFFICIENT SUSTAINABLE BUSINESS THAT IS WELL DEFINED AND WELL COMMUNICATED TO THE PUBLICStrategic Goal Strategic objective Measure Strategic Plans 2014 Annual target Target
Q1
2014
Q2
2014
Q3
2014
Q4
2014Attain financial sustainability while delivering on Government social mandate
Courier Ensure achievement of target 45 days at year
end55 days average
for Q55 days average
for Q45 days
average for Q
45 days average for Q days average
for QImprove cost efficiency management
Group total cost as % of total income
Various cost and process optimization initiatives Annual average
target of 101%106% 106% 95% 98%
Reduction in leave liability
Implement new leave policy from 01 April 2013 and enforcement of leave management controls to reduce leave liability
Reduction of leave liability by
20% from a base of R199m
2% 5% 3% 10%
Cost Saving Various cost and process optimization initiatives on the total cost of R6.287b
R78.8m R9.55m R11.25m R10.55m R47.45m
Capital investment in priority areas
Return on CAPEX spend
10% return on capital invested of R250m
R25m R0m R5m R7.5m R12.5m
Value creation through alternative revenue models
Board approved Property Development strategy
Explore and quantify strategies to leverage the existing property portfolio for value creation
Delivery of a board approved comprehensive
property development
plan and delivery strategy
Exploration and quantification including finalising the business case,
consultation with all stakeholders, internal and external, observing all
internal protocols
Delivery of Approved strategy
Implementation
Alternative financing models
Board approved Funding strategy
Establishment of a suitable funding strategy to finance key projects outside normal operations
Establishment of a funding strategy
-Approved funding
strategyGo to market

4
Predetermined objectives:Non-Financial performance
STRATEGIC THEME INVEST IN PEOPLE, TAKE THEM ALONG AND BUILD CAPACITY FOR THE FUTURE
No of workplace environments refurbished
Physical Infrastructure Renewal
20 buildings nationally
4 buildings 6 buildings 6 buildings 4 buildings
Staff Satisfaction index
Implement 100% intervention plan based on outcomes from previous survey to address internal communication shortcomings and implement a monitoring tool
Improvement of employee engagement/
communication satisfaction index from a
base of 56.3% to 70%
Develop intervention
plan to address outcomes from
previous survey
50% Implement corrective measures
100%
Implement corrective measures
Monitor and evaluate impact
of corrective measures to achieve 70%
Human capital capacity building
Success rate of individuals on leadership development programs
Targeted interventions via Leadership development programs and the evaluation of the success thereof (base of 24)
To improve current base of 90% by 5% to
95%
N/A N/A N/AAnnual target
95%
Vacancy rate at first two levels
(subject to new revised structure)
Filling of identified critical leadership positions. A total of 8 out of the current 18 vacancies by year end
Progressive Reduction of vacancy rate from 60% to 33%
50%
Fill 4 posts
40%
Fill 2 posts
35%
Fill 1 post
33%
Fill 1 post

5
Predetermined objectives:Non-Financial performance (continued)
STRATEGIC THEME INVEST IN PEOPLE, TAKE THEM ALONG AND BUILD CAPACITY FOR THE FUTURE
Invest in our people by building capacity and implementing transformation programs
Human capital capacity building
No. of critical positions with successors
Confirm a Talent pipeline against a defined talent matrix for the identified critical positions (14 @ Post office and 3 @ Postbank)
100%
17
35%
6 (SAPO)
24%
4 (SAPO)
24%
4 (SAPO)
17%
3 (Postbank)
570 staff with completed and contracted individual scorecards
Implement an automated Integrated performance management system
PM implemented at all
management levels including
executive directors
100% contracted on current
system
50% conversion on automated
system
100% conversion on automated
system
Monitoring and Evaluation
Number of staff with completed & evaluated scorecards
570 - 100% of half yearly
performance assessments
- 100% of full year performance assessments
Wellness Staff participation in HIV/AIDS testing programs
Encourage employee participation in voluntary HIV/AIDS testing
Target of 78%
(12 480)of total staff to be
progressively tested by end of Q4 from a base of 75% (12 000)
30% 40% 50% 78%
Absenteeism rate Reduce current absenteeism rate by 50% to 6% from a base of 11.8%
To reach a target of 6% (total absent days) by Q4
10%
Total absent days
9%
Total absent days
7%
Total absent days
6%
Total absent days
Sick leave rate Maintain sick leave rate within the industry benchmark and ultimately reach target of 2.3% from a base of 2.6%
To reach a progressive
target of 2.3% (total sick leave
days) as per industry
benchmark by year end
2.5%
Total sick leave days
2.4%
Total sick leave days
2.4%
Total sick leave days
2.3%
Total sick leave days

6
Predetermined objectives:Non-Financial performance (continued)
STRATEGIC THEME INVEST IN PEOPLE, TAKE THEM ALONG AND BUILD CAPACITY FOR THE FUTURE
Invest in our people by building capacity and implementing transformation programs
Supporting Government Imperatives
Advancement of HDIs and women in the workplace
Employment equity targets
Gender equity targets Total
females(base=
7043-45%)
Achieve target(6573)
42% 42% 42% 42% 42%
Total black females(base =5548-36% )
Achieve target(4469)
29% 29% 29% 29% 29%
Black females as % of total Graduates & learners
(base =35 – 45%)
Achieve target(50) 60% 60% 60% 60% 60%
Total blacks base (13035 = 84%)
Achieve target 79% 79% 79% 79& 79%
Integration of people with disabilities in the workplace
Disability targets (as per DWCPD guidelines) Disability
(base 69 = 0.44%)
Achieve target 2% 2% 2% 2% 2%
% of total number Graduates & learners(no current base)
Achieve target 2% 2% 2% 2% 2%

7
Predetermined objectives:Non-Financial performance (continued)
STRATEGIC THEME ALIGN BUSINESS OPERATIONS TO CUSTOMER NEEDS, SHAREHOLDER AND GOVERNMENT PRIORITIES
Provide affordable postal and related services that meet the needs of our customers
Meet License and mandate obligations by increasing the accessibility of products and services
Additional physical addresses rolled out
Roll out addresses as defined in schedule 2 of the amended SAPO license agreement by ICASA (Government gazette no. 35080)
1 195 680 198 920 198 920 398 920 398 920
Additional retail outlets (points of presence) established
Roll out points of presence as defined in schedule 1 of the amended SAPO license by ICASA (Government gazette no. 35080)
50 0 3 22 25
Preferential procurement Enterprise development
Total B-BBEE spend as a % of total procurement spend (invoiced amount)
Procurement plan and practices aligned to advancement of
B-BBEE
60% 60% 60% 60% 60%
B-BBEE contributor level
Maintain the current level 4 contributor
4 4 4 4 4
Board approved supplier development strategy
Development of a comprehensive enterprise development strategy
Delivery of a board approved comprehensive
enterprise development
strategy
Postbank Corporatization
Submission of banking license application
Postbank Corporatization process
Banking license application
submitted to regulator by
31 March 2014
- - - Submission of Banking license
application to regulator
Active participation in Africa’s development agenda
Implementation status at remaining countries
Implementation of the SADC cross border interoperable money transfer service at remaining countries
Implementation @
Mozambique
and DRC
- - Mozambique DRC
8
Predetermined objectives:Non-Financial performance (continued)
STRATEGIC THEME ALIGN BUSINESS OPERATIONS TO CUSTOMER NEEDS, SHAREHOLDER AND GOVERNMENT PRIORITIES
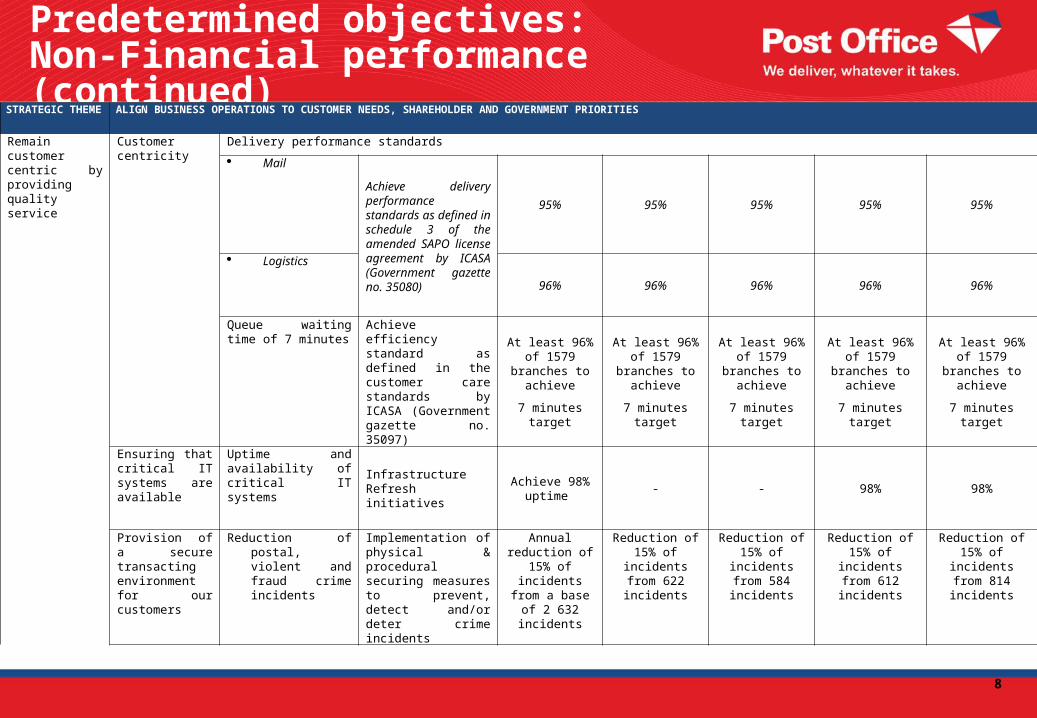
Remain customer centric by providing quality service
Customer centricity
Delivery performance standards
Achieve delivery performance standards as defined in schedule 3 of the amended SAPO license agreement by ICASA (Government gazette no. 35080)
95% 95% 95% 95% 95%
Logistics
96% 96% 96% 96% 96%
Queue waiting time of 7 minutes
Achieve efficiency standard as defined in the customer care standards by ICASA (Government gazette no. 35097)
At least 96% of 1579 branches
to achieve
7 minutes target
At least 96% of 1579 branches
to achieve
7 minutes target
At least 96% of 1579 branches
to achieve
7 minutes target
At least 96% of 1579 branches to
achieve
7 minutes target
At least 96% of 1579 branches to
achieve
7 minutes target
Ensuring that critical IT systems are available
Uptime and availability of critical IT systems
Infrastructure Refresh initiatives
Achieve 98% uptime
- - 98% 98%
Provision of a secure transacting environment for our customers
Reduction of postal, violent and fraud crime incidents
Implementation of physical & procedural securing measures to prevent, detect and/or deter crime incidents
Annual reduction of 15% of
incidents from a base of 2 632
incidents
Reduction of 15% of incidents
from 622 incidents
Reduction of 15% of incidents
from 584 incidents
Reduction of 15% of incidents from
612 incidents
Reduction of 15% of incidents from
814 incidents

9
STRATEGIC THEME RENEW AND DESIGN A PHYSICAL NETWORK FOR THE FUTURE AND INNOVATE WITH NEW PRODUCTS AND SERVICES
Provide a secure, efficient and integrated infrastructure for better responsiveness to our stakeholders
Provide an efficient technology platform
Technology infrastructure renewal – conversation of current POS with WRE POS
WRE POS Replacement
Total of 1,370 branches to be
converted
Convert 658 branches
Convert 672 branches
Convert 40 branches
Achievement of annual target
Network Upgrade Upgrade the current network capability
All post-office on line
- - -All post offices on
linePhysical infrastructure renewal
Number of identified/planned properties refurbished
Proactive and reactive maintenance of critical buildings as identified
20 identified buildings
15% = 3 buildings
30% = 6 buildings
40% = 8 buildings 15% = 3 buildings
Providing a secure environment for our clients
No. of high risk branches reinforced Reinforcement of
Branch security through implementation of physical security measures to prevent violent crime
80 high risk postal outlets
-20 high-risk
postal outlets30 high-risk
postal outlets30 high-risk
postal outlets
% Reduction of violent crime at these branches
96% reduction from a base of 141 incidents
10% reduction from 38 incidents
10% reduction from 33 incidents
10% reduction from 37 incidents
10% reduction from 33 incidents
Predetermined objectives:Non-Financial performance (continued)

10
Predetermined objectives:Non-Financial performance (continued)
STRATEGIC THEME REVIEW INTERNAL POLICIES TO FOSTER GOOD GOVERNANCE, STREAMLINE PROCESSES AND ENHANCE EFFICIENT DFECISION MAKING
Maintain good corporate governance principles to ensure that we continuously improve as a trusted corporate citizen
Improve the control environment
Resolution of audit findings
Resolution of internal and external audit findings
Timeous resolution of all
residual risk audit findings
0 high risk audit findings
outstanding >90 DAYS
0 high risk audit findings
outstanding >90 DAYS
0 high risk audit findings
outstanding >90 DAYS
0 high risk audit findings
outstanding >90 DAYS
Control environment assessment measure
Status of control environment
High = 10%
Med = 30%
Low = 60%
High = 10%
Med = 30%
Low = 60%
High = 10%
Med = 30%
Low = 60%
High = 10%
Med = 30%
Low = 60%
High = 10%
Med = 30%
Low = 60%Effective risk management
Risk maturity assessment
Entrenchment and improvement of the risk management maturity level
Conduct an organizational
wide risk maturity assessment
Determine the risk maturity
baseline through a maturity
assessment
Develop a plan, in terms of the
baseline to improve
maturity level
Implement the risk maturity plan and
awareness
Measure improvement
against determined
baseline
% Improvement of risk profile
Reduction of residual risk profile by 10%
Baseline: 75% (Very High Risk)
Reduction of residual risk
profile by 10%
Complete BU ops risk
assessments & risk profile
Implementation of mitigation strategies
Implementation of mitigation strategies
10% improvement of residual risk
exposure profile downwards to at least 65% (High
Risk)
Compliance assurance
% Improvement of compliance risk profile
Reduction of compliance residual risk profile by 20% through compliance assessments
Baseline = 70% residual risk (High Risk)
Reduction of compliance residual risk
profile by 20%
Determine the compliance
maturity baseline through a
compliance maturity
assessment
Reduce by 7% Reduce by 14% 20% improvement of the compliance
risk exposure profile downwards to 50% (Moderate
Risk)

11
Predetermined objectives:Non-Financial performance (continued)
STRATEGIC THEME REVIEW INTERNAL POLICIES TO FOSTER GOOD GOVERNANCE, STREAMLINE PROCESSES AND ENHANCE EFFICIENT DFECISION MAKING
Maintain good corporate governance principles to ensure that we continuously improve as a trusted corporate citizen
Compliance assurance
% of Approved operational policies
Revision and alignment of the group’s operational policies and the publishing thereof to ensure their communication and enforcement
35% Review and alignment of policies and procedures
10% 15% 25% 35%
Establishment of a central repository of policies
Set up a central repository of
policies- - -
Set up and populate a central
repository of approved policies
Maintenance of ethical business practices
Ethics assessment Commission an organization wide ethics assessment to determine current perceived state of ethics to determine appropriate interventions
Assessment conducted
-
Determine the ethics maturity
baseline through an
ethics maturity assessment
Develop a plan, in terms of baseline,
to improve maturity level
Implement the ethics plan and
awareness
Contract management
No. of Contracts cleared from Back log
Regularization of outstanding contracts. Reduce Backlog as of 31 March 2013 80% 20% 40% 60% 80%
Crime awareness 17900 employees reached
Deployment of a crime awareness campaign to raise awareness of the Crime Buster Hotline for both employees and customers to encourage anonymous crime reporting
Conduct awareness sessions to
17,900 employees
Conduct awareness sessions to
2,000 employees
Conduct awareness sessions to
5,300 employees
Conduct awareness
sessions to 5,300 employees
Conduct awareness
sessions to 5,300 employees

12
Predetermined objectives:Non-Financial performance (continued)
STRATEGIC THEME REVIEW INTERNAL POLICIES TO FOSTER GOOD GOVERNANCE, STREAMLINE PROCESSES AND ENHANCE EFFICIENT DFECISION MAKING
Maintain good corporate governance principles to ensure that we continuously improve as a trusted corporate citizen
Social investment Categories of targeted beneficiaries. (8 Categories -include women, the disabled, unemployed young people, educators and learners, government officials, religious groups and community based organisations).
E-Rural access via digital solutions
(These include women, the disabled, Educators and learners, unemployed young people, government officials, religious groups, community based organizations, the elderly)
8
This includes all 8 categories of
targeted beneficiaries
serviced throughout the
year.
8 8 8 8
Community members using and accessing the 3 computer centres in Sending, Vredesvallei and Muxexe.
11 100 members 3 000 2 000 4 000 2 100
Number of identified training interventions for the community forum members in all 3 communities
12 interventions 3
Interventions per Q
3
Interventions per Q
3
Interventions per Q
3
Interventions per Q
No. of trainees per intervention
30
The same community
members will attend all the
training interventions for
the year
30 30 30 30
No. of secondary beneficiaries (secondary trainees, being trained by forum members)
6 000
beneficiaries
2 000 500 2 000 1 500

13
Predetermined objectives:Non-Financial performance (continued)
STRATEGIC THEME REVIEW INTERNAL POLICIES TO FOSTER GOOD GOVERNANCE, STREAMLINE PROCESSES AND ENHANCE EFFICIENT DFECISION MAKING
Remain environmentally conscious by promoting green practices
Environmental sustainability
Carbon emissions Carbon management by reducing emissions from by 2.5% from a base of 37,256tCO2e to 36,325 tCO2e
Contain emission to
below 36,325 tCO2e
Contain emission to
below 12,214 tCO2e
Contain emission to
below 11,894
tCO2e
Contain emission to below
7,264tCO2e
Contain emission to below
4,949tCO2e
No. of trees planted Nationally
Plant trees to offset carbon emissions
2,000 400
400
800
400
Energy consumption Reduce electricity (energy) consumption at the Data Centre and Mail Centres by 3% over prior year consumption from 38,278,305 KWh to 37,129,974 KWh
Contain consumption to
below 37,129,974 KWh
Contain consumption to
below 14,391,655
KWh
Contain consumption to below 11,599,355 KWh
Contain consumption to below 7,425,994 KWh
Contain consumption to below 3,712,997 KWh
Water consumption Reduce total water consumption by 3% over prior year consumption from 113,851 KL to 110,435 KL
Contain consumption to
below to 110,435 KL
Contain consumption to below to 44,174 KL
Contain consumption to below to 33.130 KL
Contain consumption to below to 22,087 KL
Contain consumption to below to 11,043 KL
Paper usage Reduction of total amount of paper used by 2.5% over prior year from 499 tons to 486 tons
Contain usage to below to 486
tons
Contain usage to below to 122 tons
Contain usage to below to 122 tons
Contain usage to below to 122 tons
Contain usage to below to 120 tons
Recycle 95% of used paper of 486 tons = 462 tons
Recycle 95% of used paper = 462 tons
Recycle 95% of paper used =
462 tons
115.5 tons 115.5 tons 115.5 tons 115.5 tons

14
END


