Water Resour Manage (2007) 21:427–467
DOI 10.1007/s11269-006-9024-4
Groundwater management and development byintegrated remote sensing and geographic informationsystems: prospects and constraints
Madan K. Jha · Alivia Chowdhury · V. M. Chowdary ·Stefan Peiffer
Received: 23 February 2005 / Accepted: 15 February 2006C© Springer Science + Business Media B.V. 2006
Abstract Groundwater is one of the most valuable natural resources, which supports human
health, economic development and ecological diversity. Overexploitation and unabated pollu-
tion of this vital resource is threatening our ecosystems and even the life of future generations.
With the advent of powerful personal computers and the advances in space technology, effi-
cient techniques for land and water management have evolved of which RS (remote sensing)
and GIS (geographic information system) are of great significance. These techniques have
fundamentally changed our thoughts and ways to manage natural resources in general and
water resources in particular. The main intent of the present paper is to highlight RS and GIS
technologies and to present a comprehensive review on their applications to groundwater hy-
drology. A detailed survey of literature revealed six major areas of RS and GIS applications in
groundwater hydrology: (i) exploration and assessment of groundwater resources, (ii) selec-
tion of artificial recharge sites, (iii) GIS-based subsurface flow and pollution modeling, (iv)
groundwater-pollution hazard assessment and protection planning, (v) estimation of natural
recharge distribution, and (vi) hydrogeologic data analysis and process monitoring. Although
the use of these techniques in groundwater studies has rapidly increased since early nineties,
the success rate is very limited and most applications are still in their infancy. Based on this
review, salient areas in need of further research and development are discussed, together
with the constraints for RS and GIS applications in developing nations. More and more RS-
and GIS-based groundwater studies are recommended to be carried out in conjunction with
field investigations to effectively exploit the expanding potential of RS and GIS technologies,
which will perfect and standardize current applications as well as evolve new approaches and
applications. It is concluded that both the RS and GIS technologies have great potential to
M. K. Jha (�) · A. ChowdhuryAgFE Department, Indian Institute of Technology, Kharagpur – 721 302, Indiae-mail: [email protected]
V. M. ChowdaryRRSSC, ISRO, IIT Kharagpur Campus, India
S. PeifferChair of Hydrology, University of Bayreuth, 95440 Bayreuth, Germany
Springer

428 Water Resour Manage (2007) 21:427–467
revolutionize the monitoring and management of vital groundwater resources in the future,
though some challenges are daunting before hydrogeologists/hydrologists.
Keywords Remote sensing . Geographic information system (GIS) . GIS-based subsurface
modeling . Groundwater vulnerability . Groundwater management
1. Introduction
Groundwater is one of the most valuable natural resources, which supports human health,
economic development and ecological diversity. Because of its several inherent qualities
(e.g., consistent temperature, widespread and continuous availability, excellent natural qual-
ity, limited vulnerability, low development cost, drought reliability, etc.), it has become an
immensely important and dependable source of water supplies in all climatic regions in-
cluding both urban and rural areas of developed and developing countries (Todd and Mays,
2005). Particularly, groundwater is emerging as a formidable poverty-alleviation tool, which
can be delivered direct to poor community far more cheaply, quickly and easily than canal
water (IWMI, 2001). Of the 37 Mkm3 of freshwater estimated to be present on the earth,
about 22% exists as groundwater, which constitutes about 97% of all liquid freshwater poten-
tially available for human use (Foster, 1998). Unfortunately, the excessive use and continued
mismanagement of water resources to supply ever-increasing water demands to profligate
users have led to water shortages, increasing pollution of freshwater resources and degraded
ecosystems worldwide (e.g., Clarke, 1991; Falkenmark and Lundqvist, 1997; de Villiers,
2000; Tsakiris, 2004). Myriad consequences of unsustainable groundwater use are becoming
increasingly evident and the key concern is to maintain a long-term sustainable yield from
aquifers (Todd and Mays, 2005). It is now a well-recognized fact that water is a finite and
vulnerable resource, and it must be used efficiently and in an ecologically sound manner for
present and future generations. It is rightly said that groundwater will be an enduring gauge
of this generation’s intelligence in water and land management.
Remote sensing with its advantages of spatial, spectral and temporal availability of data
covering large and inaccessible areas within short time has become a very handy tool in
exploring, evaluating, and managing vital groundwater resources (Chowdhury et al., 2003).
The hydrogeologic interpretation of satellite data have been proved to be a valuable survey
tool in areas of the world where little geologic and cartographic information exists or is
not accurate (Engman and Gurney, 1991). Satellite data provide quick and useful baseline
information about the factors controlling the occurrence and movement of groundwater like
geology, lithology, geomorphology, soils, land use/cover, drainage patterns, lineaments, etc.
(Bobba et al., 1992; Meijerink, 2000). However, all the controlling factors have rarely been
studied together because of the non-availability of data, integrating tools and/or modeling
techniques. Structural features such as faults, fracture traces and other such linear or curvilin-
ear features can indicate the possible presence of groundwater (Engman and Gurney, 1991).
Similarly, other features like sedimentary strata (i.e., alluvial deposits and glacial moraines)
or certain rock outcrops may indicate potential aquifers. The presence of ox-bow lakes and
old river channels are good indicators of alluvial deposits (Farnsworth et al., 1984). Shallow
groundwater could also be inferred by soil moisture measurements and by changes in vegeta-
tion types and pattern (Nefedov and Popova, 1972). In arid regions, vegetation characteristics
may indicate groundwater depth and quality. Groundwater recharge and discharge areas in
drainage basins can be detected from soils, vegetation, and shallow/perched groundwater
(Todd, 1980). Furthermore, differences in surface temperature (resulting from near-surface
Springer

Water Resour Manage (2007) 21:427–467 429
groundwater) measured by remote sensing have also been used to identify alluvial deposits,
shallow groundwater, and springs or seeps (Mayers and Moore, 1972; Heilman and Moore,
1981; van de Griend et al., 1985). Van de Griend et al. (1985) suggest that if surface temper-
ature measurements were made using thermal infrared sensors after a long period without
rain, it should be possible to map the regions of shallow water table and infer groundwater
recharge and discharge.
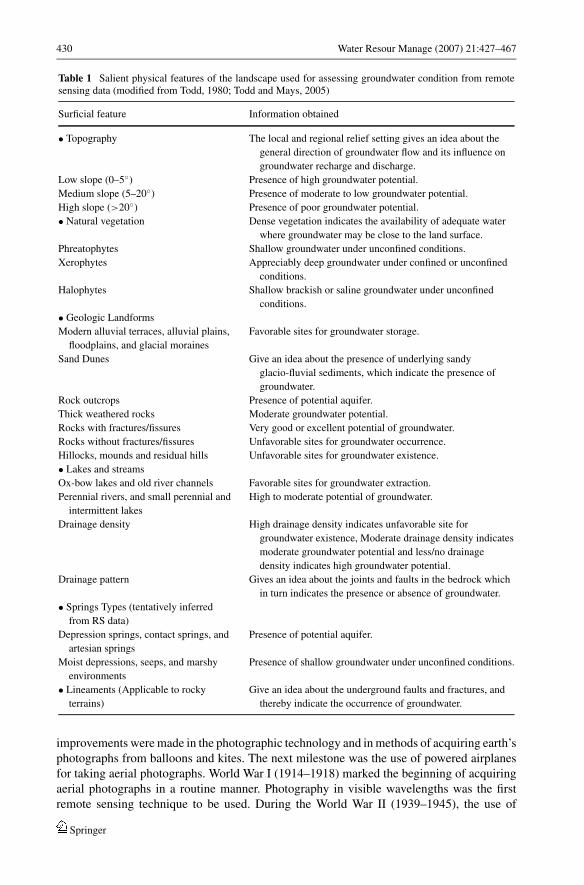
The important physical features of the landscape which can be derived from satellite
imagery or aerial photographs and used for assessing groundwater conditions (i.e., occur-
rence, depth, flow patterns, quantity, or quality) under a variety of hydrogeologic settings are
summarized in Table 1. Excellent reviews of remote sensing applications in groundwater hy-
drology are presented in Farnsworth et al. (1984), Waters et al. (1990), Engman and Gurney
(1991) and Meijerink (2000). These reviews indicate that remote sensing has been widely
used as a tool, mostly to complement standard geophysical techniques. Meijerink (2000)
recognizes the value of remote sensing in groundwater recharge-based studies and suggests
that it can significantly aid to the conventional assessment and modeling techniques.
The geographic information system (GIS) has emerged as an effective tool for handling
spatial data and decision making in several areas including engineering and environmental
fields (Stafford, 1991; Goodchild, 1993). Remotely sensed data are one of the main sources
for providing information on land and water related subjects. These data being digital in
nature, can be efficiently interpreted and analyzed using various kinds of software packages
(e.g., PCI, ENVI, ERDAS IMAGINE, etc.). It is easy to feed such information into a GIS
environment for integration with other types of data and then do analyses (Faust et al.,1991; Hinton, 1996). The combined use of remote sensing and GIS is a valuable tool for
the analysis of voluminous hydrogeologic data and for the simulation modeling of complex
subsurface flow and transport processes under saturated and unsaturated conditions (e.g.,
Watkins et al., 1996; Loague and Corwin, 1998; Gogu et al., 2001; Gossel et al., 2004).
These functions allow mainly overlay or index operations, but new GIS functions that are
available or under development could further support the requirements of process-based
approaches for analyzing subsurface phenomena (Gogu et al., 2001). Undoubtedly, the GIS
technology allows for swift organization, quantification, and interpretation of a large volume
of hydrologic and hydrogeologic data with computer accuracy and minimal risk of human
errors.
Unlike surface water hydrology, the applications of remote sensing (RS) and GIS tech-
niques in groundwater hydrology have received only cursory treatment and are less docu-
mented. Furthermore, the roles of RS and GIS in groundwater hydrology have been reported
separately in the past and a combined treatise with comprehensive reviews is not reported to
date. Therefore, in the present paper, an attempt has been made to highlight remote sensing
and GIS technologies as well as to present a state-of-the-art review on the application of
these two emerging techniques in groundwater hydrology. Such up-to-date and systematic
information will be of great importance for the researchers, practicing hydrogeologists and
the concerned decision makers, particularly for new researchers of this field.
2. Overview of remote sensing technology
2.1. Historical perspective
The use of photography to record an aerial view of the earth’s surface dates back to 1858,
which was the starting point in the history of remote sensing. In succeeding years, numerous
Springer
430 Water Resour Manage (2007) 21:427–467
Table 1 Salient physical features of the landscape used for assessing groundwater condition from remotesensing data (modified from Todd, 1980; Todd and Mays, 2005)
Surficial feature Information obtained
• Topography The local and regional relief setting gives an idea about the
general direction of groundwater flow and its influence on
groundwater recharge and discharge.
Low slope (0–5◦) Presence of high groundwater potential.
Medium slope (5–20◦) Presence of moderate to low groundwater potential.
High slope (>20◦) Presence of poor groundwater potential.
• Natural vegetation Dense vegetation indicates the availability of adequate water
where groundwater may be close to the land surface.
Phreatophytes Shallow groundwater under unconfined conditions.
Xerophytes Appreciably deep groundwater under confined or unconfined
conditions.
Halophytes Shallow brackish or saline groundwater under unconfined
conditions.
• Geologic Landforms
Modern alluvial terraces, alluvial plains,
floodplains, and glacial moraines
Favorable sites for groundwater storage.
Sand Dunes Give an idea about the presence of underlying sandy
glacio-fluvial sediments, which indicate the presence of
groundwater.
Rock outcrops Presence of potential aquifer.
Thick weathered rocks Moderate groundwater potential.
Rocks with fractures/fissures Very good or excellent potential of groundwater.
Rocks without fractures/fissures Unfavorable sites for groundwater occurrence.
Hillocks, mounds and residual hills Unfavorable sites for groundwater existence.
• Lakes and streams
Ox-bow lakes and old river channels Favorable sites for groundwater extraction.
Perennial rivers, and small perennial and
intermittent lakes
High to moderate potential of groundwater.
Drainage density High drainage density indicates unfavorable site for
groundwater existence, Moderate drainage density indicates
moderate groundwater potential and less/no drainage
density indicates high groundwater potential.
Drainage pattern Gives an idea about the joints and faults in the bedrock which
in turn indicates the presence or absence of groundwater.
• Springs Types (tentatively inferred
from RS data)
Depression springs, contact springs, and
artesian springs
Presence of potential aquifer.
Moist depressions, seeps, and marshy
environments
Presence of shallow groundwater under unconfined conditions.
• Lineaments (Applicable to rocky
terrains)
Give an idea about the underground faults and fractures, and
thereby indicate the occurrence of groundwater.
improvements were made in the photographic technology and in methods of acquiring earth’s
photographs from balloons and kites. The next milestone was the use of powered airplanes
for taking aerial photographs. World War I (1914–1918) marked the beginning of acquiring
aerial photographs in a routine manner. Photography in visible wavelengths was the first
remote sensing technique to be used. During the World War II (1939–1945), the use of
Springer

Water Resour Manage (2007) 21:427–467 431
electromagnetic (EM) spectrum was extended from almost exclusive emphasis on the visible
spectrum to its other regions, most notably the infrared and microwave regions (Campbell,
1996). The postwar era saw the continuation of trends set in motion by wartime research. The
1960s saw a series of rapid developments in rapid sequence. It was in this context the term
“remote sensing” was coined by Evelyn Pruitt, a scientist working for the US Office of Naval
Research, when she recognized that the widely used term “aerial photography” no longer
accurately described the many forms of imagery collected using radiations outside the visible
region of the EM spectrum (Campbell, 1996). In succeeding years, several remote sensing
satellites were launched for various purposes and of various resolutions, which provided
a new dimension to the remote sensing technology. Now, most common remote sensing
systems operate in one or several of the visible, infrared, or microwave portions of the EM
spectrum.
The series of satellites now known as LANDSAT (Land Space Application Technology)
launched by the US evolved in concept from the photographic observations of the early
Mercury and Gemini orbital flights. Data from those manned earth orbital flights indicated
the practicality of observing from space orbits what is broadly referred to as “earth re-
sources”. These observations and the thoughts they generated led to the NASA (National
Aeronautic and Space Agency of the US) satellite program that developed the first satellite
of the world called “Earth Resources Technology Satellite” (ERTS), which was launched
in July 1972; it was later on renamed “Landsat-1” and the latest satellite in this series is
Landsat-7 launched in 1999. Thereafter, the satellites were also launched by other countries
such as former USSR, Japan, European Space Agency (ESA), India, France and Canada
as well as China and Brazil. With the advancement of technologies, the nature of remote
sensing itself has changed during past few decades from a relatively qualitative art relying
on inference for information to a quantitative science capable of measuring system states in
some cases. Thus, extensive improvements in the field of remote sensing have been made
and it is still developing as an exploratory science to meet the growing challenges of the
world.
2.2. Defining remote sensing
Remote sensing (RS) can be defined as the observation of targets or processes from a dis-
tance (without physical contact), in contrast to in situ measurements wherein measuring
devices are in touch or immersed in the observed system and/or process. This is a broad
definition, but this term usually refers to the gathering and processing of information about
earth’s environment, particularly its natural and cultural resources, through the use of pho-
tographs and related data acquired from an aircraft or a satellite (Simonett, 1983). Thus,
remote sensing is not just a data-collection process; rather it also includes data analysis:
the methods and processes of extracting meaningful spatial information from the remotely
sensed data for direct input to the geographic information system. Remote sensing tech-
niques are divided into types: “active” and “passive” remote sensing depending upon the
source of electromagnetic energy sensed (Lillesand and Kiefer, 2000). In the passive remote
sensing, naturally emitted energy of the target is measured, while in the active remote sens-
ing artificially generated signals are transmitted and the proportion of the return signal is
measured. Conventional aerial photography and the satellite remote sensing instruments that
obtain pictures of visible, near-infrared (NIR) and thermal infrared (TIR) energy belong to
passive remote sensing techniques, while the radar and lidar belong to active remote sensing
techniques.
Springer
432 Water Resour Manage (2007) 21:427–467
2.3. Components of remote sensing technology
There are four basic components of radiation-based remote sensing systems: energy source(Sun, Radar), transmission path (atmosphere, vegetation canopy), target (subject of any
observation), and remote sensors/satellites (detection systems). Each of these components
plays an important role in controlling what we can measure about the earth’s surface (Engman
and Gurney, 1991). A brief description of remote sensors and satellites, which constitute the
heart of remote sensing technology, is provided below.
2.3.1. Remote sensors
Sensors provide the information in a specific spectral band, e.g., visible, infrared, near-
infrared, mid-infrared, microwave, etc. Sensors are usually classified based on the portion of
EM spectrum covered (Schultz, 1988). Careful matching of the sensor to the problem can
ensure that the results of the study will be useful and easily quantifiable (Engman and Gurney,
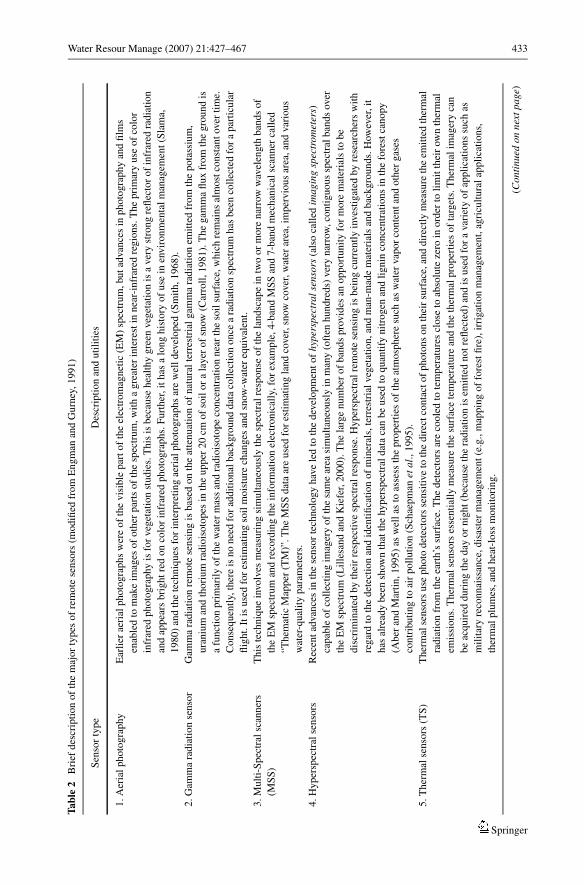
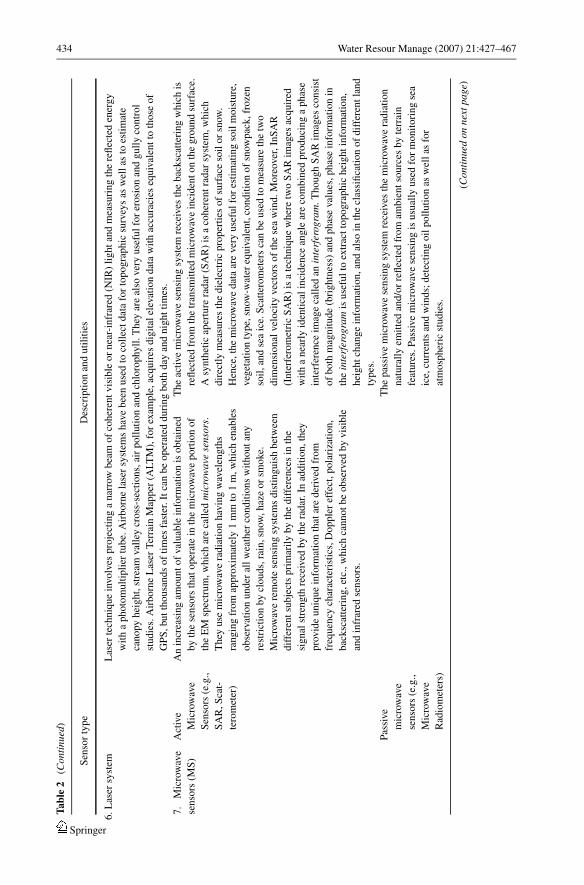
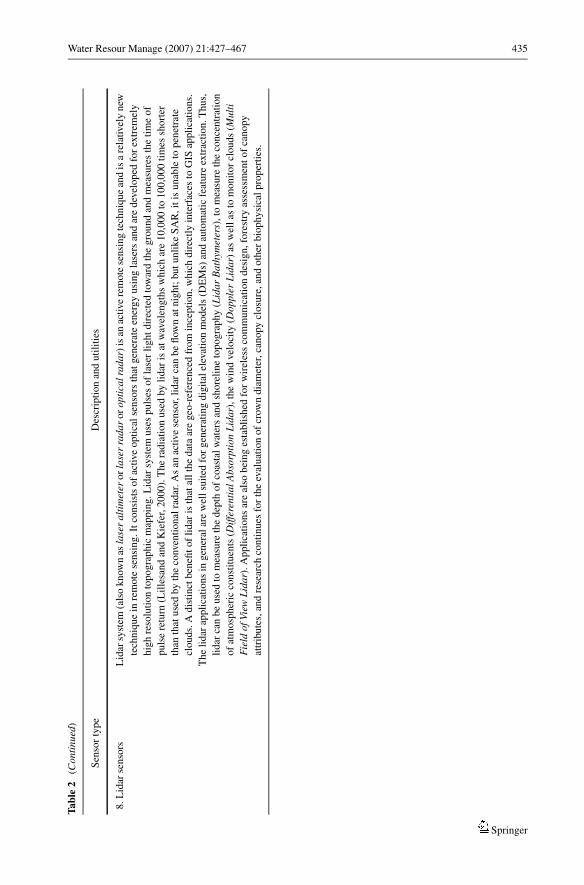
1991). A summary of major remote sensors is presented in Table 2. It is apparent from this
table that different sensors can provide unique information about properties of the earth’s
surface or shallow layers of the earth. A general advantage of microwave sensors as opposed
to visible and infrared ones is that observations can be made under cloudy conditions. Also,
measurements are not dependent on solar illumination and can be made at any time of the day
or night. Instruments can be mounted on trucks, aircraft and spacecraft for repetitive large-
area observations (Jackson, 2002). Interested readers are referred to Jackson et al. (1999)
and Jackson (2002) for the details about the application of microwave remote sensing in
soil hydrology. Overall, it can be inferred from Table 2 that the synergistic interactions of
multiple sensors using various principles and technologies can help improve our knowledge
and gain new insights about the earth, its resources and the environment.
2.3.2. Satellite systems
At present, there are a large number of satellites for observing the earth and atmospheric
features. According to their purpose, the satellite systems can be broadly divided into two
groups: earth resources satellites and environmental satellites (i.e., meteorological satellites,
ocean monitoring satellites, and earth observing satellites). The first group of satellite systems
observes the same area of the earth relatively infrequently (in the order of several days) but
with relatively high spatial resolutions, and provides the mapping of terrestrial features
and conditions. In contrast, environmental satellite systems observe frequently (in the order
of hours) but with relatively low spatial resolutions, and provide information on weather
conditions and large-scale surface phenomena.
Some important earth resources satellite systems of the world are Landsat (USA), OKEAN
(Russia), SPOT (France), IRS (India), ERS (ESA and Canada), JERS and ADEOS (Japan),
RADARSAT (Canada), and CBERS (China and Brazil), which provided or are providing a
variety of precious information at different spatial, spectral, radiometric, and temporal resolu-
tions (Simonett, 1983; Jensen, 2000). The NOAA series of environmental satellites have been
providing since 1978 information useful for hydrologic, oceanographic and meteorologic
studies in 5 spectral bands with a 1.1 km spatial resolution. Other meteorological satellites
are Meteosat (ESA), GOES (USA), GMS (Japan), DMSP (USA), and INSAT (India), among
others. Space Information-2 (SPIN-2) of Russia (2-m panchromatic resolution), OrbView-
3 of USA (first commercial high resolution satellite providing 1-m panchromatic and 4-m
multi-spectral resolution), IKONOS-2 of USA (1-m panchromatic and 4-m multi-spectral
Springer
Water Resour Manage (2007) 21:427–467 433
Tabl
e2
Bri
efd
escr
ipti
on
of
the
maj
or
typ
eso
fre
mo
tese
nso
rs(m
od
ified
fro
mE
ng
man
and
Gu
rney
,1
99
1)
Sen
sor
typ
eD
escr
ipti
on
and
uti
liti
es
1.
Aer
ial
ph
oto
gra
phy
Ear
lier
aeri
alp
ho
tog
rap
hs
wer
eo
fth
ev
isib
lep
art
of
the
elec
tro
mag
net
ic(E
M)
spec
tru
m,bu
tad
van
ces
inp
ho
tog
rap
hy
and
film
s
enab
led
tom
ake
imag
eso
fo
ther
par
tso
fth
esp
ectr
um
,w
ith
ag
reat
erin
tere
stin
nea
r-in
frar
edre
gio
ns.
Th
ep
rim
ary
use
of
colo
r
infr
ared
ph
oto
gra
phy
isfo
rveg
etat
ion
stu
die
s.T
his
isb
ecau
seh
ealt
hy
gre
enveg
etat
ion
isa
ver
yst
ron
gre
flec
tor
of
infr
ared
rad
iati
on
and
app
ears
bri
gh
tre
do
nco
lor
infr
ared
ph
oto
gra
ph
s.F
urt
her
,it
has
alo
ng
his
tory
of
use
inen
vir
on
men
tal
man
agem
ent
(Sla
ma,
19
80
)an
dth
ete
chn
iqu
esfo
rin
terp
reti
ng
aeri
alp
ho
tog
rap
hs
are
wel
ld
evel
op
ed(S
mit
h,1
96
8).
2.
Gam
ma
rad
iati
on
sen
sor
Gam
ma
rad
iati
on
rem
ote
sen
sin
gis
bas
edo
nth
eat
ten
uat
ion
of
nat
ura
lte
rres
tria
lg
amm
ara
dia
tio
nem
itte
dfr
om
the
po
tass
ium
,
ura
niu
man
dth
ori
um
rad
iois
oto
pes
inth
eu
pp
er2
0cm
of
soil
or
ala
yer
of
snow
(Car
roll
,1
98
1).
Th
eg
amm
afl
ux
fro
mth
eg
rou
nd
is
afu
nct
ion
pri
mar
ily
of
the
wat
erm
ass
and
rad
iois
oto
pe
con
cen
trat
ion
nea
rth
eso
ilsu
rfac
e,w
hic
hre
mai
ns
alm
ost
con
stan
tover
tim
e.
Co
nse
qu
entl
y,th
ere
isn
on
eed
for
add
itio
nal
bac
kg
rou
nd
dat
aco
llec
tio
no
nce
ara
dia
tio
nsp
ectr
um
has
bee
nco
llec
ted
for
ap
arti
cula
r
flig
ht.
Itis
use
dfo
res
tim
atin
gso
ilm
ois
ture
chan
ges
and
snow
-wat
ereq
uiv
alen
t.
3.
Mu
lti-
Sp
ectr
alsc
ann
ers
(MS
S)
Th
iste
chn
iqu
ein
volv
esm
easu
rin
gsi
mu
ltan
eou
sly
the
spec
tral
resp
on
seo
fth
ela
nd
scap
ein
two
or
mo
ren
arro
ww
avel
eng
thb
and
so
f
the
EM
spec
tru
man
dre
cord
ing
the
info
rmat
ion
elec
tro
nic
ally
,fo
rex
amp
le,4
-ban
dM
SS
and
7-b
and
mec
han
ical
scan
ner
call
ed
“Th
emat
icM
app
er(T
M)”
.T
he
MS
Sd
ata
are
use
dfo
res
tim
atin
gla
nd
cover
,sn
owco
ver
,w
ater
area
,im
per
vio
us
area
,an
dva
rio
us
wat
er-q
ual
ity
par
amet
ers.
4.
Hy
per
spec
tral
sen
sors
Rec
ent
adva
nce
sin
the
sen
sor
tech
no
log
yh
ave
led
toth
ed
evel
op
men
to
fhy
pers
pect
rals
enso
rs(a
lso
call
edim
agin
gsp
ectr
omet
ers)
cap
able
of
coll
ecti
ng
imag
ery
of
the
sam
ear
easi
mu
ltan
eou
sly
inm
any
(oft
enh
un
dre
ds)
ver
yn
arro
w,co
nti
gu
ou
ssp
ectr
alb
and
sover
the
EM
spec
tru
m(L
ille
san
dan
dK
iefe
r,2
00
0).
Th
ela
rge
nu
mb
ero
fb
and
sp
rov
ides
ano
pp
ort
un
ity
for
mo
rem
ater
ials
tob
e
dis
crim
inat
edb
yth
eir
resp
ecti
ve
spec
tral
resp
on
se.H
yp
ersp
ectr
alre
mo
tese
nsi
ng
isb
ein
gcu
rren
tly
inves
tigat
edb
yre
sear
cher
sw
ith
reg
ard
toth
ed
etec
tio
nan
did
enti
fica
tio
no
fm
iner
als,
terr
estr
ial
veg
etat
ion
,an
dm
an-m
ade
mat
eria
lsan
db
ack
gro
un
ds.
How
ever
,it
has
alre
ady
bee
nsh
own
that
the
hy
per
spec
tral
dat
aca
nb
eu
sed
toq
uan
tify
nit
rog
enan
dli
gn
inco
nce
ntr
atio
ns
inth
efo
rest
can
opy
(Aber
and
Mar
tin,1995)
asw
ell
asto
asse
ssth
epro
per
ties
of
the
atm
osp
her
esu
chas
wat
erva
por
conte
nt
and
oth
ergas
es
con
trib
uti
ng
toai
rp
oll
uti
on
(Sch
aep
man
etal
.,1
99
5).
5.
Th
erm
alse
nso
rs(T
S)
Th
erm
alse
nso
rsu
sep
ho
tod
etec
tors
sen
siti
ve
toth
ed
irec
tco
nta
cto
fp
ho
ton
so
nth
eir
surf
ace,
and
dir
ectl
ym
easu
reth
eem
itte
dth
erm
al
rad
iati
on
fro
mth
eea
rth
’ssu
rfac
e.T
he
det
ecto
rsar
eco
ole
dto
tem
per
atu
res
clo
seto
abso
lute
zero
ino
rder
toli
mit
thei
row
nth
erm
al
emis
sio
ns.
Th
erm
alse
nso
rses
sen
tial
lym
easu
reth
esu
rfac
ete
mp
erat
ure
and
the
ther
mal
pro
per
ties
of
targ
ets.
Th
erm
alim
ager
yca
n
be
acq
uir
edd
uri
ng
the
day
or
nig
ht
(bec
ause
the
rad
iati
on
isem
itte
dn
ot
refl
ecte
d)
and
isu
sed
for
ava
riet
yo
fap
pli
cati
on
ssu
chas
mil
itar
yre
con
nai
ssan
ce,d
isas
ter
man
agem
ent
(e.g
.,m
app
ing
of
fore
stfi
re),
irri
gat
ion
man
agem
ent,
agri
cult
ura
lap
pli
cati
on
s,
ther
mal
plu
mes
,an
dh
eat-
loss
mo
nit
ori
ng
.
(Con
tinu
edon
next
page
)
Springer
434 Water Resour Manage (2007) 21:427–467Ta
ble
2(C
onti
nued
)
Sen
sor
typ
eD
escr
ipti
on
and
uti
liti
es
6.
Las
ersy
stem
Las
erte
chn
iqu
ein
volv
esp
roje
ctin
ga
nar
row
bea
mo
fco
her
ent
vis
ible
or
nea
r-in
frar
ed(N
IR)
lig
ht
and
mea
suri
ng
the
refl
ecte
den
erg
y
wit
ha
ph
oto
mu
ltip
lier
tub
e.A
irb
orn
ela
ser
syst
ems
hav
eb
een
use
dto
coll
ect
dat
afo
rto
po
gra
ph
icsu
rvey
sas
wel
las
toes
tim
ate
can
opy
hei
gh
t,st
ream
vall
eycr
oss
-sec
tio
ns,
air
po
llu
tio
nan
dch
loro
phy
ll.T
hey
are
also
ver
yu
sefu
lfo
rer
osi
on
and
gu
lly
con
tro
l
stu
die
s.A
irb
orn
eL
aser
Ter
rain
Map
per
(AL
TM
),fo
rex
amp
le,ac
qu
ires
dig
ital
elev
atio
nd
ata
wit
hac
cura
cies
equ
ival
ent
toth
ose
of
GP
S,bu
tth
ou
san
ds
of
tim
esfa
ster
.It
can
be
op
erat
edd
uri
ng
bo
thd
ayan
dn
igh
tti
mes
.
7.
Mic
row
ave
sen
sors
(MS
)
Act
ive
Mic
row
ave
Sen
sors
(e.g
.,
SA
R,S
cat-
tero
met
er)
An
incr
easi
ng
amo
un
to
fva
luab
lein
form
atio
nis
ob
tain
ed
by
the
sen
sors
that
op
erat
ein
the
mic
row
ave
po
rtio
no
f
the
EM
spec
tru
m,w
hic
har
eca
lled
mic
row
ave
sens
ors.
Th
eyu
sem
icro
wav
era
dia
tio
nh
avin
gw
avel
eng
ths
ran
gin
gfr
om
app
rox
imat
ely
1m
mto
1m
,w
hic
hen
able
s
ob
serv
atio
nu
nd
eral
lw
eath
erco
nd
itio
ns
wit
ho
ut
any
rest
rict
ion
by
clo
ud
s,ra
in,sn
ow,
haz
eo
rsm
oke.
Mic
row
ave
rem
ote
sen
sin
gsy
stem
sd
isti
ng
uis
hb
etw
een
dif
fere
nt
sub
ject
sp
rim
aril
yb
yth
ed
iffe
ren
ces
inth
e
sig
nal
stre
ng
thre
ceiv
edb
yth
era
dar
.In
add
itio
n,th
ey
pro
vid
eu
niq
ue
info
rmat
ion
that
are
der
ived
fro
m
freq
uen
cych
arac
teri
stic
s,D
op
ple
ref
fect
,p
ola
riza
tio
n,
bac
ksc
atte
rin
g,et
c.,w
hic
hca
nn
ot
be
ob
serv
edb
yv
isib
le
and
infr
ared
sen
sors
.
Th
eac
tive
mic
row
ave
sen
sin
gsy
stem
rece
ives
the
bac
ksc
atte
rin
gw
hic
his
refl
ecte
dfr
om
the
tran
smit
ted
mic
row
ave
inci
den
to
nth
eg
rou
nd
surf
ace.
Asy
nth
etic
aper
ture
rad
ar(S
AR
)is
aco
her
ent
rad
arsy
stem
,w
hic
h
dir
ectl
ym
easu
res
the
die
lect
ric
pro
per
ties
of
surf
ace
soil
or
snow
.
Hen
ce,th
em
icro
wav
ed
ata
are
ver
yu
sefu
lfo
res
tim
atin
gso
ilm
ois
ture
,
veg
etat
ion
typ
e,sn
ow-w
ater
equ
ival
ent,
con
dit
ion
of
snow
pac
k,fr
oze
n
soil
,an
dse
aic
e.S
catt
ero
met
ers
can
be
use
dto
mea
sure
the
two
dim
ensi
on
alvel
oci
tyvec
tors
of
the
sea
win
d.M
ore
over
,In
SA
R
(In
terf
ero
met
ric
SA
R)
isa
tech
niq
ue
wh
ere
two
SA
Rim
ages
acq
uir
ed
wit
ha
nea
rly
iden
tica
lin
cid
ence
ang
lear
eco
mb
ined
pro
du
cin
ga
ph
ase
inte
rfer
ence
imag
eca
lled
anin
terf
erog
ram
.Th
ou
gh
SA
Rim
ages
con
sist
of
bo
thm
agn
itu
de
(bri
gh
tnes
s)an
dp
has
eva
lues
,p
has
ein
form
atio
nin
the
inte
rfer
ogra
mis
use
ful
toex
trac
tto
po
gra
ph
ich
eig
ht
info
rmat
ion
,
hei
gh
tch
ang
ein
form
atio
n,an
dal
soin
the
clas
sifi
cati
on
of
dif
fere
nt
lan
d
typ
es.
Pas
sive
mic
row
ave
sen
sors
(e.g
.,
Mic
row
ave
Rad
iom
eter
s)
Th
ep
assi
ve
mic
row
ave
sen
sin
gsy
stem
rece
ives
the
mic
row
ave
rad
iati
on
nat
ura
lly
emit
ted
and
/or
refl
ecte
dfr
om
amb
ien
tso
urc
esb
yte
rrai
n
feat
ure
s.P
assi
ve
mic
row
ave
sen
sin
gis
usu
ally
use
dfo
rm
on
ito
rin
gse
a
ice,
curr
ents
and
win
ds;
det
ecti
ng
oil
po
llu
tio
nas
wel
las
for
atm
osp
her
icst
ud
ies.
(Con
tinu
edon
next
page
)
Springer
Water Resour Manage (2007) 21:427–467 435
Tabl
e2
(Con
tinu
ed)
Sen
sor
typ
eD
escr
ipti
on
and
uti
liti
es
8.
Lid
arse
nso
rsL
idar
syst
em(a
lso
kn
own
asla
ser
alti
met
ero
rla
ser
rada
ro
rop
tica
lrad
ar)
isan
acti
ve
rem
ote
sen
sin
gte
chn
iqu
ean
dis
are
lati
vel
yn
ew
tech
niq
ue
inre
mo
tese
nsi
ng
.It
con
sist
so
fac
tive
op
tica
lse
nso
rsth
atg
ener
ate
ener
gy
usi
ng
lase
rsan
dar
ed
evel
op
edfo
rex
trem
ely
hig
hre
solu
tio
nto
po
gra
ph
icm
app
ing
.L
idar
syst
emu
ses
pu
lses
of
lase
rli
gh
td
irec
ted
tow
ard
the
gro
un
dan
dm
easu
res
the
tim
eo
f
pu
lse
retu
rn(L
ille
san
dan
dK
iefe
r,2
00
0).
Th
era
dia
tio
nu
sed
by
lid
aris
atw
avel
eng
ths
wh
ich
are
10
,00
0to
10
0,0
00
tim
essh
ort
er
than
that
use
db
yth
eco
nven
tio
nal
rad
ar.
As
anac
tive
sen
sor,
lid
arca
nb
efl
own
atn
igh
t;bu
tu
nli
ke
SA
R,it
isu
nab
leto
pen
etra
te
clo
ud
s.A
dis
tin
ctb
enefi
to
fli
dar
isth
atal
lth
ed
ata
are
geo
-ref
eren
ced
fro
min
cep
tio
n,w
hic
hd
irec
tly
inte
rfac
esto
GIS
app
lica
tio
ns.
Th
eli
dar
app
lica
tio
ns
ing
ener
alar
ew
ell
suit
edfo
rg
ener
atin
gd
igit
alel
evat
ion
mo
del
s(D
EM
s)an
dau
tom
atic
feat
ure
extr
acti
on
.T
hu
s,
lid
arca
nb
eu
sed
tom
easu
reth
ed
epth
of
coas
tal
wat
ers
and
sho
reli
ne
top
og
rap
hy
(Lid
arB
athy
met
ers)
,to
mea
sure
the
con
cen
trat
ion
of
atm
osp
her
icco
nst
itu
ents
(Diff
eren
tial
Abs
orpt
ion
Lid
ar),
the
win
dvel
oci
ty(D
oppl
erL
idar
)as
wel
las
tom
on
ito
rcl
ou
ds
(Mul
tiF
ield
ofVi
ewL
idar
).A
pp
lica
tio
ns
are
also
bei
ng
esta
bli
shed
for
wir
eles
sco
mm
un
icat
ion
des
ign
,fo
rest
ryas
sess
men
to
fca
no
py
attr
ibu
tes,
and
rese
arch
con
tin
ues
for
the
eval
uat
ion
of
crow
nd
iam
eter
,ca
no
py
clo
sure
,an
do
ther
bio
phy
sica
lp
rop
erti
es.
Springer

436 Water Resour Manage (2007) 21:427–467
resolution), and QuickBird-2 of USA (the highest spatial resolution satellite system to date:
61-cm panchromatic and 2.5-m multi-spectral resolution) are prominent high resolution earth
resources satellites.
Another increasing amount of valuable environmental and resource information is being
acquired by the satellites on-board microwave sensors, for instance, USA’s DMSP-SSM/I,
India’s Oceansat-1, and the AMSR and TRMM satellite systems of USA and Japan besides
the several aircraft-based active and passive microwave remote sensing systems (Jackson,
2002). Furthermore, important earth observing satellites are CHAMP (Germany), GRACE
(USA-Germany) and GOCE (ESA). The CHAMP satellite system (launched by Germany in
July 2000 and scheduled to fly for 5 years) indirectly measures large-scale gravity features.
The GRACE (launched by NASA-DLR in March 2002 and scheduled to fly for 5 years)
and GOCE (scheduled to be launched by ESA in 2006) satellite systems are designed for
making detailed measurements of earth’s gravity field with high accuracy, which will lead to
the discoveries about gravity and earth’s natural systems.
2.4. Data extraction from satellite imagery
Once the required satellite images are purchased in digital form from a vendor of satellite
images, the next step is to process the images for extracting the desired spatial and thematic
information; satellite images without processing are not of much use, especially for scientific
studies. This complex processing is done with the help of a computer by using image pro-
cessing software packages and is known as digital image processing (Lillesand and Kiefer,
2000). User-friendly image processing software packages are usually available for PCs and
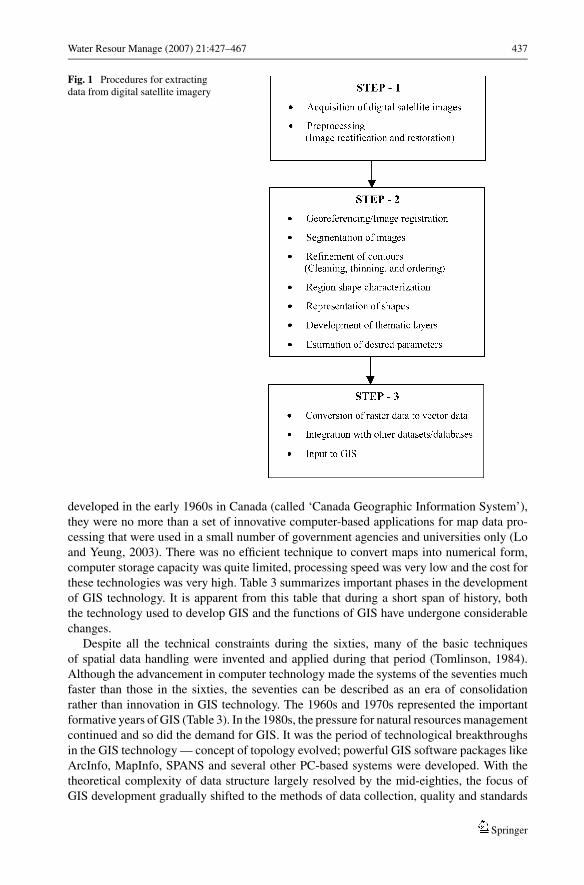
workstations, and can interactively extract data from satellite imagery. Figure 1 illustrates
the major three steps for extracting data from digital satellite images. Clearly, several oper-
ations are needed for extracting the required data and/or information. Since in most cases
the data obtained from satellite systems are input to a GIS for analyses, modeling as well as
for preparing different maps, a conversion from raster data to vector data is necessary. Most
digital image processing software and advanced GIS software packages can perform raster-
to-vector conversion. This conversion, however, will not be required if the GIS technology is
able to process digital images and handle both vector and raster data (Lo and Yeung, 2003).
The details of the procedures for extracting data from satellite images can be found in the
books/manuals on digital image processing or image interpretation.
3. Overview of GIS technology
3.1. Historical perspective
The history of using computers for mapping and spatial analysis shows that there have been
parallel developments in automated data capture, data analysis and presentation in several
broadly related fields viz., cadastral and topographical mapping, thematic cartography, civil
engineering, geography, soil science, mathematical studies of spatial variation, surveying
and photogrammetry, rural and urban planning, utility networks, and remote sensing and im-
age analysis (DeMers, 2000; Clarke, 2001; Lo and Yeung, 2003). Essentially all disciplines
are attempting the same kind of operation: to develop a powerful set of tools for collect-
ing, sorting, retrieving, transforming and displaying real-world spatial data for particular
purposes. This set of tools constitutes a ‘Geographic Information System (GIS)’. The first
geographic information system (also known as Geographical Information System) when first
Springer
Water Resour Manage (2007) 21:427–467 437
Fig. 1 Procedures for extractingdata from digital satellite imagery
developed in the early 1960s in Canada (called ‘Canada Geographic Information System’),
they were no more than a set of innovative computer-based applications for map data pro-
cessing that were used in a small number of government agencies and universities only (Lo
and Yeung, 2003). There was no efficient technique to convert maps into numerical form,
computer storage capacity was quite limited, processing speed was very low and the cost for
these technologies was very high. Table 3 summarizes important phases in the development
of GIS technology. It is apparent from this table that during a short span of history, both
the technology used to develop GIS and the functions of GIS have undergone considerable
changes.
Despite all the technical constraints during the sixties, many of the basic techniques
of spatial data handling were invented and applied during that period (Tomlinson, 1984).
Although the advancement in computer technology made the systems of the seventies much
faster than those in the sixties, the seventies can be described as an era of consolidation
rather than innovation in GIS technology. The 1960s and 1970s represented the important
formative years of GIS (Table 3). In the 1980s, the pressure for natural resources management
continued and so did the demand for GIS. It was the period of technological breakthroughs
in the GIS technology — concept of topology evolved; powerful GIS software packages like
ArcInfo, MapInfo, SPANS and several other PC-based systems were developed. With the
theoretical complexity of data structure largely resolved by the mid-eighties, the focus of
GIS development gradually shifted to the methods of data collection, quality and standards
Springer

438 Water Resour Manage (2007) 21:427–467Ta
ble
3S
um
mar
yo
fth
eev
olu
tio
no
fG
ISte
chn
olo
gy
(aft
erL
oan
dY
eun
g,2
00
3)
Pri
mar
yst
ages
of
dev
elo
pm
ent
and
tim
efr
ames
Dev
elo
pm
ent
Fo
rmat
ive
yea
rsM
atu
rin
gte
chn
olo
gy
GI
Infr
astr
uct
ure
asp
ects
(19
60
–1
98
0)
(19
80
-Mid
-19
90
s)(M
id-1
99
0s-
Pre
sen
t)
Tec
hn
ical
env
iro
nm
ent
•Mai
nfr
ame
com
pu
ter
•Mai
nfr
ame
and
min
ico
mp
ute
rs•W
ork
stat
ion
san
dP
Cs
•Pro
pri
etar
yso
ftw
are
•Geo
-rel
atio
nal
dat
ast
ruct
ure
•Net
wo
rk/I
nte
rnet
•Pro
pri
etar
yd
ata
stru
ctu
re•G
rap
hic
alu
ser
inte
rfac
e•O
pen
syst
ems
des
ign
•Mai
nly
rast
erfo
rm•N
ewd
ata
acq
uis
itio
nte
chn
olo
gie
s•M
ult
imed
ia
(GP
S,R
S,R
edefi
nit
ion
of
dat
um
)•D
ata
inte
gra
tio
n
•En
terp
rise
com
pu
tin
g
•Ob
ject
-rel
atio
nal
dat
am
od
el
Maj
or
use
rs•G
over
nm
ent
•Gover
nm
ent
•Gover
nm
ent
•Uti
liti
es•U
niv
ersi
ties
•Un
iver
siti
esan
dsc
ho
ols
•Mil
itar
y•U
tili
ties
•Bu
sin
ess
•Bu
sin
ess
•Uti
liti
es
•Mil
itar
y•M
ilit
ary
•Gen
eral
pu
bli
c
Maj
or
app
lica
tio
nar
eas
•Lan
dan
dre
sou
rce
man
agem
ent
•Lan
dan
dre
sou
rce
man
agem
ent
•Lan
dan
dre
sou
rce
man
agem
ent
•Cen
sus
•Cen
sus
•Cen
sus
•Su
rvey
ing
and
map
pin
g•S
urv
eyin
gan
dm
app
ing
•Su
rvey
ing
and
map
pin
g
•Fac
ilit
ies
man
agem
ent
•Fac
ilit
ies
man
agem
ent
•Mar
ket
anal
ysi
s•M
arket
anal
ysi
s
•Uti
liti
es
•Geo
gra
ph
icd
ata
bro
wsi
ng
Springer

Water Resour Manage (2007) 21:427–467 439
as well as data analysis and database organization. The development of GIS technology
was greatly accelerated by the phenomenal growth of computer technology in the 1990s
and GIS became multi-platform applications. The increasing access to computers coupled
with the urgent need for effective geographic data management pushed the use of GIS to a
new height. It is usually agreed that by the mid-nineties, GIS became relatively mature in
terms of both technology and applications (Table 3). Since the mid-nineties, the development
of GIS has entered a new era that can be aptly called the “Age of Geographic Information
Infrastructure” (Lo and Yeung, 2003). The proliferation of GIS gradually led to the formation
of a specialized sector in the traditional computer industry — one of the fastest growing
sectors of the computer industry. Today, GIS has matured into an industry of its own and
has become an important field of academic study, with increasing number of companies,
overwhelming demand in various fields, and worldwide growing GIS market and professional
organizations.
3.2. Defining geographic information system (GIS)
GIS is generally defined as a computer-assisted mapping and cartographic application, a
set of spatial-analytical tools, a type of database systems, or a field of academic study (Lo
and Yeung, 2003). In order to provide a simple working definition of GIS, the two widely-
used definitions are: (i) “GIS is a system of hardware, software, and procedures designed to
support the capture, management, manipulation, analysis, modeling, and display of spatially
referenced data for solving complex planning and management problems” (Rhind, 1989); and
(ii) “GIS is a computer system capable of assembling, storing, manipulating, and displaying
geographically referenced information” (USGS, 1997). The basic ideas contained in these
two definitions have been adopted in GIS textbooks such as by Burrough (1986), Aronoff
(1989), DeMers (2000) and Clarke (2001). Simply put, GIS is a set of computer-based
systems for managing geographic data (i.e., spatial data having the reference to geographic
space and the representation at geographic scale) and using these data to solve various spatial
problems.
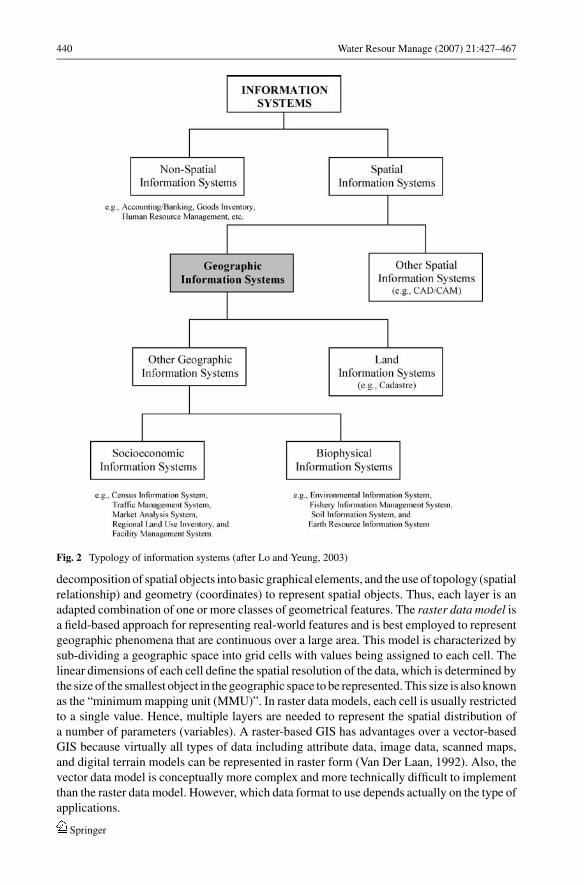
Figure 2 shows the relationship between GIS and different types of information systems.
It is obvious that only those information systems which are used for processing and analyzing
geographic data can be labeled as GIS. At present, however, GIS not only represents the skills
and procedures for collecting, managing, and using geographic information, but also entails
a comprehensive body of scientific knowledge from which these skills and procedures are
developed (Lo and Yeung, 2003).
3.3. Basic concept of GIS
The geographic data can be represented in GIS as objects or fields (phenomena). In the
object approach, real-world features are represented by simple objects such as points, lines
and polygons. The objects (representing features) are characterized by geometry, topology,
and non-spatial attribute values. On the other hand, in the field approach, real-world features
are represented as fields of attribute data without defining objects. This approach provides
attribute values in any location. In GIS, the distinction between objects and fields is associated
with vector data models and raster data models (Goodchild, 1992). The vector data modelis an object-based approach for representing real-world features and is best used to represent
discrete objects. All vector data models are built on two common and interrelated concepts: the
Springer
440 Water Resour Manage (2007) 21:427–467
Fig. 2 Typology of information systems (after Lo and Yeung, 2003)
decomposition of spatial objects into basic graphical elements, and the use of topology (spatial
relationship) and geometry (coordinates) to represent spatial objects. Thus, each layer is an
adapted combination of one or more classes of geometrical features. The raster data model is
a field-based approach for representing real-world features and is best employed to represent
geographic phenomena that are continuous over a large area. This model is characterized by
sub-dividing a geographic space into grid cells with values being assigned to each cell. The
linear dimensions of each cell define the spatial resolution of the data, which is determined by
the size of the smallest object in the geographic space to be represented. This size is also known
as the “minimum mapping unit (MMU)”. In raster data models, each cell is usually restricted
to a single value. Hence, multiple layers are needed to represent the spatial distribution of
a number of parameters (variables). A raster-based GIS has advantages over a vector-based
GIS because virtually all types of data including attribute data, image data, scanned maps,
and digital terrain models can be represented in raster form (Van Der Laan, 1992). Also, the
vector data model is conceptually more complex and more technically difficult to implement
than the raster data model. However, which data format to use depends actually on the type of
applications.
Springer
Water Resour Manage (2007) 21:427–467 441
4. RS and GIS applications in groundwater hydrology
4.1. Broad scenario
As far as the remote sensing applications in groundwater hydrology is concerned, aerial
photographs, and visible and near-infrared satellite images have been used for ground-
water exploration experimentally since 1960s with only limited success (Engman and
Gurney, 1991). The absence of spectral resolution did not allow effective use in intra-
site groundwater prospecting. However, with the advent of high resolution multi-spectral
satellite sensors, the use of satellite imagery (including microwave imagery) for ground-
water prospecting dramatically increased in late 1980s (Waters et al., 1990; Engman
and Gurney, 1991; Meijernik, 2000; Jackson, 2002). The use of remote sensing tech-
nique has been proved a very cost-effective approach in prospecting and preliminary sur-
veys, because of high cost of drilling. Generally, the analysis of aerial photographs or
satellite imagery is recommended prior to ground surveys and fieldwork, because it may
eliminate areas of potentially low water-bearing strata and may also indicate promis-
ing areas for intensive field investigations (Revzon et al., 1983). It should be, how-
ever, noted that the adoption of remote sensing does not eliminate the in situ data
collection, which is still essential to verify the accuracy of remote sensing data and
their interpretation. Of course, remote sensing helps minimize the amount of field data
collection.
A review of GIS applications in hydrology and water management has been presented
by several researchers during early nineties and mid-nineties such as Zhang et al. (1990),
DeVantier and Feldman (1993), Ross and Tara (1993), Schultz (1993), Deckers and Te Stroet
(1996), and Tsihrintzis et al. (1996). These reviews indicate that GIS applications in hy-
drology and water management are essentially in a modeling dominated context. Longley
et al. (1998), on the other hand, while presenting the development of geocomputation, dis-
cuss various geoscientific applications of GIS as well as the role of geocomputation in
the development and application of GI technologies. Although the use of GIS in ground-
water modeling studies dates back to 1987, its use for surface-water modeling has been
more prevalent than for groundwater modeling because the available standardized GIS
coverages are primarily of the land surface; few standardized coverages of hydrogeologic
properties are available (Watkins et al., 1996). Watkins et al. (1996) present an excellent
overview of GIS applications in groundwater-flow modeling as well as discuss its useful-
ness and future directions. On the other hand, Pinder (2002) provides step-by-step pro-
cedures for groundwater flow and transport modeling using GIS technology. The current
status of GIS and RS applications in groundwater hydrology is presented in succeeding
sections.
A detailed survey of the past literature concerning the applications of remote sensing
and GIS techniques in studying groundwater problems was carried out. Attempts have
been made to put together all the concerned literature available in scattered locations
and in different forms. However, in the present review, the experimental and prelimi-
nary applied RS-based groundwater studies conducted from 1960 to mid-eighties (though
limited) are not included because of the inaccessibility of their original sources. Inter-
ested readers are referred to Engman and Gurney (1991) for a brief description about
such studies. Based on this comprehensive literature survey, the applications of RS and
GIS techniques in groundwater hydrology to date have been categorized into six major
groups and the case studies pertaining to each group are succinctly described in subsequent
sections.
Springer

442 Water Resour Manage (2007) 21:427–467
4.2. Exploration and assessment of groundwater resources
Rampal and Rao (1989) used MSS Landsat data of the Doddaguni area in Karnataka, India
for targeting groundwater potential zones. The groundwater targeting was dependent on the
identification and mapping of fractures, lithologic units and regional geology of the study
area. They developed computer programs to enhance images using histogram equalization,
combination and rationing of bands, and high and low-pass filtering. Using the various
enhanced images, a geological map of the area was prepared and a relationship between the
lithologic units and estimated water features was developed. The validity of the methodology
was checked and found very encouraging in classifying the study area according to the
groundwater potential.
Bobba et al. (1992), using the digital radiance Landsat data of Big Creek and Big Otter
Creek basins in southern Ontario (Canada), delineated principal groundwater regimes ac-
cording to the proximity of water table to the surface, i.e., discharge, recharge and transition
areas. They reported that during the spring, the modulating influence of groundwater on the
near-surface temperature could be detected only using the near-infrared band of the satellite
imagery. However, during summer months, the presence of phreatophytic vegetation through-
out the watershed required the visible energy band in conjunction with the near-infrared data
to affect such a classification scheme. They concluded that the digital satellite data proved
to be very useful in delineating groundwater flow systems, which are valuable input to the
hydrological modeling, non-point source modeling, and the selection of solid-waste disposal
sites.
Salama et al. (1994) used aerial photographs and Landsat (TM) data to prepare the maps
of geomorphology, geology and structures of the Salt River System of Western Australia
for classifying the units that control the mechanisms of groundwater recharge and discharge
in the area. The hydrogeologic interpretation of geomorphologic patterns and the classified
hydrogeomorphic units from the TM analysis were used to identify recharge and discharge
zones. They inferred that the permeable areas around the circular granaitic plutons and the
highly permeable areas of sand plains were good for recharge. Groundwater discharge was
primarily found along the main drainage lines, on the edge of the circular sand plains, in
depressions, and in lakes.
Kamaraju et al. (1995) evaluated the groundwater potential in West Godavari District
of A.P., India using GIS. They used the existing maps and records as input data which
were in different forms and scales, and created a GIS database using ArcInfo software. The
descriptive information was converted into “groundwater favorability index” by rating the
various groundwater-controlling characteristics according to their weightings to the output.
The groundwater potential map thus generated showed three major hydrogeologic conditions
with distinct groundwater prospects. They emphasized that the GIS technique is very time-
and cost-effective and could be employed successfully in the planning stage of a groundwater
exploration programme.
Teeuw (1995) proposed an integrated approach of remote sensing and GIS techniques
to improve the site selection of borehole drilling in the Volta basin of Northern Ghana. He
reported that the sites selected for groundwater potential based on the aerial photographs,
lineament mapping and geophysical surveys in the area were mostly failed. The very low
success rate of this initial groundwater exploration program was attributed to the difficulties
encountered at the stage of aerial photograph interpretation and lineament mapping, rather
than those at the follow-up geophysical survey stage. In order to improve the success rate
of groundwater exploration in the basin, a low-cost GIS software package “IDRISI” was
used along with the Landsat TM satellite image. It was demonstrated that unlike the single
Springer
Water Resour Manage (2007) 21:427–467 443
broad sector of the electromagnetic spectrum observed in aerial photographs, the seven-
band Landsat image produced good quality lineament maps that helped in proper delineation
of groundwater potential areas. Consequently, the success rate improved to 55% using the
integrated approach of remote sensing and GIS techniques compared to the alone use of
aerial photographs where the success rate was only 5%.
Krishnamurthy et al. (1996) used remote sensing and GIS for demarcating groundwater
potential areas in the Marudaiyar basin of Tamil Nadu, India. They prepared the maps of
lithology, landforms, lineaments and surface water bodies from the remotely sensed data, and
those of drainage density and slope from SOI (Survey of India) toposheets. These thematic
maps were integrated and analyzed using a model developed with logical conditions in a
GIS. Finally, the groundwater potential zone map thus developed was verified with field
data, which indicated a good agreement.
Sander et al. (1996) developed better well-siting strategies for the violtanian Sedimentary
basin in central Ghana using remote sensing, GPS and GIS. Remote sensing data used
were from Landsat TM, SPOT, and infrared aerial photographs. These data were interpreted
for lineament, vegetation, drainage and bedrock features to evaluate groundwater potential.
Lineaments were also examined in the field and integrated with the information from several
GPS-positioned boreholes. They integrated these data into a GIS to develop optimal strategies
for future well siting. GPS improved the spatial accuracy of various data integrated in the GIS.
They concluded that though GIS proved to be an effective integration tool for analyzing spatial
data and developing well-siting strategies, the implementation of a GIS in a groundwater
project requires careful planning to avoid costly and unnecessary data acquisition and entry.
Edet et al. (1998) applied remote sensing technique for delineating the areas expected
to be suitable for future groundwater development in the Cross River State of southeastern
Nigeria. Radar imagery and areal photographs were used to define some hydrologic and
hydrogeologic features in parts of the study area. Lineaments and drainage patterns were
analyzed using length density and frequency. The results were then used to delineate the areas
of high, medium, and low groundwater potential. They found good correlations between the
lineament and drainage patterns, lithology, water temperature, water conductivity, well yield,
transmissivity, longitudinal conductance, and the occurrence of groundwater.
Travaglia and Ammar (1998) proposed a methodology for the integration of GIS data
extracted from satellite imagery with traditionally-gathered data. Based on the analysis of
these data and selected field investigations, it was revealed that in the basaltic terrain of
southern Syria, the groundwater movement along faults and features occurred mainly due to
tectonic movements. The statistical analysis of the lineaments interpreted from the Landsat
TM data indicated two major directions of fracturing, which was considered as “open”
for groundwater storage and transmission. It was concluded that the developed methodology
could be applied in other parts of Syria as well as in other countries with similar hydrogeologic
conditions.
Goyal et al. (1999) used a multi-criteria evaluation technique (MCET) to evaluate the
inter class and inter-map dependencies for groundwater evaluation in the Rawasen and Pili
watersheds of Uttar Pradesh, India. They developed various thematic maps such as land use,
geomorphology and lineament maps from satellite images and aerial photographs. A drainage
map was prepared using the Survey of India (SOI) toposheets. The slope map was obtained
by creating DEM after interpolating spot elevation and contours in GIS. For integration, all
the maps were converted into digital formats in the GIS environment, which were then used
for the zonation of groundwater availability in the Rawasen and Pili watersheds.
Musa et al. (2000) used an integrated remote sensing and GIS system to produce various
thematic maps for classifying groundwater potential zones in Langat Basin, Malaysia. They
Springer
444 Water Resour Manage (2007) 21:427–467
used Landsat TM data, topographic map, soil map and other relevant field data for preparing
various thematic layers such as annual rainfall, lithology, lineament density, drainage density,
land use, land elevation, slope steepness and soil type, and combined all the layers using a
modified DRASTIC (Depth to water, net Recharge, Aquifer media, Soil media, Topography,
Impact of vadose zone media, and aquifer hydraulic Conductivity) model. The polygons in
each of the thematic layers were categorized depending on their suitability/relevance to the
groundwater potential, and suitable weights were assigned to them. Finally, all the thematic
layers were integrated using a groundwater potential model to derive the final layer. It was
concluded that the integrated assessment of thematic maps using a GIS-based model proved
to be the most suitable method for groundwater potential zoning in hard-rock terrains.
Based on research work in the Truyere River catchment of the Massif Central, France,
Lachassagne et al. (2001) developed a new methodology for delineating favorable prospecting
zones of a few square kilometers within basement areas of several hundred square kilome-
ters for the purpose of siting high-yield water wells. The methodology adopts a functional
approach to hard-rock aquifers using a conceptual model of the aquifer structure and of the
functioning of the main aquifer compartments: the alterites (weathered and decayed rock),
the underlying weathered-fissured zone, and the fractured bedrock. It involves an economi-
cally feasible method of mapping the thickness and spatial distribution of the alterites and the
weathered-fissured zone, on which the long-term exploitation of the water resource chiefly
depends. The potential groundwater resources were mapped by GIS multi-criteria analysis
using various parameters characterizing the structure and functioning of the aquifer. It was
concluded that the developed methodology involves a coherent process of downscaling that,
through applying methods that are increasingly precise but also increasingly costly, enables
the selection of sites with diminishing surface areas as the work advances.
Shahid and Nath (2002) analyzed the hydrogeologic data obtained from remote sensing
and surface geophysical techniques for evaluating the groundwater condition in a soft-rock
terrain of Midnapore District, West Bengal, India. The IRS LISS-II data were used for gener-
ating the thematic map of geology. Vertical electrical sounding (VES) survey was conducted
at 139 locations in the study area, and the data were interpreted using genetic algorithm and
Ridge Regression techniques. The aquifer resistivity and thickness thus obtained were used
to prepare the corresponding thematic maps. Weights were assigned to different ranges of
resistivity and thickness values based on their position on the geological map. Finally, the
weighted maps were integrated using a GIS-based aggregation method to identify ground-
water potential zones in the study area.
Singh and Prakash (2002) combined remote sensing, geophysics and GIS techniques to
demarcate groundwater potential zones in the hard-rock region of India. They prepared hydro-
geomorphological and lineament maps from IRS LISS-III data by using visual interpretation.
The topographic information was obtained from the SOI toposheets of 1:50,000 scale and TIN
was generated from elevation contours. Slope maps were prepared from TIN, and the surface
drainage maps were prepared from the toposheets and satellite data. Electrical resistivity
surveys were also conducted to investigate the lithology and the horizontal and vertical extent
of aquifer systems. A groundwater potential map was developed by integrating the relevant
layers (i.e., hydrogeomorphology, lineament, slope, drainage, and overburden thickness) in
ArcInfo GIS environment, and then assigning appropriate weights to each layer based on
their relative contribution to the existence of groundwater. The verification of the developed
groundwater potential map indicated that the demarcated groundwater potential zones are in
fair agreement with the well-yield data.
Singh et al. (2002) used remote sensing, geoelctrical and GIS techniques for groundwater
exploration in Sonebatra, Mirjapur and Chaundali districts of Uttar Pradesh, India. They used
Springer

Water Resour Manage (2007) 21:427–467 445
IRS LISS-II data for preparing hydro-geomorphological and lineament maps. The ground-
water potential was assessed through the integration of relevant layers in the ArcInfo grid
environment, which included hydro-geomorphology, slope, lineament, aquifer thickness, and
clay thickness. The generated groundwater zone map was verified with the well-yield data
and a good correlation was found.
Srivastava (2002) integrated the remote sensing data with the hydrologic data in order
to investigate subsurface details, aquifer geometry and groundwater quality in Ken Graben,
Uttar Pradesh, India. He used IRS LISS-I/II data to explore the geological, geomorphological
and structural aspects of the terrain. Buried channels and two different types of basement
depressions were identified in the study area which affected the aquifer geometry, ground-
water potential and quality. The variations in tone and texture associated with vegetation
and geological features, coupled with the inferred groundwater migration pattern in the area
enabled the delineation of brackish groundwater pockets, which was in close agreement with
the field observation. Furthermore, an overlay of the enhanced image on the digital terrain
model of the study area revealed the exact surface geometry of aquifers and their relationship
to the surficial geomorphic features.
Hadithi et al. (2003) evaluated the groundwater potential in the Ratmau-Pathri Rao water-
shed in Haridwar district, India using geo-electrical, remote sensing (RS) and GIS techniques.
They integrated various thematic maps, viz., geology, hydro-geomorphology, drainage den-
sity, slope, aquifer thickness, and depth to water table in a GIS framework. Then appropriate
weights were assigned to various factors affecting the occurrence of groundwater to evaluate
groundwater potential in each segment of the study area. They found that the categorization
of groundwater potential by RS and GIS techniques was in agreement with the available
well-yield data.
Sikdar et al. (2004) used remote sensing and GIS techniques to explore the land use/land
cover changes and to delineate groundwater potential zones in and around Raniganj coal
mining area of Bardhaman District, West Bengal, India. They used IRS LISS-III data and
toposheets to identify land use/land cover changes from 1972 to 1998 in the area. It was
found that the land covered by vegetation and settlement has decreased during this period at
the expense of mining activities. Various thematic layers namely geomorphology, lithology,
drainage texture, slope, lineament density and current land-use pattern were considered to
delineate groundwater potential zones. These thematic layers were prepared using ILWIS
GIS package, and ranked in a scale of 0 to 5 depending upon their suitability for groundwater
occurrence. The rank of each map was then converted to a probability weight using Bayesian
statistics and finally a multi-criteria overlay analysis was used to find groundwater potential
zones. The groundwater abstraction structures (i.e., dug wells, mini-deep tubewells or deep
tubewells) feasible in each of the delineated potential zones were also suggested.
4.3. Selection of artificial recharge sites
Elango and Arrikkat (1998) integrated and analyzed various thematic layers related to ground-
water recharge using GIS for the identification of recharge sites in parts of Ongur sub-basin,
south India. Seven thematic layers were prepared using both remotely sensed and conven-
tional data. These layers were ranked, reclassified, and overlayed in ArcInfo GIS. Based
on the GIS analysis, the study area was divided into four zones viz., ‘very good’, ‘good’,
‘poor’, and ‘very poor’ according to the potential for natural recharge. The unfavorable areas
were further classified into four classes on the basis of potential for artificial recharge. It was
concluded that remotely sensed data, conventional data, and GIS overlay analyses provide a
powerful and practical approach to identify groundwater recharge areas in a basin.
Springer

446 Water Resour Manage (2007) 21:427–467
Ramlingam and Santhakumar (2002) used remote sensing and GIS techniques to explore
suitable recharge areas and structures to augment an aquifer system in Tamil Nadu, India.
The thematic maps such as geomorphology, geology, soil, slope, land use, drainage density,
lineament density, runoff isolines, depth to weathered zone, depth to basement, groundwater
level fluctuations and the water quality were used in this study. These maps were prepared
using IRS LISS-III satellite data and other collateral information obtained from the field.
The ArcInfo GIS package was used to identify suitable artificial recharge areas. They used
1-sigma criteria to divide the rechargeable area into various categories namely ‘highly favor-
able’, ‘moderately favorable’, ‘less favorable’ and ‘poor’. Suitable recharge structures were
proposed depending on the terrain condition and favorable zonation. They concluded that the
zonation created using GIS as well as the type and location of water-harvesting structures
suggested were agreeable, and the success rate was more than 90%.
Vasanthakumaran et al. (2002) used remote sensing and GIS techniques for selecting suit-
able sites for artificial groundwater recharge in the rocky terrain of Southern India. They used
toposheets and satellite data for preparing soil, lineament, and drainage density maps. The
developed themes were integrated using ArcView and ArcInfo GIS software and appropriate
weights were assigned to each theme, which resulted in the identification of suitable artificial
recharge sites.
The methodology adopted by researchers for the identification of groundwater potential
zones and for the selection of suitable sites for artificial recharge or rainwater harvesting is
illustrated in Figure 3. In this figure, the dashed arrows show the optional step that is not
always followed because of the lack of appropriate field data.
4.4. GIS-based subsurface flow and pollution modeling: model development,
applications and evaluation
Adams et al. (1993) developed a GIS-based spatial data model called WELLHEAD to view
and retrieve subsurface data interactively and graphically. The relational model of WELL-
HEAD that represented the relations and data dictionary for WELLHEAD as well as the
construction of WELLHEAD as a feature-based system using object-oriented data modeling
is described. It was reported that the abstraction mechanisms could be used to build a richer
and more natural object-oriented data model for the boring log management system. Further,
the relational systems are useful because of their nonprocedural data manipulation language,
embedded and ad hoc query languages, and a high degree of data independence.
Baker et al. (1993) using GIS calculated the variables of input to the uniform flow ana-
lytical model which was used in conjunction with the hydrogeologic mapping for wellhead
protection areas (WHPAs) of the Rhode Island Department of Environmental Management
(RIDEM) to evolve groundwater protection strategies. The proposed model is composed
of four modules: RESSOC, MWCAP, GPTRAC, and MONTEC and each module indepen-
dently calculate a “capture zone” (i.e., surface and subsurface areas contributing groundwater
to a pumping well). They found that the integration of GIS and WHPA groundwater flow
model proved to be a valuable tool in the state wellhead protection program. The limitations
of the model are also highlighted.
Camp and Brown (1993) developed a GIS-based methodology for developing subsurface
profiles from well-log data. They examined the accuracy and the reliability of well-logs with
the help of geophysical logs and formation logs for each borehole from as many sources
as possible. It was found that the geophysical logs were the most important and formed
the nucleus of the GIS-well-log database. It was also demonstrated that any number of
cross-sectional profiles or three-dimensional images of well-log data could be created and
Springer

Water Resour Manage (2007) 21:427–467 447
Fig. 3 Flowchart for evaluating and managing groundwater resources by integrated remote sensing and GIStechniques
viewed interactively from this database. Furthermore, for each of the subsurface units, a
GIS-MODFLOW interface was developed that computes the geo-hydrographic parameters
from the well-log database. It was concluded that a GIS-based interface provided a powerful
method for overcoming data generation problems in groundwater-flow modeling.
Hinamann (1993) demonstrated the use of GIS for assembling input datasets for a FDM-
based three-dimensional groundwater flow model, MODFLOW through a case study in the
middle Patuxent River basin of Howard County, Maryland. The model grids were developed
with GIS. They considered various attributes such as model boundaries, regolith thickness,
stream length, stream location, etc. After preparing the input layers using GIS, the output
layers were prepared in a format which was suitable for the MODFLOW input. It was
Springer

448 Water Resour Manage (2007) 21:427–467
emphasized that the ability of GIS to change large sets of spatial data quickly and accurately
enhanced the model calibration process.
Richards et al. (1993) used a numerical groundwater model, MODFLOW in a GIS envi-
ronment using ArcInfo software to optimize well-field design and to analyze aquifer stress
problems in a coastal area of Santa Rosa County, Florida. They used GIS as a primary tool
for the development of the model grids, in studying the performance of modeling procedure
and the model analysis. They demonstrated that the model calibration became very quick
and efficient using GIS tools. They concluded that GIS was well-suited to efficiently manage
resource modeling projects by allowing data management, data analysis and graphic outputs
within a single integrated software system. Model systems for specific modeling projects
could also be developed very quickly and easily.
Roaza et al. (1993) developed a FEM-based three-dimensional, density-dependent trans-
port and flow model using the SWICHA code to study the hydraulics of the aquifer in
Escambia County, Florida. The modeling technique was integrated with ArcInfo GIS to de-
velop a system for optimal management of the resource. The GIS was the primary tool in
the development of the model grid, as well as being the integral component in the model-
ing procedure. Multiple model grids were developed for simulating regional flow and local
flow/transport phenomena. Further, the model calibration was conducted within the GIS en-
vironment through a combination of visual and relational querying. It was inferred that the
GIS provided an integrated environment which facilitated model analyses, and data storage
and retrieval.
El-Kadi et al. (1994) presented a GIS-embedded groundwater modeling approach and
illustrated the procedure considering the Oahu Island, Hawaii as a case study. They linked
the USGS model, MOC into the MapInfo GIS package and then applied to the study area. It
was emphasized that the linkage was generic in nature and could be extended to other models
as well. The availability of a programming language in the GIS package facilitated pre- and
post-processing efforts within custom-made dialogue boxes and pull-down menus. It was
concluded that the integrated system was suitable for extracting and interpolating point mea-
surements from maps. The drawback of the integrated system, however, was highlighted as the
relative difficulty in extracting spatially distributed data owing to the vectorized nature of GIS.
Wylie et al. (1994) tested a Nitrate Leaching and Economic Analysis Package (NLEAP)
model in conjunction with a GIS for regional irrigated agriculture in eastern Colorado.
The results indicated that the NLEAP NO3-N-leached (NL) index, an index of the amount
of NO3-N leached below the rooting zone, was useful for describing the distribution of
groundwater NO3-N concentrations across a 736 km2 area when used in combination with a
GIS. Comparison of observed NO3-N distributions in the South Platte alluvial aquifer with
simulated NL distributions gave regional Pearson correlation coefficients of 0.59 and showed
that the model could simulate the major observed groundwater NO3-N patterns.
Barber et al. (1996) studied the impact of urbanization on groundwater quality in relation to
land-use changes in a groundwater supply field near Perth, Western Australia. They analyzed
23-year (1974–1996) groundwater-quality data from eleven production wells and investigated
land-use changes occurred during this period. It was found that the land was converted
from natural bush land to its present urban situation. The groundwater quality in production
wells was found to be contaminated by increasing nitrate and volatile organic compounds
(VOCs) derived from urban and industrial developments. Also, they integrated a numerical
groundwater model (FEFLOW) with GIS to demonstrate transient character of the capture-
zone boundaries of production wells due to seasonal changes in recharge and water demand,
and its relation to areas of different land uses. It was predicted that the full impact of the
unsewered urban development will occur in about 15–20 years.
Springer
Water Resour Manage (2007) 21:427–467 449
Watkins et al. (1996) evaluated the three methods of interfacing between GIS and ground-
water models (viz., models linked to GIS, models integrated with GIS, and models embedded
in GIS) and emphasized the usefulness of GIS in groundwater modeling. The linking of GIS
and groundwater models was recognized as a powerful platform for developing models,
calibrating and validating them, and displaying results. Some of the disadvantages of the in-
tegrated GIS-groundwater program were identified as high hardware and software costs, and
a high level of initial user effort. It was concluded that despite the limitations of each inter-
facing method, each has the potential to make traditional ‘stand-alone’ modeling programs
obsolete, and that the researchers have only just scratched the surface in GIS to improve
groundwater modeling. Furthermore, current needs are identified and the suggestions for
future work are made.
Corwin et al. (1997) presented a critical review on the GIS-based modeling of non-point
source (NPS) pollutants in the vadose zone. Areas discussed include the significance of NPS
pollutants as a global environmental problem, the justification for the GIS-based modeling
of NPS pollutants in the vadose zone, the basic components of environmental modeling with
GIS, a review of existing GIS-based NPS pollutant models, the application of geostatistics
to GIS-based NPS pollutant modeling, the influence of scale, the reliability of NPS pollutant
models based on model errors and data uncertainties, and the future direction of GIS-based
NPS pollutant modeling. It was concluded that the proliferation of GIS-based NPS pollutant
models holds promise, yet caution is needed to avoid the misuse of a potentially valuable
environmental assessment tool for decision makers.
Lasserre et al. (1999) developed a simple GIS-linked model for nitrate transport using the
IDRISI GIS software. They found that significantly less data are required for this GIS-linked
model compared to the more classical hydro-geochemical model. They also linked this model
with an unsaturated-zone transport model called AgriFlux for simulating water and nitrate
fluxes leaving the root zone. The results indicated that the simulated nitrate concentrations
were in good agreement with the measured values. Further, in order to compare the GIS-linked
model with a more complete model, simulations were also performed using the standard
software, MT3D-MODFLOW. The similarities between the results of these two models
confirmed the validity of the developed GIS-linked model.
Balteman and Smedt (2001) developed a physically-based model called WetSpass for the
estimation of long-term average spatial patterns of surface runoff, actual evapotranspiration
and groundwater recharge. They integrated the developed model in the GIS ArcView as a
raster model, and the parameters such as land-use and related soil type were connected to the
model as attribute tables of the land-use and soil raster maps. The model was calibrated with
recharge as input and then validated satisfactorily. It was suggested that the model is especially
suitable for studying the long-term effects of land use changes on the water regime in a basin.
Boutt et al. (2001) presented an approach to examine potential relationships between land
use-derived solutes and baseflow surface water quality by estimating chloride concentrations
in surface water due to road-salt transport through groundwater at the Michigan’s Grand
Traverse Bay Watershed (GTBW) using groundwater modeling and GIS. They developed a
three-dimensional groundwater flow model of the GTBW using MODFLOW and incorpo-
rated ArcInfo GIS software in the model which was beneficial for the model development
and the analysis of model output as large amount of spatial data were required to execute the
model. They reported that the developed geologically parameterized model offers a method
to estimate spatially and temporally variable solute fluxes via groundwater to streams and
lakes in the study area. A considerable legacy of land use influencing surface water quality
was found in the area. It was concluded that this approach could also be used to examine the
impacts of other land-use related solutes on baseflow surface water quality.
Springer
450 Water Resour Manage (2007) 21:427–467
Gogu et al. (2001) designed a hydrogeologic GIS database that offered facilities for
groundwater-vulnerability analysis and hydrogeologic modeling for the Walloon region in
Belgium. A loose-coupling tool was created between the spatial-database scheme and the
groundwater numerical model interface GMS (Groundwater Modeling System). Following
time and spatial queries, the hydrogeologic data stored in the database can be easily used
within different groundwater numerical models. They found that most GIS could easily ac-
complish overlay and index operation, but could not perform the process-based groundwater
flow and transport phenomena. However, the coupling of a GIS to process-based models
could provide an efficient tool for processing, storing, manipulating and displaying hydro-
geologic data. Also, a well-designed GIS could significantly reduce the time needed for data
preparation and presentation.
Hall et al. (2001) conducted an extensive series of leaching simulations with the NLEAP
model using best estimates of local agricultural practices to clarify the relative roles of the
different nitrate leaching controlling variables under irrigated agriculture in northeastern
Colorado. The results of these simulations were then used with GIS to estimate the spatial
variability of leachate quality for a 14,000 ha area overlying the alluvial aquifer of the South
Platte River. Simulations showed that differences in soil type might lead to 5–10 kg/ha of N
variation in annual leaching rates, while the variability due to crop rotations was as much as
65 kg-N/ha for common rotations. Land application of manure from confined animal feeding
operations may account for more than 100 kg-N/ha additional leaching. It was inferred that
the land application of manure is the most important factor determining the mass flux of
nitrate leached, and the combination of sprinkler irrigation and manure application yields
highest leachate concentrations.
Shivraj and Jothimani(2002) developed a comprehensive groundwater information system
(GWIS) with extensive capabilities of GIS. It is a 32-bit Windows-based groundwater data
management and analysis software that can comprehensively manage, evaluate and present
most types of groundwater information – both spatially and non-spatially. They reported that
one of immediate uses of the software is to create basic spatial and non-spatial databases
and generate documents and reports, with all the data processed in graphs, maps, and tables.
Such information is useful for further characterization and evaluation of sites, contaminant
potentials, need for remediation, and water development potential.
Chowdary et al. (2003) integrated a groundwater flow model and GIS to estimate the
spatial distribution of groundwater recharge and to simulate the behavior of Godavari Delta
aquifer in Andhra Pradesh, India. They divided the entire study area into a set of basic
simulation units (BSUs) that were homogenous with respect to the factors affecting recharge
processes. A daily field soil water balance model and a simple canal flow model were used
to estimate percolation and seepage losses, respectively. The loose link between models and
GIS enabled model and GIS development to proceed independently and easy adaptation of
existing models, which was both time- and cost-effective. The spatial distribution of recharge
derived from the GIS and of pumping based on a heuristic approach was validated by using a
finite element groundwater flow model. It was concluded that the integrated framework could
be used as a decision support tool to assess groundwater resources and to identify suitable
conjunctive use strategies for large canal-irrigation projects.
Herzog et al. (2003) developed a three-dimensional (3-D) hydrostratigraphic model of
the complex glacial-drift aquifer system in central Illinois to identify possible areas where
a regional water supply could be obtained from the aquifer with minimal adverse impacts
on existing users. Geologic information from more than 2200 existing water well logs was
supplemented with new data from 28 test borings, water level measurements in 430 wells, and
35 km of surface geophysical profiles. A 3-D hydrostratigraphic model was developed using
Springer
Water Resour Manage (2007) 21:427–467 451
a contouring software package, a geographic information system (GIS), and the 3-D geologic
modeling package, EarthVisionR. The hydrostratigraphy of the glacial-drift sequence was
depicted as seven uneven and discontinuous layers, which could be viewed from an infinite
number of horizontal and vertical slices and as solid models of any layer. Several iterations
were required before the 3-D model presented a reasonable depiction of the aquifer system.
Layers from the resultant hydrostratigraphic model were imported into MODFLOW, where
they were modified into continuous layers. It was reported that this approach of developing a
3-D hydrostratigraphic model can be applied to other areas having complex aquifer systems,
and is also useful in helping lay audiences visualize aquifer systems.
Almasri and Kaluarachchi (2004) presented a GIS-based modeling approach to estimate
the variability of on-ground nitrogen loading and the corresponding nitrate leaching to
groundwater. The methodology integrates all point and nonpoint sources of nitrogen, the
national land cover database, soil nitrogen transformations, and the uncertainty of key soil
and land use-related parameters to predict the nitrate mass leaching to groundwater. The anal-
ysis considered 21 different land use classes with information derived from different nitrogen
sources. The model was applied to a large aquifer of 376 square miles in Washington State
and monthly simulations were performed to capture seasonal trends. The simulation results
indicated that dairy manure is the main source of nitrogen in the area followed by fertilizers.
A change in the land use pattern has a noticeable impact on nitrate leaching. Further, the
uncertainty analysis revealed that denitrification rate is the most influential parameter on
nitrate leaching. It was concluded that combining management alternatives is a successful
strategy, especially with the use of nitrification inhibitors.
Gossel et al. (2004) developed a three-dimensional GIS-based groundwater flow model for
the Nubian Sandstone Aquifer in the eastern Sahara. The model was calibrated under steady-
state and transient conditions and then was used to simulate the response of the aquifer to
climatic changes that occurred during the last 25,000 years. The simulation results indicated
that the groundwater in this aquifer was formed by infiltration during the wet periods 20,000
and 5,000 years B.P. The recharge of groundwater due to regional groundwater flow from
more humid areas in the south was excluded. It was also found that the Nubian Aquifer System
is a fossil aquifer, which had been in an unsteady-state condition for the last 3,000 years.
4.5. Groundwater-pollution hazard assessment and protection planning
Baker and Panciera (1990) used GIS technology to develop a groundwater database called
RIGIS for groundwater protection planning at state and local levels. The Rhode Island GIS
(RIGIS) focused on the preparation of a groundwater classification map. The data layers re-
quired for this classification were glacial geology, significant stratified drift aquifers, aquifer
recharge areas, water table contours, transmissivity, saturated thickness, hydrograph, com-
munity water-supply wells, and known potential sources of groundwater contamination. To
develop a groundwater protection plan on local basis, various data were required which were
not always available all the time. However, GIS could provide many of such information.
They concluded that though the RIGIS provided a good tool for groundwater protection plan-
ning for the Rhode Island, there were some inherent limitations of geographic analyses which
might be recognized by the government to avoid inappropriate applications of information.
Evans and Myers (1990) presented a GIS-based approach to evaluate regional groundwater
pollution potential of an unconfined aquifer in Columbia. The ERDAS GIS package was
used to overlay and evaluate the various input layers of spatially oriented data to determine
the potential for negative groundwater impacts in the study area. They primarily aimed at
developing map products from geographic databases using ERDAS software in conjunction
Springer

452 Water Resour Manage (2007) 21:427–467
with the DRASTIC groundwater evaluation system. Two different types of groundwater
evaluation were made. In the first type of evaluation, an evaluation of the pollution potential
for any given location was made based on the local depth to groundwater, aquifer hydraulic
conductivity, land slope and soil permeability. A risk assessment map was prepared to display
the results. In the second type of evaluation, a qualitative determination of the probability of
groundwater pollution due to human-related factors was made, which resulted in a “hazard
assessment” map. They inferred that these GIS-based risk and hazard assessment maps could
be used to develop strategies to safeguard groundwater resources.
Shih and Jordan (1990) investigated the serious saline contamination problem of artesian
wells in Florida using remote sensing technique. They used ground-based Kodak 2236 color
infrared (GCIR) slide photographs and Kodak 2443 aerial color infrared photographs (ACIR)
to study the spectral reflectance from different land cover types associated with artesian well
sites. It was found that both the ground-based color infrared (GCIR) and aerial color infrared
(ACIR) showed similar patterns of spectral reflectance for the same component class of land
surface features. The soil of well site had a higher spectral reflectance than the soil not
associated with a well, and the well-pool water had a higher spectral reflectance than the
pond and ditch water. It was also found that the combination of red and green channels of
spectral reflectance video digitized from the ACIR photographs is useful for classifying land
cover types and for distinguishing flowing wells. It was concluded that both the GCIR and
ACIR photographs could be used for the analysis of the spectral reflectance of land surface
features, which in turn can help in detecting flowing wells.
Halliday and Wolfe (1991) linked the GRASS GIS software with the DRASTIC model to
identify the degree of correlation between the susceptibility of groundwater to pollution and
the availability of nitrogen fertilizer. The input data for the model included an agricultural
pollution susceptibility map, county and state boundary maps, major aquifer outcrop areas,
and the recommended nitrogen fertilizer application rates for nine crops. The county map
layer was used as the base data layer for graphically representing the cropping and fertilizer
data. The results of this study confirmed that GIS is a helpful tool in analyzing groundwater
contamination problems.
Flockhart et al. (1993) examined three cases each with different approaches for using
GIS for groundwater protection planning in northeast America where most of water supply
is from groundwater. They carried out tests at: (i) Wellfleet, Massachusetts, (ii) Hadley,
Massachussets and (iii) Cortland County, New York. In Wellfleet, Massachusetts, build-
out scenarios were used to support regulatory and land acquisition decisions for siting a
public water supply well. In Hadley, Massachussets, the focus was on a decision support
model for the septic suitability assessment in support of regulatory efforts and infrastructure
expansion. For Courtland County, an intensive graphic user interface was created to facilitate
the manipulation and recombination of a large volume of data by County officials to target
groundwater pollution prevention efforts. It was concluded that once appropriate data are
input, a GIS can efficiently and effectively be used to derive the outcomes of various land
use plans and regulations.
Griner (1993), as part of a larger model to identify lands suitable for acquisition, de-
veloped a water-supply protection model using the Southwest Florida Water Management
District’s GIS. Several hydrologic and hydrogeologic data layers were overlaid to develop
maps showing ground-water supply suitability, protection areas for surface-water supply,
protection areas for major public supply wells, susceptibility to ground-water contamina-
tion, and recharge to the Floridan aquifer. These intermediate layers were combined into a
final map to prioritize protection areas for water supply. The advantages of GIS applications
in water-supply protection modeling are also highlighted.
Springer

Water Resour Manage (2007) 21:427–467 453
Rifai et al. (1993) developed GIS database using SYSTEM 9 software and a wellhead
modeling user interface (WMUI) for linking SYSTEM 9 GIS package and the EPA ground-
water flow model, WHPA in order to implement groundwater protection strategies by state
and local governments and regulatory agencies. The WMUI facilitates the automatic ex-
traction of necessary information from the GIS database for modeling and analyses. The
GIS database can store the delineated WHPAs for further analysis and display. Thus, the
developed WMUI can allow local agencies to delineate and manage WHPAs for hundreds of
wells more efficiently and effectively than with traditional paper maps and overlay system.
To demonstrate the efficiency of this user interface, a pilot study was conducted in the city
of Houston and surrounding Harris County wherein WHPAs for 202 active water supply
wells were delineated using the GIS and WMUI. They also performed a detailed sensitivity
analysis to evaluate the effect of uncertainty in model parameters on the delineated WHPAs.
Potential sources of contamination within the delineated WHPAs were then identified us-
ing the GIS database. They reported that while GIS is perceived as an important tool that
can enhance users’ ability for spatial data analysis, there exist many problems. The system
hardware and software require a substantial investment in financial and human resources.
Database development is a tricky process requiring planning and commitment; in most cases,
the anticipated outcome from GIS software development is not immediately realized.
Hammen and Gerla (1994), considering a multifaceted approach to wellhead protection
mandated by the 1986 Amendments to the Safe Drinking Water Act, presented an application
of common GIS functionality in facilitating a comprehensive wellhead protection scheme for
an agricultural municipality in North Dakota. It was demonstrated that in functioning both
as a research tool and as a decision support system, a geographic information system (GIS)
is very useful in addressing the technical, administrative, and educational issues involved in
the multifaceted approach to wellhead protection.
Maslia et al. (1994) developed procedures that combine the groundwater simulation mod-
els and demographic databases under a GIS platform to automate the exposure assessment
phase of a typical health assessment study. The developed procedures are reported to sig-
nificantly simplify the post-processing phase of the analysis, and to render the overall task
more “user friendly”. A spite-specific application is presented as a demonstration of the
proposed methodology. It was emphasized that the geographic information system provided
a platform in which layered, spatially distributed databases can be manipulated with ease,
thereby simplifying the integrated exposure-analysis tasks significantly.
Hudak et al. (1995) developed a GIS-based underground storage tank (UST) management
system and applied to 136 current and former gasoline service stations in Denton, Texas. The
system was found to be effective for tank inventory and can be applied in a proactive fashion
to identify potentially problematic facilities. In the event of a leak or spill, the management
system can support the implementation of reactive measures to mitigate subsurface contam-
ination. Potential beneficiaries of such a system are reported to be planning departments,
environmental regulatory agencies, emergency management officials, lending institutions,
gasoline distributors, and oil companies.
Basagaoglu et al. (1997) used GIS technology to identify candidate sites for a solid-waste
disposal facility in the Golbasi region of Turkey that has suffered from the negative impact of a
poorly-located existing open-dump site on the environment. The procedure followed under a
GIS framework rejects the unacceptable sites considering environmental factors exclusively,
other than economic and political issues, contained in the form of multiple layers of attribute
information to select the candidate sites for landfilling wastes through an overlay analysis
performed by the ArcInfo GIS software. In this application, GIS was considered as a screening
tool in a site-selection process to narrow the number of candidate sites, subsequently leading
Springer
454 Water Resour Manage (2007) 21:427–467
to one or more sites for detailed investigation. Finally, preliminary ranking for a group of
potential sites was done on the basis of simple calculations coupled with on-site field studies.
Laurent et al. (1998) proposed a method for water resources protection based on the
spatial variability of vulnerability. A spatial modelling method was defined in this study to
estimate a travel time between any point of a catchment and a resource (river or well), which
was based on spatial analysis tools integrated in a GIS. The method was illustrated by an
application to an area of Massif Central, France where three different types of flow appear:
surface flow, shallow subsurface flow, and permanent groundwater flow (i.e., baseflow). The
proposed method was found to yield results similar to the classical methods of estimation of
travel time. The GIS improved the mapping of vulnerability by taking the spatial variability
of physical phenomena into account.
Loague and Corwin (1998) presented a review of the simulations of NPS groundwater
vulnerability resulting from historical applications of the agrochemical DBCP (1, 2-dibromo-
3-chloropropane) for east-central Fresno County, California. Through the Fresno case study,
the data requirements for the process-based 3-D simulations of coupled fluid flow and solute
transport in the unsaturated-saturated subsurface at a regional scale are demonstrated. The
strengths and weaknesses of using GIS in regional-scale vulnerability assessments, and the
critical problem of estimating the uncertainties in these assessments are discussed. Finally,
a regional GIS-driven integrated assessment approach is proposed, which is based on cost-
benefit analysis, and incorporates both physical and economic factors that can be used in a
regulatory decision process.
Shukla et al. (1998) developed a GIS-based attenuation factor (AF) model to evaluate the
relative degree of groundwater vulnerability to pesticide contamination in Louisa County,
Virginia. Spatial (land use, soils, and groundwater recharge) and tabular databases (soils and
pesticides) were used within a GIS environment to create contamination livelihood maps
based on the AF values. The data layers were overlaid within a GIS for the spatial compu-
tation of AF for the actual and 2-m groundwater depths. The spatial database was divided
into five contamination potential categories namely ‘high’, ‘medium’, ‘low’, ‘very low’ and
‘unlikely’ based on the numerical values of AF for each cell (1/9 ha), and the results for three
most mobile pesticides (i.e., Picloram, Carbofuran, and Atrazine) were presented. Among
these three pesticides, Picloram was found to have the highest leaching potential. The perfor-
mance of the AF model was evaluated by comparing its predicted results with the field data
from an experimental watershed. The AF model was able to identify most of the frequently
detected pesticides in the watershed. They concluded that the results of this study can be
used for formulating an appropriate land-use management plan to protect the groundwater
quality.
Dubey and Sharma (2002) developed a decision support system for evaluating the ground-
water pollution potential (GWPP) of an area using remote sensing, ancillary data and GIS.
They represented the GWPP system by a factor analytical model (FAM). The FAM was used
to develop a decision support system to assign a weight to a particular characteristic based
on its contribution in GWPP. Groundwater pollution potential was determined by the linear
mixing of above surface, surface and subsurface environmental parameters influencing the
GWPP. The generated database was put to FAM to classify the study area into different
classes in terms of their potential to pollute groundwater. The model efficacy was tested by
carrying out a field survey and it was found above 80%. It was concluded that the developed
model could be used for evaluating GWPP in any area after calibration.
Lamble and Fraser (2002) developed a GIS-based predictive groundwater model using
satellite imagery and ancillary data for the Murray Valley Irrigation Region of New South
Wales, Australia. The developed model enabled the prediction of salinity risks due to rising
Springer
Water Resour Manage (2007) 21:427–467 455
groundwater levels. In addition, a regression model showed a great promise in predicting the
areas of high groundwater in the study area.
Dixon (2004) developed a modeling approach that loosely couples Neuro-fuzzy techniques
and GIS to predict groundwater vulnerability in a relatively large watershed in northwest
Arkansas. He used GRASS and ArcView GIS packages, GPS, remote sensing, and a fusion
of neural network and fuzzy logic techniques along with relevant interactions of soil properties
and land use/land cover on the groundwater quality of the study area. The Neuro-fuzzy model
was developed in JAVA using four plausible parameters namely soil hydrologic group, depth
of the soil profile, pedality points of the soil A horizon, and land use that are deemed critical
in transporting contaminants in and through the soil profile. The model was validated using
nitrate-N concentration data. It was found that the majority of the highly vulnerable areas
predicted by the model coincided with agricultural land use, moderately deep to deep soils,
soil hydrologic group C (moderately low Ksat) and high pedality points. It was concluded
that the proposed methodology has the potential for facilitating groundwater vulnerability
modeling at a regional scale and can be used for other regions. This study is reported to be a
first step toward incorporation of Neuro-fuzzy techniques, GIS, GPS and remote sensing in
the assessment of groundwater vulnerability from non-point source contaminants.
Saykawlard et al. (2005) presented a methodology to predict the spatial variation in
subsurface water-level change with crop-growth stages using the satellite data of Thabua
Irrigation Project, Thailand. They analyzed the relationship between subsurface water-level
change due to pumping for irrigating rice in the dry season and the age of rice. The spatial
model of subsurface water-level change was developed from the classification using greenness
(i.e., normalized difference vegetation index (NDVI)) derived from the Landsat-5 TM data.
The NDVI values of 52 rice fields’ data during the 1998–1999 dry-season cropping period
were used to assess the relationship between NDVI and the age of rice. It was found that
the NDVI and rice age have a good correlation (R2 = 0.73). The low NDVI values (−0.059
to 0.082) in the rice fields were related to the young rice stage (0–30 days). Also, a high
correlation between the NDVI and the subsurface water-level change was found. It was
concluded that this simple method of using NDVI relationships with water-level change and
crop-growth stages proved to be useful in identifying the areas prone to excessive lowering
of the subsurface water level during dry seasons.
4.6. Estimation of natural recharge distribution
Fayer et al. (1996) estimated the areal distribution of natural recharge at the Hanford Site in
southeastern Washington State to serve as input to a groundwater flow and transport model.
A GIS was used to identify all possible combinations of soil type and vegetation and assign
to each an appropriate estimate of recharge. The strategy was to assign estimates based on
field data and supplement with simulation results only when necessary. The estimated rates
varied from 0.7 to 127.1 mm/yr.The GIS software was used to estimate the annual recharge
volume attributable to specific soil-vegetation combinations and to construct a recharge map.
The recharge map showed the impact of a 1984 fire on increasing recharge; it also illustrated
the higher recharge rates associated with disturbed soils in the waste storage areas.
Stone et al. (2001) presented a method to estimate the distribution of groundwater recharge
within hydrographic basins in the Great Basin region of the southwestern United States on
the basis of estimated runoff from high mountainous areas and subsequent infiltration in
alluvial fans surrounding the intermontane basins. It involves a combination of GIS analysis,
empirical surface-runoff modeling, and water-balance calculations. The method addresses the
need to develop and incorporate constraints on the distribution of recharge in regional-scale
Springer
456 Water Resour Manage (2007) 21:427–467
groundwater flow modeling of arid and semiarid environments. The conceptual approach and
methodology were developed for Crescent Valley, Nevada and it was demonstrated that the
method resulted in a more accurate representation of actual recharge conditions.
Jyrkama et al. (2002) developed a practical methodology incorporating the hydrologic
model HELP3 in conjunction with a GIS to generate a physically based and highly detailed
recharge boundary condition for groundwater modeling. It uses daily precipitation and tem-
perature records in addition to land use/land cover and soils data. The importance of the
method in transient groundwater modeling is demonstrated by applying it to a MODFLOW
modeling study in New Jersey. Besides improved model calibration, the modeling results
clearly indicated the importance of using a physically based and highly detailed recharge
boundary condition in groundwater quality modeling, where the detailed knowledge of the
evolution of the groundwater flow-paths is imperative. The results also indicated that the
combination of temperature and precipitation plays an important role in the amount and
timing of recharge in cooler climates. A sensitivity analysis further revealed that increasing
the leaf area index, the evaporative zone depth, or the curve number in the model results in
decreased recharge rates over time, with the curve number having the greatest impact.
Szilagyi et al. (2003) estimated naturally occurring long-term mean annual base recharge
to groundwater in Nebraska with the help of a water-balance approach and an objective
automated technique for base-flow separation involving minimal parameter-optimization
requirements. Evapotranspiration was calculated by the WREVAP model at the Solar and
Meteorological Surface Observation Network sites. Long-term mean annual base recharge
was derived by determining the product of estimated long-term mean annual runoff and
the base-flow index (BFI). The BFI was calculated from discharge data obtained from the
USGS’s gauging stations in Nebraska. Mapping was achieved by using GIS and geostatistics.
Long-term mean annual base recharge rates in excess of 110 mm/year resulted in the extreme
eastern part of Nebraska. The western portion of the state expressed rates of only 15 to 20
mm annually, while the Sandhills region of north-central Nebraska was estimated to receive
twice as much base recharge (40 to 50 mm/yr) as areas south of it. It was emphasized that
the methodology adopted in this study does not require complex hydrogeologic modeling
nor detailed knowledge of soil characteristics, vegetation cover, or land-use practices.
Brunner et al. (2004) presented a methodology for obtaining the recharge map for two
sites in Botswana, South Africa. The relative distribution of recharge was obtained from
remotely sensed data using surface water balance method, which was calibrated with local
recharge values determined by Chloride Method. The Meteostat-5 satellite data (5-km spatial
resolution) were used to estimate rainfalls, which were validated against the measured rainfall
data collected from four stations. A simpler algorithm was used to estimate ET which involved
multiplication of daily net radiation and evaporative fraction. The daily net radiation data
were obtained from the satellite imagery and astronomical data using a simple algorithm and
the evaporative fraction was obtained from the satellite imagery for each pixel value. Finally,
correlation coefficients between the recharge estimates obtained by the water balance model
and those by Chloride Method were determined. Based on these correlation coefficients, a
scaled recharge map was developed. They inferred that if the assumptions of the surface water
balance and Chloride Method are satisfied and the precipitation as well as chloride data are
available in the required resolution, the methodology could easily be adapted to other arid or
semi-arid regions.
Cherkauer (2004) estimated natural groundwater recharge in watersheds of varying sizes
using a distributed parameter model and GIS. This procedure simplifies the PRMS calibration
observed streamflow hydrographs by reducing degrees of freedom from dozens to four. For
seven watersheds (60 to 500 km2), the GIS-aided calibrations had average errors of 5% on
Springer

Water Resour Manage (2007) 21:427–467 457
recharge and 2% on total streamflow, verifying the accuracy of the process. Recharge was
also calculated for 63 local-scale sub-watersheds (average size 37 km2), and the calculated
recharges were found to average 11 cm/yr. The model was extended to uncalibrated water-
sheds where GIS and climatic information were known. It reproduced total annual discharge
and recharge to within 9 and 10%, respectively, indicating the process can also be used to
calculate recharge in ungauged watersheds.
Szilagyi et al. (2005) estimated naturally occurring long-term mean annual recharge to
groundwater in Nebraska by a novel water-balance approach. This approach uses GIS layers
of land cover, elevation of land and groundwater surfaces, base recharge, and the recharge
potential in combination with monthly climatic data. Long-term mean recharge > 140 mm
per year was estimated in eastern Nebraska, having the highest annual precipitation rates
within the state, along the Elkhorn, Platte, Missouri, and Big Nemaha River valleys where
ground water is very close to the surface. Similarly, high recharge values were obtained for
the Sand Hills sections of the North and Middle Loup as well as Cedar River and Beaver
Creek valleys. The westernmost and southwesternmost parts of the state were estimated to
typically receive <30 mm of recharge per year.
4.7. Hydrogeologic data analysis and process monitoring
Hudak et al. (1993) integrated the GIS capabilities for managing spatial data with a
groundwater-quality monitoring network design methodology. They applied a ranking
methodology for monitoring network design for the Butler County Municipal Landfill in
Southwest Ohio. GIS was utilized effectively in a number of tasks related to the groundwater
monitoring network design, together with the display of the results. They concluded that the
ranking approach augmented with GIS provided a practical and effective alternative for the
problem of detection-based groundwater-quality monitoring network design.
Salama et al. (1996) presented three methods (manual, geostatistical and hydrogeological-
GIS-based (H-GIS)) for preparing hydraulic head surfaces (HHS). In the manual method,
two techniques namely equal spacing technique and hydrogeological interpretative technique
were used. In the second method, a geostatistical package was used, and in the third method,
two different hydrogeological techniques incorporating GIS modeling were used. The results
indicated that of the manual methods, the hydrogeological interpretative technique was better
than the equally spaced approach. It was also demonstrated that the newly developed H-GIS
techniques, which take into account the hydrogeomorphic classification and topographic
controls, yielded the most realistic surface and the areas of groundwater discharge. The
major advantage of the GIS-based techniques was their ability to prepare HHS maps with a
small number of data points. It was concluded that the geostatistical method is unsuitable for
preparing HHS maps and it could be used only in the absence of other methods along with
hydrogeomorphic and hydrogeological controls.
Endres et al. (2000) imaged the temporal and spatial response of an unconfined aquifer
during a pumping test using ground-penetrating radar (GPR) profiling. Besides observing
drawdowns during the pumping test, several other drainage-related phenomena were also
observed on the GPR profiles such as the development of a series of diffractions indicating
localized irregularities in water saturation, and the velocity pull-up of stratigraphic reflections
due to increased electromagnetic wave velocity in the overlying section. Comparing the GPR
profiling data and piezometer measurements, it was found that the drawdown of the transition
zone reflection was smaller and delayed relative to the measured hydraulic head drawdown.
Using the distance-drawdown relationship obtained from GPR profiling, the drained water
volume due to the downward movement of transition zone was estimated. It was reported
Springer
458 Water Resour Manage (2007) 21:427–467
that the results of this analysis accounted for only a fraction of the pumping well production
– approximately 45% on the first day and about 25% on the second day.
Lane et al. (2000) evaluated the suitability of common-offset ground-penetrating radar
(GPR) to detect free-phase hydrocarbons in bedrock fractures using numerical modeling and
physical experiments. The results of one- and two-dimensional numerical modeling at 100
MHz indicated that GPR reflection amplitudes are relatively insensitive to fracture apertures
ranging from 1 to 4 mm. The numerical modeling and physical experiments indicated that
differences in the fluids that fill fractures significantly affect the amplitude and the polarity of
electromagnetic waves reflected by sub-horizontal fractures. Furthermore, it was found that
it is possible to distinguish water-filled fracture reflections from air- or hydrocarbon-filled
fracture reflections, nevertheless subsurface heterogeneity, antenna coupling changes, and
other sources of noise will likely make it difficult to observe these changes in GPR field data.
Hence, the routine application of common-offset GPR reflection methods for detection of
hydrocarbon-filled fractures will be problematic.
Oldenborger et al. (2003) determined the spatial structure of hydraulic conductivity on a
controlled excavation of a glacial-fluvial sand and gravel deposit in the Fanshawe Delta area
of Ontario, Canada using GPR (Ground-Penetrating Radar) and permeameter. The hydraulic
conductivity field of a 45, 2, 3 m vertical exposure was characterized using constant-head
permeameter measurements performed on undisturbed horizontal sediment cores. GPR data
were collected along the excavation face in the form of both reflection and common midpoint
surveys. A comparison of geostatistical analyses of the permeameter measurements and the
radar data suggested that the horizontal correlation structure of radar stack velocity can
be used to directly infer the horizontal correlation structure of hydraulic conductivity. The
averaging nature of the common midpoint survey was manifest in the vertical correlation
structure of stack velocity, making it less useful. Furthermore, it was found that the radar
reflection data didn’t exhibit a spatial structure similar to that of hydraulic conductivity.
5. Need for future research and development
5.1. Remote sensing technology
The applications of RS technology in groundwater hydrology are very limited compared to
other fields of study because of its inherent limitations. Although there is growing interest in
exploring this technology, there is a long way to go in order to use RS technology effectively
for the development and management of vital groundwater resources. Based on the present
review, the focus of future advancements in RS technology should be in the following areas
of concern:� A general problem of using remote sensing in hydrological studies is that very few remotely
sensed data can be directly applied in hydrology, they measure only a part of electromagnetic
spectrum and different hydrological parameters are only inferred from them. Therefore,
there is an urgent need to improve the accuracy and reliability of remote sensing estimates,
which are highly uncertain until now (Beven, 2001). It could be possible by refining
analysis techniques as well as developing new and improved sensors and their applications
in conjunction with improved field measurements. New RS applications will emerge and
mature as new instruments and new types of data become available in the future.� The major constraint for the utility of RS in hydrogeology is that it can only detect changes
at the ground surface or a shallow layer (<1 m deep) of the earth, though the airborne explo-
ration of groundwater using electromagnetic prospecting sensors developed for the mineral
Springer
Water Resour Manage (2007) 21:427–467 459
industry is reported to map aquifers at depths greater than 200 m (Paterson and Bosschart,
1987). However, with the growing pollution and lowering of groundwater worldwide, it is
often necessary to explore deep aquifers in which case the usual remote sensing data are of
no use, except for the especially acquired data by GPR (Ground-Penetrating Radar) which
can penetrate up to about 20 m depth. Although ongoing research activities using GPR,
subsurface methods of groundwater investigations, and tracers are expected to enhance
our knowledge about complex and hidden subsurface processes, a routine use of any of
these techniques seems a long way off (Beven, 2001; Lane et al., 2000). Future research
should focus on the development of easy-to-use techniques to quantify subsurface water
storage and visualize fluid flow and transport processes in the subsurface environment.
Furthermore, in our quest to have more accurate and reliable non-invasive techniques for
monitoring subsurface processes as well as to combat the heterogeneity and anisotropy of
aquifer and vadose-zone systems, the RS technology offers the greatest promise. Future
advancements in RS technology in this direction will certainly revolutionize the hydroge-
ological thinking, theory and model development.� More and more RS-based groundwater studies together with field studies should be carried
out in order to examine the reliability of RS data. The combined use of multi-spectral data
obtained from different sensor systems is necessary to extract more and better information
(Engman and Gurney, 1991). Future research should also be directed towards developing
linkages between surface observations and subsurface phenomena. Such studies will not
only enhance and refine RS applications in groundwater hydrology, but will also signifi-
cantly contribute to the sensor development program.� There is a need to develop an optimal sensor system including both active and passive
microwave techniques for more effective soil-moisture monitoring. It will allow a range of
applications and the synergism of the two types of measurements to provide more useful
and new information (Jackson et al., 1999).� Recent developments in microwave remote sensing, theory and sensor availability have
resulted in new potential and capabilities. Very limited studies have revealed the potential
to extract/detect subsurface parameters and features using these techniques. More and more
research is required to refine and implement these approaches (Jackson, 2002). The multi-
temporal and spatial availability of microwave remote sensing data can complement the
monitoring and modeling of groundwater recharge. In addition, through the synergistic
use of earth’s gravity-field monitoring satellites (e.g., GRACE and CHAMP) data and
satellite microwave remote sensing data, it may be possible to monitor seasonal groundwater
recharge over large regions in the near future (Jackson, 2002). Future studies should be
carried out in this stimulating direction.� Last but not the least, there must be strong cooperation between space agencies and soil &
water scientists (e.g., soil scientists, hydrologists, hydrogeologists, and environmentalists)
for the planning and development of sensor systems, which will ensure timely implemen-
tation of suitable and efficient sensor systems for the effective mapping of land and water
resources. Such cooperation will undoubtedly lead to wide-scale research and applications
in the fields of hydrology and hydrogeology, which in turn will ensure efficient land and
water management by the promising remote sensing technique.
5.2. GIS technology
The present applications of GIS in groundwater hydrology have utilized only a few features
of GIS, and there exists large potential to exploit further. As noted by Watkins et al. (1996),
engineers and scientists have only just scratched the surface in GIS to improve groundwater
Springer
460 Water Resour Manage (2007) 21:427–467
modeling. Also, a number of GIS capabilities are to be developed for further enhancing the
groundwater modeling process. Considering the current status of GIS use in groundwater
hydrology, the following research and development needs for GIS technology are identified
in the future:� Several researchers have demonstrated that GIS, because of its sophisticated analysis and
graphics capabilities, can provide a powerful platform for developing GIS-based ground-
water and vadose zone models, calibrating and validating them, and presenting their results.
However, the most difficult task in this approach is the linking of models with GIS (Watkins
et al., 1996). Therefore, multi-disciplinary research is needed for the automation of link-
ing tasks and the development of customized and user-friendly GISs solely devoted to
subsurface flow and transport modeling (e.g., excellent compatibility between GIS and
groundwater models, availability of subroutine library to perform GIS functions, standard-
ized and versatile interfacing between GIS and models, more embedded spatial analysis
and GIS technology within groundwater and vadose zone models, advanced modeling and
simulation capabilities embedded in GIS, etc.). Research should also continue at a greater
pace to address the problems associated with user interface, database, and model-based
integration (Tsihrintzis et al., 1996; Watkins et al., 1996). Another active GI research area
is spatio-temporal modeling (Longley et al., 1998), which is domain specific and presents
a special demand in groundwater modeling. Modeling objects with partially known, inde-
terminate, or vague is another important GI research direction of interest to groundwater
modeling.� Future modeling efforts should address the issues pertaining to the unjustified precision and
the misrepresentation of accuracy involved in GIS-based groundwater modeling (Watkins
et al., 1996; Corwin et al., 1998). Concentrated research efforts are also required for much
better understanding of data structure and data analysis capabilities of GIS in order to ad-
dress other GIS-based modeling issues (e.g., parameter estimation, grid design and effects,
sensitivity and reliability analyses, etc.). In addition, a sound GIS education structure is
needed for the extensive and effective use of GIS technology (Marble, 1998).� Further research is necessary in the area of GIS-based distributed modeling with applica-
tions to groundwater and vadose-zone processes, which will ensure more efficient assess-
ments of groundwater pollution hazards (Loague and Corwin, 1998; Gogu et al., 2001).
To this end, enhanced spatial servers resting on extended relational database management
systems are needed as a means by which the vast amount of data necessary as input into
the models can be efficiently supplied to end users. However, besides the computational
burden, the most imposing barrier to the use of sophisticated mechanistic subsurface flow
and transport models for field-scale applications is obtaining adequate and reliable data.
According to Halford (2004), hydrogeologic understanding is limited currently by field
measurements, not by a lack of models. Thus, the greatest advancements are undoubtedly
required in the area of cost-effective and accurate measurements of scale-relevant input
and parameter data where a statistical knowledge of measuring uncertainty is also provided
(Corwin et al., 1997).� Integration of expert systems (ES) and spatial decision support systems (SDSS) with GIS
has not been much applied in water resources engineering in general and groundwater
hydrology in particular. This is an area of potential research to aid to the effective and
timely decision making concerning planning, design, analysis, operation and maintenance
of water resources systems (McKinney et al., 1992; Evans et al., 1993) as well as to greatly
reduce time and efforts required in traditional approaches. Such a system can automate the
process of solving regional water problems and help in selecting cost-effective management
Springer
Water Resour Manage (2007) 21:427–467 461
alternatives. Much of decision making can also be automated through the use of an expert
GIS. A crucial problem, however, is the integration of heterogeneous data sources in order
to support query answering and problem solving.� To provide a checklist for GIS users, research dealing with the comparison of various
available GIS software packages and their pros and cons is also required (Tsihrintzis et al.,1996). It will help select a suitable GIS software package as per the specific need and will
promote effective GIS applications in hydrology/hydrogeology.� Data availability and compatibility is still a problem in implementing and running any
GIS system, especially in developing nations. Davis et al. (1991) discuss some basic
scientific issues and research needs in the joint processing of remote sensing and GIS
data for environmental analysis. Of course, there is an urgent need that the RS and GIS
data for different regions of a country should be made available in ready-to-use formats
with good compatibility and at affordable price through centralized data banks. Such data
availability will certainly boost up wide-scale applications, analyses, and decision-making
processes.
6. Constraints for RS and GIS applications in developing nations
Based on the present review, it is evident that the groundwater studies using RS and GIS
techniques in developing countries including India have shown some new application areas,
but such studies are very limited. In addition, barring few, most studies are ad hoc in nature
and demonstrate merely the use of RS data and/or GIS software. Standard methodology
and the validation of RS- and GIS-based results with field data are usually missing. GIS-
based subsurface modeling is also highly restricted in developing nations, despite growing
knowledge-base in this field in some developing nations. The principal reasons behind the
limited and sub-standard applications of RS and GIS techniques in developing nations could
be the security restrictions on maps and RS data imposed by the government and their un-
availability for genuine uses (Narayana, 1999) as well as the scanty or lack of reliable field
data because of poor or sometimes no groundwater monitoring facilities. It is unfortunate
that while developed nations have started real-time groundwater monitoring using modern
techniques (Todd and Mays, 2005), most developing nations have no adequate and depend-
able groundwater-monitoring programs even by traditional means. Apart from these major
constraints, there are some more intricate problems related to the implementation of RS
and GIS techniques in developing nations such as: (i) non-availability of high-resolution RS
data for private, public and academic uses; (ii) poor data-distribution facility; (iii) high costs
of RS data; (iv) poor knowledge about these developing technologies; (v) lack of adequate
infrastructure, training, and support; (vi) insufficient skilled manpower in the government’s
planning and development departments; and (vii) expensive RS and GIS software packages
as well as their accessories.
The feasible and immediate solutions to some of the above constraints could be: (a)
development of a system to ensure faster accessibility and better distribution of RS data at
affordable price, (b) increasing awareness and proficiency in using RS and GIS techniques in
government and private sectors through proper training and support, and (c) enhancing and
updating infrastructure facilities to cope up with latest developments in these technologies.
Thus, besides the widespread availability of RS and GIS outputs in digital mode, there is a
need to evolve a well-coordinated program in this area with a focus on developing standard
methodologies and software as well as training and technology transfer on a wider scale.
Also, there is a need to introduce RS and GIS curricula at undergraduate and graduate levels
Springer

462 Water Resour Manage (2007) 21:427–467
to promote better education and training in these specialized fields. As far as the restrictions
of RS data are concerned, in view of liberal distribution and relatively easy accessibility of
RS data including the high-resolution data from some developed nations, it would be prudent
to remove or relax the security restrictions on the RS data and maps in developing nations,
except for very rare cases where national security may be jeopardized (Narayana, 1999).
Furthermore, there is an urgent need to develop adequate groundwater-monitoring facilities
on a regular and long-term basis throughout the country, and to boost up field investigations in
order to ensure effective applications of emerging RS and GIS technologies for the sustainable
development and management of vital but shrinking groundwater resources.
7. Conclusions and recommendations
The present paper succinctly highlights remote sensing (RS) and GIS technologies and
presents a state-of-the-art review on the application of these two emerging techniques in
groundwater hydrology. The detailed reviews presented in this paper indicated that the cur-
rent applications of RS and GIS techniques in groundwater hydrology are limited to six
areas: (i) exploration and assessment of groundwater resources, (ii) selection of artificial
recharge sites, (iii) GIS-based subsurface flow and pollution modeling, (iv) groundwater-
pollution hazard assessment and protection planning, (v) estimation of natural recharge dis-
tribution, and (vi) hydrogeologic data analysis and process monitoring. Although the use
of these techniques in groundwater studies has appreciably increased since early nineties,
the success rate has been very limited and most applications are still in their infancy. Con-
siderable basic research and developments are indispensable in the future for enhanced and
wide-scale applications of these two highly promising and economically viable techniques
in groundwater hydrology. More and more RS- and GIS-based applied groundwater re-
search is also required in conjunction with field investigations to effectively exploit the
expanding potential of RS and GIS technologies, which will perfect and standardize current
applications as well as evolve new approaches and applications in the future. Develop-
ing technologies like RS, GPS and GIS are really catalysts for innovative approaches to
currently unsolvable water resources problems. The constraints for RS and GIS applica-
tions in developing nations must be overcome to reap maximum benefits of these promising
technologies.
Finally, it is concluded that the remote sensing technology has great potential to revolu-
tionize groundwater monitoring and management in the future by providing unique and new
data to supplement the conventional field data. Rapidly expanding GIS technology will play
a central role in handling the voluminous spatio-temporal data and their effective interpreta-
tion, analysis, and presentation, though such applications will raise some new problems. The
daunting challenges ahead for the hydrogeologists/hydrologists are to map and/or visualize
subsurface flow and transport processes by RS technology, to efficiently interpret RS data as
well as to develop cost-effective and non-invasive field-measurement techniques in order to
expand groundwater hydrology in new and exciting directions. Such advancements will cer-
tainly enable us to develop and manage precious groundwater resources in a real sustainable
and environment-friendly way.
Acknowledgements The present work was financially supported by the Alexander von Humboldt (AvH)Foundation, Bonn, Germany in terms of research fellowship to the first author. The authors are very grateful tothe AvH Foundation for its financial support, which brought this work to fruition. The authors also gratefullyacknowledge the constructive comments of the two anonymous referees.
Springer
Water Resour Manage (2007) 21:427–467 463
References
Aber JD, Martin ME (1995) High spectral resolution remote sensing of canopy chemistry. In: Green RO (ed),Summaries of the Fifth Annual JPL Airborne Earth Science Workshop, AVIRIS Workshop, 23–26 January1995, Pasadena, California, Jet Propulsion Laboratory Vol. 1, pp 1–4
Adams TM, Tang AYS, Wiegand N (1993) Spatial data models for managing subsurface data. Journal ofComputation in Civil Engineering, ASCE 7(3):260–277
Almasri MN, Kaluarachchi JJ (2004) Implications of on-ground nitrogen loading and soil transformations onground water quality management. Journal of the American Water Resources Association 40(1):165–186
Aronoff S (1989) Geographic Information Systems: A Management Perspective. WDL Publications, OttawaBaker CP, Panciera EC (1990) A geographic information system for groundwater protection planning. Journal
of Soil and Water Conservation 45:246–248Baker CP, Bradley MD, Bobiak SMK (1993) Well head protection area delineation: linking flow model with
GIS. Journal of Water Resources Planning and Management, ASCE 119(2):275–287Barber C, Otto CJ, Bates LE, Taylor KJ (1996) Evaluation of the relationship between land-use changes and
groundwater quality in a water-supply catchment using GIS technology: the GWELUP Well field, WesternAustralia. Hydrogeology Journal 4(1):6–9
Basagaoglu H, Celenk E, Marino MA, Usul N (1997) Selection of waste disposal sites using GIS. Journal ofthe American Water Resources Association 33(2):455–464
Batelaan O, Smedt FD (2001) WetSpass: a flexible, GIS based, distributed recharge methodology for regionalgroundwater modeling. Proceedings of a symposium held during the Sixth IAHS Scientific Assembly atMaastricht, The Netherlands, July 2001, IAHS Publication 269, pp. 11–17
Beven KJ (2001) Rainfall-Runoff Modeling: The Primer. John Wiley & Sons Ltd., Chichester pp. 297–306.Bobba AG, Bukata RP, Jerome, JH (1992) Digitally processed satellite data as a tool in detecting potential
groundwater flow systems. Journal of Hydrology 131(1-4):25–62Boutt DF, Hyndman DW, Pijanowski BC, Long DT (2001) Identifying potential land use-derived solute sources
to stream baseflow using groundwater models and GIS. Ground Water 39(1):24–34Brunner P, Bauer P, Eugster M, Kinzelbach W (2004) Using remote sensing to regionalize local precipitation
recharge rates obtained from the Chloride Method. Journal of Hydrology 294:241–250Burrough PA (1986) Principles of Geographical Information Systems for Land Resources Assessment. Oxford
University Press, Oxford 193 ppCamp CV, Brown MC (1993) GIS procedure for developing three-dimensional subsurface profile. Journal of
Computation in Civil Engineering, ASCE 7(3):296–309Campbell JB (1996) Introduction to Remote Sensing. Taylor and Francis, London pp. 1–21Carroll TR (1981) Airborne soil moisture measurements using natural terrestrial gamma radiation. Soil Science
132:358–366Cherkauer DS (2004) Quantifying ground water recharge at multiple scales using PRMS and GIS. Ground
Water 42(1):97–110Chowdary VM, Rao NH, Sarma PBS (2003) GIS-based decision support system for groundwater assessment
in large irrigation project areas. Agricultural Water Management 62:229–252Chowdhury A, Jha MK, Machiwal D (2003) Application of remote sensing and GIS in groundwater studies:
an overview. Proceedings of the International Conference on Water & Environment (WE-2003). GroundWater Pollution, 15–18 December, 2003, M.P., India pp. 39–50
Clarke K (2001) Getting Started with Geographic Information Systems. 3rd edition, Prentice Hall, NJClarke R (1991) Water: The International Crisis. Earthscan Publications Ltd., London, 193 ppCorwin DL, Loague K, Ellsworth TR (1998) GIS-based modeling of nonpoint source pollutants in the vadose
zone. Journal of Soil and Water Conservation 53(1):34–38Corwin DL, Vaughan PJ, Loague K (1997) Modeling nonpoint source pollutants in the vadose zone with GIS.
Environmental Science and Technology 31(8):2157–2175Davis FW, Quattrochi DA, Ridd MK, Lam S, Walsh SJ, Michaelson JC, Franklin J, Stow DA, Johannsen
CJ, Johnston CA (1991) Environmental analysis using integrated GIS and remotely sensed data: someresearch need and priorities. Photogrammetric Engineering and Remote Sensing 57(6):689–697
De Villiers M (2000) Water: the Fate of Our Most Precious Resource. Mariner Books, Houghton, Mifflin,Boston
Deckers F, Te Stroet CBM (1996) Use of GIS and database with distributed modeling. In: Abbott MB,Refsgaard JC (eds), Distributed Hydrological Modeling, Kluwer Academic Publishers, Dordrecht, pp.215–232
DeMers MN (2000) Fundamentals of Geographic Information Systems. 2nd edition, John Wiley & Sons, Inc.,New York
Springer

464 Water Resour Manage (2007) 21:427–467
DeVantier BA, Feldman AD (1993) Review of GIS applications in hydrologic modeling. Journal of WaterResources Planning and Management, ASCE 119(2):246–261
Dixon B (2004) Prediction of ground water vulnerability using an integrated GIS-based Neuro-Fuzzy tech-niques. Journal of Spatial Hydrology 4(2):1–38
Dubey OP, Sharma DC (2002) Integrated remote sensing and factor analytic GIS model for evaluating ground-water pollution potential. www.GISdevelopment.net (accessed on July 24, 2003)
Edet AE, Okereke CS, Teme SC, Esu EO (1998) Application of remote sensing data to groundwater exploration:a case study of the cross-river state, Southeastern Nigeria. Hydrogeology Journal, 6:394–404
Elango L, Arrikkat S (1998) Groundwater recharge studies in Ongur subbasin, south India using geographicalinformation system. Proceedings of the 3rd International Conference on Hydroinformatics, 24–26 August1998, Copenhagen, Denmark Vol. 1, pp. 505–510
El-Kadi AI, Oloufa AA, Eltahan AA, Malik HU (1994) Use of a geographic information system in site-specificground-water modeling. Ground Water 32(4):617–625
Endres AL, Clement WP, Rudolph DL (2000) Ground penetrating radar imaging of an aquifer during a pumpingtest. Ground Water, 38(4):566–576
Engman ET, Gurney RJ (1991) Remote Sensing in Hydrology. Chapman and Hall, London, 225 ppEvans BM, Myers WL (1990) A GIS-based approach to evaluating regional groundwater pollution potential
with DRASTIC. Journal of Soil and Water Conservation 45:242–245Evans TA, Djokic D, Maidment DR (1993) Development and application of expert geographic information
system. Journal of Computation in Civil Engineering, ASCE 7(3):339–353Falkenmark M, Lundqvist J (1997) World Freshwater Problems – Call for a New Realism. UN/SEI, New
York/Stockholm, 53 ppFarnsworth RK, Barret EC, Dhanju MS (1984) Application of Remote Sensing to Hydrology including Ground
Water. IHP-II Project A. 1.5, UNESCO, ParisFaust N, Anderson WH, Star JL (1991) Geographic information systems and remote sensing future computing
environment. Photogrammetric Engineering and Remote Sensing 57(6):655–668Fayer MJ, Gee GW, Rockhold ML, Freshley MD, Walters TB (1996) Estimating recharge rates for a ground-
water model using a GIS. Journal of Environmental Quality 25:510–518Flockhart DE, Sham CH, Xiao Y (1993) Maximizing the value of information for ground-water protection:
three test cases. Water Resources Bulletin, AWRA 29 (6):957–964Foster S (1998) Groundwater: assessing vulnerability and promoting protection of a threatened resource.
Proceedings of the 8th Stockholm Water Symposium, 10–13 August, Sweden, pp. 79–90Gogu RC, Carabin G, Hallet V, Peters V, Dassargues A (2001) GIS-based hydrogeological databases and
groundwater modeling. Hydrogeology Journal 9:555–569Goodchild MF (1992) Geographical information science. International Journal of Geographical Information
Systems 6(1):31–45Goodchild MF (1993) The state of GIS for environmental problem-solving. In: Goodchild MF, Parks BO,
Steyaert LT (eds), Environmental Modeling with GIS, Oxford University Press, New York, pp. 8–15Gossel W, Ebraheem AM, Wycisk P (2004) A very large scale GIS-based groundwater flow model for the
Nubian sandstone aquifer in Eastern Sahara (Egypt, northern Sudan and eastern Libya) HydrogeologyJournal 12(6):698–713
Goyal S, Bharadwaj RS, Jugran DK (1999) Multicritaria analysis using GIS for ground water resource evalu-ation in Rawasen and Pilli watersheds, U.P., India. www.GISdevelopment.net (accessed on Dec. 7, 2002)
Griner AJ (1993) Development of a water-supply protection model in a GIS. Water Resources Bulletin, AWRA29(6):965–971
Hadithi MA, Shukla DC, Israil M (2003) Evaluation of groundwater resources potential in Ratmau-PathriRao watershed Haridwar district, Uttaranchal, India using geo-electrical, remote sensing and GIS tech-niques. Proceedings of the International Conference on Water and Environment (WE-2003), Bhopal,India, Ground Water Pollution pp. 123–125
Halford KJ (2004) More data required. Ground Water 42(4):477Hall MD, Shaffer MJ, Waskom RM, Delgado JA (2001) Regional nitrate leaching variability: what makes a
difference in northeastern Colorado. Journal of the American Water Resources Association 37(1):139–150Halliday SL, Wolfe ML (1991) Assessing groundwater pollution potential from nitrogen fertilizer using a
GIS. Water Resources Bulletin, AWRA 27(2):237–245Hammen JL, Gerla PJ (1994) A geographic information-systems approach to wellhead protection. Water
Resources Bulletin, AWRA 30(5):833–840Heilman JL, Moore DG (1981) Groundwater applications of the Heat Capacity Mapping Mission. Satellite
Hydrology, AWRA, Minneapolis, MN pp. 446–449Herzog BL, Larson DR, Abert CC, Wilson SD, Roadcap GS (2003) Hydrostratigraphic modeling of a complex,
glacial-drift aquifer system for importation into MODFLOW. Ground Water 41(1):57–65
Springer
Water Resour Manage (2007) 21:427–467 465
Hinamann KC (1993) Use of a geographic information system to assemble input-data sets for a finite differencemodel of groundwater flow. Water Resources Bulletin, AWRA 29(3):410–416
Hinton JC (1996) GIS and remote sensing integration for environmental applications. International Journal ofGeographical Information Systems 10(7):877–890
Hudak PF, Loaiciga HA, Schoolmaster FA (1993) Application of geographic information systems to ground-water monitoring network design. Water Resources Bulletin, AWRA 29(3):383–390
Hudak PF, Speas RK, Schoolmaster FA (1995) Managing underground-storage tanks in urban environments– A geographic information-systems approach. Water Resources Bulletin, AWRA 31(3):439–445
IWMI (2001) The Strategic Plan for IWMI 2000–2005. International Water Management Institute (IWMI),Colombo, Sri Lanka, 28 pp
Jackson TJ (2002) Remote sensing of soil moisture: implications for groundwater recharge. HydrogeologyJournal 10:40–51
Jackson TJ, Engman ET, Schmugge TJ (1999) Microwave observations of soil hydrology In: Parlange MB,Hopmans JW (eds), Vadose Zone Hydrology: Cutting Across Disciplines. Oxford University Press, Inc.,New York, pp. 317–333
Jensen JR (2000) Remote Sensing of the Environment: An Earth Resource Perspective. Prentice-Hall, Inc.,Upper Saddle River, NJ
Jyrkama MI, Sykes JF, Normani SD (2002) Recharge estimation for transient ground water modeling. GroundWater 40(6):638–648
Kamaraju MVV, Bhattacharya A, Reddy GS, Rao GC, Murthy GS, Rao TCM (1995) Groundwater potentialevaluation of West Godavari District, Andhra Pradesh State, India – A GIS approach. Ground Water34(2):318–325
Krishnamurthy J, Kumar NV, Jayaraman V, Manivel M (1996) An approach to demarcate groundwater potentialzones through remote sensing and a geographic information system. International Journal of RemoteSensing 17(10):1867–1884
Lachassagne P, Wyns R, Berard P, Bruel T, Chery L, Coutand T, Desprats J-F, Strat PL (2001) Exploitation ofhigh-yields in hard-rock aquifers: downscaling methodology combining GIS and multicriteria analysis todelineate field prospecting zones. Ground Water 39(4):568–581
Lamble P, Fraser D (2002) Creation of a GIS-based predictive model for groundwater in the Murray ValleyIrrigation Region (NSW) Cartography 31(1):234–242
Lane JW, Buursink ML, Haeni FP, Versteeg RJ (2000) Evaluation of ground-penetrating radar to detect free-phase hydrocarbons in fractured rocks: results of numerical modeling and physical experiments. GroundWater 38(6):929–938
Lasserre F, Razack M, Banton O (1999) A GIS-linked model for the assessment of nitrate contamination ingroundwater. Journal of Hydrology 224:81–90
Laurent F, Anker W, Graillot D (1998) Spatial modelling with geographic information systems for determi-nation of water resources vulnerability application to an area in Massif Central (France) Journal of theAmerican Water Resources Association 34(1):123–134
Lillesand TM, Kiefer RW (2000) Remote Sensing and Image Interpretation. Fourth Edition, John Wiley &Sons, Inc., New York, pp. 724
Lo CP, Yeung AKW (2003) Concepts and Techniques of Geographic Information Systems. Prentice-Hall ofIndia Pvt. Ltd., New Delhi pp. 492
Loague K, Corwin DL (1998) Regional-scale assessment of non-point source groundwater contamination.Hydrological Processes 12(6):957–966
Longley PA, Brooks SM, McDonnell R, Macmillan B (eds) (1998) Geocomputation: A Primer, John Wiley& Sons Ltd., Chichester, pp. 290
Marble DF (1998) Urgent need for GIS technical education: rebuilding the top of the pyramid. ARC News,20(1):01.
Maslia ML, Aral MM, Williams RC, Susten AS, Heitgerd JL (1994) Exposure assessment of populations usingenvironmental modeling. demographic-analysis, and GIS. Water Resources Bulletin. AWRA 30(6):1025–1041
McKinney DC, Maidment DR, Tanriverdi M (1992) Expert geographic information systems for Texas waterplanning. Journal of Water Resources Planning and Management ASCE 119(2):170–183.
Meijerink AMJ (2000) Groundwater. In: Schultz GA, Engman ET (eds), Remote Sensing in Hydrology andWater Management. Springer, Berlin, pp. 305–325
Musa KA, Akhir JM, Abdullah I (2000) Groundwater prediction potential zone in Langat Basin using theintegration of remote sensing and GIS. www.GISdevelopment.net (accessed on July 24, 2003)
Myers VI, Moore DG (1972) Remote sensing for defining aquifers in glacial drift. Proceedings of the 8thInternational Symposium on Remote Sensing of the Environment, Environmental Research Institute ofMichigan, Ann Arbor, MI, pp. 715–728
Springer
466 Water Resour Manage (2007) 21:427–467
Narayana LRA (1999) Remote sensing and its applications. Universities Press (India) Ltd., Hyderabad, pp.215
Nefedov KE, Popova TA (1972) Deciphering of groundwater from aerial photographs. Amerind, New DelhiOldenborger GA, Schincariol RA, Mansinha L (2003) Radar determination of the spatial structure of hydraulic
conductivity. Ground Water 41(1):24–32.Paterson NR, Bosschart RA (1987) Airborne geophysical exploration for groundwater. Ground Water 25:41–
50.Pinder GF (2002) Groundwater Modeling Using Geographical Information Systems. John Wiley & Sons, New
York, pp. 248Ramalingam M, Santhakumar AR (2002) Case study on artificial recharge using remote sensing and GIS.
www.GISdevelopment.net (accessed on June 25, 2003)Rampal KK, Rao KVG (1989) Groundwater targeting using digitally enhanced imagery. www.GISdevel-
opment.net (accessed on July 24, 2003)Revzon AL, Burleshin MI, Krapilskaya NM, Sadov AV, Svitneva TV, Semina NS (1983) Study of the desert
geological environment with the aid of aerial and space imagery. All-Union Sci. Res. Inst. Hydrol. Eng.Geol., Moscow
Rhind D (1989) Why GIS? ARC News, Vol. 11, No. 3, ESRI, Inc., Redlands, CARichards CJ, Roaza H, Roaza RM (1993) Integrating geographic information systems and MODFLOW for
ground water resource assessments. Water Resources Bulletin, AWRA 29(5):847–853Rifai HS, Hendricks LA, Kilborne K, Bedient PB (1993) A geographic information system (GIS) user interface
for delineating wellhead protection areas. Ground Water. 31(3):480–488Roaza H, Roaza RM, Wagner JR (1993) Integrating geographic information systems in groundwater applica-
tions using numerical modeling techniques. Water Resources Bulletin. AWRA 29(6):981–988Ross MA, Tara PD (1993) Integrated hydrologic modeling with geographic information systems. Journal of
Water Resources Planning and Management, ASCE 119(2):129–141Salama RB, Ye L, Broun JL (1996) Comparative study of methods of preparing hydraulic-head surfaces and
the introduction of automated hydrogeological-GIS techniques. Journal of Hydrology 185(1–4):115–136Salama RB, Tapley I, Ishii T, Hawkes G (1994) Identification of areas of recharge and discharge using
Landsat-TM satellite imagery and aerial photography mapping techniques. Journal of Hydrology 162(1–2):119–141
Sander P, Chesley MM, Minor TB (1996) Groundwater assessment using remote sensing and GIS in a ruralgroundwater project in Ghana: lessons learned. Hydrogeology Journal 4(3):40–49
Saykawlard S, Das Gupta A, Eiumnoh A, Chen X (2005) Prediction of subsurface water level change fromsatellite data. Hydrological Processes 19(4):947–954
Schaepman M, Itten KI, Schlapfer D, Kurer D, Varaguth S, Keller J (1995) Extraction of ozone and chlorophyll:a distribution from AVIRIS data. In: Green RO (ed), Summaries of the Fifth Annual JPL AirborneEarth Science Workshop, AVIRIS Workshop, 23-26 January 1995, Pasadena, California, Jet PropulsionLaboratory, Vol. 1, pp. 149–152
Schultz GA (1988) Remote sensing in hydrology. Journal of Hydrology 100:239–265Schultz GA (1993) Application of GIS and remote sensing in hydrology. In: Kovar K, Nachtnebel HP (eds),
Application of Geographic Information Systems in Hydrology and Water Resources Management, IAHSPub. No. 211, pp. 127–140
Shahid S, Nath SK (2002) GIS integration of remote sensing and electrical sounding data for hydrogeologicalexploration. Journal of Spatial Hydrology 2(1):1–10
Shih SF, Jordan JD (1990) Remote-sensing application to well monitoring. Journal of Irrigation and DrainageEngineering ASCE 116(4):497–507
Shivraj PV, Jothimani P (2002) GIS based software solution for groundwater studies: GWIS.www.GISdevelopment.net (accessed on June 25, 2003)
Shukla S, Mostaghimi S, Shanholtz VO, Collins MC (1998) A GIS-based modeling approach for evalu-ating groundwater vulnerability to pesticides. Journal of the American Water Resources Association,34(6):1275–1293
Sikdar PK, Chakraborty S, Adhya E, Paul PK (2004) Land use/land cover changes and groundwater potentialzoning in and around Raniganj coal mining area, Bardhaman District, West Bengal: A GIS and remotesensing approach. Journal of Spatial Hydrology 4(2):1–24
Simonett DS (1983) The development and principles of remote sensing. In: Colwell RN (ed), Manual ofRemote Sensing. The American Society of Photogrammetry, VA pp. 1–35
Singh AK, Prakash SR (2002) An integrated approach of remote sensing, geophysics and GIS toevaluation of groundwater potentiality of Ojhala sub-watershed, Mirjapur district, U.P., India.www.GISdevelopment.net (accessed on June 25, 2003)
Springer
Water Resour Manage (2007) 21:427–467 467
Singh AK, Raviprakash S, Mishra D, Singh S (2002) Groundwater potential modeling in ChandraprahaSubwatershed, U.P. using remote sensing, geoelectrical, and GIS. www.GISdevelopement.net (accessedon June 25, 2003)
Slama CC (ed) (1980) Manual of Photogrammetry. American Society of Photogrammetry, Falls Church, VASmith JT (ed) (1968) Manual of color aerial photography. American Society of Photogrammetry, Falls Church,
VASrivastava A (2002) Aquifer geometry, basement topography and groundwater quality around Ken Graben,
India. Journal of Spatial Hydrology 2(2):1–8Stafford DB (ed) (1991) Civil engineering applications of remote sensing and geographic information systems.
ASCE, New YorkStone DB, Moomaw CL, Davis A (2001) Estimating recharge distribution by incorporating runoff from
mountainous areas in an alluvial basin in the Great Basin region of the southwestern United States.Ground Water 39(6):807–818
Szilagyi J, Harvey FE, Ayers JF (2003) Regional estimation of base recharge to ground water using waterbalance and a base-flow index. Ground Water 41(4):504–513
Szilagyi J, Harvey FE, Ayers JF (2005) Regional estimation of total recharge to ground water in Nebraska.Ground Water 43(1):63–69
Teeuw RM (1995) Groundwater exploration using remote sensing and a low-cost geographical informationsystem. Hydrogeology Journal 3(3):21–30
Todd DK (1980) Groundwater hydrology. 2nd edition, John Wiley & Sons NY, pp. 111–163.Todd DK, Mays LW (2005) Groundwater hydrology. 3rd edition, John Wiley & Sons, NJ, pp. 636Tomlinson RF (1984) Geographic information system: a new frontier. Operational Geographer 5:31–35Travaglia C, Ammar O (1998) Groundwater exploration by satellite remote sensing in the Syrian Arab Republic.
www.fao.org (accessed on June 25, 2003)Tsakiris G (2004) Water resources management trends, prospects and limitations. Proceedings of the EWRA
Symposium on Water Resources Management: Risks and Challenges for the 21st Century, 2–4 September2004, Izmir, pp. 1–6
Tsihrintzis VA, Hamid R, Fuentes HR (1996) Use of geographic information systems (GIS) in water resources:a review. Water Resources Management 10:251–277
USGS (1997) Geographic Information Systems. An Information Brochure, USGS, Reston, VAVan de Griend AA, Camillo PJ, Gurney RJ (1985) Discrimination of soil physical parameters, thermal inertia
and soil moisture from diurnal surface temperature fluctuations. Water Resources Research 21:997–1009Van Der Laan F (1992) Raster GIS allows agricultural suitability modeling at a continental scale. GIS World,
October, pp. 42–50Vasanthakumaran T, Shyamala R, Sridhar K (2002) Role of remote sensing and GIS in identifying artificial
recharge zones of upper Kolavarnar river basin, Tamil Nadu. www.GISdevelopment.net (accessed on June25, 2003)
Waters P, Greenbaum P, Smart L, Osmaston H (1990) Applications of remote sensing to groundwater hydrology.Remote Sensing Review 4:223–264
Watkins DW, McKinney DC, Maidment DR, Lin MD (1996) Use of geographic information systems in ground-water flow modeling. Journal of Water Resources Planning and Management, ASCE 122(2):88–96
Wylie BK, Shaffer MJ, Brodahl MK, Dubois D, Wagner DG (1994) Predicting spatial distributions of nitrateleaching in northeastern Colorado. Journal of Soil and Water Conservation 49(3):288–293
Zhang H, Haan CT, Nofziger DL (1990) Hydrologic modeling with GIS: An overview. Applied Engineeringin Agriculture, ASAE 6(4):453–458
Springer


