
! apens
I Ground borne vibration from pilingby PJ Whyley'nd Prof RW Sarsby
IntroductionVibration from piling operations will always be of a temporary naturebut the disturbance caused may result in substantial nuisance to thesurrounding population and permanent damage to property. Eitherfactor might lead to restraints on the working method that result in
additional costs or even, in extreme circumstances, curtailment ofactivity. The Control of Pollution Act (1974)gives local authoritiesvery wide ranging powers with regard to construction vibrations.Part 4 of the revised standard BS 5228 (1991)was formulatedspecifically to cover ground vibrations from construction operationsand should provide particular benefit regarding piling inducedvibrations.
It is vital for the feasibility of piling works to be assessed at allstages in the development of a site (ie concept, design, tender,construction). There is a lack of definitive guidance from whichvibrations can be predicted, probably because of the complexity ofthe inter-relationships between ground and pile. A suggestedmethod of predicting the probable level of vibrations from pilingoperations at any site is given below. Information on a number ofvibration measurements made in the vicinity of driven piling areprovided from case histories. A range of energy inputs, ground
'anstock Geotechnical Consultancy Services, Manchester, UK.E Bolton Institute, Lanes, UK.
conditions and penetration configurations are covered by thespectrum of results.
DefinitionsFor many practical purposes, especially when empirical'acceptability'riteria are being used, vibrations are described ascontinuous (or steady state), intermittent, and impulsive (ortransient). The three classes are defined in BS6472: 1974. Impactpiling produces transient vibrations, whereas a continuous vibrationarises from the use of vibro or resonant drivers. Only the former arediscussed here.
A vibration is a time varying quantity which may be representedas: the displacement of a point (amplitude); the rate of change ofdisplacement (particle velocity), or the rate of change of velocity(particle acceleration). The terms used in vibration studies and therelationships between them are given in BRE Digest 117(1970).The aforementioned parameters can be derived from one anothergiven information on frequency content.
Particle velocity is conventionally adopted in construction as adamage threshold parameter based on USBM work (mainly relatingto blasting vibrations). This work concluded that a given degree ofdamage for a structure was most closely related to the magnitude ofthe peak particle velocity of the ground motion at the structure.
The complete vibration system consists of a source, a pathwayand a receptor. Each part of the system alters the characteristics ofvibration. In this paper, only the generation and propagation ofground vibrations are discussed. Structural and human response isnot covered. No British or international standard defines precisevibration thresholds for damage to structures. However, someguidance on critical levels of vibration is given in Figure 1.Some
KEY
I- CONPARISON OF THRESHOLO VALUES FOR RELAllVELYNEW, FAIRLY SOUNO, RESIOWITIAL STRUCTURES.
te tencaaoLE )a»CKS
PEAK PAATICLE VELD»TT IU»f»V)
8 S
te oasaoa i vnoast»LO
I—"
I
sacs INAJDA oasaoa
Fts SVKI t»t VTL Clk V tlaef t»TOI
~~~»a ) eau»»I
Fwa
Icsacet»
Isaseussasaoa
EO»fltO~AFE IAUWON
IDAWOE ICRVJIW
Ua RUA JRVSAFE cAUTloN
IHwoll
IHalos IIUR
OENENALLTPEIKEPTksLE
NOOANAOE
UI»SARAOLE Sr»N»HSW SUKO»os
~HaLL csact»
SL»HT DaukoaI TO SUILOWOS
csacKE wNk » WkLLS
UOHTOANAOEI
I
w»LL I SL»m a»casCt»CKP W WALLS
CANOEA
D ESTIIUCTKNI OF DWELL WOE
I
oasr»eves
samI
caunc»
IDESTIIIICTK»
'JELIRIICIWVVASKWU Pat SCARF W fr
'lslaaCcfasl»IW OF HSURS PUP Rr
'CRA»EURICVEA Vkl,tas
'Sfln fs» PLFIOVIVERSKWCFVORJRPF IPRT
'Itocfflxwvsllstw cf'»NAIF Awr
CHILD»OS COHTAI»HOSENWWVE EOUIPNENT
Aasealmaa I OENEII ~L
STHUCSRIES I CIWNEIIC»L STIIUCT
FON LOCEESOFT SOIL
Foll NEOIUN SOIL
~01 Ilaso SOIL
STRUCTUEES OF
IsUSE coNDTW
)erose os I Hasot»vSENSITIVE I WALLS
»ETDIHc I OLSLDINSP vw»LT I smumusau.v ~ I »DvsT»AL~ ANCIENT I DkNAOEO I SOUND WNLINNOS ~ I SUILDINOS
J I
I I I
OLDEII HONES. PtksTER I g NOOESN»WESON WOOD LATH WTEII»I» I I DRYWALL INTEAIONS
OLO OESIOENOAL OELATWELT OUI l»IATWELT NEW
vaavsoosta»srra» Fooscoswres sousootseml»
ANCWNT 1NO I NOUSWO IN ~~~ I SOUND SENVICESHomse
I Pol» OEPA» I aso svsucvusas
NUSEUN STNUCTUIIES UOHT ~ NOSNAL SLOCK»IDEE»sss CONCR g OFFLATS
»sn»e os Nasot»v I cot»sara I sme. DsSENsmva wkLLs I ETNUcTUAEE
I sea»Vcr
ICONCIIEIE STEEL OA
ST1tlCTUIIES SC STHUCT
pklwasfs la srwol
'IUIUSIW fsNEW»IOUKUTRW CN fltRD ROCK Nfoar DWH ttCR SIAIIWO
NAP» KI HoteED Hsflt IftttfSIVSO
TAWFC Oll UJCHNR POPPED VOI4ITfoVfaslasl
3g Figure I:Damage criteria for various structures.
GROUND ENGINEERING MAY 1992
PEkK PkSTICLE VELOCITY I tR»t)

data given in the figure are conservative. These criteria should notbe regarded as rigid rules but should be expertly interpreted withregard to specific site conditions.
Generation and propagation of groundvibrationThe variables relating to generation of ground vibration may besummarised under the three headings of hammer type, pile type andsoil type. The authors consider hammer type and pile type to be theleast significant of the three. The task of predicting ground vibrationpropagation from pile driving is complicated by the variability andinhomogeneity of the soil. Even if uniform soil properties areassumed, the mathematical formulation of such problems is stillquite complex. Often, simplified models are employed to gain auseful insight; for example, the soil may be represented as an elastichalf-space or as a layered medium (Skipp 1984).
Soil is an elasto-plastic material. Since a suitable equation forvibration propagation cannot be derived for such a material, apropagation is assumed of the form:
100
EE
I—508
)4JU
m5C
w 20
10-
5-
2-
KEY
DATA FOR SHEET PILING.
SOIL STIFFNESS:-+ STIFF OR DENSEo SOFT OR LOOSE
~ ~a~ SUGGESTED UPPER BOUNDS
.rV=1 SaE/r UPPER BOUND
FOR STIFF OR DENSE SOILS
.rr'0 75rlE/r UPPER BOUND
FOR FIRM TO STIFF OR
MEDIUM DENSE SOILS
+ ~
V=O 25EE/r UPPER BOUND
FOR SOFT OR
LOOSE SOILS
ELOPE OF RESULTSSITE A.
DIUM DENSE SOIL)
PE OF RESULTSTE B.TO STIFF SOIL)
V = C.E"/r'here V = peak particle velocityE = energyr = distance between source and receiverC, x, y = constants
This equation is selected on the basis of theoretical analyses of:
052 20
SCALED DISTANCE 0 o.s/m)100
(a) ideal continua — elastic wave propagation and preferentialgeneration of Rayleigh waves.intuitively it is expected that vibration levelincreases with increasing driving energy anddecreasing distance from the source.
(c) field data — defining suitable values for the constants.
(b) logic—
Martin (1980) stated that a propagation law of the form: V a E 'r"is often assumed, where the distance is considered equal to radialdistance (measured horizontally) as surface or Rayleigh waves arethe main provider of vibration. The constant 'x's said to take intoaccount both geometrical and internal damping. The value of 'x'susuaUy taken between 0.5 and l.5. The constant of proportionality(C) is probably influenced by soil conditions and/or source of energy(ie hammer or pile type). Attewell and Farmer (1973) suggest anupper bound value of l.5 for sheet piles and 0.75 for other piles (SIunits with velocity in mm/sec) with constant 'x'iven as 1.0and 'y's
0.5.Velocity might be plotted for any of three orthogonal components
or for their resultant. Results might also be compared using otherpropagation laws (Wiss 1981, Clough 5 Chameau 1980, Mallard tIE
Bastow 1979). However, adoption of a consistent method of plottingdata will enable best use to be made of published work. It issuggested by the authors that peak particle velocity should beplotted as ordinate ag~st 'Scaled Distance'E /r' as abscissa onlogarithmic scales, in which case near straight line relationshipsshould be obtained (Attewell 5 Farmer 1973). Effort should beconcentrated on the assessment of vertical vibrations since:(a) they are considered to be the most damaging to structures, andsince(b) humans are more sensitive to vertical vibration (particularlywhen in a sitting or standing position), result in greaterdisconcertion.
When adopting the suggested propagation plotting method, the
Iauthors'xperiences are that results are similar for hammers of
Figure 2: Sheet piling data —rationalised plot.
differing type and energy for the same soil type and radial distance.This has been borne out particularly by the data recorded at sites Aand B referred to below. A slight difference in attenuation gradient isnoted in published data between clay soils and more granular soils.However, most of the scatter in the data is probably a result of thevariation in relative density or consistency, looser or softer soilsallowing easier penetration when little of the energy is impartedfrom the pile as ground borne vibration. For stiff or dense soils,penetration is harder for the same energy input, and most of theenergy is imparted from the pile.
Some particular references offer discussions of pile type, hammertype, and soil type. Results from other published work add littleknowledge to attenuation characteristics on the particular sites, thedata being a collection of a small number of readings at each site.The amount of detail of data recorded in published work is extremelyvariable and often hammer type and soil type are not recorded. Theresults in the references indicate a wide scatter, however, aII lieessentially below the upper bound given by Attewell and Farmer forsheet piling (1973).
Figure 2 presents results from published data (sheet piling)where relative density or consistency has been reported. Envelopesof data for sheet piling from specific case histories (reported below)are also given together with a number of results (undifferentiated)recorded by the authors for a variety of ground conditions. The keyto Figure 2 gives information on soil type but does not distinguishbetween hammer type (considered to be relatively insignificant).The mode of vibration measured is either vertical or unreported.Based on this data, the authors'uggested upper bounds for peakparticle velocity are given on the figure for varying degrees of 'soilstiffness'. The constant of proportionality (C) is here a function ofsoil type rather than pile type which was proposed by Attewell andFarmer (1973).
GROUND ENGINEERING MAY 1992
33

100
50E
(c)
820-
(b)
10-0I-ft:
hC
(a)
KEY
LINE QI
LINE Q2
LINE Q3
V= 1.5V E /r upper bound for stiffor dense soils
V= 0.75VE /r upper bound for firmto stiff or medium dense soilsV= 0.25 V E /r upper bound for softor loose soils
EXAMPLE:
Suggested damage criteriafor relatively new, fairlysound, residential structures.
(a) No problem(b( Further investigation required(cI Traditional impulse driving
not recommended
1,000
300
200
100(5
0.52 5 10 20 50 100
SCALED DISTANCE (J /m)
Figure 3 is presented as a predictive tool. The graph isparticularly applicable to sheet piling because the source data isprimarily for that pile type. The graph has also been used by theauthors for other pile types (eg driven precast concrete). The figuregives an example to show how it might be used. It is impossible toobtain a precise and unique prediction for ground borne vibrationvelocity and the figure is proposed to allow sites to be split, withconfidence, into three categories:(a) no problem;(b) further investigation required;(c) traditional impulsive driving not recommended.
This could then lead to the following consequences:(a) proceed with the work;(b) obtain specific vibration data in order to 'calibrate'he site, egconduct a trial drive or drop a large weight into the ground andmeasure the resulting vibrations, and thereafter derive site specificrelationships;(c) redesign the works.
Some case histories are discussed below.
30
20
10
Figure 3:Predictive plot
EXAMPLE:For a site using a BSP- B35hammer (energy per blow8850kg. m) find potential vibration level at new residentialstructures 15m distant, when driving through firm to stiffand medium dense soil.
SOLUTION:Follow 8850kg.m energy line to distance of15m. Draw linevertically upwards through 'Scaled Distance'axis to meetline for firm to stiff and medium dense soils (ie line 4).Draw horizontal line to PPV axis giving upper bound of15mm/s. Furtherinvesti gati on and/or site calibration isrequired. Alternatively use a lighter hammer or alternative
34 construction technique.
GROUND ENGINEERING MAY 1992
Instrumentation used in case historiesFor sites A and C vibration measurements were taken using a Brueland Kjaer Integrating Vibration Meter Type 2513 with anaccelerometer Type 4332 attached by a screw thread to a metalprobe. This probe comprised a 9mm diameter 230mm long spikewith a20mm x 20mm x 60mm block at its head, with holesthreaded in three mutually perpendicular directions for attachmentof accelerometers.
For site B, vibration data was recorded generally from a Bruel andKjaer 2511 Vibration meter, with tunetable band pass filter and anaccelerometer package. The probe used was similar to that for theother sites. Results are also included from other meters, typeunknown.
Site AGeneralSheet piling was undertaken for a cofferdam as part of a temporaryworks for the construction of a sewer tunnel. Site investigation dataindicated ground conditions at the cofferdam to be essentially 1m ofloose fill over 8m of medium dense sand and gravel over mudstone.Piles were Larssen 20W and were driven to 'refusal'n themudstone. Initial driving was undertaken with an air hammer:McKiernan Terry 700N with energy indicated by the plant hire firmas 5737 joules per blow (4150 ft lb/blow). Most of the driving wascarried out with a diesel hammer: DE 50B with energy indicated as62 190joules per blow (45 000 ft lb/blow) for a driving rate of 47blows per minute.
The cofferdam was bounded on one side by a brick wall Sm awayat its nearest point, and on another side by a trench about 10maway. The brick wall appeared to be in good condition, being
200-
100
KEYMode ol Yibralion: Vertical, Radial, TnnsverseHemmertvoe DieselendAirStated enerovoerblow 62.2kJand
5 7kJrespecliveiy~Bog t e:Merkum dense sand and gravelLocation ofmeasurement'n groundPde Tvoe: Sheet pdmg
II
EE
croOI
OI
IX
ILXIOo.
50
VERT
+XIXR
Xs
10
0
20—
R AD I AL TRANSV 1TH DIESEL HAI4MER
ON GROUND
~ I 5) I REAR 0F wALL~s C)s ON WALL
OPPOSITE SIDE OF COFFERDAMPERPENDICULAR TO TRENCH
IN TRENCH
VITH AIR HAMMER
SUGGESTEDisuggesred Iir
UPPER BOUNDFOR irED IUM
DENSE SOILS
Suggested fir ra'Vertiosr end
+'Transverse'
200
100
050
EE
KEY
Mode of Yfbrabon: YekkalHemmer tvoe: Drop and Dfas elSoil tvoe: Firm glacfel boulderclaySlated enerovoer blow: Bte lib 0.75m= 58.9kJ
and 40.0kJ respectivelyLocabon of measurement: On ground
Pile Tvoe: Sheet piling
Opens)mbol-ON Ground
oi & 0
%R %R 0%r ++
Xs+ Xs
OOI
IO
o 20IX
IL
IOIX
10-
5-
GESTEDR BOO~0IRM CLAY
000
0.52
I I I I I I5 10 20
SCALED DISTANCE I) 0 s/m)50
2-
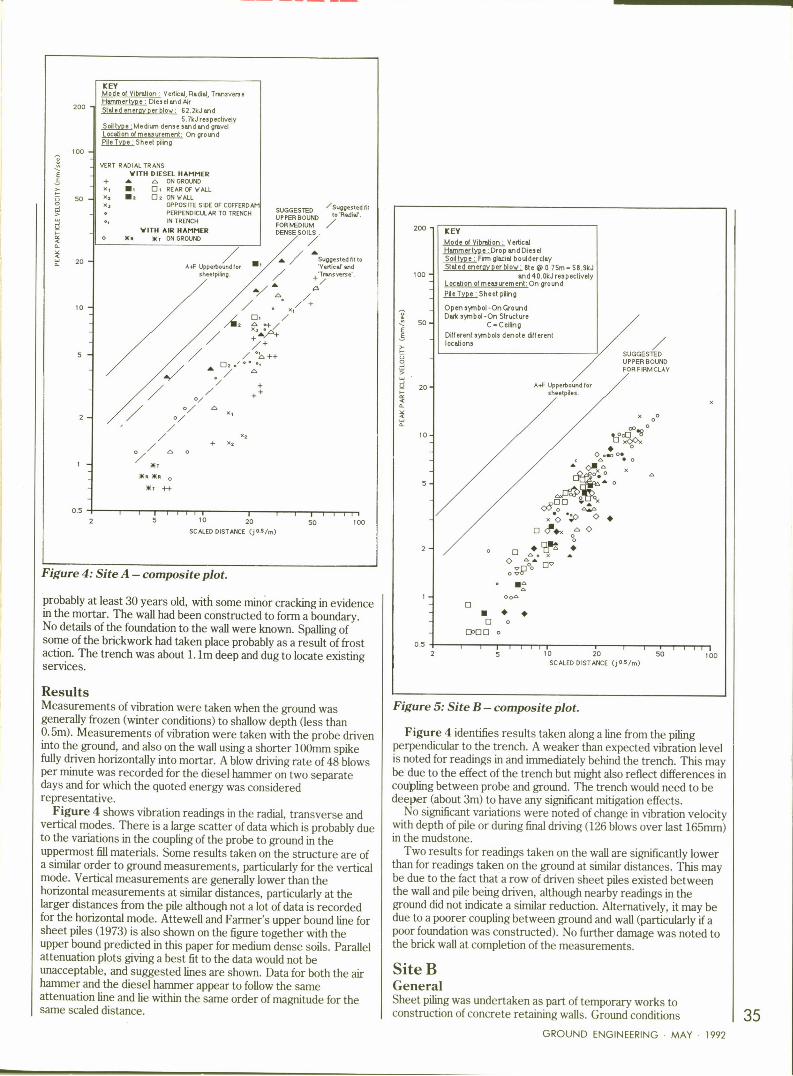
Figure 4:Site A —composite plot.
probably at least 30 years old, with some minor cracking in evidencein the mortar. The wall had been constructed to form a boundary.No details of the foundation to the wall were known. Spalling ofsome of the brickwork had taken place probably as a result of frostaction. The trench was about 1.1m deep and dug to locate existingservices.
0.52
o Pv.oP'gel
0005)
~ + +0 o
C)oCl 0I I I I I I I
5 10 20scALED DIsTANcE l) o.s/m)
I I I
50 100
ResultsMeasurements of vibration were taken when the ground wasgenerally frozen (winter conditions) to shallow depth (less than0.Sm). Measurements of vibration were taken with the probe driveninto the ground, and also on the wall using a shorter 100mm spikefully driven horizontally into mortar. A blow driving rate of 48 blowsper minute was recorded for the diesel hammer on two separatedays and for which the quoted energy was consideredrepresentative.
Figure 4 shows vibration readings in the radial, transverse andvertical modes. There is a large scatter of data which is probably dueto the variations in the coupling of the probe to ground in theuppermost fill materials. Some results taken on the structure are ofa similar order to ground measurements, particularly for the verticalmode. Vertical measurements are generally lower than thehorizontal measurements at similar distances, particularly at thelarger distances from the pile although not a lot of data is recordedfor the horizontal mode. Attewell and Farmer's upper bound line forsheet piles (1973) is also shown on the figure together with theupper bound predicted in this paper for medium dense soils. Parallelattenuation plots giving a best fit to the data would not beunacceptable, and suggested lines are shown. Data for both the airhammer and the diesel hammer appear to follow the sameattenuation line and lie within the same order of magnitude for thesame scaled distance.
Figure 5:Site B—composite plot.
Figure 4 identifies results taken along a line f'rom the pilingperpendicular to the trench. A weaker than expected vibration levelis noted for readings in and immediately behind the trench. This maybe due to the effect of the trench but might also reflect differences incou|I)ling between probe and ground. The trench would need to bedeeper (about 3m) to have any significant mitigation effects.
No significant variations were noted of change in vibration velocitywith depth of pile or during final driving (126 blows over last 165mm)in the mudstone.
Two results for readings taken on the wall are significantly lowerthan for readings taken on the ground at similar distances. This maybe due to the fact that a row of driven sheet piles existed betweenthe wall and pile being driven, although nearby readings in theground did not indicate a similar reduction. Alternatively, it may bedue to a poorer coupling between ground and wall (particularly if apoor foundation was constructed). No further damage was noted tothe brick wall at completion of the measurements.
Site BGeneralSheet piling was undertaken as part of temporary works toconstruction of concrete retaining walls. Ground conditions
GROUND ENGINEERING MAY 1992
35

II
EE
100-
50-
KEV
COMPARISON OF HAMMERS
+ DIESEL (40 kj)DROP (56/9 kl)
At one location, readings were recorded for vibrations in thevertical, radial and transverse mode. Velocity readings are higher in
the vertical direction for a scaled distance between 20 and 6 jkh (m,equivalent to a horizontal distance between 12m and 40m.
Figure 6 differentiates only between readings taken with each ofthe driving hammers. It can be seen that the results indicate asimilar amount of scatter and attenuation characteristics.
20-
10-
5-
2
++
+++ o
+++
+++
+g4+
+++
0 4
0noon
+ 1 1+p~'
4
.q~ph,+ + ++et+ +
4+"+".++n, +++
S+, o4
++++
Site CGeneralDriving of Balken 275mm square reinforced precast concrete pileswas undertaken to provide foundations along the route of a majorpipeline. Borehole records indicate ground conditions to compriseessentially about 12m loose to medium dense ash fill, oversandstone bedrock. The piles were driven using a Banut 400hydraulic rig. The machine has a hydraulically lifted 4t drop hammer
with variable control for height of drop. Drop heights ranged from0.20m to 0.55m.
Limited vibration monitoring was undertaken because of concernregarding the possible damaging effect on adjacent structures and
services. In particular, there was concern over driving piles 3.5mfrom an extsttng fire matn.
ResultsPreliminary data was obtained when driving piles distant fromstructures and services in order to obtain a general indication of thesite relationship between peak particle velocity (ppv) and distancefrom the pile for the ground conditions at the site. The results
052
I
5 10 20SCALED DISTANCE (jOS/m)
I I I I I I50 100 100—
KEY
Figure 6:Site B—Data for diesel and drop hammers.
comprised generally firm, occasionally firm to stiff, sandy glacial'boulder clay'ith lenses (up to 5m vertical) of silty sand, over solid
strata at depth. Piling was undertaken at several different localities
at the site. Driving was carried out either by Dawson drop hammer,
an 8t mass falling 0.75m giving an equivalent energy of 58 860 joules
per blow, or by a double-acting diesel hammer with energy rating
40 000 joules per blow. Nearest buildings to piling works rangedfrom post-war residential properties to relatively new library and
industrial warehouses. Measurements of vibration levels were taken
on the ground, on and inside structures. For readings on structures,the accelerometer was smeared with beeswax and placed on solid
surfaces, or screwed into wooden floors. Readings of peak particle
velocity in the vertical mode were generally recorded, with a few
readings taken in three mutually perpendicular directions at onelocation.
ResultsFigure 5 shows a composite plot of vertical velocity against scaleddistance for aII of the piling locations at site B, together with
Attewell and Farmer's suggested upper bound plot for sheet piles
and the upper bound suggested here for firm soils. It can be seenthat there is a small degree of scatter, with the results lying in a
band generally parallel to the predicted upper bound, particularly for
scaled distances greater than about 10 j /m. Readings taken on
structures appear to be of a similar order as for readings taken on
the ground at similar scaled distances. Some readings on floors, and
the readings on ceilings give generally higher results probably
because of the length of span allowing the material to act as a
36 sounding board.
GROUND ENGINEERING MAY 1992
u4
EE
tsuI
uI
M
o.scuIo.
50
Mode ol Vibration; Yekicel, Radial,Trensvels e
Hammertvoe: Drop
Stated enerav per btov: dte Itb 0.5m= 19.6kJ
~Soil t e; Loose to medium dense sandLocation ol measurement: On around
~pile T e:Driven provost concrete
RANGE
20 — J FOR SIN
V = VERTICR= RADIU
T= TRANS
10-
SUGGESTED UPPERBOUND FOR luED IUM
DENSE SOILS
(Equal to A+F upperbound for ptles otherthan sheet piles)
05I
5 10 20 50
SCALED DISTANCE (joe/m)
Figure 72 Site C —composite plot.
100

indicated that most of the results lay at about the predicted upperbound for medium dense granular soils. The levels of vibration were
similar throughout the depth of driving and no particular increase in
vibration levels was recorded at ground level during hard driving on
the rock. The plots adopt the reported energy (weight x drop)without consideration for efficiency of blow. Hammer efficiencies of
about 0.6to 0.8were recorded (by dynamic analyses) and would
have little relative effect on calculated 'scaled distance'.
Some degree of scatter was observed for any one vibration mode.
The scatter for different measuring points is probably a reflection of
the variation in coupling between the probe and the ground, and
slight variations in ground conditions. The scatter may also be a
function of a slightly varying energy transmitted to the pile.
The fire main is about 3.5m away from pile driving at its closest
point and using the preliminary data it was predicted that vibration
levels could rise to about 25mm/sec at this distance. In view of the
age of the fire main (about 25 years) and its unknown condition, the
effect of this level of vibration on the fire main was considered to be
of concern and additional precautions were undertaken to safeguard
this main.One precaution was to excavate a cut off trench between the fire
main and the locations of driven piles in an attempt to mitigate thevibration. The extent of excavation was limited by the need toprevent undermining of the main without providing support to the
main or sides of the trench. The trench was about 1.Om deep and
2.5m wide with batters of about 1 in 1. The fire main was alsoswitched off along this critical section during the piling works.
The results of preliminary monitoring and data in the vicinity ofthe fire main are shown on Figure 7. Vibration levels of about20mm to 30mm per second peak particle velocity were recorded in
the immediate vicinity of the fire main. Results indicate that thetrench was useful to only a limited extent in mitigating thepropagation of ground borne vibrations. For much of the data, thetrench appears to have had no effect. The readings indicate higher
vibrations in the radial and transverse direction than in the vertical
direction, although in a couple of cases for the probe in the trenchthe significantly higher lateral vibrations are probably due to poorcoupling between the probe and the ground, the soil being in a
relatively loose condition on the slopes of the trench.Subsequent to the piling works, the fire main was
recommissioned along this section and no leakage or loss in pressurehas been reported. Vibration may have caused fatigue rather than
triggering failure and regular checks are being carried out to ensurethere are no significant leaks from the main.
Summary and conclusionsThe data collated from published work and recorded by the authorsshows little difference in attenuation plots for hammers of differing
type and energy for the same soil type. This has been borne outparticularly by the data recorded at sites A and B. Most of thescatter in the collated data is probably a result of the variation in
relative density or consistency, looser or softer soils allowing easierpenetration with little of the energy being transferred from the pileas ground borne vibration. For stiff or dense soils, penetration isharder for the same energy input, and most of the energy istransferred from the pile to the soil.
Suggested upper bounds of peak particle velocity are given
(Figure 3) for varying degrees of 'soil stiffness'n a predictive plot
to determine the sensitivity of the site (ie either no problem, need
for trials, need for redesign). Trial piling or some other method ofimpulsive loading of the ground wiII sometimes be necessary to
determine the vibration propagation characteristics at a potentially
sensitive site (Grose 1986, Boyle 1990). If carried out as part of the
site investigation, trials will provide valuable information for the
preparation of contracts and tenders.In conclusion, it is suggested that Attewell and Farmer's upper
bound vibration line for sheet piles is conservative where driving is
to be carried out through loose to medium dense or soft to firm soils.
The suggested upper bounds for peak particle velocity in Figure 3for varying soil stiffness may also be applicable to other pile types aswell as for sheet piling, and this is borne out by data for driven
precast concrete piles at site C (loose to medium dense).Criteria are available that provide a sound basis for the
assessment of risk to structures subjected to piling vibrations.
These criteria should not be regarded as rigid rules and should beexpertly interpreted with regard to specific site conditions.
The routine measurement and recording of vibration level during
piling in an urban area will enable damage to be prevented orcontrolled. Enough measurements should be taken to account forscatter due to variation in coupling between ground and probe, in
ground conditions and in hammer efficiency.
ReferencesAttewell PB and Farmer IW, 'Attenuation of ground vibrations from pile drivusg'roundEngineering July 1973 Vol 6Boyle S, 'The effects of piling operations m the vtcinity of computer systems', Ground
Engineering, June 1990.BS 5228: 1992 Part 4 Code of Practice for notse and nbratlon control applicable to piling
operations.BS6472: 1984, 'Guide to evaluation of human exposure to vibrat>on in buildings'I Hz
to 80 Hz).BRE Digest 117, 'Vibrations in buildings', 1970.Clough GW and Chameau JL 'Measured effects of vtbratory sheet pile driving', ASCEOct 1980GR1.De Cock F et al, 'Ground vibration isolation using gas cushions', Proc. 4th Int Conf on
geotextiles geomembranes and related products, Hague 1990.Greenwood DA and Farmer IW 'Discussion session 4, 4th Panam Conf SMFE. 1971Puerto Rico, USA pp 172-174.Grose WJ, 'Driving piles adjacent to vibrauon sensitive structures', GroundEngineenng, May 1986.Mallard DJ and Bastow P, 'Some observations on the vibratton caused by pile driving',
ICE Conf 1979 London. Recent development in the design and construction of piles.Martin DJ, 'Ground vibrations from impact pile driving during road construction', 1980TRRL SR544.Palmer DJ, 'Ground home vibrations arising from piling', CIRIA Report 106i2 Final draft
1983.Skipp BO, 'Dynamic ground movements —man made vibrations'n 'Ground movementsand their effect on structures', ed by Attewell and Taylor. Surrey Univ Press 1984.Wiss JF, 'Construction vibrations: state of the art', ASCE Vol 107, GT2, February1981.
GROUND ENGINEERING MAY 1992
37


