
Walden UniversityScholarWorks
Walden Dissertations and Doctoral Studies Walden Dissertations and Doctoral StudiesCollection
2016
Grit, Student Engagement, and AcademicPerformance at a Historically Black CommunityCollegeSharonica Marie NelsonWalden University
Follow this and additional works at: https://scholarworks.waldenu.edu/dissertationsPart of the Adult and Continuing Education Administration Commons, Adult and Continuing
Education and Teaching Commons, Community College Education Administration Commons,Community College Leadership Commons, Higher Education Administration Commons, and theHigher Education and Teaching Commons
This Dissertation is brought to you for free and open access by the Walden Dissertations and Doctoral Studies Collection at ScholarWorks. It has beenaccepted for inclusion in Walden Dissertations and Doctoral Studies by an authorized administrator of ScholarWorks. For more information, pleasecontact [email protected].

Walden University
COLLEGE OF EDUCATION
This is to certify that the doctoral study by
Sharonica Marie Nelson
has been found to be complete and satisfactory in all respects, and that any and all revisions required by the review committee have been made.
Review Committee Dr. Nicolae Nistor, Committee Chairperson, Education Faculty
Dr. Beate Baltes, Committee Member, Education Faculty Dr. Michelle Brown, University Reviewer, Education Faculty
Chief Academic Officer
Eric Riedel, Ph.D.
Walden University 2016

Abstract
Grit, Student Engagement, and Academic Performance at a Historically Black
Community College
by
Sharonica Marie Nelson
MA, Jacksonville State University, 2011
BSE, Jacksonville State University, 2009
Doctoral Study Submitted in Partial Fulfillment
of the Requirements for the Degree of
Doctor of Education
Walden University
December 2016

Abstract
Obtaining a college degree benefits individuals and society, yet only 20% of students are
graduating from community colleges. At many institutions, graduation rates have
decreased over the last five years, including one historically Black community college in
the southern United States. To explore possible causes of low graduation rates at this
unique and understudied type of college, this correlational study examined the
relationships among student engagement, academic performance, and grit—persistence
and passion toward long-term goals. Tinto’s theory of student persistence served as the
theoretical framework for this study. The convenience sample included 116 college
students who already had a first-year grade point average (FYGPA). Grit was measured
by the Grit-Short Scale; student engagement by the Student Engagement Instrument-
College, and academic performance by FYGPA. No statistically significant relationships
were found between grit and academic performance, or between student engagement and
academic performance, however. Recommendations included additional research with
larger samples of students and other HBCUs. Recommendations also included exploring
other non-cognitive constructs, such as academic mindsets, learning strategies, socials
skills, and academic behaviors to understand those relationships with academic
performance. Implications for positive social change include providing initial research
findings to the college administration for continued research on efforts toward producing
more graduates, thereby increasingly providing quality higher education to underserved
groups of students.

Grit, Student Engagement, and Academic Performance at a Historically Black
Community College
by
Sharonica Marie Nelson
MA, Jacksonville State University, 2011
BSE, Jacksonville State University, 2009
Doctoral Study in Partial Fulfillment
of the Requirements for the Degree of
Doctor of Education
Walden University
December 2016

Dedication
Muhammad Ali once said, “It’s the repetition of affirmations that leads to belief.
And once that belief becomes a deep conviction, things begin to happen.” I said I wanted
a doctorate, I believed I could achieve it, so I called myself doctor. It has happened. For
this, I am grateful and humbled. Therefore, this is dedicated to my husband, daughter,
and father for their undying belief in me. Thanks for the prayers, motivation, and help.
Toney, you’re the best. Kamil, I did this for you. To my father, William L. Bell, thank
you for always reminding me that the sky is the limit.

Acknowledgments
I would like to thank Dr. Nicolae Nistor, Dr. Beate Baltes, and Dr. Michelle
Brown for their guidance. To the rest of my family and friends, thanks for the
encouragement and the prayers. Lastly, but certainly not least, thanks to my heavenly
Father for carrying me when I could not go on. “If God be for you, who can be against
you?”

i
Table of Contents
List of Tables ..................................................................................................................... iv
List of Figures ......................................................................................................................v
Section 1: Introduction to the Study ....................................................................................1
Introduction ....................................................................................................................1
Problem Statement .........................................................................................................3
Nature of the Study ........................................................................................................4
Purpose of the Study ......................................................................................................5
Theoretical Framework ..................................................................................................7
Operational Definitions ..................................................................................................8
Assumptions, Limitations, Scope, and Delimitations ....................................................9
Assumptions ............................................................................................................ 9
Limitations ............................................................................................................ 10
Scope… ................................................................................................................. 10
Delimitations ......................................................................................................... 11
Significance of the Study .............................................................................................11
Summary ......................................................................................................................12
Section 2: Literature Review .............................................................................................14
Introduction ..................................................................................................................14
Tinto’s Theory of Student Retention .................................................................... 15
Grade Point Average as Academic Performance .................................................. 21
Grit….. .................................................................................................................. 22
Student Engagement ............................................................................................. 25

ii
Engagement Methods............................................................................................ 26
National Student Engagement Assessments ......................................................... 28
Other Predictors of Academic Performance ......................................................... 29
Grit and Student Engagement ............................................................................... 33
Literature Concerning Methods ............................................................................ 35
Summary ......................................................................................................................37
Section 3: Research Method ..............................................................................................38
Introduction ..................................................................................................................38
Research Design and Approach ...................................................................................38
Setting.. ........................................................................................................................38
Sample .........................................................................................................................39
Instrumentation and Materials .....................................................................................40
Short Grit Scale ..................................................................................................... 40
Student Engagement Instrument-College ............................................................. 41
Demographic Survey ............................................................................................ 41
Data Collection and Analysis.......................................................................................42
Protection of Participants’ Rights ................................................................................43
Section 4: Results ...............................................................................................................45
Introduction ..................................................................................................................45
Research Tools .............................................................................................................45
Data Analysis ...............................................................................................................46
Descriptive Statistics for Participant Demographics ............................................ 46
Research Question 1 ............................................................................................. 48

iii
Research Question 2 ............................................................................................. 50
Findings........................................................................................................................51
Conclusion ...................................................................................................................53
Section 5: Discussion, Conclusions, and Recommendations .............................................55
Introduction ..................................................................................................................55
Interpretation of Findings ............................................................................................55
Implications for Social Change ....................................................................................61
Recommendations for Actions .....................................................................................62
Recommendations for Further Study ...........................................................................67
References ....................................................................................................................69

iv
List of Tables
Table 1. WSCC Retention and Graduation Rates Between 2010 and 2014 ........................4
Table 2. Low Graduation Rates of WSCC and Community Colleges Nationally by
Year… ......................................................................................................................6
Table 3. WSCC Academic Performance Student Course Completion Percentages by
Year. .........................................................................................................................7
Table 4. Participant Age Groups (N = 116) .......................................................................45
Table 5. Participant Race/Ethnicity (N = 116) ...................................................................46
Table 6. FYGPA Range (N = 116).....................................................................................46

v
List of Figures
Figure 1. Scatter plot depicting Grit-S composite scores and FYGPA..............................48
Figure 2. Scatter plot depicting SEI-C composite scores and FYGPA..............................50

1
Section 1: Introduction to the Study
Introduction
Nationwide, the graduation rates of many colleges are low (Hillman & Orians,
2013). Many students are not graduating with degrees at the rate in which they are
enrolling in tertiary institutions to obtain them. It is a widespread problem, and leaders of
higher education and secondary education institutions and districts, policymakers, and
legislators are searching for ways to improve college student academic performance and
graduation rates (Rath, Rock, & Laferriere, 2013).
There are many traditional predictors of college graduation (Cromwell, McClarty,
& Larson, 2013). Cognitive ability instruments, such as the American College Test
(ACT), Scholastic Aptitude Test (SAT), and high school grade point averages (HSGPA),
are typically used as college academic performance predictors for entering college
students. College students’ academic performance regarding grade point average (GPA),
and particularly first-year GPA (FYGPA) and course grades, are predictors of college
graduation. Yet, recent research attention has turned to what are often termed non-
cognitive constructs and their importance to academic performance, such as student
attrition, intrinsic and extrinsic factors in student motivation, student self-efficacy, and
college support services in relation to college academic performance and persistence to
graduation.
One such non-cognitive construct is grit, which has been defined as persistence
and passion toward long-term goals (Von Culin, Tsukayama, & Duckworth, 2014). It
must be noted that persistence and grit are synonymous (Chien, Harbin, Goldhagen,

2
Lippman, & Walker, 2012; United States Department of Education, 2013). Grit is a
construct coined by Duckworth, Peterson, Matthews, and Kelly (2007) that has evolved
to include ideas of self-discipline, determination, and perseverance regardless of
obstacles. Empirical research by Perkins-Gough and Duckworth (2013) indicated that a
relationship exists between grit and higher academic achievement. According to
Strayhorn (2013), research concerning grit has not been conducted at historically Black
colleges such as Wilson State Community College (WSCC; a pseudonym), a small
historically Black community college in the southern United States. Therefore, this
research was needed.
Another non-cognitive construct that has garnered much attention in the past is
student engagement and its impact on academic performance. The term student
engagement is conventionally defined as students’ involvement in practices that
positively affect their academics whether inside or outside of the classroom (Kuh, Kinzie,
Buckley, Bridges, & Hayek, 2007). Appelton, Christenson, Kim, and Reschly (2006)
suggested that engagement is multi-dimensional and overlaps other constructs. Appleton,
Christenson, and Furlong (2008) identified three components of engagement which they
delineated as affective, behavioral, and cognitive.
Student engagement is a robust research area, and failing to understand student
engagement in terms academic performance improvement brings dire consequences
(Claxton, 2007; Gilbert, 2007; Taylor & Parsons, 2011). However, I identified a need to
understand student engagement, grit, and academic performance in a single study.
Therefore, I designed this study to probe the potential relationships between the

3
aforementioned variables in a particular institutional context (Duckworth et al., 2007;
Von Culin et al., 2014).
In the following paragraphs, I provide the problem statement, the rationale, and
the significance. This section closes with a brief summary of the implications of the
study, and the finally closes with the limitations of the study and a brief summary. In
Section 2, I review the literature, which describes all of the variables. In Section 3, I
provide the research methods. In Section 4, I provide the Results. In Section 5, I discuss
the findings in detail.
Problem Statement
The problem I investigated in this study was low graduation rates for students at a
historically Black community college. Nationally, community college graduation rates
are declining (Talbert, 2012). In the school year that ended in 2014, the graduation rate
was 10% at WSCC (National Center for Education Statistics [NCES], 2014b). Since
2010, WSCC administrators have taken steps to improve graduation rates; however,
graduation rates have continued to decline (see Table 1; NCES, 2014a). In addition to
declining graduation rates, there has been a 20% decrease in student retention (NCES,
2014a). Retention and graduation problems also constitute a national challenge as student
retention problems and high dropout rates have been and remain a dilemma for many
institutions (Brown, 2012; Cavendish, 2013). On the national level, decreases in student
retention and graduation rates have compelled efforts to promote college readiness and
better prepare students for college (Arnold, Lu, & Armstrong, 2012b; Nagaoka et al.,
4
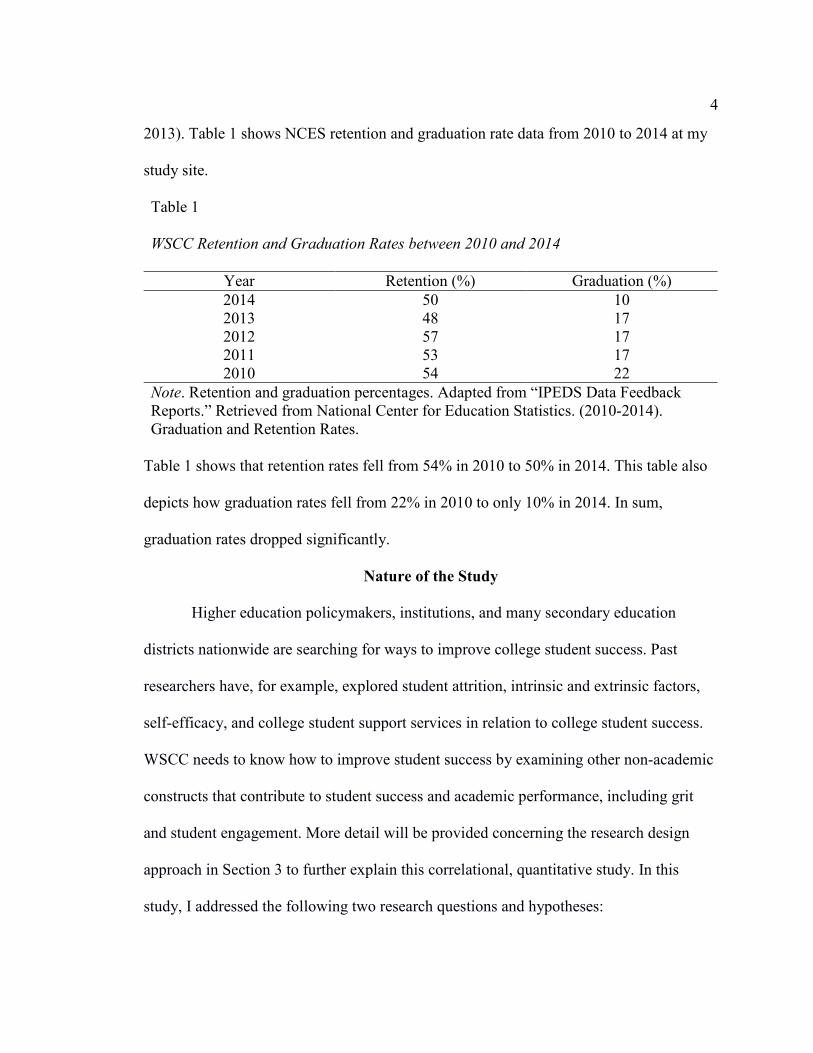
2013). Table 1 shows NCES retention and graduation rate data from 2010 to 2014 at my
study site.
Table 1
WSCC Retention and Graduation Rates between 2010 and 2014
Year Retention (%) Graduation (%)
2014 50 10 2013 48 17 2012 57 17 2011 53 17 2010 54 22
Note. Retention and graduation percentages. Adapted from “IPEDS Data Feedback Reports.” Retrieved from National Center for Education Statistics. (2010-2014). Graduation and Retention Rates.
Table 1 shows that retention rates fell from 54% in 2010 to 50% in 2014. This table also
depicts how graduation rates fell from 22% in 2010 to only 10% in 2014. In sum,
graduation rates dropped significantly.
Nature of the Study
Higher education policymakers, institutions, and many secondary education
districts nationwide are searching for ways to improve college student success. Past
researchers have, for example, explored student attrition, intrinsic and extrinsic factors,
self-efficacy, and college student support services in relation to college student success.
WSCC needs to know how to improve student success by examining other non-academic
constructs that contribute to student success and academic performance, including grit
and student engagement. More detail will be provided concerning the research design
approach in Section 3 to further explain this correlational, quantitative study. In this
study, I addressed the following two research questions and hypotheses:

5
Research Question 1: What is the relationship between student engagement scores
as measured by the Student Engagement Instrument-C and academic performance as
measured by FYGPA at WSCC?
H10: There is no statistically significant relationship between Student Engagement
Instrument-C scores and academic performance as measured by FYGPA at WSCC.
H1a: There is a statistically significant relationship between Student Engagement
Instrument-C scores and academic performance as measured by FYGPA at WSCC.
Research Question 2: What is the relationship between grit scores as measured by
the Grit-S instrument and academic performance as measured by FYGPA at WSCC?
H20: There is no statistically significant relationship between Grit-S scores and
academic performance as measured by FYGPA at WSCC.
H2a: There is a statistically significant relationship between Grit-S scores and the
academic performance as measured by FYGPA at WSCC.
Purpose of the Study
The purpose of this correlational study was to examine the relationships between
grit, student engagement, and academic performance as measured by FYGPA. I
examined the relationships between these variables to better understand decreasing
graduation rates. The two independent variables were grit and student engagement, and
the dependent variable was academic performance.
President Obama recently implemented college completion reform, especially
targeting the community college (The White House, n.d.). However, graduation rates at
community colleges have not increased (Wyner, 2012). The President’s goal caused

6
intensified college completion reform efforts at many different levels ranging from
federal agencies to individual institutions, and especially community colleges (The White
House, n.d.). Community colleges have an important role in academically preparing
students for both workforce and further educational goals (Martin, Gallentino, &
Townsend, 2014; Wyner, 2012). Further, community colleges enroll over 40% of all
undergraduates nationwide. However, community colleges graduate only 20% to 25% of
those enrolled (Hillman & Orians, 2013). Table 2 compares WSCC rates with the
national community college graduation rates.
Table 2
Low Graduation Rates of WSCC and Community Colleges Nationally by Year
Year WSCC (%) Community Colleges Nationally (%)
2010 22 23
2011 17 22 2012 17 21 2013 17 21 2014 10 20
Notes. Graduation Rate percentages. National Center for Education Statistics. (2014a). Two-year college graduation rates. Retrieved from https://nces.ed.gov/programs/digest /d13/tables/dt13_326.20.asp
As indicated in Table 2, graduation rates at WSCC have decreased over the last
few years by 55%. WSCC rates went from 22% in 2010 to 10% in 2014. Nationally,
community college graduation rates dropped from 23% in 2010 to 20% in 2014. Table 3
depicts the percentages of WSCC students passing courses with a C or better.

7
Table 3
WSCC Academic Performance Student Course Completion Percentages by Year
2010-2011 2011-2012 2012-2013 2013-2014
*Success 73 73 75 73 Non-Success 21 18 16 18
Note. *Success defined as C or better.
As can be seen in Table 3, most students passed with a C or better, but this does
not correspond with the low graduation rates of the college. Despite positive course pass
rates at WSCC, too few students are graduating. Gayles (2012) found that successful
FYGPA, C or better, was a predictor of graduation. However, graduation rates of WSCC
students do not correspond with student academic performance. Although most students
are passing courses, the majority of them are not graduating.
Theoretical Framework
The theoretical framework for this study was Tinto’s (1973, 1982) student
retention theory. Facets of the theory are pertinent to grit and student engagement while
also addressing the problem of non-graduating students at WSCC. Tinto (1973) posited
that the level of goal commitment or persistence was central to students’ decision to drop
out of higher education. However, Tinto (1982) acknowledged that other factors may also
play a role in students dropping out, such as financial issues and other external factors
that students face. Tinto recognized these limitations to the initial theory of student
dropout. The author also conceded that the initial model of student retention did not
account for student disengagement. Tinto’s (1973) study of persistence and its influence
on college completion, and his acknowledgement of student engagement and its influence
on dropping out became the underpinning of this study. Student engagement and grit

8
have both been identified as non-cognitive influences of student academic performance in
terms of degree completion.
I derived the framework for this study from Tinto (1993) who, using student
retention theory, proposed that college success can be attributed to a student’s previous
academic and social experiences, reasons for attending college, goal commitment level,
and interaction with the college environment. Embedded in Tinto’s discussion of goal
commitment level was the notion of grit, which is defined as persistence and passion for
long-term goals (Duckworth & Quinn, 2009). In essence, grit signifies the level of goal
commitment because grit encompasses goal commitment.
Further, Tinto’s discussion of students’ interaction with the college environment
encapsulates the notion of student engagement, which is defined as the time and effort
students invest in their studies and other educationally-focused activities in college
(Perrotta & Bohan, 2013; Tinto, 1993). Therefore, I chose this framework to better
understand the variables of grit, student engagement, and academic performance at the
local setting, WSCC.
Operational Definitions
Academic Performance: How well a student performs in academic knowledge and
skills, which is reflected by the student’s cumulative GPA (Al-Hattami, 2012).
Grade Point Average (GPA): A calculated cumulative mean measure of students’
academic performance based on their grades in all courses they have matriculated in
college (Merritt, 2016).

9
Grit: A term appropriated to denote trait-level perseverance and passion for long-
term goals measured via the grit instrument (Chien et al., 2012; Duckworth et al., 2007).
Retention: Keeping students in college until they graduate (Brooks, Jones, & Burt,
2013; Tinto 1993).
Student Engagement: The effort, both in time and energy, students give to
educationally-purposeful activities (expectations, student services, and extracurricular
activities) which encourage students to engage in such practices; measured via student
engagement instruments (Kuh, 2001; Tinto, 1993).
Student Success: A student’s achievement of his or her educational goals and
attainment of key performance milestones in a timely manner (California Postsecondary
Education Commission, 2011).
Assumptions, Limitations, Scope, and Delimitations
Assumptions
The first assumption I made was that all students would complete the surveys
(Short-Grit, Student Engagement Instrument-College) to the best of their abilities. Both
surveys were combined into one, including a short demographic questionnaire, and
participants had to complete the survey in its entirety. I assumed that students would
follow directions and complete the survey by choosing the best answer choice based on
their feelings concerning the questions. My second assumption was that students would
accurately self-report FYGPA.

10
Limitations
One limitation of this study was that students self-reported FYGPAs. It is possible
that students did not accurately self-report their FYGPA. Second, this study purposefully
omitted the study of other constructs that frequently influence college students’ academic
success such as motivation, self-efficacy, and emotional intelligence.
Finally, the application of scale measures may serve as a study limitation. Likert-
type scales are normally considered ordinal measures. In this study, I analyzed the Likert-
type scales as interval measures, Grit-S and SEI-C (Lavrakas, 2008). This was done so
that parametric statistical procedures could be used to analyze results. Grit-S and SEI-C
were analyzed as scales with response items that are equal distances apart. From a
statistical standpoint, this suggests an interval level of measurement (Harpe, 2015).
For the purpose of this study, I used both instruments individually and in their
entirety to determine the level of the phenomena of interest: grit and student engagement.
It would have been inappropriate methodologically and statistically to analyze each
response item; therefore, each instrument was analyzed as a composite and scored as
prescribed by the developers of each instrument (Harpe, 2015). These composite scores
represent grit and student engagement and were analyzed in relation to academic
performance.
Scope
As previous researchers of college academic performance have suggested, it was
important to the local and broader context of the problem to understand the impact of grit
on student success and academic performance at WSCC. Strayhorn (2013) has called for

11
grit research at a historically Black college or university (HBCU). Therefore, I limited
this study to the grit and engagement of participants who were current students at WSCC.
Greene, Mari, and McClenney (2008) similarly called for study of the engagement of
African American students a community colleges. However, given the small number of
participants and no other institution to cross-check results, this study is only generalizable
to WSCC.
Delimitations
To avoid Family Education Rights and Privacy Act (FERPA) violations, I decided
to obtain self-reported FYGPA from all participants. WSCC reserved the right to
withhold identifying information or information potentially damaging of its stakeholders.
Therefore, to stay within the parameters of this study and respect the rights of the
institution, I omitted explicit data concerning graduation and student FYGPA generated
directly from the college. Omitting this information did not diminish the quality of this
study.
Significance of the Study
The original contribution this study made at WSCC was to view and address
academic performance through a new and different lens, that of grit, engagement, and
academic performance. Moreover, the college itself may benefit from evidence of other
constructs that could enhance efforts to make the campus a place where more students are
retained and eventually graduate. WSCC benefits by having insight into which concepts
correlate to success—insight that administrators might use to allocate existing retention
resources more effectively (see Al Ghanboosi & Alqahtani, 2013).

12
The study will also benefit higher education stakeholders by uncovering evidence
of the relationship between grit, student engagement, and academic performance at an
HBCU (Strayhorn, 2014). Findings may benefit historically Black community colleges
by providing insights regarding trends that better predict success. This insight could
allow administrators to allocate existing retention resources more effectively (see Al
Ghanboosi & Alqahtani, 2013).
This study is also shows the positive relationship between quality of life and
college education (see An, 2013; Castro, 2013). Most students at WSCC are minority,
low-income, and non-traditional students. Research findings have demonstrated that
individuals with higher education degrees are less likely to rely on government assistance
and more likely to enjoy a better quality of civic life (Castro, 2013; Dickerson, 2004).
Therefore, it is important that WSCC students earn a college education. Earning a college
education is an undertaking that will require students to obtain adequate non-cognitive
skills and preparation to ensure college success. The improvement of college student
success skills will likely improve college graduation rates, and, in turn, result in a better
quality of life for more WSCC students.
Summary
In this section, I described the problem which prompted the study and previewed
the research questions and hypotheses that guided the study. A purpose statement was
provided along with the theoretical framework that established grounding for the overall
research. Operational definitions explained special terms needed to understand the
parameters of this study. In the next section, I will review and interpret the available

13
literature regarding the variables of grit, student engagement, and academic performance,
as well as any research-based relationships between these variables. The content of the
remaining sections of the study includes the research method section, which includes a
description of the research design and approach. The results section included the
pertinent information concerning overall data analysis, and the final section of the study
includes discussion, conclusion, and overall recommendation for further study.

14
Section 2: Literature Review
Introduction
Nationally, stagnant college graduation rates, gaps in persistence, high dropout
rates, and poor retention among community colleges have prompted the review of these
issues to create a more educated society. McCormick and McClenney (2012) argued that
there is broad consensus that U.S. higher education needs to do a better job because too
many students enter college and never graduate. Bodies of research show that academic
qualities are not the only indicators or influencers of student success.
The American College Test ([ACT], 2007) found that academic discipline (i.e.,
adhering to deadlines, using time wisely) strongly influences GPA. Student academic
discipline encompasses student behaviors outside of cognitive ability such as
commitment and self-management (Sommerfeld, 2011). Markle and Robbins (2013)
suggested that as institutions seek to increase student success, they must first gain a better
understanding of the broad set of factors that can help or hinder their students. These
factors include non-academic constructs such as student engagement and grit.
The purpose of this literature review is to discuss grit and student engagement as
they relate to academic performance as measured by FYGPA. In the literature review, I
provide details concerning: the theory that underpins this study, grade point averages,
grit, student engagement, and other concepts and factors that influence success. To gather
relevant sources to review, I searched the following databases: Academic Search
Complete, Education Research Complete, ERIC, InfoSci-Online, PsycArticles, and
ProQuest Central. The following keywords were used to search these databases: college

15
retention, college student success, student engagement, grit, cognitive predictors of
success, community college success, community college retention, academic
performance, non- predictors of college success, college persistence, and student
involvement.
Tinto’s Theory of Student Retention
Tinto’s (1973, 1987) theory of student retention has had several names including
“theory of student departure,” “integration theory,” and “interactive model of student
departure.” However, in 2012 Tinto solidified the name of this theory by referring to it as
the theory of student retention. Given the theory’s roots spanning over two decades and
the accolades, criticism, and scrutiny it has received, the theory of retention is known as a
foundation for student engagement and student retention. Tinto’s theory of retention is
one of the most widely used, studied, and cited frameworks concerning student retention
(Pascarella & Terenzini, 2005). The foremost reason Tinto’s theory has found such
widespread use is because it openly examines the relationships between students and their
college experiences, and focuses on how to make these interactions better. Tinto (1973)
used four existing surveys to support the theoretical work: (a) National Longitudinal
Study, (b) High School and Beyond, (c) American College Testing Program Survey of
Institutions, and (d) Survey of Retention at Higher Educational Institutions (Tanaka,
2002).
As this theory has been extensively studied, some researchers have pointed out its
deficits, and have argued that Tinto’s theory ignored students other than White, 4-year
college students. For instance, Pascarella and Terenzini (2005) argued that the theory

16
cannot be applied across races and ethnicities. Tinto’s (1975) theory emphasized the
concept of integration as a key to increasing student retention regardless of race or
gender. The author essentially contends that students of all races and ethnicities must be
academically and socially integrated, or have a strong sense of belonging to the
institution.
Braxton, Hirschy, and McClendon (2004) concluded that out of 40 studies, 19 did
not show a link between persistence and Tinto’s idea of academic integration. However,
the main focus of Tinto’s (1975) theory is that increased student levels of commitment to
the institution stem from increased levels of social integration. Further, increased levels
of student academic integration result in increased commitment to degree attainment.
Therefore, Tinto urged that both institutional commitment and student commitment to
degree attainment result in increased grit (the main variable in this study), and that grit
and persistence are synonymous. Tinto (1987) presented six principles of institutional
action that help promote social integration, student commitment, and student
engagement; these principles are discussed below.
Principle I. Tinto (1987) suggested that institutions must ensure that new students
enter with or have the opportunity to acquire skills needed for academic success. Some
institutions are highly selective and screen students for academic success skills to ensure
that they enter academically astute and possess the skills needed to be successful. Other
institutions provide developmental courses to ensure that students have an opportunity to
acquire the necessary academic skills to successfully complete a college degree.

17
Principle II. Tinto (1987) suggested that institutions should reach out to students
beyond the classroom by making connections, fostering relationships, and creating
opportunities for student support beyond the classroom setting. Some schools mandate
that instructors engage students through calls or regular email communications. Other
schools require instructors to maintain regular office hours where students may have one-
on-one instructional support time outside of the classroom with the faculty.
Principle III. Tinto (1987) suggested that institutional retention actions should be
systematic. Retention actions and the plan of implementation should include established
goals for retention improvement and checkpoints for meeting goals. Institutions must also
coordinate retention strategies, and these efforts must be consistent throughout
departments, schools, and classrooms.
Principle IV. Tinto (1987) argued that institutions should start early in an effort
to retain students. Retention strategies should include frequent student meetings with
academic advisors. Advisors must use these meetings as opportunities to check on
student progress, concerns, and academic achievement. First-year programs are important
because they prepare and initiate the tracking of student progress.
Principle V. Tinto (1987) recommended that the main commitment of institutions
must be their students’ needs and success, and that institutions must be learner-centered.
Learners are the reason institutions exist; without students, there is no one to engage in
learning. Moreover, the institutional focus should be on student progress and
achievement. Focus must not solely be attracting resources or reputation for the

18
institution. Rather, the focus must be on student progression for the purpose of degree
attainment.
Principle VI. Tinto (1987) suggested that education should be the goal of
retention programs. Retention programs must be concerned with providing students with
the opportunity of a quality education and ensuring that they progress toward degree
completion.
These six principles are also important to student engagement because academic
integration, student engagement, and student integration are all related. In 1993, Tinto
included more focus on minority students, nontraditional students, and the classroom. In
addition, the author proposed the following seven principles of instructional
effectiveness.
Principle I. Tinto (1993) argued that institutions must provide resources for
program development and professional development for faculty and staff. Faculty and
staff cannot be expected to automatically know their roles pertaining to student
engagement and academic integration. The institution should provide professional
development and empowerment to faculty and staff so that they know the significance of
engagement and integration and the critical roles they play regarding school-wide
decisions concerning students. There must be buy-in from all faculty and staff to create a
unified front pertaining to student engagement and academic integration of the students.
Principle II. Tinto (1993) suggested that institutions must be committed to the
long-term process of program development. Schools must be active in ensuring the
improvement of programs that directly influence student academic performance. Most

19
institutions of higher education are governed by an accrediting body. Many of these
accrediting bodies mandate that institutions develop a quality enhancement plan to ensure
they are continuously improving in certain areas of development. Adhering to and
improving based on a plan shows a commitment to program development.
Principle III. Tinto (1993) proposed the idea that institutional change must be in
the hands of those who will implement the change. Principal leaders must develop
collegiality among faculty and staff. Leaders must empower those who directly influence
students in order for institutional change to take place. Leaders are charged with setting
high morale among others, and they should also clearly convey goals and provide
subordinates with the tools they need to reach these goals.
Principle IV. Tinto (1993) argued that institutional actions must be collaborative
and system-wide. Faculty and staff must work together across colleges, departments, and
disciplines to ensure college conditions are conducive to student success. No one
department or school has all the answers, and students may be better served when
departments collaborate effectively to eradicate problems or to ensure a smooth transition
for students.
Principle V. Tinto (1993) argued that faculty and staff must have skills needed to
assist and educate their students. They must be well-educated and have the experience
needed to effectively aid students. Faculty must work in their areas of expertise and
training. Faculty and staff must also have the soft-skills needed when dealing with
students including patience, understanding, organization, and a collaborative mind-set.

20
Principle VI. Tinto (1993) recommended that institutions frontload their efforts
of student retention. To retain students and create better academic performance in terms
of graduates, institutions may implement progress monitoring systems to communicate
student standing. They may also implement orientation courses where students are taught
non-cognitive skills and college survival skills.
Principle VII. Tinto (1993) advocated for assessment that is continuous and
focused on improvement for the institution and programs. Many institutions administer
surveys to assess programs, instructors, and the institution as a whole. It is important that
these survey results be used in improvement efforts for the sake of providing the best
atmosphere possible for increased academic performance.
In 2012, Tinto published an updated theory of retention, which builds upon earlier
ideas concerning grit, student engagement, and academic performance. As retention
continues to be a widely studied area of higher education, Tinto recommended that the
classroom is where all efforts should be targeted. The author focused on helping students
graduate by way of expectation, support, assessment feedback, and involvement.
Further, Tinto indicated that institutional influences play a role in the level of
student engagement, grit, and overall academic performance. Kuh, Kinzie, Buckley,
Bridges, and Hayek (2006) argued that the focus of retention efforts should be on student
engagement. The authors asserted that student engagement embodies certain facets of
student behavior and performance that institutions may directly influence, instead of
factors and characteristics that are outside of institutional or even student control. These
facets include financial stressors, family and cultural background, and socio-economic

21
dynamics. Nevertheless, Tinto contends that grit and persistence, as non-cognitive factors
in conjunction with student engagement, are related to academic performance and degree
attainment.
Grade Point Average as Academic Performance
For decades, grades have been used by schools and institutions to monitor and
gauge student academic performance. GPA is a summative criterion measure of students’
overall academic performance. For example, Gayles (2012) found that GPA was a
significant predictor of student persistence toward degree completion. Al Ghanboosi and
Alqahtani (2013) observed that students with GPAs lower than 2.0 had higher dropout
rates. High school GPA has also been reported to be a reliable predictor of college
dropout (Al Ghanboosi & Alqahtani, 2013).
However, even students with higher high school GPAs drop out of college for
reasons other than academic performance such as frustration, low self-esteem, or lack of
support. Daley (2010) argued that the many causes of dropping out are complex and
range from poverty, poor reading skills, weak or non-existent support systems, and an
insufficient education system in the formative years. Bakoban and Aljarallah (2015)
found that students who were involved in extracurricular activities had higher GPAs than
did those who were not involved.
Merritt (2016) argued that the GPA system was the best system to use for
measuring students’ academic aptitude and future academic progress. In the United
States, GPA is scored by assigning numerical values to letter grades using a point system.
In a point system A = 4, B = 3, C = 2, D = 1, and F = 0 (Merritt, 2016). One concern

22
regarding the validity of GPAs is grade inflation, the increase in students’ grades and
GPAs over time without an associated achievement increase (Merritt, 2016). An
additional concern related to self-reported GPA is that students may over-estimate it
when asked to self-report their GPA (Komarraju, Karau, Scmeck, & Avdic, 2011).
Nevertheless, GPA has been found to be a significant predictor of college
academic performance. Cromwell et al. (2013) identified that FYGPA and cumulative
GPA predict degree completion, which is the overall goal of college attendance. Cabrera,
Nora, Terenzini, Pascarella, and Hagedorn (1999) found that among White and Black
students who participated in the National Study of Student Learning, academic
performance, in terms of GPA, directly influenced college persistence. Through a sample
provided by NCES, Ishitani and DesJardins (2002) noted that students with higher GPAs
were less likely than those with lower GPAs to drop out of college.
Steele-Johnson and Leas (2013) studied the importance of race and gender in
predicting academic performance at a Midwestern university. These authors determined
that gender was not a significant predictor of GPA, but race was. In a different study
concerning medical students, Kruzicevic et al. (2012) observed that high school GPA was
correlated to college GPA. Therefore, students’ high school academic performance,
college GPA, and race, depending on the institutional context, correlates to college
academic performance.
Grit
Grit is the tendency to sustain interest in and effort toward long-term goals; it is
synonymous with persistence (Duckworth et al., 2007). Hoerr (2012) insisted that grit

23
was a quality that was necessary to success but too often overlooked. Similarly, Levy and
Steele (2011) described gritty people as individuals who sustain effort and concentration
over many years despite disappointments, failures, and hardships striving toward their
goal. The gritty individual characteristically does whatever it takes to finish tasks at hand
and pursues long-term goals. Recent research has been directed toward grit and its
influence on student success. Researchers have sought to bring grit into the forefront and
understand its importance to student success (Chang, 2014; Duckworth et al., 2007;
Strayhorn, 2013).
For instance, Chang’s (2014) study addressed the theory of grit in a quantitative
study similar to the current one. The author found that students with higher perseverance
had higher FYGPAs; however, grit was not a significant predictor of first-year academic
performance. Chang acknowledged that there was limited generalizability because the
study was conducted at a highly selective university where most students are expected to
be academically successfully. This was the expectation regardless of the grit level.
Strayhorn (2013) studied grit among Black males at predominantly White
institutions (PWIs) in a quantitative study similar to the current study. Study findings
showed that African Americans who exerted more grit than their peers earned better
grades. The results of this retrospective study demonstrated that grit was positively
associated with grades for African Americans at PWIs, Whites, females, and adolescents.
This study was important to grit research because studies had not previously focused on
HBCUs or African Americans (Strayhorn, 2013). Finally, Strayhorn suggested that grit
research be performed with college students at HBCUs to extend grit research even

24
further beyond traditional students at PWIs. The results from Strayhorn’s research
affirmed the assertion of Duckworth et al. (2007) that grit positively predicts academic
success in challenging domains more than talent alone.
Research has recently focused on grit and its relation to student success.
Duckworth et al. (2007) provided empirical research on grit, describing grit as persistence
and passion for long-term goals. Duckworth and Quinn (2009) found that grittier West
Point military cadets were less likely to drop out from the curriculum. The authors further
noted that grittier Scripps National Spelling Bee competitors were more likely to advance
into further rounds.
Cross (2014) determined that grit was significantly related to GPA in a study of
doctoral student grit scores and student success. This preliminary research on grit
implicated the importance of grit in relation to educational attainment (Duckworth &
Quinn, 2009; Ray & Brown, 2015; Rojas, Reser, Usher, & Toland, 2012; Strayhorn,
2013). However, this research did show small advancements concerning grit. This is
important as research on grit is limited. Finally, grit, although a relatively new concept, is
continuing to gain momentum.
Hoerr (2013) recommended that educators teach grit since it is a quality that can
be taught rather even though it can be an inherent trait for some. Teaching grit could help
more students stay in college. Skills associated with the grit construct may even be taught
in an orientation course as a skill to be successful in college.

25
Student Engagement
The concept of student engagement is based on the constructivist idea that
learning can be influenced by how students partake in activities that are deemed
important to their academics. Therefore, student engagement encompasses the level that
students engage in a wide array of academic activities that lead to more exceptional
learning (Coates, 2005). The concept of student engagement began with Astin’s (1993)
theory of involvement, which was later named the theory of student engagement. Student
engagement has a long history. Graham, Tripp, Seawright, and Joeckel (2007) advocated
that student engagement was not a new idea, but rather one that could be traced back to
John Dewey. There is a large body of literature that has shown that academic
achievement is positively influenced by active participation in the learning process.
Retention and success rates have been positively correlated with level of
engagement (Goncalves & Trunk, 2014). Consequently, student engagement has been
identified as a primary variable in understanding dropout rates (Hart, Stewart, &
Jimerson, 2011). While studying nontraditional students’ motives for remaining in
college, Goncalves and Trunk (2014) and Przymus (2011) found that institutions can
cultivate increased student engagement by providing more on-campus services and
activities. Further, students who are more engaged tend to be successful (Schweinle &
Hemling, 2011; Weiss & Garcia, 2015). In a study of engagement among students,
Greene et al. (2008) determined that the most highly engaged students persisted.
Therefore, it is plausible to study student engagement in terms of academic performance
to understand its role.

26
Engagement Methods
Student engagement is a complex yet important construct in promoting positive
outcomes for students (Hart et al., 2011). Deater-Deckard, Chang, and Evans (2013)
claimed there were three types of engagement: mental, behavioral, and affective. In a
study designed to understand the relationship between level of student engagement and
persistence, Hu (2011) discovered that 95% students with high-level social engagement
in conjunction with high-level academic engagement persisted. Conversely, Hu also
found that students with high levels of academic engagement alone were less likely to
persist than those who demonstrated middle-level academic engagement.
Stevenson (2013) noted that efforts to maintain engagement among online
students should foster a sense of community. Simmons (2013) explained that African
American men who were involved and engaged in Project Empowerment (PE), a campus
student support service initiative, persisted more academically. Therefore, engagement
and involvement are connected.
One approach to understanding college student success is to identify the amount
of time and energy students devote to activities (Astin, 1993). Hu and McCormick (2012)
presented an engagement-based typology of students in which they found distinctive
patterns of engagement. The authors reasoned that if colleges create analytic techniques
consisting of student types and likely outcomes for each type, they can design targeted
interventions to increase student engagement and persistence (Siegel, 2011).
Grit was first studied in elementary students by Duckworth and a team of
researchers (Duckworth et al., 2007; Goodwin & Miller, 2013a, 2013b). The concept of

27
grit has transcended into postsecondary education as have student engagement efforts.
For instance, Hummell (2015) suggested that college educators and students can benefit
from the positive effect that humor can have on engagement and persistence. Perhaps
college is too boring and students can use a dose of humor in the classroom and within
student support services.
Hallett (2013) proposed that institutional context and culture frame an
individual’s engagement and experiences. Perrotta and Bohan (2013) suggested that
instructors should balance lecture with active-learning strategies to foster more student
engagement. Finally, Tinto (2012) advocated for more academic staff support, higher
expectations for students, and frequent assessment and feedback. Additionally,
institutions should create a culture that better promotes these concepts to ensure student
engagement and retention.
There are multiple examples of student monitoring strategies. For example,
Nelson, Quinn, Marrington, and Clarke (2012) identified the Student Support Program
(SSP), which was created to identify and support those students who are deemed
vulnerable of becoming educationally or institutionally disengaged. Actively monitoring
student engagement can increase student engagement and persistence. Nelson et al.
maintained that it was good practice to monitor student engagement. In fact, many
institutions have adopted monitoring systems. Law (2014) also suggested an early
alert/progress monitoring system for gauging student engagement. Law recommended
allowing instructors to alert advisors when students were struggling in their courses.

28
Mellor, Brooks, Gray, and Jordan (2015) implemented the Portals to Academic
Student Success (PASS) course with the intention of increasing student engagement and
retention. The PASS is an intervention course that exposes students to academic skills,
goal-setting, and goal planning (Mellor et al., 2015). In fact, the PASS course led to a
10% increase in student retention. Other routes have been taken by universities to
improve retention by way of engagement. For instance, some institutions have
incorporated orientation courses geared towards retention and engagement; others have
created first-year programs in hopes of promoting engagement.
National Student Engagement Assessments
CCSSE. Community College Survey of Student Engagement (CCSE) is a
research-based instrument that can be used in three ways: (a) benchmarking instrument,
(b) diagnostic tool, and (c) monitoring device. When used as a benchmarking instrument,
it establishes national norms for educational practice and performance among technical
community colleges. As a diagnostic tool, it can identify areas in which institutions can
improve students’ educational experiences. As a monitoring device, it can aid institutions
in improving overall effectiveness over time. The CCSSE instrument was first
administered in 2001 and was derived from the National Survey of Student Engagement
(NSSE). The NSSE is a comparable instrument that measures engagement in 4-year
colleges and universities.
Colleges use CCSSE feedback to gauge areas of improvement and institutional
conditions that influence student engagement. These areas include group or peer learning,
student effort, academic rigor, interaction between students and instructors, and student

29
support (i.e., students report, inadequate faculty interaction). The institution may then
implement efforts to increase these interactions to increase student engagement.
NSSE. The National Survey of Student Engagement was originated in 1998 as a
method for gathering information concerning collegiate quality (NSSE, n.d.). Institutions
use data to identify features of the undergraduate experience that can be altered to
improve policies and procedures concerning undergraduate education. For instance,
NSSE (2008) feedback showed that students who participated in service-learning
activities showed higher levels of engagement. As a result, more schools implemented
service learning into their undergraduate programs as a way to increase student
engagement.
Results can also provide information regarding how students spend their time and
what they gain from their experiences at different colleges and universities. In 2016, over
1,500 institutions in the United States and Canada participated in NSSE. This instrument
spurred the development of other surveys, including Beginning College Survey of
Student Engagement (BCSSE), which focuses on entering students and their expectations
of college; Faculty Survey of Student Engagement (FSSE), which focuses on
instructional staff perceptions of student engagement; and Law School Survey of Student
Engagement (LSSSE), which focuses on law student experiences.
Other Predictors of Academic Performance
A cornerstone of this study is based on cognitive and non-cognitive skills that
may be attributed to college student success. Kommaraju, Ramsey, and Rinella (2013)
explained that students with higher GPAs are more academically disciplined. The authors

30
further communicated that academic discipline, a non-cognitive indicator of high school
success, is responsible for students’ continued college success. The realization of non-
cognitive indicators led to further research of non-cognitive factors of college student
success. Similarly, Sparkman, Maulding, and Roberts (2012) argued that traditional
predictors of college persistence and success, such as high school GPA (HSGPA) and
standardized test scores, only account for 25% of student college success and are
unrelated to accurate predictions of college graduation. Therefore, attention has shifted to
non-cognitive predictors of college success.
The distinction between cognitive and non-cognitive factors in student behavior is
an important one. Cognitive factors are those that are commonly measured by cognitive
tests such as IQ or academic examinations. Cognitive factors include concepts such as
writing, reasoning, and problem-solving. Non-cognitive skills, a term introduced by
sociologists Bowles and Gintis (1976) refer to a set of beliefs, attitudes, and behaviors,
which are thought to underpin success in school (Gutman & Schoon, 2013). Non-
cognitive factors include constructs such as self-perception, motivation, perseverance,
self-control, resilience, and coping. Therefore, non-cognitive skills are not measured by
academic assessments or IQ tests (Farrington et al., 2012).
The term non-cognitive is used to describe non-traditional predictors that are
associated with behavioral, attitudinal, personality constructs and are derived from
psychological theories, which are called psychosocial factors. Some non-cognitive factors
are actually viewed as cognitive factors outside of higher education. The phrase non-
cognitive is oftentimes used interchangeably with the term psychosocial factors.

31
Psychosocial factors (PSFs) are incrementally predictive of college outcomes (Allen et
al., 2010). In addition, PSFs and non-cognitive factors tend to overlap.
Sommerfeld (2011) argued for a semantic change from non-cognitive to non-
academic to denote these mental processes and psychosocial constructs for conceptual
clarity. However, psychosocial and non-cognitive have been the most widely used terms
to denote these factors. Allen et al. (2010) suggested that the identification of dropouts
and academic failures can be improved by PSFs and that interventions can help academic
performance and persistence. Additionally, non-cognitive constructs have been found to
be strongly related to student academic performance (Komarraju et al., 2013; Sparkman
et al., 2012).
There are other social-cognitive constructs related to grit and student engagement
that have been found to influence student success. Conley (2010) and Arnold, Lu, and
Armstrong (2012a) provided that a broader set of knowledge and skills would transfer
well across into postsecondary settings. These are soft skills and include attributes such
as the ability follow directions, have personal goals, take initiative, work independently,
and as a team (Conley, 2010).
A test was created to gage these soft skills. The Academic Success Inventory for
College Student (ASICS), is a self-report instrument that allows advisors and admission
officers to evaluate academic success in college students (Prevatt et al., 2011). The
ASICS is a web-based survey, which assesses several concepts simultaneously that are
typically assessed through several individual surveys. The ASICS assessment measures
non-cognitive constructs such as career choice, general academic skills, drive and

32
determination, attentiveness, anxiety, social skills, and perceived instructor effectiveness.
Although this instrument measures these constructs to gauge student academic success, it
neglects to measure grit and engagement. Therefore, this measure would not have yielded
results beneficial to this study.
Emerging research examines other non-cognitive constructs such as dispositions,
habits of the mind, executive functioning abilities, external resources, and college
knowledge (Sommerfeld, 2011). For instance, emotional intelligence (EI) has also been
studied in terms of student success and persistence. Sparkman et al. (2012) suggested that
emotional intelligence is the set of attributes that a person must have in order to function
successfully. EI is also a relatively new construct studied in relation to student success in
higher education although it is widely used in business. It is a non-cognitive construct.
Sparkman et al. posed the idea that non-cognitive constructs may be more important to a
person’s success in life than are cognitive ones. EI, as a non-cognitive construct, may
have a positive impact on student success. Improving student emotional intelligence
could lead to aiding students in becoming more successful students (Sparkman et al.,
2012). Further, emotionally intelligent faculty members have better awareness
concerning student emotions, and this allows them to gage student emotional conditions
in students that could lead to attrition (Lillis, 2011).
In studies concerning student engagement and persistence in engineering and
medical programs, Bédard, Lison, Dalle, Côté, and Boutin (2012) and Watson (2013)
argued that stress as a construct was a central determinant of student engagement and
persistence. Finally, Cressy (2011) argued that the benefit of social engagement by way

33
of physical activity and exercise was a positive influence on student academic
engagement and persistence. Cressy added that physical activity and exercise were not
only good for the student health, well-being, and stress reduction but also engagement
and persistence.
Grit and Student Engagement
The current research was focused on the non-cognitive constructs of grit and
student engagement in relation to academic performance. Although grit and student
engagement are considered non-cognitive, they still involve some level of cognition. For
instance, one may not be fully engaged without exerting mental energy to exhibit
engagement. Further, one could not display grit without exerting mental energy to
determine in his or her mind to continue toward personal goals regardless of setbacks. An
individual must decide in his or her mind to do so. Borghans, Duckworth, Heckman, and
Weel (2008) advised that contrasting cognitive and non-cognitive factors can be
confusing because “few human behaviors are devoid of cognition” (p. 977).
Consequently, non-cognitive skills are still cognitive in nature. However, to maintain
consistency with previous research, the term non-cognitive was used in this research
when referring to grit and student engagement.
Through this study I focused on the affective, behavioral, and cognitive sense of
the term engagement as one single entity. Hart et al. (2011) described the term affective
engagement as a student’s feelings toward his or her teachers, peers, learning, and school.
The term behavioral refers to observable student actions or participation while at school,
and focuses on a student’s positive conduct, effort, and participation. Cognitive refers to

34
the cognitive processing a student uses while engaged in academic responsibilities as well
as the amount and type of approaches a student uses regarding those responsibilities. It is
important to note that though the term, cognitive, as used in the context of student
engagement, refers to what can be measured via traditional academic assessments and
exams. Conversely, the larger term engagement is still considered non-cognitive because
it cannot be measured via traditional academic assessments and exams (Farrington et al.,
2012). Although, student engagement is multi-dimensional in nature, this study focused
on students’ levels of affective, behavioral, and cognitive engagement, as measured by a
psychometrically sound instrument that assessed all three to determine the overall level of
engagement.
Some studies have suggested a relationship between engagement and academic
performance. Taylor and Parsons (2011) suggested there was no doubt that student
engagement was important to fostering academic success. Von Culin et al. (2014) and
Astin (1999) urged that student engagement was critical to academic performance and
success. Moreover, academic performance or grades have been known as the best
representation of students persisting through graduation (Pascarella & Terinzini, 2005).
Therefore, understanding factors that influence academic performance may provide a
better understanding of ways to target and improve graduation rates.
Although grit and student engagement are both non-cognitive constructs, they
have a distinct difference. Grit is considered a personality trait that encompasses
perseverance and passion (Duckworth et al., 2007), and engagement is considered an
academic behavior. Some people are considered grittier than others. Some are naturally

35
born with an innate ability to persevere even after encountering setbacks more than
others. Other individuals tend to relinquish their goals under pressure or trying times.
Engagement is an academic behavior, and academic behaviors are major determinants of
academic performance (Farrington et al., 2012). Engagement occurs when students
decide to exert mental and physical energy on academically purposeful activities. In other
words, engagement is what students do to facilitate in their own learning and academic
performance. Academic behavior acts as a mediator of other cognitive and non-cognitive
factors that affect academic performance (Farrington et al., 2012). This idea suggests that
student engagement mediates grit and that they both affect academic performance. It is
also important to understand that grit and student engagement are malleable constructs.
They may change from person to person depending on the setting and context.
Literature Concerning Methods
There are three main approaches to research: quantitative, qualitative, and mixed
methods. This study used the quantitative methodology. Quantitative methodology was
considered the best choice for this study because the quantitative approach is mainly
concerned with numerical data, while qualitative is concerned with data collected in
words and phrases. The quantitative method was chosen for this study because this
approach is used for examining the relationships among variables (Creswell, 2012). The
variables may be measured with instruments, so data can be analyzed using statistical
procedures. This was seen as a better option for this correlational study to understand the
relationship among numerical data.

36
The opposite approach, qualitative methods, was not used for this study. It is an
approach for exploring the meaning individuals ascribe to social or human problems
(Creswell, 2012). Qualitative methods would not have allowed the researcher to test the
data statistically to understand the possible associations among the data. The research
questions posed in this study were not suited for collecting qualitative responses. Survey
research was conducted because of the nature of the study because survey research
provides quantitative or numeric description of attitudes, opinions, or trends (Creswell,
2012).
This study used the Pearson product moment correlation coefficient as a statistical
test to understand the relationship among data as is standard for correlational studies that
incorporate linear relationships (Creswell, 2012). Other statistical tests can determine
non-linear relationships such as Spearman’s rho, point-biserial, and phi-coefficient.
Spearman’s rho determines the relationship among non-linear ordinal data, point-biserial
tests continuous data with a dichotomous variable, and phi-coefficient is used to
determine the degree association when both variable measures are dichotomous.
Therefore, the best test for this study was Pearson product moment correlation coefficient
to determine the degree of association among the variables linear relationships (Creswell,
2012). Using the Pearson product moment correlation coefficient allows the researcher to
measure the degree of association via the direction (positive or negative) and strength
(size of coefficient) between variables.

37
Summary
This section referenced literature pertaining to the topic of student success as it
relates to grit and engagement. The next section outlines the methods that were used to
complete the study. Section 3 details the design of the study, the approach that was taken,
important details concerning the setting and sample, and the instruments that were used to
acquire the needed information in understanding academic performance in relation to grit
and student engagement.

38
Section 3: Research Method
Introduction
I examined the relationships between grit, student engagement, and academic
performance. In this section, I outline the design and approach, the setting and sample,
and the instrumentation used for the study. Further, I explain data collection and analysis
procedures, and discuss the steps I took to protect participants’ rights.
Research Design and Approach
In this quantitative study, I used a convenience sample of all students of WSCC.
A correlational design was used to measure the relationship between grit, student
engagement, and academic performance. Creswell (2012) suggested that the quantitative
approach is necessary when one aims to understand the mathematical relationship
between variables. A qualitative approach would have been less appropriate for this study
designed to investigate the overall relationship between concepts, and more appropriate
for a study designed to take an in-depth look at grit.
Setting
As a multi-campus institution, WSCC serves students in both metropolitan and
rural areas. The demographic make-up of the population is 75% African American, 14%
European American, 8% unknown, 1% Hispanic, 1% two or more races, 59% female, and
41% male. This institution is comprised of 3,000 students, approximately 500 of whom
are first-time, first-semester students; therefore, all first-time, first-semester students had
to be excluded from the study because they could not have reported their FYGPA yet.

39
Sample
Of the 3,000 students, there were 2,500 students that were in their second or later
semester and therefore, were eligible for the study because they could report the FYGPA.
Although, a convenience sample may have biases concerning overrepresentation or even
underrepresentation of certain groups, it was my chosen sampling method due to its
simplicity in acquiring willing and able participants (Creswell, 2012). Therefore, a
convenience sample of all WSCC students was used, and consisted of 116 participants
from the eligible 2,500 students, which was a response rate of 5%. Even though the
response rate was very low, there were enough completed surveys to calculate the
correlations because a priori power analysis in G* Power determined that 112 participants
were needed for statistically valid results (Faul, Erdfelder, Buchner, & Lang, 2009). The
calculation was based on 90% power for the statistical analyses, a medium effect size of
.30, and the standard 5% significance level (Cohen, 1988).
The population consisted mostly of African American students with 2,276 African
American/Black students, 427 White/European American students, and 297 students of
other races/ethnicities. However, the participants from the sample consisted of
approximately 90 Black/African Americans, 20 White/European Americans, three of
other races/ethnicities. Most students were between the ages of 18 and 24, which made up
67% of the sample. There were more females than males in the sample, 80% to 20%
respectively. Although full- and part-time students received the email invitation, full-time
students comprised 85% of the sample. Participants had to have an FYGPA to participate
in the study. The FYGPAs of the sample were high, mostly above 3.0.

40
Instrumentation and Materials
I used the following assessment instruments in the study:
• The Short Grit Scale (Grit-S; Duckworth & Quinn, 2009).
• Student Engagement Instrument-College (SEI-C) survey (Appleton et al., 2006).
• Self-reported FYGPA.
The Grit-S and the SEI-C were appropriate for this study because they measured the
variables, which were grit and student engagement. Permission is universally granted for
free use of the SEI-C instrument for the purposes of research and practice that will not
result in profit. The Grit-S is also freely available to researchers and educators for non-
commercial purposes. Therefore, formal permission to use these instruments was not
required.
Short Grit Scale
The Grit-S scale is an 8-item instrument that measures grit based on two subscales
concerning consistency of interest and perseverance of effort (Duckworth & Quinn,
2009). Each question assessed one of these two facets of the variable grit. The Grit-S has
demonstrated evidence of internal reliability with a Cronbach’s alpha ranging from .70 to
.84 in six different reliability tests (Duckworth & Quinn, 2009). The instrument was
correlated, and validity was established against the Big Five Consciousness subscale of
conscientiousness, and validity was ensured. Completion of this survey usually takes two
to three minutes. To obtain grit scores, the researcher must add all points from each
completed survey and divide by eight. Grit levels range from 1 to 5, with 5 being the
highest, which denotes the highest level of grit. The survey requires Likert-style

41
responses not at all like me, not much like me, somewhat like me, mostly like me, and very
much like me.
Student Engagement Instrument-College
The SEI-C is a 35-item instrument that measures student engagement based on
five subscales including (a) teacher-student relationships, (b) control and relevance of
school work, (c) peer support at school, (d) future aspirations and goals, and (e) family
support for learning (Grier-Reed et al., 2012). Each question assessed one of these five
facets of student engagement. The SEI-C has demonstrated evidence of internal reliability
with a Cronbach’s alpha ranging from .79 to .85 for each construct denoted as subscales
(Grier-Reed et al., 2012). The instrument has also demonstrated evidence of convergent
validity because it has positive correlations with the Career Thoughts Inventory (Grier-
Reed et al., 2012). The Career Thoughts Inventory is directly related to students’ thoughts
concerning persistence to their career goals through educational attainment. The survey
requires Likert-style responses strongly disagree, disagree, agree, and strongly agree.
Points from each response item are added and then divided by 35 (the number of items).
The closer the score is to 4, the higher the engagement, the closer to 1, the lower the
engagement. Participants in my study completed the survey via SurveyMonkey.
Demographic Survey
Demographic characteristics of the participants were needed to describe the
participants of the study. Therefore, I asked the participants to identify their age, gender,
ethnicity, FYGPA, and number of credit hours completed. This information was used to
provide descriptive statistics, and to compare results to the demographic profile of the

42
institution’s student body in relation to the FYGPA, which served as proxy for academic
performance.
Data Collection and Analysis
Students were recruited by an invitational email sent by the academic dean that
included the link to the survey on SurveyMonkey. I collected data after permission was
granted by the institutional review boards of WSCC and Walden University. The first
part of the survey contained information regarding informed and implied consent.
Creswell (2012) suggested that the consent form should outline participant rights,
including their right to withdraw at any time, their voluntary participation, and their right
to know the purpose. Students consented by completing the surveys. Participants
anonymously completed the Grit-S and SEI-C, and self-reported their FYGPA and
demographic information. The nature of the scale for each variable follows:
• FYGPA, continuous/interval/criterion.
• Student engagement scores, continuous/interval/predictor.
• Grit scores, continuous/ interval/predictor.
In this correlational study, I addressed the following two research questions and
hypotheses:
Research Question 1: What is the relationship between student engagement scores
as measured by the Student Engagement Instrument-C and academic performance as
measured by FYGPA at WSCC?
H10: There is no statistically significant relationship between Student Engagement
Instrument-C scores and academic performance as measured by FYGPA at WSCC.
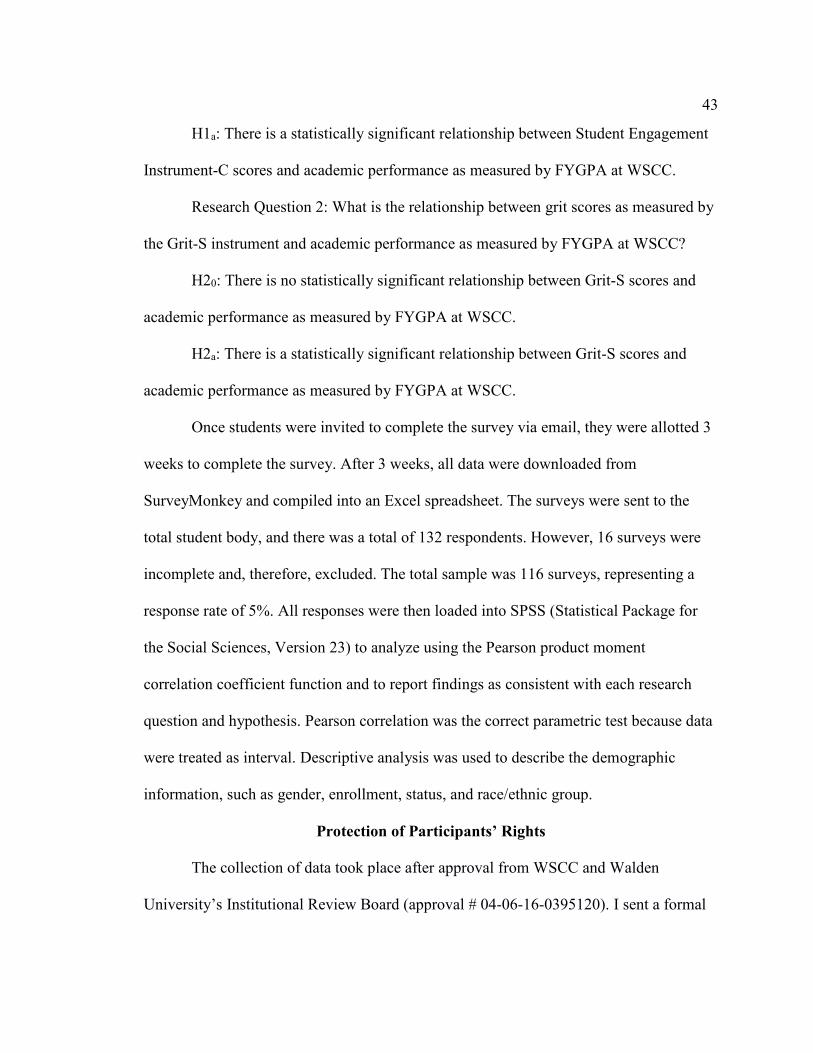
43
H1a: There is a statistically significant relationship between Student Engagement
Instrument-C scores and academic performance as measured by FYGPA at WSCC.
Research Question 2: What is the relationship between grit scores as measured by
the Grit-S instrument and academic performance as measured by FYGPA at WSCC?
H20: There is no statistically significant relationship between Grit-S scores and
academic performance as measured by FYGPA at WSCC.
H2a: There is a statistically significant relationship between Grit-S scores and
academic performance as measured by FYGPA at WSCC.
Once students were invited to complete the survey via email, they were allotted 3
weeks to complete the survey. After 3 weeks, all data were downloaded from
SurveyMonkey and compiled into an Excel spreadsheet. The surveys were sent to the
total student body, and there was a total of 132 respondents. However, 16 surveys were
incomplete and, therefore, excluded. The total sample was 116 surveys, representing a
response rate of 5%. All responses were then loaded into SPSS (Statistical Package for
the Social Sciences, Version 23) to analyze using the Pearson product moment
correlation coefficient function and to report findings as consistent with each research
question and hypothesis. Pearson correlation was the correct parametric test because data
were treated as interval. Descriptive analysis was used to describe the demographic
information, such as gender, enrollment, status, and race/ethnic group.
Protection of Participants’ Rights
The collection of data took place after approval from WSCC and Walden
University’s Institutional Review Board (approval # 04-06-16-0395120). I sent a formal

44
letter of cooperation to WSCC, which included the purpose of the study, the fact that
there is no compensation for the students, and the time required of participants to
complete the online survey during non-academic time. The letter included descriptions of
the activities to be conducted, benefits to the organization because of the study, and the
provisions made to protect the anonymity of participants (see Creswell, 2012). No
participant was placed at risk or harm because no personal information was obtained
through this study. All data will be stored on a password-protected laptop for 5 years and
will then be destroyed.

45
Section 4: Results
Introduction
I examined the variables grit, student engagement, and academic performance to
determine relationships based on the two research questions for this study. The following
instruments were used to measure the three variables: Grit-S, which measured grit; SEI-
C, which measured student engagement; and self-reported FYGPA, which measured
academic performance. The use of the instruments, the data analysis, and the findings are
presented in this section.
Research Tools
The two surveys, Grit-S and SEI-C, and the demographic questionnaire were
combined into one survey of 49 questions, which included six prompts pertaining to
descriptive response items. To obtain the composite score for the Grit-S, all responses
were assigned a number from 1-5, which I reverse-coded by negatively worded questions.
The numbers from each response item were added and the total was divided by eight (the
total number of response items) to obtain a mean. Per the developers, the higher the
score, the higher the grit level. The SEI-C was also administered through SurveyMonkey
and to obtain a composite score, the response items were assigned a number from 1 to 4.
The negatively worded responses were reverse-coded, and the number from each
response item was added and totaled. I then divided the total by 35 (the total number of
questions) to obtain a mean. Once calculated, the closer to 4, the higher the student
engagement. I calculated both the grit and student scores by hand after downloading and

46
printing the data from SurveyMonkey. A total of 116 students responded to the email
invitation sent by the academic dean, and responses were collected over a 3-week span.
Data Analysis
Descriptive Statistics for Participant Demographics
The first part of the survey required participants to answer a few questions regarding
demographic information: gender, enrollment status, age, race, and FYGPA. the
breakdown according to gender for the sample of 116 participants indicates that more
females than males participated in the study. 75% were female and 25% were male. Data
regarding the participants’ enrollment status was collected and summarized most
participants had full-time status, which made up 71%. Less than one-half of the
participants were part-time students, which made up 29%.
Data regarding each participants’ age were collected. Table 4 shows the frequency
of participant ages by group.
Table 4
Participant Age Groups (N = 116)
Age Group Frequency Percent
18-24 67 57.8 25-34 21 18.1 35-44 16 13.8 45-54 7 6 55-64 3 2.6 65-75 1 .9 75+ 1 .9
As is shown in Table 4, I collected the participants’ ages and assigned each to a group
because it was not necessary to report each individual’s specific age. The results indicate

47
that most participants were between 18 and 24, which should be expected on a
community college campus.
Demographic information concerning participant race and ethnicity was collected.
Table 5 provides an illustration of participants’ race and ethnicity.
Table 5
Participant Race/Ethnicity (N = 116)
Race/Ethnicity Frequency Percent
Black/African American 95 81.9 White/European American 18 15.5
Multi-Racial 3 2.9
As indicated in Table 5, data showed that the majority of the participants were Black or
African American. This information was collected only to gauge the background of the
participants of the study, and was self-reported. The results were expected because the
research was performed at a historically Black community college.
Table 6 provides an illustration of the participants’ FYGPA ranges.
Table 6
FYGPA Range (N = 116)
FYGPA Range Frequency Percent
3.6-4.0 43 37.1 3.1-3.5 42 36.2 2.6-3.0 21 18.1 2.1-2.5 6 5.2
2.0 or below 4 3.4
As shown in Table 6, there were 43 participants with FYGPAs between 3.6 and 4.0. Most
participants self-reported FYGPAs of more than 3.0.

48
FYGPAs were the dependent variable. The mean for FYGPA was 3.30 which
indicates that the students from the sample had higher than average academic
performance. The median was 3.41, which is important because it indicates that FYGPA
that was in the middle was a better representation of the middle of the group, as opposed
to the mean which was lower. The mode was 4.0, which means that more participants
actually had perfect FYGPAs. The standard deviation measures the variation of the data
set, which was .6353. The range was 3.0, and the lowest FYGPA score(s) reported was
1.0 (the minimum); the highest FYGPA score(s) reported was 4.0.
Research Question 1
What is the relationship between student engagement scores as measured by the
SEI-C and academic performance as measured by FYGPA at WSCC?
H10: There is no statistically significant relationship between SEI-C scores and
academic performance as measured by FYGPA.
H1a: There is a statistically significant relationship between SEI-C scores and
academic performance as measured by FYGPA at WSCC.
I used the SEI-C scores, taken from those items on the survey that were the SEI-C
questions, to calculate descriptive statistical data. The mean value for SEI-C was 1.78,
which means this was the average of the scores. The minimum score was 1.0, and the
maximum score was 3.7, which indicates that no score was higher than 3.7 or lower than
1.0. However, the closer a student’s SEI-C score was to 4, the higher the engagement, as
indicated on the SEI-C. The closer the student’s SEI-C score was to 1, the lower the
engagement, as indicated on the SEI-C. The mode was 1.8, which means that number

49
occurred the most times. The low student engagement mean score indicates low levels of
student engagement. The standard deviation was .413, which indicates there was not a
high rate of dispersion.
Although SEI-C scores were lower than 4, which indicated low levels of
engagement, the Pearson correlation indicated no statistically significant relationship
between the SEI-C scores and academic performance, as measured by FYGPA. There
was no statistically significant relationship between the two (r = .081, p = .194). Those
findings are indicated in Figure 1.
Figure 1. Scatter plot depicting SEI-C scores and FYGPA.

50
There is no linear impression within the scatter plot, and there was no definitive
relationship between the two sets of scores. Therefore, the findings failed to reject the
null hypothesis of Research Question 1.
Research Question 2
What is the relationship between grit scores as measured by the Grit-S instrument
and academic performance as measured by FYGPA at WSCC?
H20: There is no statistically significant relationship between Grit-S scores and
academic performance as measured by FYGPA at WSCC.
H2a: There is a statistically significant relationship between Grit-S scores and the
academic performance as measured by FYGPA at WSCC.
The mean value for grit scores was 3.49. The lowest grit score (minimum score)
was 3, and the highest grit score (maximum score) was 4, which indicates that no
student’s grit score was less than 3 or higher than 4. The median was 3.5 and the mode
was 3, which means that the score of 3 occurred the most times in all the scores. The
maximum score that could be indicated was a 5 on the Grit-S portion of the survey. The
standard deviation was .368, which indicates a small rate of dispersion.
Although Grit-S scores were moderate to high (meaning there were mostly high
levels of grit), the Pearson correlation indicated no statistically significant relationship
between academic performance, as measured by FYGPA, and Grit-S scores. There was
no statistically significant relationship between the two (r = .058, p = .269). Therefore,
the findings failed to reject the null hypothesis. Figure 2 provides an illustration of this
relationship.

51
Figure 2. Scatter plot depicting Grit-S scores and FYGPA.
Figure 2 indicates that there was no relationship between Grit-S scores and FYGPA.
There is no definitive linear impression within the scatter plot. There was no significant
linear relationship between the FYGPA scores and the Grit-S composite scores.
Therefore, the findings failed to reject the null hypothesis for Research Question 2.
Findings
The results of this study show no statistically significant relationship between grit
scores or student engagement scores and academic performance as measured by the self-

52
reported FYGPA. I determined the results by using a one-tailed Pearson correlation so
that an increase could be predicted. Although, this disregards the possibility of a
relationship in the other direction, a relationship in the other direction was deemed highly
unlikely. In one way, the findings are inconsistent, in that they show low levels of student
engagement for Research Question 1, which questioned the relationship between student
engagement and academic performance. Yet, they show moderate to high grit levels for
Research Question 2, which questioned the relationship between grit and academic
performance. However, both research questions yielded no relationship between the
variables. It is in this way that the results show a consistency in that there is no
relationship among the variables. A possible interpretation of this is that the variables are
simply not related.
There are alternative ways to interpret these findings. One possible interpretation
of the results is that although student grit levels are high, meaning that they should be
more likely to hold on to their long-term goal of graduating, there is a disconnect because
students are not graduating at WSCC. The disconnection could be due to that in true
nature of a community college, many of the students plan on transferring elsewhere to
complete their programs of study and graduate. The students are possibly not fully
integrated academically and socially into WSCC due to future graduation goals. Further,
the majority of the participants had FYGPAs of 3.1 or higher. Yet, there is no relationship
between the high grit levels and the FYGPA, which does not adequately explain the low
graduation rates because the students are seemingly capable of doing so. However, the

53
statistical test provided that there is no relationship between grit scores and academic
performance as FYGPA.
Another way of interpreting the findings is by taking into account the student
engagement levels. The student engagement levels are low because most of the scores
were in the range of one, which was the lowest possible score. None of the scores were a
four, which would indicate high levels of student engagement. This is puzzling; although
students had low engagement, their FYGPAs were high overall. One could question how
this is possible for students to be barely engaged and still have high FYGPAs, which
could provide more information concerning low graduation rates. This brings into
possible question grade inflation, or even the truthfulness of the self-reported FYGPAs.
This also calls into question whether or students are truly academically and socially
integrated into the institution. Students are possibly disengaged due to not being fully
integrated because they have plans on transferring to other institutions for completion of
their programs of study and graduation. Regardless, the statistical test provided that there
is no relationship between student engagement and academic performance as FYGPA.
Conclusion
I found there was no significant relationship between student engagement and
academic performance as measured by FYGPA. I also found that there was no significant
relationship between grit and academic performance as measured by FYGPA. It is noted
that the SEI-C scores indicated that there were low levels of student engagement, yet
there were higher levels of grit indicated by the Grit-S. It is questionable as to how a
student can have high levels of grit and low levels of student engagement, and how

54
students can have high FYGPAs, but low graduation rates. That could be because of the
low levels of student engagement. Perhaps students have a desire to hold to their goal of
graduating but are not engaged enough to hold to this goal over an extended period of
time. However, the results still show that there is no relationship between the low levels
of engagement and FYGPA, nor is there is a relationship between the high grit levels and
FYGPA. Therefore, I failed to reject the null hypotheses of both research questions.

55
Section 5: Discussion, Conclusions, and Recommendations
Introduction
In this section I present a summary of the study based on the results provided in
Section 4, interpretation of these findings on a broader scope, implications for social
change, recommendations for actions, and recommendations for further study. This
correlational study was completed in order to investigate whether or not there was a
relationship between grit scores (Grit-S), student engagement scores (SEI-C), and
academic performance level as indicated from self-reported FYGPA. I found that there
was no relationship between the variables. The research questions that I sought to answer
were:
1. What is the relationship between student engagement and academic performance
at WSCC?
2. What is the relationship between grit and academic performance at WSCC?
Interpretation of Findings
The findings are both consistent and inconsistent with previous research which
has show significant and insignificant relationships between grit and academic
performance, and engagement and academic performance. However, these other studies
were conducted at different types of institutions. For example, Strayhorn (2013) studied
grit and academic performance concerning a solely male, African American population of
140 at a predominantly White institution. The author found that grit did positively affect
academic performance. Strayhorn noted that it predicted graduation for those students
better than traditional predictors such as ACT scores and high school grades. However, in

56
this study, I was found that grit scores were not related to academic performance scores
(see Figure 2), which could be attributed to the difference in students. Further, while
Strayhorn’s study (2013) included a completely African American male sample, my
study had a higher number of female students (see Table 4). Perhaps, grit correlates with
academic performance for African American men and not women.
Chang (2014) studied the relationships between grit and academic performance at
a highly selective, private, 4-year institution and found no significant relationship
between the grit composite score and academic performance. Chang’s findings are
attuned with those in this study. However, Chang’s study was conducted with the most
competitive students with ACT scores averaging 29 or better, and the sample was large,
with more than 2,000 participants. The results of this study are consistent with Chang’s
study in that I found no significant relationship between grit and academic performance.
Chang did find that the perseverance subscale of the Grit-S did positively correlate with
academic performance, but that the overall grit composite score did not. Because Chang
had mostly female participants, it can be assumed from her study and mine that perhaps
grit composite scores do not correlate to academic performance for females.
Another difference between Chang’s (2014) study and this study is that this study
was done based on the assumption that students would self-report their true FYGPA (see
Table 9). One limitation of this study was that students self-reported their FYGPA.
Chang collected student GPAs from the university instead of using self-reported GPAs
from the participants. However, that still does not negate the fact that upon using the

57
composite grit scores, no relationship was found between grit and academic performance
in either study (see Figure 2).
Cross (2014) studied grit in 699 doctoral students matriculating in an online
environment. The findings were that grit did share a small yet significant relationship
with academic performance in females and not males. Cross also found significant
relationships between grit and age, gender, and self-reported number of hours spent on
coursework. Cross’s study was different from this study in that those students were
working on a terminal degree. It could be expected that doctoral students would have
higher grit levels than 2-year college students.
Conversely, Pineda-Báez et al. (2014) studied the degree of association between
engagement and academic performance using Spearman’s rho, via the Spanish version of
the NSSE, at seven Colombian universities with high-quality accreditation. With a total
of 1,906 participants, the study yielded statistically significant yet weak results. The
study indicated that the higher the GPA, the higher the engagement, although the
relationship was weak. Those results were contrary to this study’s results in that most of
the participants had high GPAs, yet they had low engagement scores overall. In my
study, the high GPAs were not associated with high levels of engagement. A major
difference between Pineda-Báez et al.’s study and this study is that this study included
participants from only one institution while theirs included participants from seven
different Colombian universities and totaled over 3,000 students. Pineda-Báez et al. did
not disclose the ratio of men to women or cultural and ethnic group breakdowns.

58
Hu and McCormick (2012) completed a study concerning 18 participating
institutions using student responses from NSSE. The authors found student engagement
was only associated with academic performance when GPAs were low. In other words,
the lower the GPA, the more engaged the students were in that study. Conversely,
although students had high FYGPAs in my study, their engagement levels were low. The
results of this study are inconsistent with Hu and McCormick’s outcome because this
study showed that at this predominantly African American community college, there
were no significant relationships between academic performance and student
engagement, regardless of FYGPA (Figure 1).
Weiss and Garcia (2015) studied academic performance and engagement at
Mexican universities using the Programme for International Student Assessment
instrument to obtain engagement levels. Weiss and Garcia found that students who had a
higher sense of belonging on the campus had better academic performance. In my study,
although students had high academic performance, they had low engagement (see Figure
1). It could be concluded that students have little to no sense of belonging at WSCC,
which may account for their disengagement. Weiss and Garcia found that engagement
was an essential ingredient for student achievement and persistence. This notion could
help explain WSCC’s low graduation rates.
Historically, researchers have used traditional methods to understand what
influenced academic performance. These traditional methods include assessing
SAT/ACT scores, among other factors. Recently, there has been a shift to understanding
how personality, behavioral traits, and non-cognitive factors influence academic

59
performance (Strayhorn, 2014). However, the relatively new construct of grit has not
been extensively researched, whereas student engagement is more commonly
investigated.
Academic performance is a factor that influences and even predicts student
graduation. Although there are other non-cognitive factors that relate to academic
performance, grit and student engagement were the non-cognitive factors I investigated in
this study. Scores from grit survey questions (see Table 11) and student engagement
survey questions (see Table 10) were analyzed in relation to FYGPA to understand the
relationship. However, I found that both variables were not significantly correlated to the
FYGPA (see Figures 1 and 2).
In this study, I explored whether there was a relationship between student
engagement scores and academic performance scores at WSCC. I found that there was no
statistically significant relationship. The r was closer to zero, which meant there was no
statistically significant relationship (see Figure 1). I also questioned if there was a
relationship between grit scores and academic performance scores at WSCC and found
that there was a no statistically significant relationship, as r was closer to zero (see Figure
2).
Farrington et al. (2012) suggested that there are relationships between grit and
academic performance, and that these relationships show stronger when they are
measured concurrently. They suggested measuring grit while students are in a particular
course to understand the relationship between their grit level and academic performance.

60
One of the basic tenets of psychology is that human behavior and traits are
malleable; it is possible to change one’s behavior (Farrington et al., 2012). Grit and
student engagement can change. They are malleable constructs, and, depending on the
context or situation, one’s grit or engagement may change. A person may appear to
exhibit grit in a certain setting and appear apathetic in another. Grit and engagement can
change depending on the classroom context or the psychological conditions. Changes in
context or psychological conditions of students have been associated with an increase or
decrease in their effort (Farrington et al., 2012). The context of the survey or
psychological conditions of the students at the time of the data collection could have
affected the results. Institutional conditions could also have had an effect on the results of
the study. For instance, if students were not happy with the courses they were in during
the semester of taking the survey, student sense of belonging, student networking, and
relationships with professors could have affected results. Any of these could have had an
effect on student grit or engagement at the time of the surveys, given that results showed
low engagement levels and high grit levels.
Although I found no statistically significant relationship, it does not negate the
fact that other research has found significant relationships between grit, student
engagement, and academic performance (Cross, 2014; Strayhorn, 2013). This particular
study was conducted at an HBCU with unusually low graduation rates. Further, Tinto
(1993) suggested that there are many non-cognitive factors that contribute to student
attrition. Because the relationships probed in this study were found to be insignificant in
relation to one another, findings indicate that for 2-year HBCUs, there may be other

61
factors or other combinations of factors. Given the small sample size, these results are
generalizable to only WSCC.
The fact that the results showed low levels of engagement but high FYGPAs
bolsters the theoretical underpinning of this study. Tinto’s theory of retention explicitly
states that low levels of engagement can influence student persistence to graduation. If
students have not been socially integrated to the campus, regardless of how high GPAs
are, they may still drop out. Tinto has claimed that institutions should be engaged with
students, and has contended that engagement necessary for both the student and
institution. Institutions should engage students through their expectations, support,
assessment feedback, and involvement (Tinto, 2012). It seems that in the case of WSCC,
students could be disengaged if the institution has not engaged itself nor socially
integrated the students. This could explain the low graduation rates because although
students have high grades, they are simply not engaged.
Implications for Social Change
Graduation rates will need to increase at WSCC for students to have the potential
for a better quality of life, which could lead to stronger communities and stronger
workforce development. WSCC’s quality enhancement plan is highly focused on
improved student engagement, and its reputation will reflect its overall performance as a
better school when graduation rates improve. As a result of my findings, the institution
will know that student engagement is not the main factor that drives increasing academic
performance at WSCC. Creating conditions that foster student success has never been
more important (Kuh et al., 2006), and WSCC should now seek to understand other

62
constructs and conditions that may lead to increased academic performance and
improvement of graduation rates such as self-efficacy, motivation, college preparedness,
and related factors. These research efforts could lead toward producing more graduates,
thereby increasingly providing quality higher education to underserved groups of
students.
Kuh et al. (2006) proposed that four-fifth of students rely on higher education to
prepare them to live financially self-sufficient lives. College education also aids in
helping college graduates to deal with complex social, political, and cultural matters that
they must face. Finally, Kuh et al. (2007) suggested that college graduates make
approximately $1 million more within their lifetime than do those without a degree.
However, if current dropout trends continue, it is predicted that there will be a deficit of
14 million college-educated adults by 2020. Therefore, improved graduation rates can
benefit the institution, its community, its students, and the society at large.
Recommendations for Actions
The results from this study will be disseminated to WSCC. Although, results
showed no statistically significant relationships (see Figures 1 and 2), the discussion of
how to increase graduation rates should focus on other non-cognitive constructs that
might play a role in student academic performance. They could also seek to understand
grit and student engagement in association with other non-cognitive constructs, such as
exploring other non-cognitive constructs, such as academic mindsets, learning strategies,
socials skills, and academic behaviors to understand those relationships with academic
performance. They should examine other conditions that have been created at the
63
institution that either fosters positive student academic performance or the contrary.
Finally, the constructs of grit and student engagement could also be combined and
studied together to understand their relationship instead of as separate entities as in the
study.
Several other conditions influence students’ academic performance. Concerning
the theoretical underpinning of this study, Tinto’s (2012) concept of social integration,
Tinto’s (1975) idea of student interaction, and Tinto’s (1987) idea of institutionally
provided educationally-purposeful activities all promote the idea that institutions have a
responsibility in students’ academic performance. All three concepts focus on social
implications of the institutions as institutions play a substantial role in students’ academic
performance. Institutions must provide outlets for ensuring academic performance. Social
conditions that affect academic performance are previous academic performance and
level of preparedness, economic factors, academic culture, and peer influence.
Institutions can use the proposed strategies detailed in the following.
Previous academic performance and level of preparedness are important to
college academic performance. Tinto (2012) posed the idea that institutions must ensure
that students are equipped to achieve positive academic performance. They must enter
with or be provided the opportunity to be successful. For instance, highly selective
colleges may screen for a set of attributes that exemplify students as already equipped to
succeed or provided students with opportunities to become equipped. Many less selective
colleges provide developmental courses for students to gain more fundamental
knowledge in core areas such as math and reading. Other institutions provide mandatory

64
orientation courses that equip students with skills such as time management, critical
thinking, and study skills.
Economic factors may also drive student effort concerning academic
performance. Economic stressors are a concern because if students are overworked and
are not allowed to socially integrate or engage within the institution, then engagement is
no longer taking place (Tinto, 2012). The fact that WSCC is a community college means
that it is home to non-traditional students. Many are students who work to provide for
their families. Many students do not live with their parents and have bills and other
expenses. There are also higher percentages of older students who may even be on fixed
incomes. Given these economic stressors, institutions must be sure to provide avenues to
obtain an affordable education to remove the stress of paying for education in
conjunction with other financial stressors. Institutions may provide tuition discount and
reduction incentives, scholarships, grants, and even work college programs. Through
college work programs, students will be able to work on campus as fulfilment of their
tuition.
Institutions must also be mindful of their academic culture. Academic culture
includes the expectations for the student and their overall academic performance. Higher
education administration and faculty have a duty to express high expectations concerning
student academic performance. Tinto (1993) advocated that institutions be intellectually
stimulating, and that faculty members employ high expectations. Expectations can be
expressed through course syllabi, via campus-wide email concerning student conduct and
academic attainment, verbally throughout courses, and reinforced in other ways on

65
campus, so that students realize that expectations are uniform and throughout the campus.
Tinto (1987) also suggested that student-faculty interaction is important concerning
academic culture. It must be expected that there is student-faculty interaction. Through
this interaction, faculty must express their expectations concerning academics. Tinto
urged that there are strong relationships between every academic achievement and degree
attainment. Student-faculty interaction also has a strong relationship with many social
outcomes including becoming involved in campus activities and having stronger
influence on other students. In fact, the academic culture concerning all expectations
must be consistent, so that they are clearly recognized by all students. Institutions also
have a responsibility to focus more on student outcomes as prescribed by the set
expectations of the academic culture.
Peer influence presents another social factor that is of concern pertaining to
academic performance. There is power in peer influence. Therefore, it is important that
students gain this experience in college. Tinto (2012) offered the idea that peer
interaction positively effects students in the areas of leadership skills development,
scholastic growth, growth in problem-solving and critical thinking skills, and developing
cultural sensitivity. The author also noted that there are even long-term effects associated
with peer influence that remain in students beyond college and into their careers.
Cooperative learning or peer groups even allow students to hone much-needed skills such
as public-speaking, ability to influence peers, and ability to successfully work
collaboratively (Pascarella & Terezini, 2005).

66
Institutions must provide students with positive outlets to influence one another.
These outlets include but are not limited to extracurricular activities including intramural
sports, social clubs such as sororities and fraternities, collaborative and group projects
and assignments, opportunities to tutor other students, and opportunities to discuss course
content. Peer influence, if implemented, could improve academic performance
concerning graduation.
Several recommendations for action have been provided further to understand the
academic performance at WSCC. It is recommended that previous academic performance
and level of preparedness, economic factors, academic culture, and peer influence all be
studied within the context of social influences of academic performance. Although, these
are not non-cognitive factors, it is recommended that WSCC goes beyond the non-
cognitive factors to study the aforementioned social influence that could have an effect
on the academic performance of students.
The results of this study may be disseminated to and presented at professional
conferences and published in appropriate, professional journals. One conference is The
National Institute for Staff and Organizational Development (NISOD) conducted by
University of Texas-Austin every May. This is a conference specifically for technical and
community colleges. One journal considered for publication of the study is the Journal of
Higher Education. This journal is the leading scholarly journal on the institution of
higher education. The articles published within the journal discuss issues important to
higher education faculty members, administrators, and program managers while
providing scholarly insight and investigating critical issues.

67
Recommendations for Further Study
I would recommend a longitudinal study of students in high school, to entering
college, and to college graduation to understand the effects of grit and engagement. I
recommend this longitudinal approach because students change over time. From high
school to college is a major transition, and by the time of graduation, some student may
have changed drastically. However, it would provide a better understanding of grit and
engagement on college completion.
I would also recommend further study of non-cognitive factors at larger HBCUs
or on several HBCUs concurrently because no other study has been conducted to
understand the relationship between grit and student engagement on HBCU student
academic performance as they are understudied in comparison to PWIs (predominantly
white institutions). Perhaps, a larger HBCU or several HBCUs simultaneously would
provide more generalizability. Another recommendation is for a hierarchical regression
analyses to be performed to understand if grit or student engagement predicts academic
performance and to what extent. I recommend this because, although this study showed
no statistically significant relationships, one construct may better predict academic
performance than the other. Understanding the predictive outcomes of the constructs
could lead to better understanding of how to improve academic performance at HBCUs,
which served underserved and underrepresented groups. It is important to understand the
causal relationship between these variables. Research needs to be conducted to
understand whether grit or student engagement causes a level of academic performance.

68
In conclusion, I sought to understand the relationship between grit, student
engagement, and academic performance. To do this, I used the reliable and valid
instruments Grit-S and SEI-C as well as self-reported FYGPA. The Pearson product
moment correlation was used to test the linear relationship between the dependent and
independent variables. It was found that there was no relationship between grit and
academic performance and student engagement and academic performance for 2-year,
HBCU students. Although there were no significant results, there is still use for grit and
student engagement in relationship to combinations of other constructs that attribute to
student academic performance (Chang, 2014; Pineda-Báez et al., 2014). The issue of
academic performance must be better understood in order to better gauge the low
graduation rates among higher education institutions.
Graduation from college is an important milestone in today’s world in terms of
quality of life. College administrators must be dedicated to understanding what factors
are influencing academic performance in order to ensure that more students are able to
graduate, especially in underserved and understudied populations. Without understanding
these factors, it is likely that graduation rates will not increase. It will take administrators
who are invested in making a difference in students’ lives to continue this work and
understand, outside of grit and student engagement, other constructs that may help more
underserved students navigate toward a better life while increasingly providing quality
education.

69
References
Al Ghanboosi, S. S., & Alqahtani, A. A. (2013). Student drop-out trends at Sultan
Qaboos University and Kuwait University: 2000-2011. College Student Journal,
47, 499-506. Retrieved from http://www.projectinnovation.biz/
college_student_journal
Al-Hattami, A. (2012). Differential predictive validity of high school GPA and college
entrance test scores for university students in Yemen (Doctoral dissertation).
Retrieved from http://d-scholarship.pitt.edu/11506/1/Abdu's__ETD_Dissertation
Allen, J., Robbins, S. B., & Sawyer, R. (2010). Can measuring psychosocial factors
promote college success? Applied Measurement in Education, 23(1), 1-22.
doi:10.1080/08957340903423503
American College Test. (2007). The role of nonacademic factors in college readiness and
success. Retrieved from http://forms.act.org/research/policymakers/pdf
/nonacademic_factors.pdf
An, B. P. (2013). The influence of dual enrollment on academic performance and college
readiness: Differences by socioeconomic status. Research in Higher Education,
54, 407-432. doi:10.1007/s11162-012-9278-z
Appleton, J. J., Christenson, S. L., & Furlong, M. J. (2008). Student engagement with
school: Critical conceptual and methodological issues of the construct.
Psychology in the Schools, 45, 369-386. doi:10.1002/pits.20303

70
Appleton, J. J., Christenson, S. L., Kim, D., & Reschly, A. L. (2006). Measuring
cognitive and psychological engagement: Validation of the student engagement
Instrument. Journal of School Psychology, 44, 427-445. doi:10.1016/j.jsp.2006.04
.002
Arnold, K. D., Lu, E. C., & Armstrong, K. J. (2012a). The case for a comprehensive
model of college readiness. Association for the Study of Higher Education Report,
38(5), 1-10. Retrieved from http://www.ashe.ws/
Arnold, K. D., Lu, E. C., & Armstrong, K. J. (2012b). The ecological view of college
readiness. Association for the Study of Higher Education Report, 38(5), 91-107.
Retrieved from http://www.ashe.ws/
Astin, A. W. (1993). What matters in college: Four critical years revisited. San
Francisco, CA: Jossey-Bass.
Astin, A. W. (1999). Student involvement: A developmental theory for higher education.
Journal of College Student Development, 40, 518-529. Retrieved from
https://muse.jhu.edu/journal/238
Bakoban, R. A., & Aljarallah, S. A. (2015). Extracurricular activities and their effect on
the student's grade point average: Statistical study. Educational Research and
Reviews, 10, 2737-2744. Retrieved from ERIC Database. (EJ1080292)
Bédard, D., Lison, C., Dalle, D., Côté, D., & Boutin, N. (2012). Problem-based and
project-based learning in engineering and medicine: Determinants of students’

71
engagement and persistence. Interdisciplinary Journal of Problem-Based
Learning, 6(2), 7-30. doi:10.7771/1541-5015.1355
Borghans, L., Duckworth, A. L., Heckman, J. J., & Weel, B. (2008). The economics and
psychology of personality traits. Journal of Human Resources, 43, 972-1059.
doi:10.3386/w13810
Bowles, S., & Gintis, H. (1976). Schooling in capitalist America: Educational reform and
the contradictions of economic life. New York, NY: Basic Books.
Braxton, J. M., Hirschy, A. S., & McClendon, S. A. (2004). Understanding and reducing
college student departure. San Francisco, CA: Jossey-Bass.
Brooks, M., Jones, C., & Burt, I. (2013). Are African-American male undergraduate
retention programs successful? An evaluation of an undergraduate African-
American male retention program. Journal of African American Studies, 17, 206-
221. doi:10.1007/s12111-012-9233-2
Brown, J. L. (2012). Developing a freshman orientation survey to improve student
retention within a college. College Student Journal, 46, 834-851. Retrieved from
http://www.projectinnovation.biz/college_student_journal
Cabrera, A. F., Nora, A., Terenzini, P. T., Pascarella, E., & Hagedorn, L. S. (1999).
Campus racial climate and the adjustment of students to college: A comparison
between White students and African-American students. Journal of Higher
Education, 70, 134-160. doi:10.2307/2649125

72
California Postsecondary Education Commission. (2011). Student success in higher
education is everybody’s business. Retrieved from http://www.cpec.ca.gov
/completereports/2011reports/11-08.pdf
Castro, E. L. (2013). Racialized readiness for college and career: Toward an equity-
grounded social science of intervention programming. Community College
Review, 41, 292-310. doi:10.1177/0091552113504291
Cavendish, W. (2013). Student perceptions of school efforts to facilitate student
involvement, school commitment, self-determination, and high school graduation.
Social Psychology of Education, 16, 257-275. doi:10.1007/s11218-013-9212-z
Chang, W. (2014). Grit and academic performance: Is being grittier better? (Doctoral
dissertation). Retrieved from http://scholarlyrepository.miami.edu/
oa_dissertations/1306/
Chien, N., Harbin, V., Goldhagen, S., Lippman, L., & Walker, K. E. (2012). Encouraging
the development of key life skills in elementary school-age children: A literature
review and recommendations to the Tauck Family Foundation. Retrieved from
http://www.childtrends.org/wp-content/uploads/2012/09/Child_Trends-
2012_11_01_WP_KeyLifeSkills.pdf
Claxton, G. (2007). Expanding young people’s capacity to learn. British Journal of
Educational Studies, 55(2), 1-20. doi:10.1111/j.1467-8527.2007.00369.x
Coates, H. (2005). The value of student engagement for higher education quality
assurance. Quality in Higher Education, 11(1), 25-36.
doi:10.1080/13538320500074915

73
Cohen, J. (1988). Statistical power analysis for the behavioral sciences (2nd ed.).
Hillsdale, NJ: Lawrence Erlbaum.
Community College Survey on Student Engagement. (n.d.) About the Community
College Survey of Student Engagement (CCSSE). Retrieved from
http://www.ccsse.org/aboutccsse/aboutccsse.cfm
Conley, D. T. (2010). College and career ready: Helping all students succeed beyond
high school. San Francisco, CA: Jossey‐Bass.
Cressy, J. (2011). The roles of physical activity and health in enhancing student
engagement: Implications for leadership in post-secondary education. Retrieved
from ERIC Database. (EJ 967640)
Creswell, J. W. (2012). Education research: Planning, conducting, and evaluating
quantitative and qualitative research. Boston, MA: Pearson Learning Solutions.
Cromwell, A., McClarty, K. L., & Larson, S. J. (2013). College readiness indicators.
Pearson Assessments, 2013(25), 1-8. Retrieved from
http://images.pearsonassessments.com/images/tmrs/TMRS-
RIN_Bulletin_25CRIndicators_051413.pdf.
Cross, T. M. (2014). The gritty: Grit and non-traditional doctoral student success. Journal
of Educators Online, 11(3), 1-30. Retrieved from https://www.thejeo.com/
Daley, F. (2010). Why college students drop out and what we do about it. College
Quarterly, 13(3), 1-5. Retrieved from ERIC Database. (EJ930391)

74
Deater-Deckard, K., Chang, M., & Evans, M. E. (2013). Engagement states and learning
from educational games. New Directions for Child & Adolescent Development,
139, 21-30. doi:10.1002/cad.20028
Dickerson, R. C. (2004). Collision course: Rising college costs threaten America's future
and require shared solutions. Retrieved from ERIC Database. (ED497036)
Duckworth, A. L., Peterson, C., Matthews, M. D., & Kelly, D. R. (2007). Grit:
Perseverance and passion for long-term goals. Journal of Personality and Social
Psychology, 92, 1087-1101. doi:10.1037/0022-3514.92.6.1087
Duckworth, A., & Quinn, P. (2009). Development and validation of the Short Grit Scale
(GRIT-S). Journal of Personality Assessment, 91, 166-174.
doi:10.1080/00223890802634290
Farrington, C. A., Roderick, M., Allensworth, E., Nagaoka, J., Keyes, T., Johnson, D., &
Beechum, N. (2012). Teaching adolescents to become learners the role of non-
cognitive factors in shaping school performance: A critical literature review.
Retrieved from https://consortium.uchicago.edu/sites/default/files/publications
/Noncognitive%20Report.pdf
Faul, F., Erdfelder, E., Buchner, A., & Lang, A. (2009). Statistical power analyses using
G*power 3.1: Tests for correlation and regression analyses. Behavior Research
Methods, 41, 1149-60. doi:10.3758/brm.41.4.1149
Gayles, J. (2012). Race, late bloomers and first-year GPA: Predicting beyond the
freshman year. Educational Research Quarterly, 36(1), 13-29. Retrieved from
http://erquarterly.org/

75
Gilbert, J. (2007). Catching the knowledge wave: Redefining knowledge for the post-
industrial age. Education Canada, 47(3), 4-8. Retrieved from http://www.cea-
ace.ca/education-canada
Goncalves, S. A., & Trunk, D. (2014). Obstacles to success for the nontraditional student
in higher education. Psi Chi Journal of Psychological Research, 19, 164-172.
Retrieved from https://www.psichi.org/?page=journal_main#.WExgXYWcHIU
Goodwin, B., & Miller, K. (2013a). Grit plus talent = student success. Educational
Leadership, 71(1), 74-76. Retrieved from http://www.ascd.org/publications/
educational-leadership.aspx
Goodwin, B., & Miller, K. (2013b). Teaching self-regulation has long-term benefits.
Educational Leadership, 70(8), 80-81. Retrieved from http://www.ascd.org/
publications/educational-leadership.aspx
Graham, C. R., Tripp, T. R., Seawright, L., & Joeckel, G. L. (2007) Empowering or
compelling reluctant participators using audience response systems. Active
Learning in Higher Education, 8, 233-258. Retrieved from http://alh.sagepub.com
Greene, T. G., Marti, C. N., & McClenney, K. (2008). The effort-outcome gap:
Differences for African American and Hispanic community college students in
student engagement and academic achievement. Journal of Higher Education, 79,
513-539. doi:10.1353/jhe.0.0018
Grier-Reed, T., Appleton, J., Rodriguez, M., Ganuza, Z., & Reschly, A. L. (2012).
Exploring the student engagement instrument and career perceptions with college

76
students. Journal of Educational and Developmental Psychology, 2, 85-96.
doi:10.5539/jedp.v2n2p85
Gutman, L., & Schoon, I. (2013). The impact of non-cognitive skills on outcomes for
young people. Retrieved from https://v1.educationendowmentfoundation.org.uk/
uploads/pdf/Non-cognitive_skills_literature_review.pdf
Hallett, R. E. (2013). Undocumented student success: Navigating constraints related to
retention. Journal of Latino-Latin American Studies, 5, 99-112.
doi:10.18085/llas.5.2.0x00871w50627m17
Harpe, S. E. (2015). How to analyze Likert and other rate scale data. Currents in
Pharmacy Teaching & Learning, 7(2015), 836-850.
doi:10.1016/j.cptl.2015.08.001
Hart, S. J., Stewart, K., & Jimerson, S. R. (2011). The Student Engagement in Schools
Questionnaire (SESQ) and the Teacher Engagement Report form-new (TERF-N):
examining the preliminary evidence. Contemporary School Psychology
(California Association of School Psychologists), 15(1), 67-79.
doi:10.1037/t42908-000
Hillman, N., & Orians, E. (2013). Community colleges and labor market conditions: How
does enrollment demand change relative to local unemployment rates? Research
in Higher Education, 54, 765-780. doi:10.1007/s11162-013-9294-7
Hoerr, T. R. (2012). Got grit? Educational Leadership, 69(6), 84-85. Retrieved from
http://www.ascd.org/publications/educational-leadership.aspx

77
Hoerr, T. R. (2013). Good failures. Educational Leadership, 71(1), 84-85. Retrieved from
http://www.ascd.org/publications/educational-leadership.aspx
Hu, S. (2011). Reconsidering the relationship between student engagement and
persistence in college. Innovative Higher Education, 36, 97-106.
doi:10.1007/s10755-010-9158-4
Hu, S., & McCormick, A. (2012). An engagement-based student typology and its
relationship to college outcomes. Research in Higher Education, 53, 738-754.
doi:10.1007/s11162-012-9254-7
Hummell, L. (2015). Humor. Children's Technology & Engineering, 19(4), 5-6.
Retrieved from https://www.iteea.org/Publications.aspx
Ishitani, T. T., & DesJardins, S. L. (2002). A longitudinal investigation of dropout from
college in the United States. Journal of College Student Retention: Research,
Theory and Practice, 4, 173-201. doi:10.2190/v4en-nw42-742q-2ntl
Komarraju, M., Karau, S., Schmeck, R., & Avdic, A. (2011). The big five personality
traits, learning styles, and academic achievement. Personality and Individual
Differences, 51(2011), 472-477. doi:10.1016/j.paid.2011.04.019
Komarraju, M., Ramsey, A., & Rinella, V. (2013). Cognitive and non-cognitive
predictors of college readiness and performance: Role of academic discipline.
Learning and Individual Differences, 24(12), 103-109.
doi:10.1016/j.lindif.2012.12.007
Kruzicevic, S. M., Barisic, K. J., Banozic, A., Esteban, C. D., Sapunar, D., & Puljak, L.
(2012). Predictors of attrition and academic success of medical students: A 30-

78
year retrospective study. Public Library of Science ONE, 7(6), 1-4.
doi:10.1371/journal.pone.0039144
Kuh, G. D. (2001). The National Survey of Student Engagement: Conceptual framework
and overview of psychometric properties. Bloomington, IN: Indiana University,
Center for Postsecondary Research.
Kuh, G. D., Kinzie, J., Buckley, J., Bridges, B., & Hayek, J. C. (2006). What matters
most to student success: A review of the literature. Retrieved from
http://nces.ed.gov/npec/pdf/kuh_team_report.pdf
Kuh, G. D., Kinzie, J., Buckley, J., Bridges, B., & Hayek, J. C. (2007). Piecing together
the student success puzzle: Research, propositions, and recommendations. ASHE
Higher Education Report, 32(5), 1-182. Retrieved from ERIC Database.
(EJ791634)
Lavrakas, P. (2008). Encyclopedia of survey research statistics. Thousand Oaks, CA:
Sage.
Law, B. (2014). 5 Strategies to improve student retention and success. Community
College Journal, 84(6), 10-12. Retrieved from http://www.aacc.nche.edu/
Publications/CCJ/Pages/default.aspx
Levy, J. M., & Steele, H. (2011). Attachment and grit: Exploring possible contributions
of attachment styles (from past and present life) to the adult personality construct
of grit. Journal of Social & Psychological Sciences, 4(2), 16-49. Retrieved from
http://oxford-mosaic.co.uk/jspsjournal/category/journal-of-soc-psy-sciences/

79
Lillis, M. (2011). Faculty emotional intelligence and student-faculty interactions:
Implications for student retention. Journal of College Student Retention:
Research, Theory & Practice, 13, 155-178. doi:10.2190/cs.13.2.b
Markle, R. E., & Robbins, S. B. (2013). The success navigator assessment: A holistic
approach to predicting academic and retention success. Retrieved from
https://www.ets.org/s/successnavigator/pdf/holistic_assessment_approach_predict
ing_academic_retention_success.pdf
Martin, K., Gallentino, R., & Townsend, L. (2014). Community college student success:
The role of motivation and self-empowerment. Community College Review, 42,
221-228. doi:10.1177/0091552114528972
McCormick, A., & McClenney, K. (2012). Will these trees ever bear fruit? A response to
the special issue on student engagement. The Review of Higher Education, 35,
307-333. doi:10.1353/rhe.2012.0010
Mellor, D. T., Brooks, W. R., Gray, S. A., & Jordan, R. C. (2015). Troubled transitions
into college and the effects of a small intervention course. Journal of College
Student Retention: Research, Theory & Practice, 17(1), 44-63.
doi:10.1177/1521025115571102
Merritt, R. D. (2016). Grade point averages. Research Starters Education, 1-9. Retrieved
from https://www.ebscohost.com/academic/research-starters-education
Nagaoka, J., Farrington, C. A., Roderick, M., Allensworth, E., Keyes, T. S., Johnson, D.
W., & Beechum, N. O. (2013). Readiness for college: The role of non-cognitive

80
factors and context. Voices in Urban Education, 38, 45-52. Retrieved from ERIC
Database. (EJ 1046369)
National Center for Education Statistics. (2010). Graduation and retention rates.
Retrieved from
http://nces.ed.gov/ipeds/DataCenter/DfrFiles/IPEDSDFR2010_101569.pdf
National Center for Education Statistics. (2011). Graduation and retention rates.
Retrieved from
http://nces.ed.gov/ipeds/DataCenter/DfrFiles/IPEDSDFR2011_101569.pdf
National Center for Education Statistics. (2012). Graduation and retention rates.
Retrieved from
http://nces.ed.gov/ipeds/DataCenter/DfrFiles/IPEDSDFR2012_101569.pdf
National Center for Education Statistics. (2013). Graduation and retention rates.
Retrieved from
http://nces.ed.gov/ipeds/DataCenter/DfrFiles/IPEDSDFR2013_101569.pdf
National Center for Education Statistics. (2014a). Two-year graduation rates. Retrieved
from https://nces.ed.gov/programs/digest/d13/tables/dt13_326.20.asp
National Center for Education Statistics. (2014b). IPEDS: Data center help desk.
Retrieved from
http://nces.ed.gov/ipeds/DataCenter/DfrFiles/IPEDSDFR2014_101569.pdf
National Survey of Student Engagement. (2016). About NSSE. Retrieved from
http://nsse.indiana.edu/html/about.cfm

81
Nelson, K., Quinn, C., Marrington, A., & Clarke, J. (2012). Good practice for enhancing
the engagement and success of commencing students. Higher Education, 63(1),
83-96. doi:10.1007/s10734-011-9426-y
Pascarella, E. T., & Terenzini, P. T. (2005). How college affects students: Vol 2. A third
decade of research. San Francisco, CA: Jossey-Bass.
Perkins-Gough, D., & Duckworth, A. L. (2013). The significance of grit. Educational
Leadership, 71(1), 14-20. Retrieved from http://www.ascd.org/publications/
educational-leadership.aspx
Perrotta, K. A., & Bohan, C. H. (2013). I hate history: A study of student engagement in
community college undergraduate history courses. Journal on Excellence in
College Teaching, 24(4), 49-75. Retrieved from ERIC Database. (EJ1026157)
Pineda-Báez, C., Bermúdez-Aponte, J., Rubiano-Bello, A., Pava-García, N., Suárez-
García, R., & Cruz-Becerra, F. (2014). Student engagement and academic
performance in the Colombian University context. Relieve, 20(2), 1-20.
doi:10.7203/relieve.20.2.4238
Prevatt, F., Huijun, L., Welles, T., Festa-Dreher, D., Yelland, S., & Jiyoon, L. (2011).
The academic success inventory for college students: Scale development and
practical implications for use with students. Journal of College Admission, 211,
26-31. Retrieved from https://www.researchgate.net/publication/302833094
_The_Journal_of_College_Admission

82
Przymus, E. (2011). Do minority students ever become connected to community college?
Enrollment Management Journal, 5(4), 118-144. Retrieved from
https://www.tgslc.org/pdf/emj-w11.pdf#page=119
Rath, B., Rock, K., & Laferriere, A. (2013). Pathways through college: Strategies for
improving community college success. OPP, 4(2013), 1-33. Retrieved from
http://www.opp.org/docs/PathwaysCollegeStrategies_StudentSuccess.pdf
Ray, R., & Brown, J. (2015). Reassessing student potential for medical school success:
Distance traveled, grit, and hardiness. Military Medicine, 180, 138-141.
doi:10.7205/milmed-d-14-00578
Rojas, J. P., Reser, J. A., Usher, E. L., & Toland, M. D. (2012). Psychometric properties
of the academic grit scale. Lexington, KY: University of Kentucky.
Schweinle, A., & Helming, L. M. (2011). Success and motivation among college
students. Social Psychology of Education: An International Journal, 14, 529-546.
Retrieved from ERIC Database. (EJ949581)
Siegel, M. J. (2011). Reimagining the retention problem: Moving our thinking from end-
product to by-product. About Campus, 15(6), 8-18. doi:10.1002/abc.20043
Simmons, L. D. (2013). Factors of persistence for African American men in a student
support organization. Journal of Negro Education, 82(1), 62-74.
doi:10.7709/jnegroeducation.82.1.0062
Sommerfeld, A. (2011). Recasting non-cognitive factors in college readiness as what they
truly are: Non-academic factors. Journal of College Admission, 213, 18-22.
Retrieved from ERIC Database. (EJ962511)
83
Sparkman, L. A., Maulding, W. S., & Roberts, J. G. (2012). Non-cognitive predictors of
student success in college. College Student Journal, 46, 642-652. Retrieved from
http://www.projectinnovation.biz/college_student_journal
Steele-Johnson, D., & Leas, K. (2013). Importance of race, gender, and personality in
predicting academic performance. Journal of Applied Social Psychology, 43,
1736-1744. doi:10.1111/jasp.12129
Stevenson, T. (2013). Online student persistence: What matters is outside the classroom.
Journal of Applied Learning Technology, 3(1), 21-25. Retrieved from
http://salt.org/salt.asp?ss=x&pn=jalt
Strayhorn, T. L. (2013). Measuring race and gender differences in undergraduate
students’ perceptions of campus climate and intentions to leave college: An
analysis in black and white. Journal of Student Affairs Research and Practice, 50,
115-132. doi:10.1515/jsarp-2013-0010
Strayhorn, T. L. (2014). What role does grit play in the academic success of Black male
collegians at predominantly White institutions? Journal of African American
Studies, 18(1), 1-10. doi:10.1007/s12111-012-9243-0
Talbert, P. Y. (2012). Strategies to increase enrollment, retention, and graduation rates.
Journal of Developmental Education, 36(1), 22-36. Retrieved from
https://ncde.appstate.edu/publications/journal-developmental-education-jde
Tanaka, G. (2002). Higher education’s self-reflexive turn: Toward an intercultural theory
of student development. Journal of Higher Education, 73, 263-296.
doi:10.1353/jhe.2002.0024

84
Taylor, L., & Parsons, J. (2011). Improving student engagement. Current Issues in
Education, 14(1), 1-33. Retrieved from http://cie.asu.edu/ojs/index.php/
cieatasu/article/viewFile/745/162
Tinto, V. (1973). Dropouts from higher education: A theoretical synthesis of the recent
literature. A Review of Educational Research, 45, 89-115.
doi:10.3102/00346543045001089
Tinto, V. (1975). Dropouts from higher education: A theoretical synthesis of recent
literature. Review of Educational Research, 45, 89-125. Retrieved from
http://rer.sagepub.com/
Tinto, V. (1982). Limits of theory and practice in student attrition. The Journal of Higher
Education, 53, 687-700. doi:10.2307/1981525
Tinto, V. (1987). Leaving college: Rethinking the causes and cures of student attrition.
Chicago, IL: University of Chicago Press.
Tinto, V. (1993). Dropout from higher education: A theoretical synthesis of recent
research. Review of Educational Research, 45(1), 89-125. Retrieved from ERIC
Database. (EJ120200)
Tinto, V. (2012). Enhancing student success: Taking the classroom success seriously. The
International Journal of the First Year in Higher Education, 3(1). 1-8.
doi:10.5204/intjfyhe.v2i1.119
United States Department of Education. (2013). Promoting grit, tenacity, and
perseverance: critical factors for success in the 21st century. Retrieved from
http://pgbovine.net/OET-Draft-Grit-Report-2-17-13.pdf

85
Von Culin, K., Tsukayama, E., & Duckworth, A. (2014). Unpacking grit: Motivational
correlates of perseverance and passion for long-term goals. The Journal of
Positive Psychology, 9, 306-312. doi:10.1080/17439760.2014.898320
Watson, J. C. (2013). Addressing student attrition: The role of college counselors.
Journal of College Counseling, 16, 195-197. doi:10.1002/j.2161-
1882.2013.00036.x
Weiss, C. C., & García, E. (2015). Student engagement and academic performance in
Mexico: Evidence and puzzles from PISA. Comparative Education Review, 59,
305-331. Retrieved from http://www.journals.uchicago.edu/toc/cer/current
The White House. (n.d.). Building American skills through community colleges.
Retrieved from https://www.whitehouse.gov/sites/default/files/100326-
community-college-fact-sheet.pdf
Wyner, J. (2012). What is community college excellence? Lessons from the Aspen Prize.
Change: The Magazine of Higher Learning, 44(3), 14-20.
doi:10.1080/00091383.2012.672916


