Download - GREENTECH TECHNOLOGY INTERNATIONAL LIMITED
1
Hong Kong Exchanges and Clearing Limited and The Stock Exchange of Hong Kong Limited
take no responsibility for the contents of this announcement, make no representation as to
its accuracy or completeness and expressly disclaim any liability whatsoever for any loss
howsoever arising from or in reliance upon the whole or any part of the contents of this
announcement.
GREENTECH TECHNOLOGY INTERNATIONAL LIMITED綠科科技國際有限公司
(Incorporated in the Cayman Islands with limited liability)
(Stock Code: 00195)
MINERAL RESOURCE ESTIMATION UPDATE
This announcement is made by Greentech Technology International Limited (“Company”,
together with its subsidiaries, the “Group”) pursuant to Rule 13.09 of the Rules Governing
the Listing of Securities on The Stock Exchange of Hong Kong Limited (“Listing Rules”) and
the Inside Information Provisions (as defined under the Listing Rules) of Part XIVA of the
Securities and Futures Ordinance (Chapter 571 of the Laws of Hong Kong).
The board of directors of the Company is pleased to report the updated mineral resource
estimation for the Renison Tin Project as at 31 March 2021. The Renison Tin Project is
located in Tasmania, Australia and is based on Bluestone Mines Tasmania Joint Venture Pty
Limited (“BMTJV”)’s assets which consist of (1) the Renison Bell mine, concentrator and
infrastructure (“Renison Bell”), (2) the Mount Bischoff opencut tin project (“Mt Bischoff”)
and (3) the Renison tailings retreatment project (“Rentails Project” or “Rentails”). YT
Parksong Australia Holding Pty Limited (“YTPAH”), an 82% owned subsidiary of the
Company, has a 50% interest in the Renison Tin Project.

2
The updated mineral resource estimation for the Renison Tin Project at 31 March 2021 was
reported in accordance with the Australasian Code for Reporting Exploration Results, Mineral
Resources and Ore Reserves, published by the Joint Ore Reserves Committee (“JORC”), of
the Australasian Institute of Mining and Metallurgy, the Australian Institute of Geoscientists
and the Minerals Council of Australia, December 2012 (“JORC Code”).
HIGHLIGHTS (100% basis)
– New mineral resource estimations completed for Renison using data to 31 March 2021.
– The continuing commitment to mineral resource development drilling has once again
delivered strong results with defined tin in measured and indicated resources increased
by 1,500 Sn tonnes (1%) and average tin grades increased by 2% (0.04% Sn) when
compared to 31 March 2020 (after mining depletion).
– Total Renison measured, indicated and inferred resource of 18.2 Mt at 1.65% Sn for
301,500 tonnes of contained tin.
– 7,000 Sn tonnes (3%) increase in measured and indicated resources from 255kt of
contained tin to 262kt of contained tin.
– Resource definition and grade control drilling continues with two underground and one
surface rig currently in operation.
– The on-going exploration program aims to increase the mineral resource, net of
depletion, each year with a range of exploration targets identified.
The Renison Life-of-Mine Plan update incorporating a further update of the mineral resource
and an update of the ore reserve will be completed in the fourth quarter of 2021.
3
MINERAL RESOURCE STATEMENT
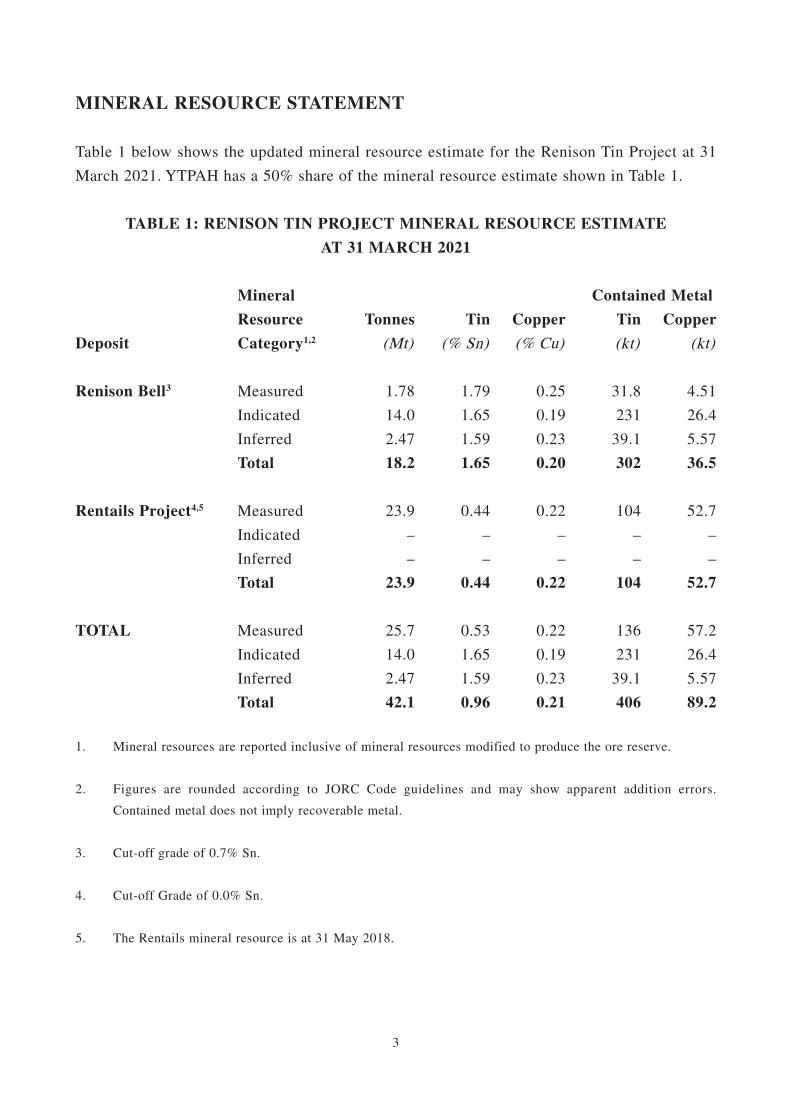
Table 1 below shows the updated mineral resource estimate for the Renison Tin Project at 31
March 2021. YTPAH has a 50% share of the mineral resource estimate shown in Table 1.
TABLE 1: RENISON TIN PROJECT MINERAL RESOURCE ESTIMATE
AT 31 MARCH 2021
Deposit
Mineral
Resource
Category1,2
Contained Metal
Tonnes Tin Copper Tin Copper
(Mt) (% Sn) (% Cu) (kt) (kt)
Renison Bell3 Measured 1.78 1.79 0.25 31.8 4.51
Indicated 14.0 1.65 0.19 231 26.4
Inferred 2.47 1.59 0.23 39.1 5.57
Total 18.2 1.65 0.20 302 36.5
Rentails Project4,5 Measured 23.9 0.44 0.22 104 52.7
Indicated – – – – –
Inferred – – – – –
Total 23.9 0.44 0.22 104 52.7
TOTAL Measured 25.7 0.53 0.22 136 57.2
Indicated 14.0 1.65 0.19 231 26.4
Inferred 2.47 1.59 0.23 39.1 5.57
Total 42.1 0.96 0.21 406 89.2
1. Mineral resources are reported inclusive of mineral resources modified to produce the ore reserve.
2. Figures are rounded according to JORC Code guidelines and may show apparent addition errors.
Contained metal does not imply recoverable metal.
3. Cut-off grade of 0.7% Sn.
4. Cut-off Grade of 0.0% Sn.
5. The Rentails mineral resource is at 31 May 2018.
4
KEY ASSUMPTIONS AND JORC CODE REQUIREMENTS
Mineral resources are reported inclusive of ore reserves. Mining production data up to
31 March 2021 and all exploration information has been included. Mineral resources have
been depleted for mining to 31 March 2021.
The tin price assumption used to estimate mineral resources was US$15,275 to $17,250/t
Sn at an assumed exchange rate of USD/AUD 0.65 to 0.69 giving a price of AUD$23,500 to
$25,000/t Sn.
The mineral resources have been classified in accordance with the guidelines set out in the
JORC Code.
The full mineral resource estimate for the Renison Tin Project is tabulated in Table 1.
Material Information for the individual deposits, including a summary of material information
and the Assessment and Reporting Criteria in accordance with JORC Code requirements, is
included in this announcement (including the Appendix A to this announcement).
MINERAL RESOURCE ESTIMATES
Summary of material information
A summary of material information contained in Appendix A is provided below:
Geology and geological interpretation: Renison is one of the world’s largest operating
underground tin mines and Australia’s largest primary tin producer. Renison is the largest
of three major skarn, carbonate replacement, pyrrhotite-cassiterite deposits within western
Tasmania. The Renison Mine area is situated in the Dundas Trough, a province underlain
by a thick sequence of Neoproterozoic-Cambrian siliciclastic and volcaniclastic rocks. At
Renison there are three main shallow-dipping dolomite horizons which host replacement
mineralisation. The major structure associated with tin mineralisation at Renison, the Federal
Basset Fault, was formed during the forceful emplacement of the Pine Hill Granite during the
Devonian and is also an important source of tin mineralisation.
5
Drilling techniques, sampling and sub-sampling techniques: The bulk of the data used in
resource calculations at Renison has been gathered from diamond core using NQ2, LTK60
and LTK48 sizes. This core is geologically logged and subsequently halved for sampling.
Drill hole samples are typically whole core sampled to streamline the core handling process
if required. Each development face/round is horizontally chip sampled with the sampling
intervals being domained by geological constraints. Sludge drilling is performed with an
underground production or development drill rigs (nominal 64mm-89mm diameter hole). It is
an open hole drilling method using water as the flushing medium.
Criteria for classification: Resources are classified in line with JORC guidelines utilising a
combination of various estimation derived parameters, the input data and geological/mining
knowledge. This approach considers all relevant factors and reflects the Competent Person’s
view of the deposit. At Renison, material classified as measured must have development
(with face samples) within 20m. Indicated mineral resource must have sufficient grade and
geological continuity with drill hole intersections generally between 40m and 20m apart.
Inferred mineral resource is material that is defined by drill hole intersections between 120m
and 40m apart. Geological continuity may be present, but the grade estimate is lower in
confidence.
Sample analysis method: Samples are dried at 90°C, then crushed to <3mm, samples are
then riffle split to obtain a sub sample of approximately 100g which is then pulverized to
90% passing 75 um. A 2g subsample of the pulp sample is then weighed with 12g of reagents
including a binding agent, the weighed sample is then pulverized again for one minute. The
sample is then compressed into a pressed powder tablet for introduction to the XRF. Sn, As
and Cu have a detection limit 0.01%, Fe and S detection limits are 0.1%. Each XRF batch of
twenty consists of one blank, one internal standard, one duplicate and a replicate. Anomalous
assay results are re-assayed to ensure quality control.
Estimation methodology: All modelling and estimation work undertaken by BMTJV is
carried out via LeapfrogTM and Surpac VisionTM software by creating three-dimensional
ore body wireframes using sectional techniques. Drill hole intersections within the three-
dimensional wireframes are composited and statistical analysis is conducted to determine
appropriate search parameters within individual domains. An empty block model is created,
and grade estimation is undertaken using ordinary Kriging estimation methods. The resource
is then depleted using mining voids and subsequently classified in line with JORC guidelines
as above.
6
Cut-off grades: The mineral resource reporting cut-off grade is 0.7% Sn at Renison Bell.
Mining and metallurgical methods and parameters: The Renison mine predominantly
applies up-hole benching and open stoping mining methods with (in some cases), post fill
and cemented rock fill to fill voids. A slurry type of fill is assumed to be used to backfill
a portion of the stope voids of the high-grade wide ore zone in Area 5. A mining dilution
of 5% to 15% at zero grade is used to estimate the Ore Reserve. Minimum widths for
underground development are 4.5m and for stoping minimum widths are 2.0m. Historical
Mining recoveries of 75 to 98% are applied to estimate the Ore Reserve. No inferred mineral
resources are included within the Ore Reserve.
The Renison mine produces a tin concentrate of grade varying between 50-60% Sn with
internal process designed to reduce penalty metals such as iron, sulphur, tungsten and copper.
The metallurgical process is complex and applies several stages of gravity-type concentration
as well as sulphide and oxide flotation, regrinding and acid leach methods. The metallurgical
recovery is estimated from plant feed grades and is based on historical plant performance with
modifying factors for different ore sources. Metallurgical recoveries on the various ore types
and grades were considered as part of the cut-off grade analysis.
Comparison of mineral resources
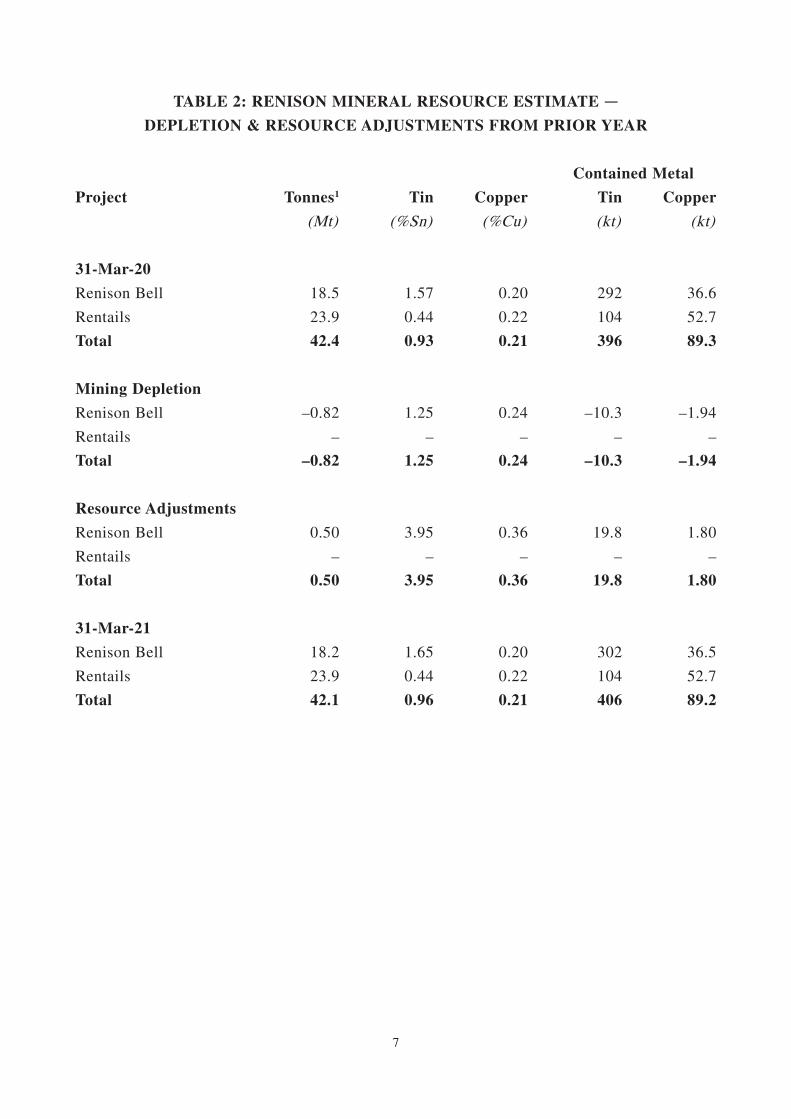
Tables 2 and 3 compare the 31 March 2020 mineral resource estimate with the updated
mineral resource estimate as at 31 March 2021 for the Renison Tin Project. YTPAH has a
50% share of the mineral resource estimate shown below. It was reported that the difference
between the mineral resource estimate for Renison Bell at 31 March 2020 and 31 March 2021
include the following modifications:
• All diamond drilling, development face sample and sludge drill hole data obtained
between 1 April 2020 and 31 March 2021 has been included in the model.
• Updates to all wireframe models based on this data.
• A total of 352kt at 0.9% (3.2kt of Sn metal) was deemed to be an unrealistic mining
proposition based on an assessment of thickness and grade criteria and has subsequently
been removed from the reported resource.
• The Rentails mineral resource was determined using the Rentails resource model
(rtl180531) with tailings data reported to 31 May 2018.
7
TABLE 2: RENISON MINERAL RESOURCE ESTIMATE —DEPLETION & RESOURCE ADJUSTMENTS FROM PRIOR YEAR
Contained Metal
Project Tonnes1 Tin Copper Tin Copper
(Mt) (%Sn) (%Cu) (kt) (kt)
31-Mar-20
Renison Bell 18.5 1.57 0.20 292 36.6
Rentails 23.9 0.44 0.22 104 52.7
Total 42.4 0.93 0.21 396 89.3
Mining Depletion
Renison Bell –0.82 1.25 0.24 –10.3 –1.94
Rentails – – – – –
Total –0.82 1.25 0.24 –10.3 –1.94
Resource Adjustments
Renison Bell 0.50 3.95 0.36 19.8 1.80
Rentails – – – – –
Total 0.50 3.95 0.36 19.8 1.80
31-Mar-21
Renison Bell 18.2 1.65 0.20 302 36.5
Rentails 23.9 0.44 0.22 104 52.7
Total 42.1 0.96 0.21 406 89.2
8
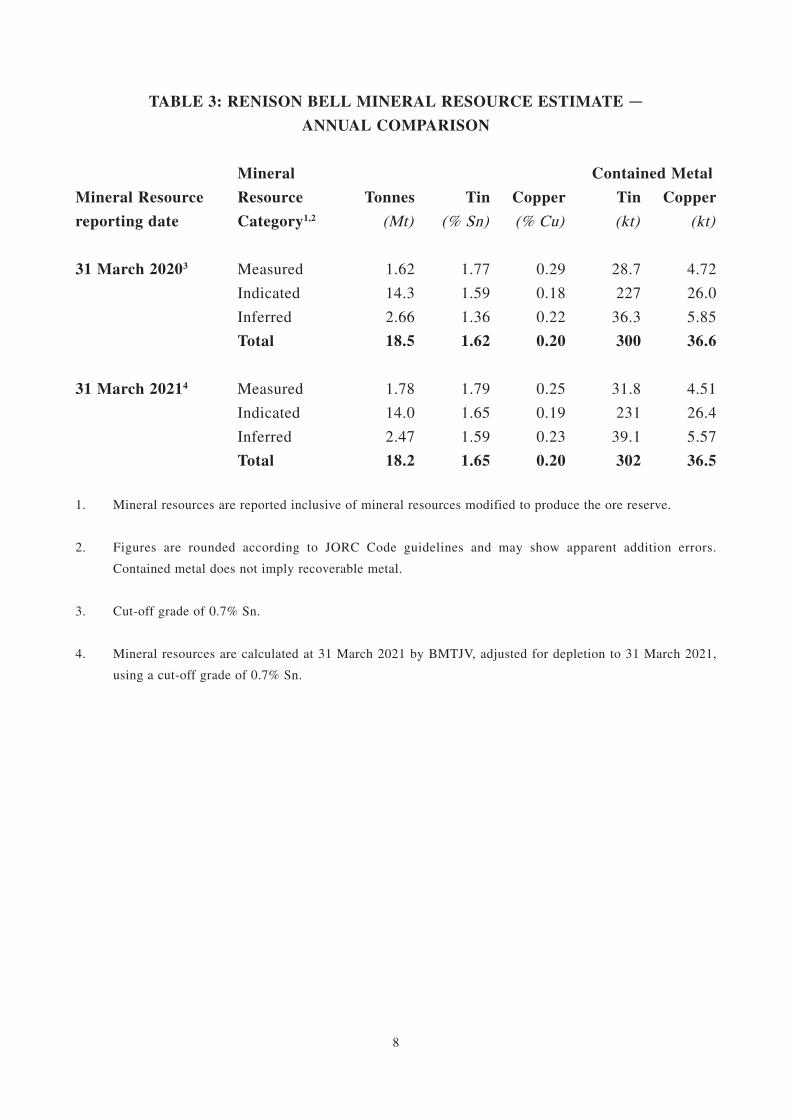
TABLE 3: RENISON BELL MINERAL RESOURCE ESTIMATE —ANNUAL COMPARISON
Mineral Resource
reporting date
Mineral
Resource
Category1,2
Contained Metal
Tonnes Tin Copper Tin Copper
(Mt) (% Sn) (% Cu) (kt) (kt)
31 March 20203 Measured 1.62 1.77 0.29 28.7 4.72
Indicated 14.3 1.59 0.18 227 26.0
Inferred 2.66 1.36 0.22 36.3 5.85
Total 18.5 1.62 0.20 300 36.6
31 March 20214 Measured 1.78 1.79 0.25 31.8 4.51
Indicated 14.0 1.65 0.19 231 26.4
Inferred 2.47 1.59 0.23 39.1 5.57
Total 18.2 1.65 0.20 302 36.5
1. Mineral resources are reported inclusive of mineral resources modified to produce the ore reserve.
2. Figures are rounded according to JORC Code guidelines and may show apparent addition errors.
Contained metal does not imply recoverable metal.
3. Cut-off grade of 0.7% Sn.
4. Mineral resources are calculated at 31 March 2021 by BMTJV, adjusted for depletion to 31 March 2021,
using a cut-off grade of 0.7% Sn.
9
COMPETENT PERSON’S STATEMENT
The information in this announcement that relates to mineral resources has been compiled
by the technical employees of BMTJV under the supervision of Mr. Colin Carter B.Sc.
(Hons), M.Sc. (Econ. Geol), AusIMM. Mr. Carter is a full-time employee of BMTJV and
has sufficient experience which is relevant to the style of mineralisation and types of deposit
under consideration and to the activities which he is undertaking to qualify as a Competent
Person as defined in the 2012 Edition of the “Australasian Code for Reporting of Exploration
Results, Mineral Resources and Ore Reserves”. Mr. Carter consents to the inclusion in this
announcement of the matters based on his information in the form and context in which it
appears.
By the order of the Board
Greentech Technology International Limited
Tan Sri Dato’ KOO Yuen Kim
P.S.M., D.P.T.J. J.P
Chairman
Hong Kong, 7 June 2021
As at the date of this announcement, the board of directors of the Company comprises five
executive directors, namely, Tan Sri Dato’ KOO Yuen Kim P.S.M., D.P.T.J. J.P (Dr. HSU Jing-
Sheng as his alternate), Ms. XIE Yue, Dr. HSU Jing-Sheng, Mr. WANG Chuanhu and Mr. SIM
Tze Jye; and three independent non-executive directors, namely, Datin Sri LIM Mooi Lang,
Mr. KIM Wooryang and Ms. PENG Wenting.
Website: http://www.green-technology.com.hk
10
Appendix A
JORC CODE, 2012 EDITIONTHE INFORMATION BELOW REFERS TO THE FOLLOWING PROJECTS AT THE RENISON TIN PROJECTS: RENISON BELL, RENTAILS AND MT BISCHOFF
SECTION 1: SAMPLING TECHNIQUES AND DATA(Criteria in this section apply to all succeeding sections.)
Criteria Commentary
Sampling techniques Diamond Drilling
• The bulk of the data used in resource calculations
at Renison has been gathered from diamond core.
Three sizes have been used historically NQ2 (45.1mm
nominal core diameter), LTK60 (45.2mm nominal core
diameter) and LTK48 (36.1mm nominal core diameter),
with NQ2 currently in use. This core is geologically
logged and subsequently halved for sampling. Grade
control holes may be whole core sampled to streamline
the core handling process if required.
• There is no diamond drilling for the Rentails Project.
Drilling techniques Face Sampling
• Each development face/round is horizontally chip
sampled at Renison. The sampling intervals are
domained by geological constraints (e.g., rock type,
veining and alteration/sulphidation etc.). Samples are
taken in a range from 0.3m up to 1.2m in waste. All
exposures within the orebody are sampled.
• There is no face sampling for the Rentails Project.

11
Drill sample recovery Sludge Drilling
• Sludge drilling at Renison is performed with an
underground production drill rig. It is an open hole
drilling method using water as the flushing medium,
with a 64-89mm hole diameter. Sample intervals are
ostensibly the length of the drill steel. Holes are drilled
at sufficient angles to allow flushing of the hole with
water following each interval to prevent contamination.
• There is no sludge drilling for the Rentails Project.
RC Drilling
• There is no RC drilling for the Renison Project.
• There is no RC drilling for the Rentails Project.
Percussion Drilling
• This drilling method was used for the Rentails project
and uses a rotary tubular drilling cutter which was
driven percussively into the tailings. The head of the
cutting tube consisted of a 50mm diameter hard tipped
cutting head inside which were fitted 4 spring steel
fingers which allowed the core sample to enter and
then prevented it from falling out as the drill tube was
withdrawn from the drill hole.
• There is no percussion drilling for the Renison Project.
12
• All geology input is logged and validated by the
relevant area geologists, incorporated into this is
assessment of sample recovery. No defined relationship
exists between sample recovery and grade. Nor has
sample bias due to preferential loss or gain of fine or
coarse material been noted.
Logging • D i a m o n d c o r e i s l o g g e d g e o l o g i c a l l y a n d
geotechnically.
• RC chips are logged geologically.
• Development faces are mapped geologically.
• Logging is qualitative in nature.
• All holes are logged completely, all faces are mapped
completely.
Sub-sampling techniques
and sample preparation
• Generally, dril l core is sampled whole-core to
streamline the handling process and ensure a larger
more representative sample is obtained. For selected
drill holes where, representative core is required to be
kept, core is cut and half sampled. If a field duplicate is
required, the core is quarter cored and sampled.
• Samples are dried at 90°C, then crushed to <3mm.
Samples are then riffle split to obtain a sub-sample
of approximately 100g which is then pulverized to
90% passing 75um. 2g of the pulp sample is then
weighed with 12g of reagents including a binding
agent, the weighed sample is then pulverised again
for one minute. The sample is then compressed into a
pressed powder tablet for introduction to the XRF. This
preparation has been proven to be appropriate for the
style of mineralisation being considered.
13
• QA/QC is ensured during the sub-sampling stages
process via the use of the systems of an independent
NATA/ISO accredited laboratory contractor.
• The sample size is considered appropriate for the grain
size of the material being sampled, however due to
patchy mineralisation it is deemed that whole core
sampling is more representative for volume and patchy
mineralisation observed from sampling of the two cut
halves of core intervals.
• The un-sampled half of diamond core is retained for
check sampling if required.
• For RC chips regular field duplicates are collected and
analysed for significant variance to primary results.
Quality of assay data
and laboratory tests
• Assaying is undertaken via the pressed powder XRF
technique. Sn, As, WO3 and Cu have a detection limit
0.01%, Fe, Ca, MgO and S detection limits are 0.1%.
These assay methodologies are appropriate for the
resource in question.
• All assay data has built in quality control checks.
Each XRF batch of twenty consists of one blank,
one internal standard, one duplicate and a replicate,
anomalies are re-assayed to ensure quality control.
Verification of sampling
and assaying
• The labs conduct umpire checks reported on a
10-month basis for their own external checks.
• XRF calibration and servicing is conducted on a
regular basis.
• Anomalous intervals as well as random intervals are
routinely checked assayed as part of the internal QA/
QC process.
14
• Virtual twinned holes have been drilled in several
ins tances across a l l s i tes wi th no s igni ficant
issues highlighted. Drillhole data is also routinely
confirmed by development assay data in the operating
environment.
• Primary data is loaded into the drillhole database
system and then archived for reference.
• All data used in the calculation of resources and
reserves are compiled in databases (underground and
open pit) which are overseen and validated by senior
geologists.
• The lab results are received electronically in .csv file
format. No primary assay data is modified in any way.
If any error is noted, including transcription errors,
the lab is informed and immediate corrections are
requested prior to importing data into database.
• An electronic copy of the internal lab monthly report is
also filed away in Renison QAQC folder.
Location of data points • All data is spatially oriented by survey controls via
direct pickups by the survey department. Drillholes
are all surveyed downhole, currently with a GyroSmart
tool in the underground environment at Renison, and
a multishot camera for the typically short surface
diamond holes.
• All drilling and resource estimation is undertaken in
local mine grid at the various sites. Renison Mine grid
is orientated 41.97 degrees west of true north and the
RL=elevation+2000m.

15
• Topographic control is generated from remote sensing
methods in general, with ground-based surveys
undertaken where additional detail is required. This
methodology is adequate for the resource in question.
Data spacing
and distribution
• Drilling in the underground environment at Renison
is nominally carried-out on 40m x 40m spacing in
the south of the mine and 25m x 25m spacing in the
north of the mine prior to mining occurring. A lengthy
history of mining has shown that this data spacing is
appropriate for the mineral resource estimation process
and to allow for classification of the resource as it
stands.
• Drilling at Rentails is usually carried out on a 100m
centres. This is appropriate for the Mineral resource
estimation process and to allow for classification of the
resource as it stands.
• Compositing is carried out using “best fit” techniques
based upon the modal sample length of each individual
domain. This technique is deemed appropriate for the
Renison orebodies.
Orientation of data
in relation to
geological structure
• Drilling intersections are nominally designed to
be normal to the orebody as far as underground
infrastructure constraints/topography allows.
• Development sampling is nominally undertaken normal
to the various orebodies.
• It is not considered that drilling orientation has
introduced an appreciable sampling bias.

16
Sample security • At Renison and Rentails samples are delivered directly
to the on-site laboratory by the geotechnical crew
where they are taken into custody by the independent
laboratory contractor.
Audits or reviews • Site generated resources and reserves and the parent
geological data is routinely reviewed by the site team.
SECTION 2: REPORTING OF EXPLORATION RESULTS(Criteria listed in the preceding section also apply to this section.)
Criteria Commentary
Mineral tenement and
land tenure status
• All Tasmania resources are hosted within 12M1995, a
standard Tasmanian mining lease.
• No native title interests are recorded against the mining
lease.
• The mining lease is held by BMTJV of which YTPAH
has 50% ownership.
• No royalties above legislated state royalties apply to
the mining lease.
• BMTJV operates in accordance with all environmental
conditions set down as conditions for grant of the
mining leases.
• There are no known issues regarding security of tenure.
17
Exploration done
by other parties
• The Renison area has an exploration and production
history in excess of 100 years.
• BMTJV work has generally confirmed the veracity of
historic exploration data.
Geology • Renison is one of the world’s largest operating
underground tin mines and Australia’s largest primary
tin producer. Renison is the largest of three major
Skarn, carbonate replacement, pyrrhotite-cassiterite
deposits within western Tasmania. The Renison Mine
area is situated in the Dundas Trough, a province
underlain by a thick sequence of Neoproterozoic-
Cambrian siliciclastic and volcaniclastic rocks. At
Renison there are three shallow-dipping dolomite
horizons which host replacement mineralisation.
• The Rentails mineral resource is contained within three
Tailing Storage Facilities (TSF’s) that have been built
up from the processing of tin ore at the Renison Bell
mine over the period 1968 to 2016.
Drill hole information • No exploration results are reported as part of this
release, results relating to the deposits have been
previously released with full drill holes information.
Data aggregation methods • No exploration results are reported as part of this
release, results relating to the deposits have been
previously released.
• All results presented are length weighted.
• No high-grade cuts are used.

18
• Any contiguous zones of internal waste or high-grade
zones are clearly explained in relevant tables.
• Cu percentage is also reported for any significant Sn
intersections as a bi-product indicator value.
• No metal equivalent values are stated.
Relationship between
mineralization widths
and intercept lengths
• No exploration results are reported as part of this
release, results relating to the deposits have been
previously released.
• Unless indicated to the contrary, all results reported are
true width.
• Given restricted access in the underground environment
the majority of drillhole intersections are not normal to
the orebody.
Diagrams • No exploration results are reported as part of this
release, results relating to the deposits have been
previously released.
Balanced reporting • No exploration results are reported as part of this
release, results relating to the deposits have been
previously released.
Other substantive
exploration data
• No relevant information to be presented.
Further work • Exploration assessment and normal mine extensional
drilling continues to take place at Renison.
• Project assessment continues to progress at Rentails.
19
SECTION 3: ESTIMATION AND REPORTING OF MINERAL RESOURCES(Criteria listed in section 1, and where relevant in section 2, also apply to this section.)
Criteria Commentary
Database integrity • Drillhole data is stored in a Maxwell’s DataShedTM
system based on the Sequel Server platform which is
currently considered “industry standard”.
• As new data is acquired it passes through a validation
approval system designed to pick-up any significant
errors before the information is loaded into the master
database. The information is uploaded by a series
of Sequel routines and is performed as required.
The database contains diamond drilling (including
geotechnical and specific gravity data), face chip and
sludge drilling data and some associated metadata. By
its nature this database is large in size, and therefore
exports from the main database are undertaken (with
or without the application of spatial and various other
filters) to create a database of workable size, preserve
a snapshot of the database at the time of orebody
modelling and interpretation and preserve the integrity
of the master database.
• A random check of 20 original assay files against
database records is performed before the estimation as
part of validation, for any transcription errors or for
any incorrect assignment to drillholes.
• A resvalid code of zero is assigned to drillhole data
deemed reliable and trustworthy. A resvalid code
of 1 is assigned as invalid and flagged for further
investigation and not used in estimation.
20
Site visits • Mr. Colin Carter is employed as Renison Tin
Operation’ Geology Manager and is located on site on
a full time basis.
• Site generated resources and the parent geological data
is routinely reviewed by experienced senior resource
geologists.
Geological interpretation • Mining has occurred since 1800’s providing significant
confidence in the currently geological interpretation
across all projects.
• No alternative interpretations are currently considered
viable.
• Geological interpretation of the deposit was carried out
using a systematic approach to ensure that the resultant
estimated mineral resource figure was both sufficiently
constrained, and representative of the expected sub-
surface conditions. In all aspects of resource estimation
the factual and interpreted geology was used to guide
the development of the interpretation.
• Independent evaluations, underground structural and
geological mapping has been verified by an external
consultant geologist.
• The architecture of the Renison horst/graben system
is the dominant control on geological and grade
continuity.
• The depos i t iona l h i s to ry o f Ren ta i l s i s we l l
documented.
21
Dimensions • Renison has currently been mined over a strike length
of >1,950m, a lateral extent of >1,250m and a depth of
over 1,100m.
• Rentails is deposited in three adjacent TSFs which
have and aggregate length of approximately 1.8km and
a width at the widest point of circa 1km. Maximum
depth is in excess of 20m.
Estimation and
modelling techniques
• All modelling and estimation work undertaken
by BMTJV is carried out in three dimensions via
LeapfrogTM and Surpac VisionTM.
• After validating the drillhole data to be used in the
estimation, interpretation of the orebody is undertaken
in sectional and/or plan view to create the outline
strings which form the basis of the three-dimensional
orebody wireframe. Wireframing is then carried out
using a combination of automated stitching algorithms
and manual triangulation to create an accurate
three-dimensional representation of the sub-surface
mineralised body.
• Drillhole intersections within the mineralised body are
defined, these intersections are then used to flag the
appropriate sections of the drillhole database tables
for compositing purposes. Drillholes are subsequently
composited to allow for grade estimation. In all aspects
of resource estimation, the factual and interpreted
geology was used to guide the development of the
interpretation.
22
• Once the sample data has been composited, a statistical
analysis is undertaken Snowden Supervisor to assist
with determining estimation search parameters, top-
cuts etc. Variographic analysis of individual domains
is undertaken to assist with determining appropriate
search parameters, which are then incorporated with
observed geological and geometrical features to
determine the most appropriate search parameters.
• An empty block model is then created for the area
of interest. This model contains attributes set at
background values for the various elements of interest
as well as density, and various estimation parameters
that are subsequently used to assist in resource
categorisation. The block sizes used in the model will
vary depending on orebody geometry, minimum mining
units, estimation parameters and levels of informing
data available.
• Grade estimation is then undertaken, with ordinary
kriging estimation method is considered as standard,
al though in some circumstances where sample
populations are small, or domains are unable to
be accurately defined, inverse distance weighting
estimation techniques will be used. Both by-product
and deleterious elements are estimated at the time
of primary grade estimation. It is assumed that
by-products correlate well with tin. There are no
assumptions made about the recovery of by-products.
• SG is calculated using elemental Sn, Cu, As, Fe and
MgO grades in a stoichiometric function.
• The resource is then depleted for mining voids and
subsequently classified in line with JORC guidelines
utilising a combination of various estimation derived
parameters and geological/mining knowledge.

23
• This approach has proven to be applicable to BMTJV’s
tin assets and by previous mining reconciliation.
• Estimation results are routinely validated against
primary input data, previous estimates and mining
output.
• Good reconciliation between mine claimed figures and
milled figures is routinely achieved.
Moisture • Tonnage estimates are dry tonnes.
Cut-off parameters • The resource reporting cut-off grade is 0.7% Sn at
Renison.
• There is no lower reporting cut-off grade for Rentails.
Mining factors
or assumptions
• The Renison mine predominantly applies up-hole
benching and open stoping with in some cases post fill
and cemented rock fill to fill voids. The mining method
has been successfully applied over the past decade
with small tweaks and geotechnical considerations
progressively applied.
• A minimum mining width of underground development
is 4.5m and for underground stoping a minimum width
of 2.0 m. Resource models are diluted to these limits
before dilution is applied.
• Mining recoveries vary depending upon the stopes
physical shape, geological setting and size between
75% and 98%.
24
Metallurgical factors
or assumptions
• The Renison mine produces a tin concentrate of grade
varying between 50-60% Sn with internal process
designed to reduce penalty metals such as iron,
sulphur, tungsten and copper.
• The metallurgical process is complex and applies
several stages of gravity-type concentration as well as
sulphide and oxide flotation, regrinding and acid leach
methods. The method is proved and has successfully
operated for over 50 years.
• The metallurgical recovery is estimated based on
regression analysis of grade recovery curves from the
actual processing of ores in the plant.
• Metallurgical recoveries on the various ore types and
grades were considered as part of the cut-off grade
analysis.
Environmental factors
or assumptions
• BMTJV operates in accordance with all environmental
conditions set down as conditions for grant of the
respective Mining Leases.
Bulk density • Bulk density of the mineralisation at Renison is
variable. Bulk densi ty sampling is undertaken
via assessments of drill core (BMTJV practice
is to undertake bulk density determinations on a
representative selection of drill core sent for assay),
and are reviewed constantly (BMTJV practice is to
collect check SG samples as a regular part of the
mining cycle). Where no drill core or other direct
measurements are available, SG factors have been
assumed based on similarities to other zones of
mineralisation.

25
• The comprehensive density dataset available to
Renison has allowed the stoichiometric calculation
of density based on dominant mineral species. This
stoichiometric function is then uses ordinary kriged
block grades to calculate density into each block in
the block model. The current calculation is as follows:
2.61+(0.0159*Cu)+(0.0349*Sn)+(0.0339*Fe)+(0.0339
*As)+(0.0089*MgO).
• As a check to the calculation archimedes method data
continues to be collected for half cut core.
• Given the volume of the TSF’s are known, and the
tonnage of tailings material deposited into the dams
was recorded, the insitu bulk density of the Rentails
resource has been back-calculated.
Classification • Resources are classified in line with JORC guidelines
utilising a combination of various estimation derived
parameters, the input data and geological/mining
knowledge. This approach considers all relevant
factors and reflects the Competent Person’s view of the
deposit.
• At Renison classification utilises inverse distance
estimations for measured, indicated and inferred
c l a s s i f i ca t ions . The measured e s t ima t ion fo r
classification is limited to utilising only development
data of set above the drive to enforce the BMTJV’s
requirement that only those areas with ore development
may be classified as measured, up to 20m above the
development. The inverse distance estimations use a
combination of search size and sample selection to
allow zones of coherent classification related to drilling
density.

26
• A final validation step makes a comparison from
previous resource classifications, so that both a visual
check and block model outputs can be objectively
examined, reflecting changes in input data, confidence
of geology and metal values. Variations such as average
distance of informing samples, kriging variance and
slope of regression values for each resource category,
domain and pass number can be appropriately assessed,
so that the level of subjectivity when undertaking
classification can be minimised.
Audits or reviews • Resource estimates are peer reviewed by the site
technical team.
Discussion of relative
accuracy/confidence
• All currently reported resources est imates are
considered robust, and representative on both a global
and local scale.
• A c o n t i n u i n g h i s t o r y o f m i n i n g w i t h g o o d
reconciliation of mine claimed to mill recovered
provides confidence in the accuracy of the estimate for
Renison and Mount Bischoff.
• The appl icat ion of geostat is t ical analysis and
procedures through Snowden’s Supervisor v8.2
software is used to quantify and validate the resource
estimate. Currently, it is peer reviewed onsite by
experienced senior resource geologists prior to
releasing the final resource statement and prior to the
final report approved by the competent person.
• A detai led set of production records provides
confidence in the accuracy of the estimate for Rentails.


