Final Report
Study of the Impacts of Green Trade
Liberalisation on Least Developed
Countries
November 2015 Assignment performed by: Kenneth Baltzer and Michael Friis Jensen Department of Food and Resource Economics (IFRO) University of Copenhagen
Assignment performed for the Ministry of Foreign Affairs of Denmark (project manager Mr Adam Sparre Spliid, e-mail [email protected])
Final Draft: Impacts of Green Trade Liberalisation on LDCs
i
LIST OF CONTENTS
Acknowledgments iii
Acronyms and abbreviations iv
Summary v
1. Introduction 1
2. Background 5
2.1 The EGA negotiations 5
2.2 Identifying Environmental Goods 7
2.2.1 What is an environmental good? 7
2.2.2 Lists of environmental goods 9
2.2.3 Global trade in environmental goods 12
3. How the Environmental Goods Agreement may impact LDCs 17
3.1 Market access 17
3.1.1 LDC exports of environmental goods 17
3.1.2 Accessing global value chains 24
3.1.3 Standards and sustainability criteria 25
3.2 Access to imports 27
3.2.1 Access to environmental technology through the EGA 28
3.2.2 Technology transfer 31
3.3 SDT and A4T 33
3.4 Policy space 34
3.5 Tariff revenue 35
3.6 Implementation costs 37
3.7 Green protectionism 39
4. How the Environmental Goods Agreement may impacts Myanmar 40
4.1 Market access 41
4.1.1 Myanmar exports of environmental goods 41
4.1.2 Accessing global value chains 42
4.1.3 Standards and sustainability criteria 43
4.2 Access to imports 45
4.2.1 Access to environmental technology through the EGA 45
4.2.2 Technology transfer 46
4.3 Tariff revenue 48
4.4 Implementation costs 49
5. Conclusions and policy recommendations 51
Final Draft: Impacts of Green Trade Liberalisation on LDCs
ii
References 55

Final Draft: Impacts of Green Trade Liberalisation on LDCs
iii
Acknowledgments
The Ministry of Foreign Affairs of Denmark commissioned this report on the
impacts of a future Environmental Goods Agreement on the Least Developed
Countries. Associate Professor Kenneth Baltzer of the Department of Food and
Resource Economics (IFRO) of the University of Copenhagen together with
consultant Mr Michael Friis Jensen developed the report. From the Ministry side,
Ms Tanne Krogh Bertelsen lead the work from February to August 2015, while
Mr Adam Sparre Spliid took over from August to the conclusion of the work in
October 2015. We developed the report in close collaboration with a larger group
of people at the Ministry including Ms Bertelsen, Mr Spliid, Mrs Birgitte Mossin
Brønden and Mrs Lone Knudsen. We thank them all for their support, criticism
and contributions throughout the research process.
We would also like to thank Mr Christian Bundegaard and Ms Anemone
Birkebæk from the Danish Embassy in Geneva for assistance in organising the
Geneva trip and Ambassador Peter Lysholt Hansen and Mrs Khine Le Le San
Nant from the Danish Embassy in Yangon for helping organising the Myanmar
fieldwork. Mrs Urszula Maria Stepkowska from the European Commission, Mr
Ronald Steenblik from the OECD, Mr Muthukumara Mani from the World Bank,
and Mrs Ingrid Jegou and Mr Mahesh Sugathan both from the International
Centre for Trade and Sustainable Development (ICTSD) shared their in-depth
insight on green trade negotiations with us. We thank you very much for your
openness! We also are grateful for the fruitful discussions we had with Mrs
Emily Hemmings, Mr Jonas Lind, and Mr Mirko Woitzik from Development
Solutions who worked on a trade sustainability impact assessment of the
Environmental Goods Agreement commissioned by the European Commission.
And finally we thank the numerous individuals, agencies, country
representations and organizations we meet during fieldwork in Geneva and
Myanmar.
The views expressed in this report are our personal views and do not necessarily
reflect the position of the Ministry of Foreign Affairs of Denmark.
Final Draft: Impacts of Green Trade Liberalisation on LDCs
iv
Kenneth Baltzer Michael Friis Jensen
ACRONYMS AND ABBREVIATIONS
A4T Aid for Trade
ACP Africa, Caribbean, Pacific
APEC Asia-Pacific Economic Cooperation
EBA Everything But Arms
EGA Environmental Goods Agreement
EPA Economic Partnership Agreement
EPP Environmentally Preferable Product
EU European Union
GATT General Agreement on Tariffs and Trade
GNI Gross Domestic Income
HS Harmonised System
ICTSD International Centre for Trade and Sustainable Development
IMF International Monetary Fund
ITA Information Technology Agreement
LDC Least Developed Country
MFN Most Favoured Nation
NAMA Non-Agricultural Market Access
NTM Non-Tariff Measure
OECD Organisation for Economic Co-operation and Development
SDT Special and Differential Treatment
SPS Sanitary and Phytosanitary
TBT Technical Barriers to Trade
TRIPS Trade-Related Intellectual Property Rights
UNCTAD United Nations Conference on Trade and Development
UNFCCC United Nations Framework Convention on Climate Change
WITS World Integrated Trade Solution
WTO World Trade Organization

Final Draft: Impacts of Green Trade Liberalisation on LDCs
v
SUMMARY
17 WTO members negotiate the Environmental Goods Agreement (EGA) that
aims to liberalise green trade in the form of tariff cuts on an list of
environmental goods. In this report commissioned by the Ministry of Foreign
Affairs of Denmark, we ask what effects the EGA will have on LDCs, what are
the LDCs offensive and defensive interests and which assistance will help LDCs
adjust to a liberal green trade regime? The Ministry commissioned the report to
implement Denmark’s Action Plan for Policy Coherence for Development.
We find that the EGA currently on the negotiation table will neither benefit
nor harm LDCs. They may be affected either when their export markets cut
tariffs and opens their markets or when LDCs cut their own tariffs and gain
access to cheaper technologies to combat their own environmental problems.
LDCs exports will hardly be affected. LDCs export only about $1 billion of
environmental goods (about half a per cent of their total exports) and only a third
of this export is destined for countries negotiating the EGA. LDCs already access
the markets of most EGA negotiating countries tariff free due to preferential
trading arrangements. The environmental goods to be liberalised are too high
tech to be produced by LDCs either as finished products or as components.
In most LDCs, the EGA will not provide better access to green technologies. If
LDCs join the EGA, tariffs will in most cases not fall much because the average
tariff is a moderate 8.6%. For some industries in some LDCs, cutting tariffs may
increase imports because tariff peaks reach up to 40%. Eleven LDCs have average
tariffs above 10%. But even here, other factors than the price of technology
constrain its transfer. In Myanmar, we found that adverse government policy
and low private investment constrain renewable energy technology transfer.
But the EGA might evolve over time and if it does, it may become more
relevant to the LDCs. LDCs export many products that some observers claim are
environmentally friendly like cotton (view as greener than synthetic fibres). The
inclusion of many such products is, however, politically very difficult. More

Final Draft: Impacts of Green Trade Liberalisation on LDCs
vi
politically feasible it is to include the regulation of non-tariff barriers if the EGA
is changed in the future. LDCs may want to join the EGA if it becomes a forum
for regulating standards and sustainability criteria.
Final Draft: Impacts of Green Trade Liberalisation on LDCs
1
1. Introduction
Today, technology can address global and local environmental problems but
we do not always allow it. Much energy production, for example, is still based
on coal, while renewable energy technologies offer cleaner solutions.
Governments impose tariffs on the import of environmental goods embodying
such clean technologies, thus preventing technologies to flow freely from where
they have been invented to where they are needed.
The negotiations on a future Environmental Goods Agreement (EGA) seek to
remove this man-made obstacle. 17 WTO members currently seek a green
liberalisation by establishing a plurilateral trade agreement nested within the
WTO that would as a first step remove tariffs on environmental goods. The
target is to produce an agreement by the end of 2015 that likely will include
immediate green trade liberalisation in the form of tariff removal on an agreed
list of environmental goods and a plan for longer term liberalisation consisting in
the inclusion of more environmental goods and potentially even services and the
removal of non-tariff barriers.
17 high and middle income WTO members (including the European Union
(EU) as one member) are negotiating the EGA. While any WTO member is
invited to join the negotiations, no Least Developed Country (LDC) member has
so far chosen to do so.
The report was commissioned by the Trade Policy Department under the
Ministry of Foreign Affairs of Denmark. The report is part of the
implementation of Denmark’s Action Plan for Policy Coherence for Development
that establishes the interests of LDCs in international trade negotiations as a
Danish priority.
Purpose
The purpose of this report is to analyse the impacts on LDCs of the EGA.
Denmark is one of the WTO members negotiating the EGA through its

Final Draft: Impacts of Green Trade Liberalisation on LDCs
2
membership of the EU. The basis for the report is the terms of reference issued by
the Ministry of Foreign Affairs of Denmark, the project proposal agreed between
the Ministry of Foreign Affairs of Denmark and the authors and the Inception
Report submitted to the Ministry on 3 April 2015.
The report seeks to answer to the following research questions:
� What effects will the EGA have on LDCs?
� What are the concerns, interests and sensitivities of LDCs in green
liberalisation including offensive and defensive interests?
� What types of assistance will ease the transition and adaption to a
liberalisation of green trade to LDCs?
� Which measures can alleviate negative effects on LDCs?
Three policy agendas intersect in the EGA: environmental policy, trade policy
and development policy. To avoid that the pursuit of several policies
simultaneously result in contradicting policies, Denmark has adopted an Action
Plan for Policy Coherence for Development (Ministry of Foreign Affairs 2014).
This report is part of the implementation of the action plan. Answering the
research questions will allow us to say whether Denmark’s development policy
in the form of safeguarding LDC interests are aligned with Denmark’s
environmental and trade policies in the form of concluding the EGA.
Research methodology and limitations
We have reviewed the large academic and policy literature on green trade
liberalisation including both formally published literature and grey literature
like WTO documents from the Committee on Trade and Environment. The
existing literature is quite large, although often repetitive with many newer
studies referencing older ones. Most studies are overview studies, while more
academic studies like modelling analyses and in-depth case studies are rare.
Furthermore, we have analysed available data on trade flows and tariffs. The
most widely used source of trade flow data is the Comtrade database from the
Final Draft: Impacts of Green Trade Liberalisation on LDCs
3
United Nations Statistics Division that collects data on imports and exports from
all member countries’ national statistical agencies. Comtrade data presents two
specific challenges: First, not all member countries and in particular not LDCs
report trade statistics on a yearly basis, thus leaving significant gaps in the data
material. For instance, Myanmar has not reported data on trade flows since 2010.
And second, when both countries in a bilateral trade flow have reported import
and export figures, they do not always match. Myanmar’s reported exports of
timber to Thailand may not correspond to Thailand’s reported imports from
Myanmar. To address these issues, we use balanced data from the BACI database
(Gaulier and Zignago 2010), prepared by CEPII. The BACI database is derived
from Comtrade data, where the holes left by incomplete reporting are (partly)
filled by the mirrored data and where discrepancies between import and export
number have been reconciled through advanced statistical methods.
Data on applied tariffs matching the trade flow data are obtained through the
World Integrated Trade Solutions (WITS) portal developed by the World
Bank. The tariff database specifies a bilateral tariff structure including both Most-
Favoured Nations (MFN) tariffs and preferential tariff rates applied in regional
trade agreements and preferential market access regimes.
In the statistical analysis, we exclude intra-EU trade because the EU negotiates
as one entity and intra-EU trade is already duty-free. Adding intra-EU trade
would artificially inflate the potential impact of the EGA.
Interviews conducted in Geneva and Myanmar complement the literature
review and descriptive data analysis. In Geneva, we interviewed trade
negotiators from LDCs and other developing countries and from research and
policy institutions about the status of the negotiations. We also conducted a case
study of Myanmar focusing on renewable energy; a topic of particularly high
relevance to the country, because Myanmar has one of the world’s lowest
electrification rates leaving most rural households completely without electricity.
Myanmar is a large LDC located in fast growing South East Asia and we hoped
that the country’s size and location would allow us to study some of the impacts

Final Draft: Impacts of Green Trade Liberalisation on LDCs
4
of the EGA already identified at a general level in more depth. This case study
was based on stakeholder interviews, literature and descriptive data analysis.
Outline of the report
The report is organized in five chapters including the present introduction.
Chapter two provides the background for the EGA negotiations and for studying
the interests of LDCs in green trade and green trade liberalisations. Chapter three
identifies the impacts of a future EGA on LDCs and discusses each one based on
available literature and the descriptive analysis of trade flow and tariff data.
Chapter four studies the case of Myanmar, focusing on four of the impacts
already identified in chapter three. Chapter five concludes and provides policy
recommendations.
Final Draft: Impacts of Green Trade Liberalisation on LDCs
5
2. Background
2.1 The EGA negotiations
Negotiations on green liberalisation are part of the Doha Round. Paragraph
31(iii) of the Doha Ministerial Declaration mandates the WTO members to
negotiate the reduction or elimination of tariff and non-tariff barriers to
environmental goods and services.
The negotiations soon faced very severe political and practical difficulties.
Members could not agree to prioritize green liberalisation and at a practical level,
they could not agree which goods and services to focus on and which trade
barriers to remove. When the plurilateral EGA negotiations started in July 2014,
green liberalisation had not advanced in the WTO for years.
In 2012, the Asia-Pacific Economic Cooperation (APEC) agreed to liberalise the
trade of 54 environmental products. The heads of state of the 21 APEC members
met in Vladivostok and agreed to lower tariffs on the 54 goods to maximum 5%
by the end of 2015. Then, on 8 July 2014, 14 WTO members (counting the EU as
one) launched plurilateral negotiations on the EGA. The EGA would use the
APEC list of environmental goods as the starting point and focus on tariffs on
goods while leaving services and non-tariff barriers to later. Since then another
three countries have joined the EGA negotiations.
The plurilateral EGA is nested under the WTO and WTO members may join
the EGA negotiations at any stage. Trade benefits offered by a future EGA will
be extended to all WTO members following the Most Favoured Nation (MFN)
principle. Thus all WTO LDC members will enjoy increased market access for
environmental goods.
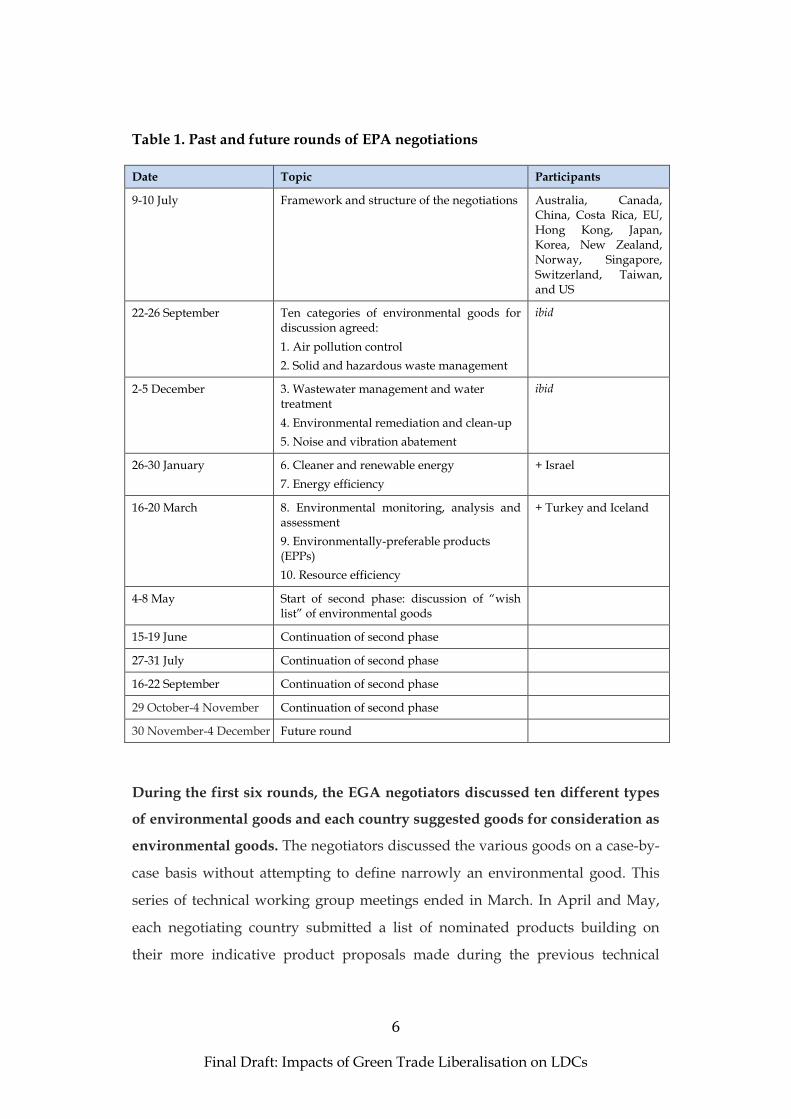
So far, the plurilateral group – which have grown to comprise 17 countries –
have held ten technical working group meetings. During these technical
meetings, the group has discussed ten different categories of environmental
goods, as illustrated in table 1.
Final Draft: Impacts of Green Trade Liberalisation on LDCs
6
Table 1. Past and future rounds of EPA negotiations
Date Topic Participants
9-10 July Framework and structure of the negotiations Australia, Canada, China, Costa Rica, EU, Hong Kong, Japan, Korea, New Zealand, Norway, Singapore, Switzerland, Taiwan, and US
22-26 September Ten categories of environmental goods for discussion agreed:
1. Air pollution control
2. Solid and hazardous waste management
ibid
2-5 December 3. Wastewater management and water treatment
4. Environmental remediation and clean-up
5. Noise and vibration abatement
ibid
26-30 January 6. Cleaner and renewable energy
7. Energy efficiency
+ Israel
16-20 March 8. Environmental monitoring, analysis and assessment
9. Environmentally-preferable products (EPPs)
10. Resource efficiency
+ Turkey and Iceland
4-8 May Start of second phase: discussion of “wish list” of environmental goods
15-19 June Continuation of second phase
27-31 July Continuation of second phase
16-22 September Continuation of second phase
29 October-4 November Continuation of second phase
30 November-4 December Future round
During the first six rounds, the EGA negotiators discussed ten different types
of environmental goods and each country suggested goods for consideration as
environmental goods. The negotiators discussed the various goods on a case-by-
case basis without attempting to define narrowly an environmental good. This
series of technical working group meetings ended in March. In April and May,
each negotiating country submitted a list of nominated products building on
their more indicative product proposals made during the previous technical

Final Draft: Impacts of Green Trade Liberalisation on LDCs
7
meetings. The individual lists of nominated products were subsequently
combined to a “wish list” of environmental goods containing about 650 goods. In
mid-August the chair of the EGA negotiations narrowed the wish list to 450
goods based on individual goods’ support during the negotiations and
environmental credibility (ICTSD 2015a).
To agree on the EGA, negotiators need to narrow the list further and to
establish the modalities for the final agreement. Likely, many goods have to be
precisely defined within international customs codes. The EGA will also include
a review mechanism allowing for products to be taken off the list and other
products to be added foreseeing that technologies will change over time. The
group of negotiation countries has informally set the WTO Ministerial
Conference in Nairobi in December 2015 as the deadline for a final agreement.
2.2 Identifying environmental goods
2.2.1 What is an environmental good?
The lack of a clear definition of an environmental good challenges the
negotiations. These challenges are related to dual-use products, Environmentally
Preferably Products (EPPs) and ex-outs (Sugathan 2009).
Many environmental goods are dual-use products that have both
environmental and non-environmental uses. For instance, batteries may be used
to store wind- or solar generated power, but they are equally suitable for storing
fossil fuel generated electricity. A customs officer has little chance to determine
the end use of imports when applying duties. The number of core environmental
goods with clear environmental benefits that few would dispute – like solar
panels, wind turbines and air purifying filters – is limited.
EPPs are products that possess certain environmental qualities relative to a
substitute product. Examples include sacks and packaging materials made from
jute and other plant fibres, which may substitute plastic bags, or biodiesel
replacing fossil fuels. Including EPPs in the negotiations is difficult. The

Final Draft: Impacts of Green Trade Liberalisation on LDCs
8
environmental benefits of many EPPs relate to the production process as
exemplified by biodiesel. Biodiesel saves CO2 if its production emits less CO2
than the fossil fuel it replaces. The CO2 emitted by biodiesel varies. An extreme
example is if biodiesel is produced from palm oil farmed on plantations that
cleared virgin rain forest. The clearing of the forest may have emitted more CO2
than what is saved by burning biodiesel instead of fossil fuel. Therefore, several
negotiating parties including the EU want to use sustainability criteria to identify
EPPs. EPPs will have to be certified that they comply with sustainability criteria,
but certification schemes may be costly to set up and may become non-tariff
barriers to trade.
EGA negotiators discuss using ex-outs to precisely define environmental
goods. In the language of the negotiators ex-outs are goods defined at a more
detailed level than what is allowed by the Harmonized Systems (HS)
nomenclature created by the World Customs Organization. The HS assigns each
product category with a numerical code; the more digits, the more disaggregated
the product category is. The HS-codes are standardized worldwide down to the
6-digit level (yielding more than 5000 categories), but below this, each country
uses its own system to add digits to create more finely disaggregated categories.
In the HS most environmental goods are grouped together with non-
environmental products. For example, the product category “901380: LCDs not
constituting articles provided for in other headings” contains “heliostats” (a
mirror that concentrates the sun and used to produce solar energy), but most of
the trade in this category is LCD flat screen TVs (Vossenaar 2014). The lack of
detail in the HS presents negotiators with a dilemma: Should the EGA include
the whole HS6 product category, thereby liberalizing many non-environmental
goods alongside the targeted environmental ones, or should the EGA use ex-outs
to focus on the environmental goods, thereby having to agree on their
classification internationally below the HS6 level? Using ex-outs allows
negotiators to identify environmental goods more accurately than the HS6 tariff
Final Draft: Impacts of Green Trade Liberalisation on LDCs
9
schedule allows, but it also produces a much more complex agreement, which
may be more difficult to implement, not least for developing countries.
Most nominated products are sophisticated technologies and products, like
wind mills and solar panels or components thereof. This choice of
environmental goods is both result of the nature of the negotiating members
involved and of the nature of environmental goods considered. The participating
members are high income and a few middle income countries primarily
interested in sophisticated environmental goods.
Observers have asked themselves whether this focus on sophisticated
environmental goods and the reluctance of LDCs to participate in green
liberalisation – under the newly started plurilateral negotiations, in the WTO
or elsewhere – is a true reflection of LDCs’ interests. UNCTAD (1995) and
Hamwey (2005), for instance, have argued that developing countries including
LDCs have export interests in environmentally preferable products, which have
played only a minor role in the plurilateral negotiations. Furthermore, while
LDCs do not produce sophisticated environmental goods, they need such goods
to combat their own domestic environmental problems.
2.2.2 Lists of environmental goods
At the time of writing (September 2015), the list of environmental goods on the
table in the EGA negotiations is confidential and we have not had access to it.
However, we have a good indication of what will form the core of a future EGA
from a variety of lists proposed during earlier negotiations under the WTO and
from lists developed by researchers engaged in the green liberalisation debate.
Table 2 presents an overview of the different lists and the number of HS6
categories proposed by the lists.
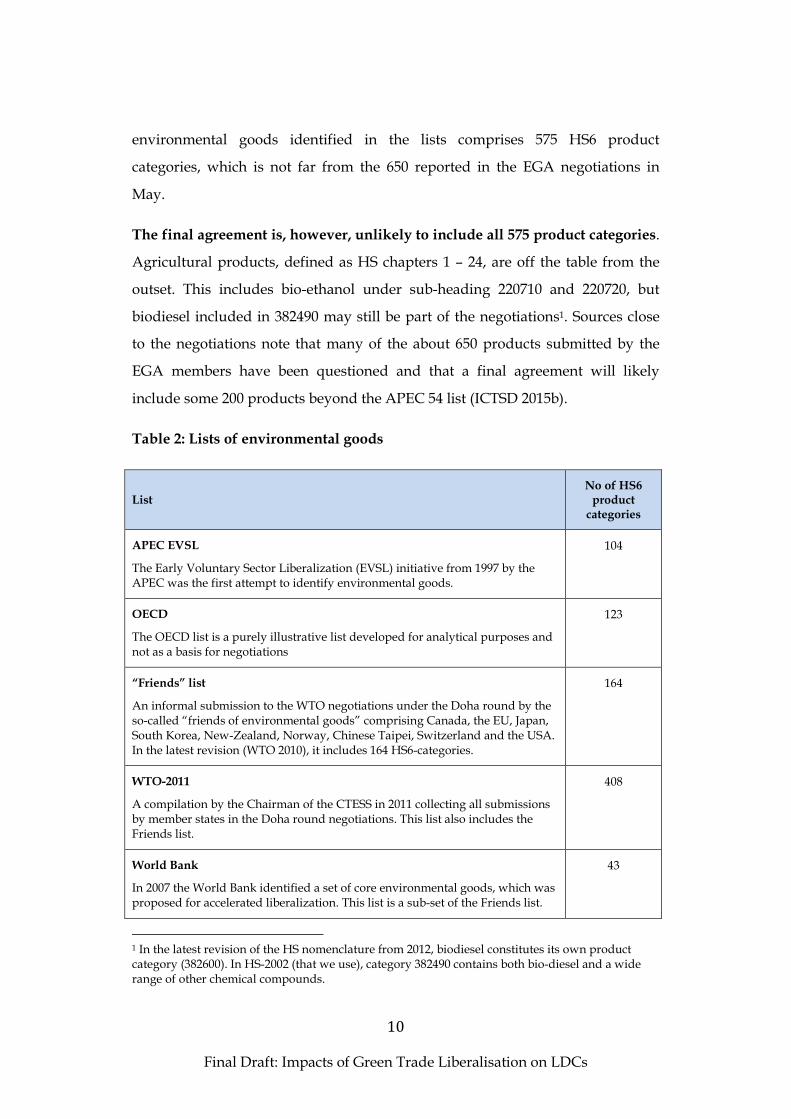
The individual lists overlap partly or completely. The most obvious
environmental goods, such as 841919 (solar water heaters), are represented on all
lists, and in some cases the same product category is on several lists but used as
the basis for different ex-outs. Accounting for the overlaps, a gross list of all
Final Draft: Impacts of Green Trade Liberalisation on LDCs
10
environmental goods identified in the lists comprises 575 HS6 product
categories, which is not far from the 650 reported in the EGA negotiations in
May.
The final agreement is, however, unlikely to include all 575 product categories.
Agricultural products, defined as HS chapters 1 – 24, are off the table from the
outset. This includes bio-ethanol under sub-heading 220710 and 220720, but
biodiesel included in 382490 may still be part of the negotiations1. Sources close
to the negotiations note that many of the about 650 products submitted by the
EGA members have been questioned and that a final agreement will likely
include some 200 products beyond the APEC 54 list (ICTSD 2015b).
Table 2: Lists of environmental goods
List No of HS6 product categories
APEC EVSL
The Early Voluntary Sector Liberalization (EVSL) initiative from 1997 by the APEC was the first attempt to identify environmental goods.
104
OECD
The OECD list is a purely illustrative list developed for analytical purposes and not as a basis for negotiations
123
“Friends” list
An informal submission to the WTO negotiations under the Doha round by the so-called “friends of environmental goods” comprising Canada, the EU, Japan, South Korea, New-Zealand, Norway, Chinese Taipei, Switzerland and the USA. In the latest revision (WTO 2010), it includes 164 HS6-categories.
164
WTO-2011
A compilation by the Chairman of the CTESS in 2011 collecting all submissions by member states in the Doha round negotiations. This list also includes the Friends list.
408
World Bank
In 2007 the World Bank identified a set of core environmental goods, which was proposed for accelerated liberalization. This list is a sub-set of the Friends list.
43
1 In the latest revision of the HS nomenclature from 2012, biodiesel constitutes its own product category (382600). In HS-2002 (that we use), category 382490 contains both bio-diesel and a wide range of other chemical compounds.

Final Draft: Impacts of Green Trade Liberalisation on LDCs
11
APEC-54
The list of 54 HS6 product categories slated for tariff reduction to 5% by the APEC countries.
54
ICTSD mapping studies
The International Centre for Trade and Sustainable Development (ITCSD) conducted three mapping studies on climate-mitigating technologies related to three specific subsectors: Renewable Energy, Transportation and Residential and Commercial Buildings.
188
Base list
We define the base list of the most likely environmental goods to be included in the EGA as the Friends list combined with the APEC-54.
171
Gross list
This is the combination of all lists proposed so far, accounting for overlaps.
575
Source: Own calculations based on APEC (2012), Jha (2009), Steenblik (2005b), Sugathan (2013a), Wind (2010), World Bank (2008), Vossenaar and Jha (2010b), WTO (2010), WTO (2011).
The statistical analysis in this report is based on a “base list” of environmental
goods consisting of the Friends list and APEC-54. We use trade and tariff data
according to the 2002 HS-revision. This base list is used as a “best guess” of the
set of environmental goods most likely to form the basis for a future EGA. The
list includes 171 HS6 categories, and may be on the low side of the future EGA.
However, it has the advantage of transparency and the proven support of several
of the central parties in the negotiations, including the EU, Japan and the USA.
We view the broader gross list of environmental goods as a pool of potential
products that could be added to the agreement, before the conclusion of the
agreement or after. In the statistical analysis of LDC interests, we search through
the gross list for products of potential interest to the LDCs.
Throughout the analysis, the numbers should be viewed as upper limits of the
effects of an EGA rather than precise estimates. The available data is specified
at the 6-digit level, while most environmental goods are designated at a more
disaggregated level through the use of ex-outs as noted above. This means that
the trade flow numbers presented here include both environmental goods and
products likely to be excluded from the EGA through ex-outs.

Final Draft: Impacts of Green Trade Liberalisation on LDCs
12
2.2.3 Global trade in environmental goods
World trade in environmental goods has nearly tripled in 10 years to reach
$900 billion in 2013, see figure 1. The steady increase in this trade, representing
an average annual growth rate of roughly 10%, was temporarily interrupted by
the global financial crisis in 2008 and again in 2011. Nearly 90% of the global
environmental goods trade are exported from countries participating in the EGA
negotiations, notably participating OECD countries plus China. Total LDC
exports are miniscule.
However, increasing environmental goods exports do not represent a shift in
trade patterns towards greener trade. On the contrary, environmental goods
have largely maintained a steady share of world trade, at little more than 6% of
total trade, suggesting that the increase in green trade more or less follows the
general expansion in world merchandise trade over time. The countries
participating in the EGA negotiations have focused their exports slightly more on
environmental goods, while the share of environmental goods in the rest of the
world has declined slightly, but overall the trade pattern is stable over time.
Figure 1: Exports of environmental goods, 2003 – 2013
Source: Own calculations based on data from the BACI database, HS 2002 revision
0
100
200
300
400
500
600
700
800
900
1000
2003 2004 2005 2006 2007 2008 2009 2010 2011 2012 2013
$ b
illi
on
World EGA Non-EGA LDCs
Final Draft: Impacts of Green Trade Liberalisation on LDCs
13
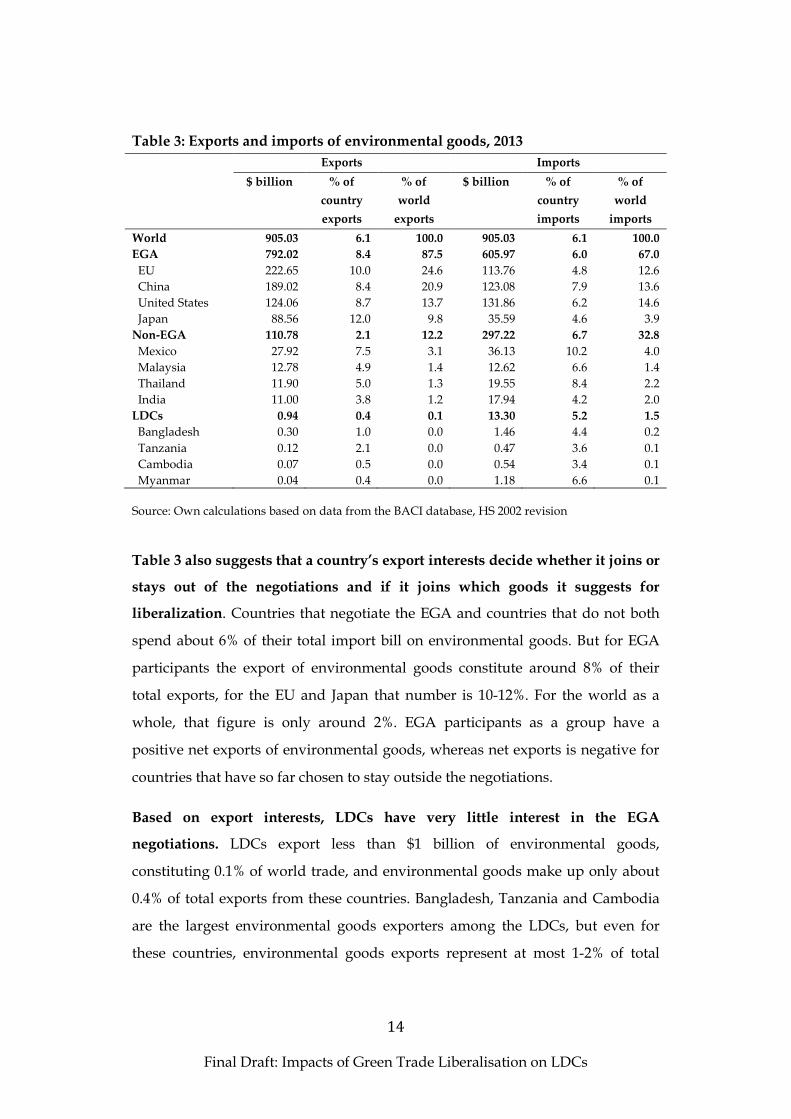
Table 3 presents exports and imports of environmental goods both for selected
countries and for four groups of countries. The groups of countries are the
world, EGA negotiating countries, all other countries and LDCs. For each group,
the table indicates the four top exporters and the table also includes Myanmar
because it is chosen as a case country in this report. All numbers are from 2013.
Earlier plurilateral agreements, such as the Information Technology
Agreement (ITA), adopted a critical mass threshold of approximately 90% of
global trade as a precondition for the agreement to take effect. The idea of a
critical mass threshold is to reduce incentives for free riding. Since plurilateral
agreements require signatories to liberalize tariffs on an MFN-basis to be
consistent to WTO legislation, countries which are not part of the agreement also
gains from the improved access to the markets of the signatory countries without
having to reduce their own tariffs. A critical mass threshold of 90% ensures that
most of the countries benefiting from the agreement also contribute to it. Likely,
the EGA will include a critical mass threshold, but the negotiators are still to
agree on its size (Vossenaar 2014). Table 3 suggests that reaching a reasonable
critical threshold will be unproblematic.
Final Draft: Impacts of Green Trade Liberalisation on LDCs
14
Table 3: Exports and imports of environmental goods, 2013
Exports Imports
$ billion % of
country
exports
% of
world
exports
$ billion % of
country
imports
% of
world
imports
World 905.03 6.1 100.0 905.03 6.1 100.0
EGA 792.02 8.4 87.5 605.97 6.0 67.0
EU 222.65 10.0 24.6 113.76 4.8 12.6
China 189.02 8.4 20.9 123.08 7.9 13.6
United States 124.06 8.7 13.7 131.86 6.2 14.6
Japan 88.56 12.0 9.8 35.59 4.6 3.9
Non-EGA 110.78 2.1 12.2 297.22 6.7 32.8
Mexico 27.92 7.5 3.1 36.13 10.2 4.0
Malaysia 12.78 4.9 1.4 12.62 6.6 1.4
Thailand 11.90 5.0 1.3 19.55 8.4 2.2
India 11.00 3.8 1.2 17.94 4.2 2.0
LDCs 0.94 0.4 0.1 13.30 5.2 1.5
Bangladesh 0.30 1.0 0.0 1.46 4.4 0.2
Tanzania 0.12 2.1 0.0 0.47 3.6 0.1
Cambodia 0.07 0.5 0.0 0.54 3.4 0.1
Myanmar 0.04 0.4 0.0 1.18 6.6 0.1
Source: Own calculations based on data from the BACI database, HS 2002 revision
Table 3 also suggests that a country’s export interests decide whether it joins or
stays out of the negotiations and if it joins which goods it suggests for
liberalization. Countries that negotiate the EGA and countries that do not both
spend about 6% of their total import bill on environmental goods. But for EGA
participants the export of environmental goods constitute around 8% of their
total exports, for the EU and Japan that number is 10-12%. For the world as a
whole, that figure is only around 2%. EGA participants as a group have a
positive net exports of environmental goods, whereas net exports is negative for
countries that have so far chosen to stay outside the negotiations.
Based on export interests, LDCs have very little interest in the EGA
negotiations. LDCs export less than $1 billion of environmental goods,
constituting 0.1% of world trade, and environmental goods make up only about
0.4% of total exports from these countries. Bangladesh, Tanzania and Cambodia
are the largest environmental goods exporters among the LDCs, but even for
these countries, environmental goods exports represent at most 1-2% of total

Final Draft: Impacts of Green Trade Liberalisation on LDCs
15
exports. On the import side, however, LDCs are almost in line with the rest of the
world. A little more than 5% of LDC imports is environmental goods.
Interviews with developing countries’ delegations in Geneva made it clear that
LDCs show little interests in EGA negotiations. We interviewed in person or by
telephone LDC delegates from Rwanda, Ethiopia, Bangladesh, Mozambique,
Myanmar, Tanzania and Zambia. The general picture was clear: Few of them had
followed the EGA negotiations, much less developed a position on the issues. We
hypothesize that the stakes for LDCs are too small to warrant the devotion of
resources to the negotiations. We also interviewed delegates from Vietnam and
Thailand to gauge the interests of middle income countries. Both countries were
following the negotiations and Thailand was consulting with its own producers
of environmental goods to develop official positions. Neither country expressed
interest in joining the negotiations soon.
Table 4 presents the average tariffs, minimum and maximum tariffs on
environmental goods by the same countries and groups of countries as in table
3. Tariffs on environmental goods are already fairly low; on average 6.5%

Final Draft: Impacts of Green Trade Liberalisation on LDCs
16
Table 4: Import tariffs on environmental goods
Tariffs
Simple average Minimum Maximum
World 6.5 0.0 90.0
EGA 3.4 0.0 35.0
European Union 2.0 0.0 12.0
China 7.2 0.0 35.0
United States 1.3 0.0 10.3
Japan 0.3 0.0 5.3
Non-EGA 7.1 0.0 90.0
Mexico 4.0 0.0 20.0
Malaysia 7.6 0.0 40.0
Thailand 5.0 0.0 30.0
India 8.1 0.0 10.0
LDCs 8.6 0.0 40.0
Bangladesh 8.7 2.0 25.0
Tanzania 5.9 0.0 35.0
Cambodia 15.0 7.0 35.0
Myanmar 2.2 0.0 15.0
Source: Own calculations based on data from WITS, latest year.
globally and only 3.4% among the EGA members. This partly reflects the nature
of environmental goods. These are primarily industrial (and in many case high-
technology) products and the heavily protected agricultural products are
excluded from the negotiations. LDCs, on average, also impose relatively low
tariffs. Despite the low average tariffs in EGA countries and LDCs alike, tariff
peaks on some products are still substantial. In China, Tanzania and Cambodia,
for example, the highest tariffs are 35%, a figure that suggests that in certain
sectors market access can still be improved by reducing tariffs.

Final Draft: Impacts of Green Trade Liberalisation on LDCs
17
3. How the Environmental Goods Agreement may impact LDCs
3.1 Market access
This section analyses market access from three angles. First, it analyses LDCs
current trade flows of potential environmental goods in order to identify the
products of most export interest to LDCs. Second, it investigates the potential of
LDCs to supply global environmental good value chains. Thirdly, the section
looks beyond the EGA negotiations’ current focus on tariff reduction and
discusses how LDCs would fare if non-tariff measures in the form of standards
and sustainability criteria become a part of a future EGA.
3.1.1 LDC exports of environmental goods
LDCs export very few environmental goods and even fewer will be covered by
the EGA. Table 5 summarizes LDC exports of environmental goods and the
tariffs LDCs pay to foreign countries for those exports of environmental goods.
Here we discuss the export figures. The table gives both world exports and
exports to the EGA negotiating countries. Less than half a per cent of LDC total
exports are environmental goods (as defined in this study) and about a third of
that half per cent is exported to the EGA negotiating countries. The major share
of LDC exports of environmental goods is destined for neighbouring countries,
primarily other larger developing countries. For instance, as the main trading
partner of Bangladesh, India takes more environmental goods exports from
LDCs than the EU. Other major destinations are Thailand, Pakistan and Kenya.
In other words, a vanishingly small share of 0.16% of LDC exports would enjoy
the benefits of tariff reductions if LDCs were to join the EGA.

Final Draft: Impacts of Green Trade Liberalisation on LDCs
18
Table 5: LDC exports of environmental goods and tariff payments, 2013
Environmental goods exports Tariff payments
$ million % of total exports $ million % of total
tariff
payments
All
countries
EGA
countries
All
countries
EGA
countries
LDCs 943.4 333.1 0.45 0.16 0.41 0.01
Afghanistan 4.3 2.8 0.59 0.39 0.01 0.02
Angola 32.8 26.7 0.05 0.04 0.00 0.00
Bangladesh 303.6 96.8 0.98 0.31 0.35 0.03
Benin 3.2 1.0 0.34 0.11 0.00 0.00
Bhutan 0.1 0.1 0.07 0.05 0.00 0.09
Burkina Faso 8.6 3.2 0.32 0.12 0.00 0.00
Burundi 0.2 0.2 0.31 0.21 0.00 0.00
Cambodia 70.3 6.7 0.51 0.05 0.00 0.00
Central Afric. Rep. 0.7 0.1 0.61 0.05 0.00 0.00
Chad 1.0 0.3 0.04 0.01 0.00 0.00
Comoros 0.2 0.1 0.27 0.19 0.00 0.00
Congo, Dem. Rep. 3.9 0.9 0.05 0.01 0.00 0.00
Djibouti 1.1 0.2 1.47 0.33 0.00 0.00
Equatorial Guinea 8.7 6.8 0.07 0.05 0.00 0.00
Eritrea 9.5 0.2 3.77 0.07 0.00 0.00
Ethiopia 19.1 17.3 0.49 0.44 0.00 0.00
Gambia, The 0.2 0.1 0.10 0.05 0.00 0.00
Guinea 0.9 0.5 0.05 0.03 0.00 0.00
Guinea-Bissau 0.0 0.0 0.01 0.00 0.00 0.00
Haiti 0.5 0.4 0.05 0.04 0.00 0.00
Kiribati 0.1 0.1 0.12 0.10 0.00 0.00
Lao PDR 5.1 1.6 0.17 0.05 0.00 0.00
Liberia 2.7 1.9 0.24 0.17 0.00 0.00
Madagascar 15.3 9.7 0.70 0.44 0.00 0.01
Malawi 8.7 0.2 0.63 0.02 0.00 0.00
Mali 1.7 0.5 0.32 0.10 0.00 0.00
Mauritania 1.3 0.4 0.03 0.01 0.00 0.00
Mozambique 63.1 16.1 0.91 0.23 0.00 0.00
Myanmar 36.4 26.2 0.39 0.28 0.01 0.00
Nepal 51.8 0.8 5.75 0.09 0.00 0.02
Niger 27.6 27.1 0.90 0.88 0.02 0.00
Rwanda 3.1 0.3 0.34 0.03 0.00 0.00
Sao Tome & Princ. 0.4 0.3 3.42 2.75 0.00 0.00
Senegal 7.8 3.2 0.68 0.28 0.00 0.00
Sierra Leone 5.7 3.2 0.38 0.21 0.00 0.01
Solomon Islands 0.3 0.2 0.04 0.04 0.00 0.00
Somalia 0.2 0.1 0.04 0.03 0.00 0.00
Tanzania 118.0 55.2 2.11 0.99 0.00 0.00
Togo 23.8 1.8 1.31 0.10 0.00 0.00
Tuvalu 0.0 0.0 0.15 0.15 0.00 0.00
Final Draft: Impacts of Green Trade Liberalisation on LDCs
19
Environmental goods exports Tariff payments
$ million % of total exports $ million % of total
tariff
payments
All
countries
EGA
countries
All
countries
EGA
countries
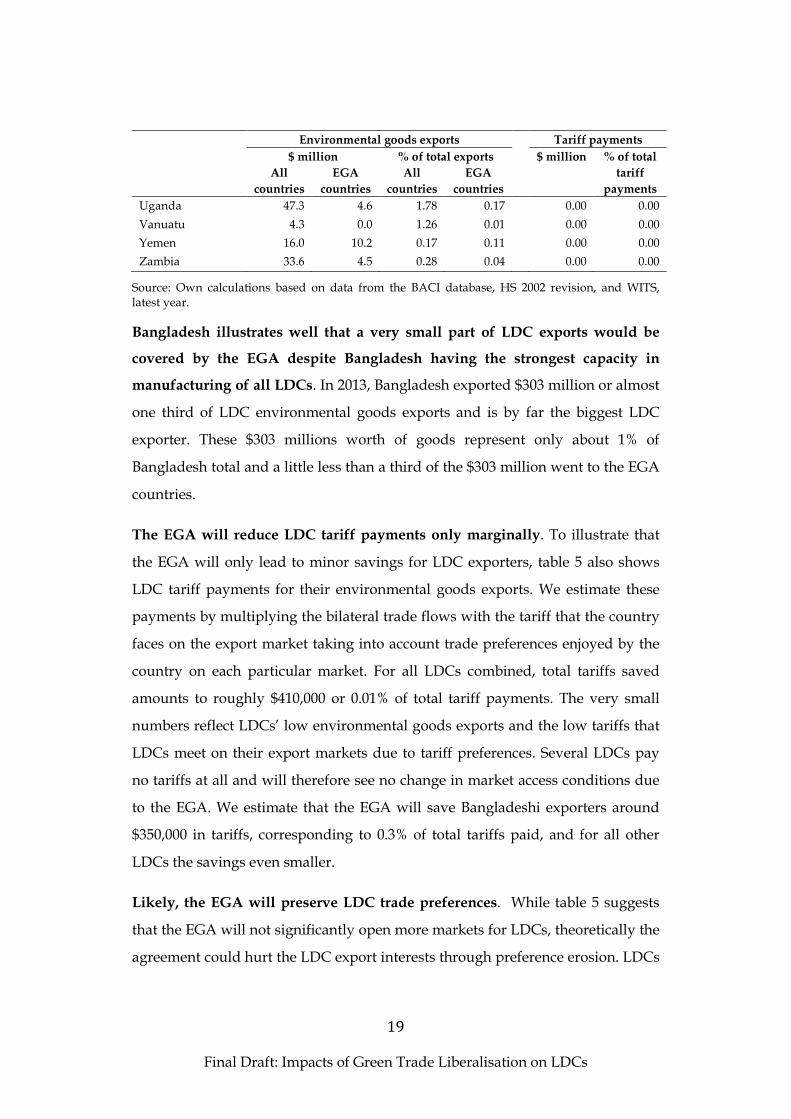
Uganda 47.3 4.6 1.78 0.17 0.00 0.00
Vanuatu 4.3 0.0 1.26 0.01 0.00 0.00
Yemen 16.0 10.2 0.17 0.11 0.00 0.00
Zambia 33.6 4.5 0.28 0.04 0.00 0.00
Source: Own calculations based on data from the BACI database, HS 2002 revision, and WITS, latest year.
Bangladesh illustrates well that a very small part of LDC exports would be
covered by the EGA despite Bangladesh having the strongest capacity in
manufacturing of all LDCs. In 2013, Bangladesh exported $303 million or almost
one third of LDC environmental goods exports and is by far the biggest LDC
exporter. These $303 millions worth of goods represent only about 1% of
Bangladesh total and a little less than a third of the $303 million went to the EGA
countries.
The EGA will reduce LDC tariff payments only marginally. To illustrate that
the EGA will only lead to minor savings for LDC exporters, table 5 also shows
LDC tariff payments for their environmental goods exports. We estimate these
payments by multiplying the bilateral trade flows with the tariff that the country
faces on the export market taking into account trade preferences enjoyed by the
country on each particular market. For all LDCs combined, total tariffs saved
amounts to roughly $410,000 or 0.01% of total tariff payments. The very small
numbers reflect LDCs’ low environmental goods exports and the low tariffs that
LDCs meet on their export markets due to tariff preferences. Several LDCs pay
no tariffs at all and will therefore see no change in market access conditions due
to the EGA. We estimate that the EGA will save Bangladeshi exporters around
$350,000 in tariffs, corresponding to 0.3% of total tariffs paid, and for all other
LDCs the savings even smaller.
Likely, the EGA will preserve LDC trade preferences. While table 5 suggests
that the EGA will not significantly open more markets for LDCs, theoretically the
agreement could hurt the LDC export interests through preference erosion. LDCs

Final Draft: Impacts of Green Trade Liberalisation on LDCs
20
enjoy trade preferences in most EGA countries and the tariff reduction that an
EGA will lead to can erode this advantage. But at an average of 3.4% EGA
country tariffs are already low so LDC preferences are weak. Furthermore, LDC
and non-LDC exporters seem to compete in different markets. Higher income
countries export mainly renewable energy and wastewater management
technologies, while LDCs export mostly EPPs.
Our conclusions on LDC export interests are sensitive to the choice of goods to
liberalise in the final agreement. The negotiators keep the list of products they
discuss secret. Yet, by searching through our “best guess” base list of
environmental goods and the broader list of potential environmental goods from
the literature, we can identify the specific products with the largest potential
export interest among LDCs.
LDC export interests are highly concentrated implying that their small market
access benefits will be even smaller if negotiators exclude a few products from
liberalisation. On our base list of 171 HS6 product categories, just five categories
represent 55% of all environmental goods exported by LDCs to the EGA
countries, and a select few LDCs cover the bulk of exports. Table 6 lists these five
products and the most important exporters2. Two of the five products, jute (HS
530310) and sacks and bags made from jute (HS 630510) constitute 21% of LDC
exports covered by the base list. They are the most prominent examples of EPPs
on the list, but sources close to the negotiation say that these product categories
will not be part of the final agreement. The product category “Mirrors, prisms
and lenses (HS 900190)” is usually qualified by an ex-out identifying only
specialized “fresnel and parabolic mirrors” used to concentrate sun light in solar
power plants, while simpler mirrors, prisms and lenses will be excluded. While
the data do not allow the precise identification of LDC exports, they likely do not
2 We have also conducted the same analysis at the 4-digit level. In some product categories, the 6-digit categories are relatively detailed. For example, HS 8411, Other gas turbines includes HS 841181, gas turbines ≤ 5000 KW, and HS 841182, gas turbines > 5000 KW. The analysis at the 4-digit level aggregates such products to more concentrated categories. The 4-digit analysis generates the exact same picture as the 6-digit analysis, suggesting that LDC exports is indeed concentrated on a relatively few 6-digit product categories.
Final Draft: Impacts of Green Trade Liberalisation on LDCs
21
export the high-tech varieties covered by the EGA. Similar concerns could be
attached to HS 901580 covering specialized instruments and appliances for
measuring the ozone layer and monitoring the risk of earthquake, tsunamis and
cyclones.
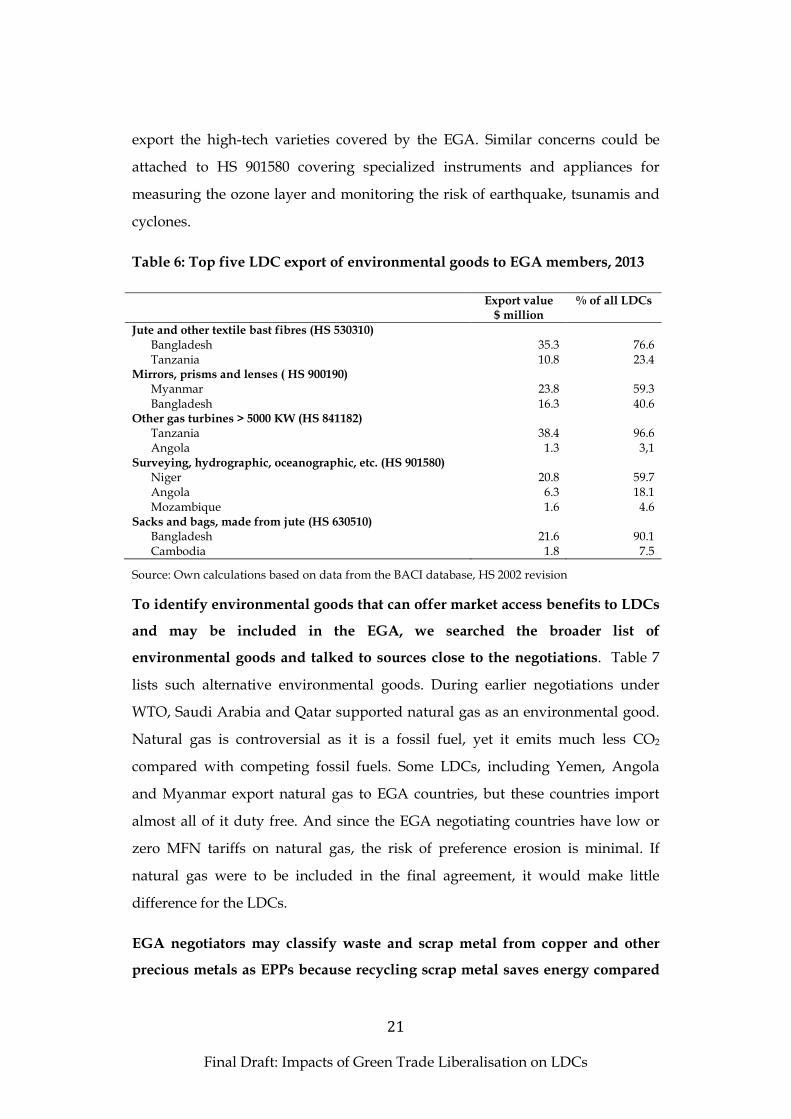
Table 6: Top five LDC export of environmental goods to EGA members, 2013
Export value $ million
% of all LDCs
Jute and other textile bast fibres (HS 530310) Bangladesh 35.3 76.6 Tanzania 10.8 23.4
Mirrors, prisms and lenses ( HS 900190) Myanmar 23.8 59.3 Bangladesh 16.3 40.6
Other gas turbines > 5000 KW (HS 841182) Tanzania 38.4 96.6 Angola 1.3 3,1
Surveying, hydrographic, oceanographic, etc. (HS 901580) Niger 20.8 59.7 Angola 6.3 18.1 Mozambique 1.6 4.6
Sacks and bags, made from jute (HS 630510) Bangladesh 21.6 90.1 Cambodia 1.8 7.5
Source: Own calculations based on data from the BACI database, HS 2002 revision
To identify environmental goods that can offer market access benefits to LDCs
and may be included in the EGA, we searched the broader list of
environmental goods and talked to sources close to the negotiations. Table 7
lists such alternative environmental goods. During earlier negotiations under
WTO, Saudi Arabia and Qatar supported natural gas as an environmental good.
Natural gas is controversial as it is a fossil fuel, yet it emits much less CO2
compared with competing fossil fuels. Some LDCs, including Yemen, Angola
and Myanmar export natural gas to EGA countries, but these countries import
almost all of it duty free. And since the EGA negotiating countries have low or
zero MFN tariffs on natural gas, the risk of preference erosion is minimal. If
natural gas were to be included in the final agreement, it would make little
difference for the LDCs.
EGA negotiators may classify waste and scrap metal from copper and other
precious metals as EPPs because recycling scrap metal saves energy compared
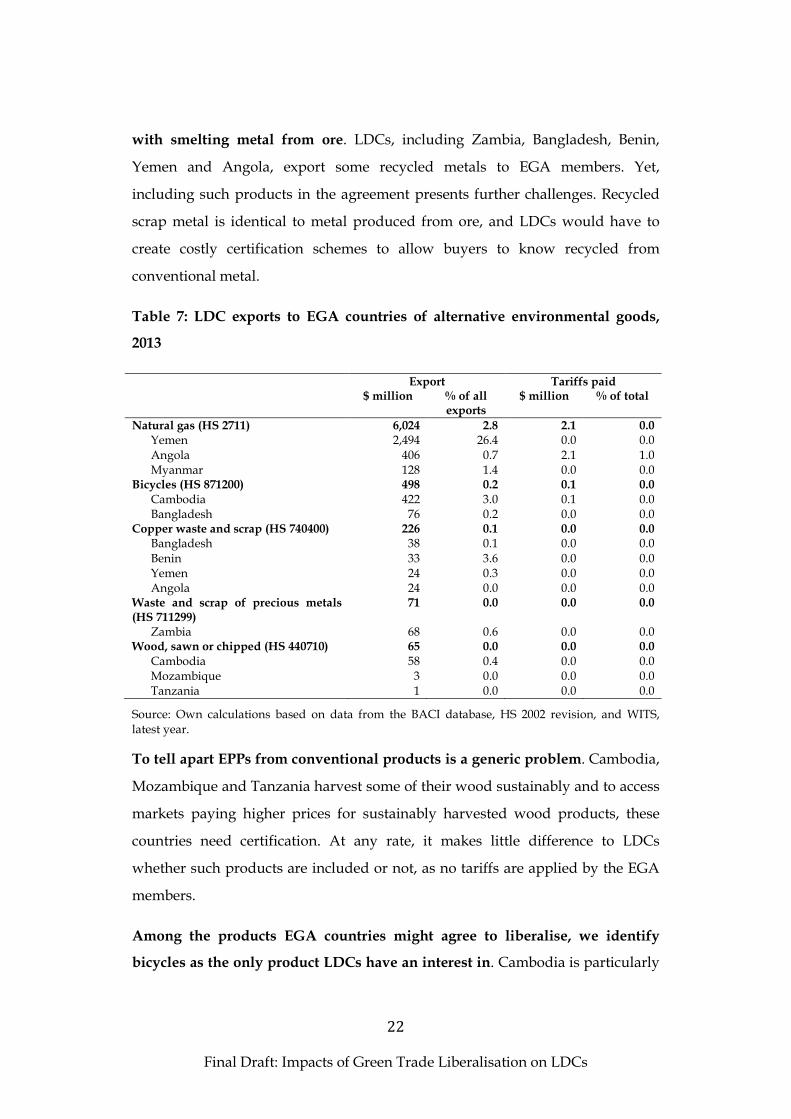
Final Draft: Impacts of Green Trade Liberalisation on LDCs
22
with smelting metal from ore. LDCs, including Zambia, Bangladesh, Benin,
Yemen and Angola, export some recycled metals to EGA members. Yet,
including such products in the agreement presents further challenges. Recycled
scrap metal is identical to metal produced from ore, and LDCs would have to
create costly certification schemes to allow buyers to know recycled from
conventional metal.
Table 7: LDC exports to EGA countries of alternative environmental goods,
2013
Export Tariffs paid $ million % of all
exports $ million % of total
Natural gas (HS 2711) 6,024 2.8 2.1 0.0 Yemen 2,494 26.4 0.0 0.0 Angola 406 0.7 2.1 1.0 Myanmar 128 1.4 0.0 0.0
Bicycles (HS 871200) 498 0.2 0.1 0.0 Cambodia 422 3.0 0.1 0.0 Bangladesh 76 0.2 0.0 0.0
Copper waste and scrap (HS 740400) 226 0.1 0.0 0.0 Bangladesh 38 0.1 0.0 0.0 Benin 33 3.6 0.0 0.0 Yemen 24 0.3 0.0 0.0 Angola 24 0.0 0.0 0.0
Waste and scrap of precious metals (HS 711299)
71 0.0 0.0 0.0
Zambia 68 0.6 0.0 0.0 Wood, sawn or chipped (HS 440710) 65 0.0 0.0 0.0
Cambodia 58 0.4 0.0 0.0 Mozambique 3 0.0 0.0 0.0 Tanzania 1 0.0 0.0 0.0
Source: Own calculations based on data from the BACI database, HS 2002 revision, and WITS, latest year.
To tell apart EPPs from conventional products is a generic problem. Cambodia,
Mozambique and Tanzania harvest some of their wood sustainably and to access
markets paying higher prices for sustainably harvested wood products, these
countries need certification. At any rate, it makes little difference to LDCs
whether such products are included or not, as no tariffs are applied by the EGA
members.
Among the products EGA countries might agree to liberalise, we identify
bicycles as the only product LDCs have an interest in. Cambodia is particularly

Final Draft: Impacts of Green Trade Liberalisation on LDCs
23
strong and in 2013 exported $422 million worth of bicycles, of which 87% went to
the EU. This trade is roughly half the size of the total LDC environmental goods
exports as defined on our “best guess” base list. Bangladesh’s bicycle export adds
another $76 million, almost exclusively to the EU. These two countries are the
second and third largest exporters of bicycles to the EU after Taiwan. However,
due to already existing trade preferences, bicycle exports from LDCs can already
enter the EU duty free. Thus, while including bicycles in the EGA will have little
positive effect for Cambodia and Bangladesh, there is a risk that it could erode
their preferences. The EU imposes MFN tariffs of 14-15% on bicycles and
eliminating this would make the $800 million exports from Taiwan even more
competitive, at the expense of Cambodian and Bangladeshi exporters.
Besides the products listed in table 7, sources close to the negotiations have
mentioned biodiesel as a potential product of LDC interest. However,
according to Comtrade data, LDCs does not export biodiesel. Therefore biodiesel
is not included in the table.
Other studies analysing the EGA negotiations share our conclusion that LDCs
export very few environmental goods but some studies disagree. Wu (2014)
exemplifies those that agree with us. He finds that developing countries as a
group have little to gain from the EGA because they export few environmental
goods and other trading arrangements, like preferential trade agreements and
the APEC initiative, already covers most of the few environmental goods that
they do export. Furthermore, developing countries will benefit from market
openings anyway because EGA countries will liberalise using the MFN principle.
Other studies that find that developing countries in general or LDCs in particular
have few export interests in environmental goods include ICTSD (2008, 2009).
Like us, ICTSD (2009) argues that green technologies are primarily produced by
high and larger middle-income countries.
Instead, UNCTAD (2005) and Hamwey (2005) argue that developing countries
including low income countries and LDCs have strong interests in certain
environmental goods. In particular, these two papers argue that developing

Final Draft: Impacts of Green Trade Liberalisation on LDCs
24
countries at all development levels have large trade surpluses in EPPs, thus they
would benefit if tariffs are cut for these products. But Hamwey (2005) and
UNCTAD (2005) define EPPs so broadly that they become politically irrelevant
for the EGA negotiations. For example, they define cotton and all cotton-based
garments as EPPs, presumably because they view cotton as more sustainable
than synthetic fibres. Cotton may or may not always be environmentally
preferable, nevertheless the negotiating parties are extremely unlikely to accept
large categories like cotton and cotton products to be defined as environmental
goods, even if in the future the EGA countries start to discuss agricultural goods.
3.1.2 Accessing global value chains for environmental goods
Over the past quarter century, global value chains govern an increasing share
of the fast growing global trade. In such chains, the production is fragmented
and trade in intermediaries is very common. A central actor – typically a
multinational firm or a large retailer – organizes production. A paper published
by the IMF finds that global value chains create ever more of world income in
both industry and services. Trade in intermediaries is now more than two thirds
of total trade. The paper also establishes that if a country has been linked up with
global value chains since the mid-1990s, it tends to grow faster (Saito, Ruta and
Turunen 2013).
Many environmental goods are traded in global value chains. Thus, an LDC
can develop its green exports by integrating in global value chains. Bangladesh,
Laos and Cambodia have already done so in garments. Integrating in
environmental good global value chains allows an LDC to produce intermediary
products while benefitting from the knowledge, marketing skills and finance of
the large players governing the value chains. Global value chains are an entry
point into green exports avoiding having to produce the often technologically
demanding finished environmental goods.
Jha (2009) is one of very few studies that analyse integration in global
environmental goods value chains. He focuses on renewable energy and finds
Final Draft: Impacts of Green Trade Liberalisation on LDCs
25
that among developing countries, only a few middle income countries
participate. His study builds on Vossenaar and Jha (2010a) that identify
intermediary and final products and track how they are traded to identify
developing country participation. China is the world’s biggest exporter of
photovoltaic components and panels for solar energy production and Taiwanese
and Indian exports of these products grow rapidly too. In wind turbines, India is
the third biggest exporter. Brazil, China, India, Korea, Malaysia, Mexico,
Singapore, Taiwan and Thailand export significant quantities of renewable
energy components. But the rest of developing countries including all LDCs are
marginalised in global renewable energy value chains.
A recent study by the International Trade Centre, ITC (2014) reports that the
Philippines has entered the global photovoltaic cells value chain. Exports grew
fast from near-nothing in 2006 to over $1 billion in 2013 (thus largely after Jha
(2009) did his study). This growth is largely attributed to foreign firms, like US
SunPower or Solaria, outsourcing parts of the manufacturing process to the
Philippines. ITC (2014) attributes the Philippine success to the prior existence of
an electronics industry and the supply of skilled labour, in particular a large
number of engineers. LDCs are still not at the level of development that the
Philippines was when it integrated in global environmental goods value chains.
3.1.3 Standards and sustainability criteria
The EGA negotiations focus on tariffs, but some countries wants to include
options for reviewing and expanding the agreement in the future like a review
clause, a work programme or both. Such options might open the agreement to
new products and discipline other policy instruments than tariffs. Standards are
one such policy instrument. Standards are an essential part of many
environmental goods. This is true for high technology components that only fit
with other components if following exacting standards. It is also true for many
EPPs. EPPs must be recognizable by the buyer as being environmentally superior
to other similar appearing products. Therefore, it is often an intrinsic part of an
EPP to define precisely how to distinguish, for example, a biodiesel that benefits

Final Draft: Impacts of Green Trade Liberalisation on LDCs
26
the environment from one that harms it. Sustainability criteria are a type of
standards that are used to establish what constitutes an environmentally friendly
biodiesel. Organic food is another example of an EPP. Naturally, a globally
agreed standard on organic products is needed for organics to be recognized as
an EPP.
Developing countries mistrust including standards in trade and environment
discussions. This scepticism is based on some developing countries’ past
difficulties with complying with standards as for example food safety standards.
Many developing countries have strong export interest in industries where
compliance with standards is a major source of competitiveness. Especially LDCs
have had difficulties (Abiola and Wilson 2004; Jaffee, Henson and Rios 2011;
WTO and OECD 2013).
The inclusion of standards will cause two interrelated sets of problems for
LDCs: standards must be appropriate to LDCs and LDCs will need to
demonstrate compliance. To develop appropriate standards, standard setting
bodies need to include LDCs. But LDCs lack the educated people, technologies
and money to influence international standard setting. The lack of involvement
risks excluding LDC producers if the standards do not acknowledge the often
different production environments that these producers live in. An example is
the setting of carbon labelling standards.
Carbon labelling measures and displays the greenhouse gas emissions that a
product causes. Historically, analysts developed methods to calculate emissions
based on high income countries because their knowledge on actual greenhouse
gas emissions emanating from the varied production system around the world
was very rudimentary in particular in developing countries. A study by Brenton,
Edwards-Jones and Jensen (2010) analysed the consequences of applying a
carbon measurement standard that does not acknowledge the production
environment of an LDC in a case study of Zambian sugar production.

Final Draft: Impacts of Green Trade Liberalisation on LDCs
27
The highest contributor to emissions was the emissions caused by clearing
land for sugar. The burning of a forest to make space for sugar, for example,
emits much more greenhouse gases than the conversion of a wheat field to sugar.
If the use of the land is unknown the standard assumes a worst case scenario
consisting in clearing a virgin rainforest in Malaysia. In Zambia (and many other
LDCs), land use patterns are not always recorded. Thus, in some cases the
standard dictated the addition of an emission factor that would make Zambian
sugar look much worse than high income country sugar. Had Zambia been
involved in setting the standard, the standard might have included a more
accurate way of dealing with the problem of missing land use information.
LDCs lack the capacity in testing and certification to prove compliance with
standards. Generally, LDCs have not developed these trade support services
(Abiola and Wilson 2004). Often, exporters requiring such services must import
them at higher prices than what their higher income country competitors pay for
similar services.
3.2 Access to imports
While trade negotiators typically view access to export markets as their goal
and import liberalization as the price they have to pay to reach that goal,
economic research shows that most of the welfare gains from trade
liberalization come from the improved access to imports. Gains from imports
include both static gains occurring when the benefits to consumers from lower
import prices outweigh the costs to import competing producers and dynamic
gains from higher productivity and technology transfer.
For LDCs, the transfer of technology is very important. Eaton and Kortum
(1996) demonstrated that for all countries but the technological front runners
(United States, Japan, Germany, France and Britain), more than 90% of the
economic growth arising from technological innovation is based on imported
technologies.

Final Draft: Impacts of Green Trade Liberalisation on LDCs
28
3.2.1 Promoting access to environmental technology through the EGA
LDCs demand many environmental technologies and reducing the price of this
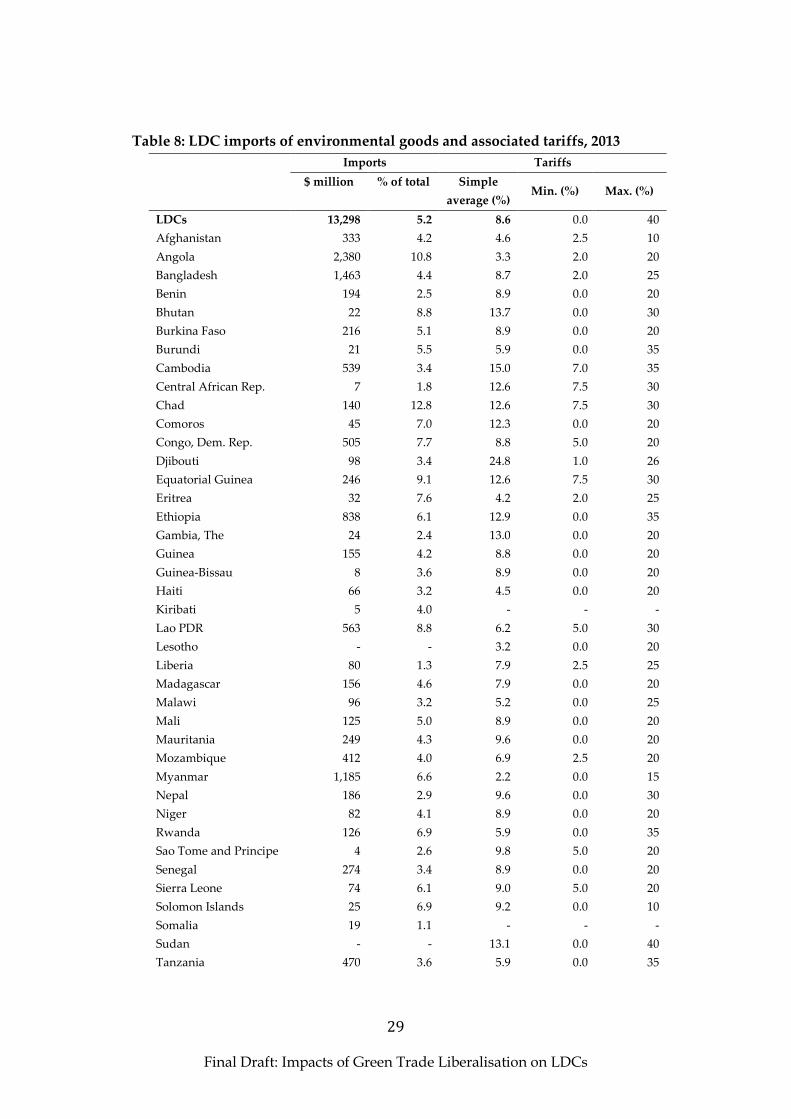
technology will ease its adoption. Table 8 presents LDC imports of
environmental goods and the associated tariffs; information that we use to
discuss how much liberalisation may ease the adoption of technology. Imports
are measured in millions of dollars and as a share of total imports to illustrate the
relative importance of environmental goods. Applied tariffs are presented as
simple averages, along with the minimum and maximum.
LDCs import more environmental goods than they export, around $13 billion
of imports compared to less than $1 billion in exports. This trade pattern
reflects the high-technology nature of most environmental goods. On average,
roughly 5% of total LDC imports are of environmental goods, close to the global
average of 6%. Among the LDCs, Bangladesh, Angola and Myanmar are the
largest environmental goods importers in absolute terms, partly reflecting the
size of the economies, but Chad shows the greatest environmental goods imports
relative to total imports of almost 13%.
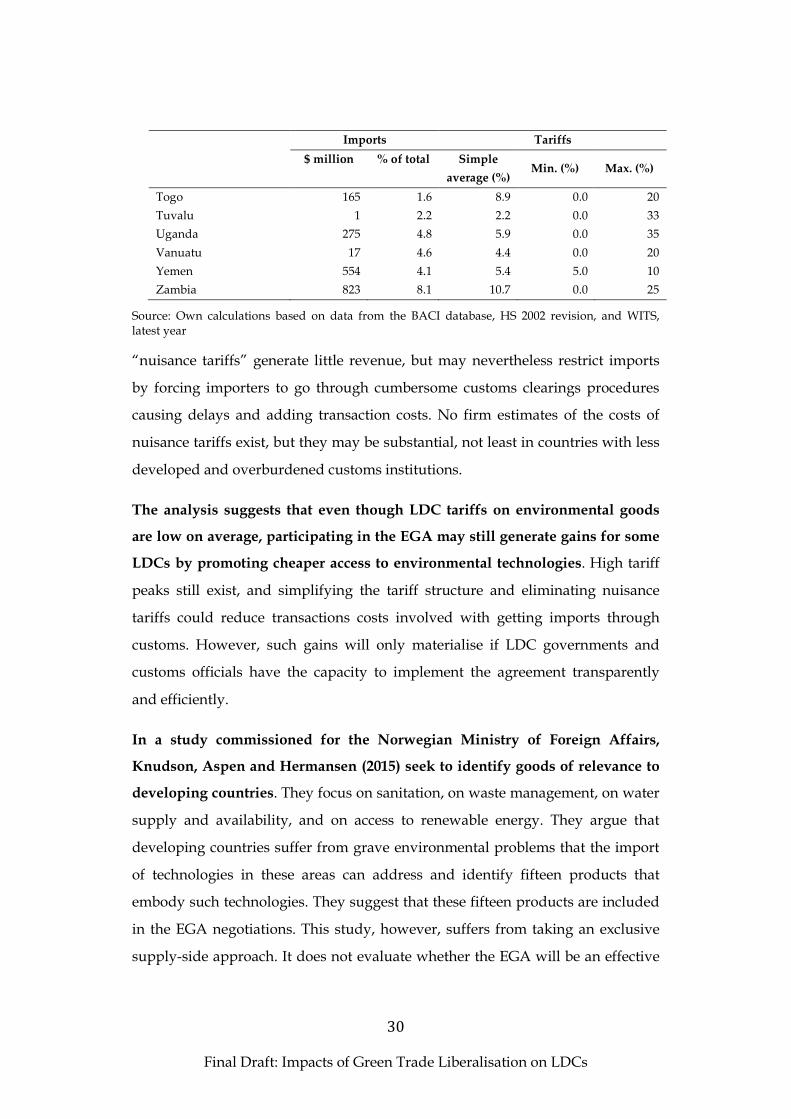
Tariffs on environmental goods are moderate in most cases – around 8.6% on
average for all LDCs as a group. However, tariffs vary between countries. 11
countries have average tariffs of more than 10%, 25 countries of between 5% and
10% and 8 countries of less than 5%. Djibouti has the highest average tariffs with
24,8% and Myanmar and Tuvalu the lowest with 2.2%.
Tariff peaks are considerable in most countries. Sudan has the highest tariffs on
any environmental good in an LDC of 40%. 15 LDCs have tariff peaks of more
than 25%, 26 countries of between 10% and 25% and only 3 countries, namely
Afghanistan, Solomon Island and Yemen, of 10%
Low but positive tariffs may also distort trade. Several countries have minimum
tariffs, which are small but strictly positive. Angola, Bangladesh and Eritrea
apply tariffs as low as 2% and the minimum tariff rate in Djibouti is just 1%. Such
Final Draft: Impacts of Green Trade Liberalisation on LDCs
29
Table 8: LDC imports of environmental goods and associated tariffs, 2013
Imports Tariffs
$ million % of total Simple
average (%) Min. (%) Max. (%)
LDCs 13,298 5.2 8.6 0.0 40
Afghanistan 333 4.2 4.6 2.5 10
Angola 2,380 10.8 3.3 2.0 20
Bangladesh 1,463 4.4 8.7 2.0 25
Benin 194 2.5 8.9 0.0 20
Bhutan 22 8.8 13.7 0.0 30
Burkina Faso 216 5.1 8.9 0.0 20
Burundi 21 5.5 5.9 0.0 35
Cambodia 539 3.4 15.0 7.0 35
Central African Rep. 7 1.8 12.6 7.5 30
Chad 140 12.8 12.6 7.5 30
Comoros 45 7.0 12.3 0.0 20
Congo, Dem. Rep. 505 7.7 8.8 5.0 20
Djibouti 98 3.4 24.8 1.0 26
Equatorial Guinea 246 9.1 12.6 7.5 30
Eritrea 32 7.6 4.2 2.0 25
Ethiopia 838 6.1 12.9 0.0 35
Gambia, The 24 2.4 13.0 0.0 20
Guinea 155 4.2 8.8 0.0 20
Guinea-Bissau 8 3.6 8.9 0.0 20
Haiti 66 3.2 4.5 0.0 20
Kiribati 5 4.0 - - -
Lao PDR 563 8.8 6.2 5.0 30
Lesotho - - 3.2 0.0 20
Liberia 80 1.3 7.9 2.5 25
Madagascar 156 4.6 7.9 0.0 20
Malawi 96 3.2 5.2 0.0 25
Mali 125 5.0 8.9 0.0 20
Mauritania 249 4.3 9.6 0.0 20
Mozambique 412 4.0 6.9 2.5 20
Myanmar 1,185 6.6 2.2 0.0 15
Nepal 186 2.9 9.6 0.0 30
Niger 82 4.1 8.9 0.0 20
Rwanda 126 6.9 5.9 0.0 35
Sao Tome and Principe 4 2.6 9.8 5.0 20
Senegal 274 3.4 8.9 0.0 20
Sierra Leone 74 6.1 9.0 5.0 20
Solomon Islands 25 6.9 9.2 0.0 10
Somalia 19 1.1 - - -
Sudan - - 13.1 0.0 40
Tanzania 470 3.6 5.9 0.0 35
Final Draft: Impacts of Green Trade Liberalisation on LDCs
30
Imports Tariffs
$ million % of total Simple
average (%) Min. (%) Max. (%)
Togo 165 1.6 8.9 0.0 20
Tuvalu 1 2.2 2.2 0.0 33
Uganda 275 4.8 5.9 0.0 35
Vanuatu 17 4.6 4.4 0.0 20
Yemen 554 4.1 5.4 5.0 10
Zambia 823 8.1 10.7 0.0 25
Source: Own calculations based on data from the BACI database, HS 2002 revision, and WITS, latest year
“nuisance tariffs” generate little revenue, but may nevertheless restrict imports
by forcing importers to go through cumbersome customs clearings procedures
causing delays and adding transaction costs. No firm estimates of the costs of
nuisance tariffs exist, but they may be substantial, not least in countries with less
developed and overburdened customs institutions.
The analysis suggests that even though LDC tariffs on environmental goods
are low on average, participating in the EGA may still generate gains for some
LDCs by promoting cheaper access to environmental technologies. High tariff
peaks still exist, and simplifying the tariff structure and eliminating nuisance
tariffs could reduce transactions costs involved with getting imports through
customs. However, such gains will only materialise if LDC governments and
customs officials have the capacity to implement the agreement transparently
and efficiently.
In a study commissioned for the Norwegian Ministry of Foreign Affairs,
Knudson, Aspen and Hermansen (2015) seek to identify goods of relevance to
developing countries. They focus on sanitation, on waste management, on water
supply and availability, and on access to renewable energy. They argue that
developing countries suffer from grave environmental problems that the import
of technologies in these areas can address and identify fifteen products that
embody such technologies. They suggest that these fifteen products are included
in the EGA negotiations. This study, however, suffers from taking an exclusive
supply-side approach. It does not evaluate whether the EGA will be an effective

Final Draft: Impacts of Green Trade Liberalisation on LDCs
31
and efficient means combat the environmental problems that they identify. Our
analysis suggest that in many cases the contribution of tariff liberalisation to the
transfer of technologies discussed by Knudson, Aspen and Hermansen (2015)
will be small because tariffs are mostly moderate.
3.2.2 Technology transfer
Technology transfer has been a hot issue in several negotiations where both
developed and developing countries are involved. The WTO Working Group
on Transfer of Technology was established by the Ministers in Doha and aims to
examine the relationship between trade and the transfer of technology from
developed to developing countries, and ways to increase the flow of technology
to developing countries. Removing tariffs on environmental goods reduces the
price of new technology. But many other factors influence technology transfer.
Therefore the WTO has discussed technology transfer in several forums
including in the Committee on Trade and Environment. Individual WTO
agreements like the TRIPS Agreement also give rise to intense technology
transfer debates. Probably most relevant for the EGA negotiations, the United
Nations Framework Convention on Climate Change (UNFCCC) also work on
technology transfer.
The Conference of the Parties to the UNFCCC established the Technology
Mechanism in 2010. This mechanism – still under development – will deploy
technology to support climate mitigation and adaption activities in developing
countries. Supported activities can be research and development, demonstration,
diffusion and transfer of technology (Blanco, Coninck and Würtenberger 2012).
A study by the Intergovernmental Panel on Climate Change (IPPC) has
identified potential constraints to technology transfer. The constraints
identified by the study are shown in Box 2. Such constraints are confirmed and

Final Draft: Impacts of Green Trade Liberalisation on LDCs
32
elaborated upon throughout the very large literature that exists on technology
transfer to developing countries3.
Box 2. Potential constraints to technology transfer � Lack of full-cost pricing, which internalises environmental and social costs; � Poor macroeconomic conditions, which could include underdeveloped financial sector, high
import duties, high or uncertain inflation or interest rates, uncertain stability of tax and tariff policies, investment risk;
� Low private sector involvement because of lack of access to capital, in particular inadequate financial strength of smaller firms;
� Lack of financial institutions or systems to ensure initial investments for the utilisation and extended use of transferred technologies;
� Low, often subsidised conventional energy prices resulting in negative incentives to adopt energy saving measures and renewable energy technologies;
� Lack of markets for environmental goods and technologies because of lack of confidence in economic, commercial or technical viability, lack of manufacturers, lack of consumer awareness and acceptance of technologies;
� Lack of supporting legal institutions and frameworks, including codes and standards for the evaluation and implementation of environmentally sound technologies;
� Lack of understanding of the role of developed and developing countries and international institutions in the failures and successes of past technology cooperation;
� General lack of support for an open and transparent international banking and trading system; � Institutional corruption in both developed and developing countries; � Reluctance to identify and make available environmental goods and technologies that are in the
public domain; � Insufficient human and institutional capabilities; � Inadequate vision about and understanding of local needs and demands; � Inability to assess, select, import, develop and adapt appropriate technologies; � Lack of data, information, knowledge and awareness, especially on "emerging" technologies; � Lack of confidence in unproven technologies; � Risk aversion and business practices that favour large projects in financial institutions including
development banks; � Lack of science, engineering and technical knowledge available to private industry; � Insufficient research and development because of lack of investments in research and
development and inadequate science and educational infrastructure; � Inadequate resources for project implementation; � High transaction costs; � Lack of access to relevant and credible information on potential partners to allow for the timely
formation of effective relationships that could enhance the spread of environmental goods and technologies.
Source: IPPC (2000).
3 For a couple of newer overview studies containing many case studies, see Ockwell and Mallet 2012 and Haselip et al. (2011).
Final Draft: Impacts of Green Trade Liberalisation on LDCs
33
Examples of typical LDC problems include the lack of an enabling
environment, poorly developed financial institutions, and distorted prices.
Many environmental technologies like hydro power require an enabling
environment with laws conducive to foreign investment and standards that
allow for the interoperability of the different components of a network, like an
electrical grid. Many technologies are large scale and must be funded which
require a welcoming attitude and a regulatory framework that allow for foreign
direct investment. Capital to finance the investment is often scarce and
expensive. In rural areas, capital even for small scale investment like household
solar panels allowing access to electricity without connections to the national
grid may be altogether absent.
Energy prices are often subsidized which threatens the private profitability of
investments in clean energy that are socially profitable. Two sector studies
discuss non-tariff barriers relative to tariffs specifically for renewable energy that
is a key sector in the EGA negotiations. Jha (2009) found that subsidies and other
incentives explain more of increased imports of renewable energy equipment
than tariffs. Jha (2009) also observed that access to finance including venture
capital and supportive policies including energy regulations, feed-in tariffs and
concessionary loans all help establish a well-functioning market for renewable
energy. Kirkegaard, Hanemann and Weischer (2009) study the wind energy
industry and conclude that global integration of the industry is held back more
by formal and informal non-tariff barriers distorting investments than tariffs.
3.3 SDT and A4T
The Uruguay Round included articles on Special and Differential Treatment
(SDT) for developing countries in every agreement. SDT is also a major issue in
the negotiations under the UNFCCC. The strong tradition for offering lenient
terms to developing countries also influences the EGA negotiations. Sources
close to the EGA negotiations report that developing countries like China seek
SDT especially longer implementation periods for tariff reductions. However,
high income countries are very reluctant to include SDT in the EGA negotiations

Final Draft: Impacts of Green Trade Liberalisation on LDCs
34
likely because environmental goods are primarily produced by relatively strong
firms in middle income countries that compete with high income country firms.
WTO practice allows for the possibility of differentiating in favour of LDCs.
In fact, this is the only possibility beyond differentiating in favour of the full
group of developing countries. However, EGA negotiators have not discussed
that possibility because no LDCs have expressed interest in the negotiations.
Another way of favouring developing countries in general and LDCs in
particular is to offer development assistance to build capacity to exploit the
benefits of trade potentially offered by trade agreements. Such assistance for
trade is called Aid-for-Trade or A4T. EGA negotiators have not discussed A4T in
detail, but A4T has been a major issue in the parallel UMFCCC negotiations.
However, developed and developing countries remain far apart (Diringer 2009).
China and the principal group of developing countries including many LDCs the
G77 have proposed that developed countries finance the development and
adoption of new technology in developing countries with initiatives ranging
from basic research to factory building. Developed country, however, are very
reluctant to commit themselves to the high financial outlays and the risk of
financially supporting future competitors.
3.4 Policy space
The issue of policy space has been one of the most contentious issues in WTO
debates. UNCTAD (2004) defines policy space as the scope for domestic policies
to pursue development, especially in the areas of trade, investment and
industrial development. Whether policy space is desirable depends on ones view
on the development process. Advocates of a liberal perspective view policy space
arguments as excuses for protectionism while believers in the merits of more
government intervention view policy space as the liberty of developing countries
to apply a necessary set of instruments to overcome competitive disadvantages
of a new industry. These instruments could include tariff protection and local
content requirements contradicting WTO law.
Final Draft: Impacts of Green Trade Liberalisation on LDCs
35
Policy space is a topic in green liberalisation discussions. China, for example,
refers to its developing country status when arguing for its right to apply
industrial policy. Middle income countries not part of the EGA negotiations, like
Brazil for wind turbines and India for solar panels, use tariffs to pursue
industrial policy targeting the development of national industries (Vossenaar
and Jha 2010). During fieldwork for this paper, the authors discussed industrial
policy with the Thai WTO representation that does not participate in the EGA
negotiations. Thailand wanted to protect its renewable energy industry. It should
be noted that for many environmental goods, in particular for renewable energy,
high income countries apply very active industrial policy although rarely tariff
protection but subsidies and support to research and development.
LDCs appear to be in a different situation than the middle income countries
that are currently arguing for policy space for environmental goods. LDCs are
not strong manufacturing nations and none of them has environmental good
industries they would want to protect. New environmental good industries will
most likely target exports as LDC home markets are very small. An emerging
environmental good industry would initially be based on assembly, thus
requiring the import of components that would have to enter at low tariffs. The
tariff protection instrument – the use of which a future EGA would discipline -
would be an ineffective policy instrument.
3.5 Tariff revenue
Import tariffs are an important source of public revenue in most LDCs,
especially those with few natural resources. It is easier to tax imports at the few
ports or border crossings than to tax incomes or turnover through more
decentralized income taxes and VAT. Table 9 estimates the tariff revenue of LDC
imports of environmental goods. We do not have data on collected revenue, but
estimate revenue by multiplying imports of every good from every country of
origin with the corresponding tariff rate.

Final Draft: Impacts of Green Trade Liberalisation on LDCs
36
The total estimated loss of tariff revenue for all LDCs combined amount to
roughly $855 million, corresponding to nearly 4% of total tariff revenue. The
countries with the largest losses in absolute numbers are Bangladesh, Angola and
Ethiopia due to their larger economies and higher-than-average environmental
goods imports, and Cambodia due to its high tariffs on environmental goods.
The shares of environmental goods tariffs are low in most countries, with 12
LDCs earning less than 3% of the total tariff revenue from environmental goods
and 24 countries earning between 3% and 7%. Six LDCs, however, earn more
than 7% on environmental goods with the Comoros, Chad and the Solomon
Islands having the largest shares of, respectively, 11.8, 10.0 and 9.3%.
For most LDCs, the numbers do not appear large if compared with other trade
reforms. For example, Fontagne et al. (2008) estimate that the EPAs between the
EU and six ACP regions could result in losses of tariff revenue ranging from 5.7%
to almost 44% of total tariff revenue for some LDCs. Also, the estimates in table 9
should be viewed as upper limits of the expected effects as we cannot account for
the ex-outs specified under each HS6 category.
Table 9: Estimated tariff revenue from imports of environmental goods, 2013
Tariff revenue Tariff revenue Country $ million % of
total tariff
revenue
Country $ million % of total tariff
revenue
LDCs 855.0 3.9 Liberia 5.2 0.9
Afghanistan 12.7 2.8 Madagascar 11.4 5.3
Angola 75.8 4.9 Malawi 3.0 2.4
Bangladesh 101.7 2.7 Mali 9.6 4.7
Benin 17.6 1.8 Mauritania 22.1 4.0
Bhutan 2.5 6.7 Mozambique 17.5 4.1
Burkina Faso 18.0 6.5 Myanmar 24.5 2.7
Burundi 1.2 5.6 Nepal 17.0 2.5
Cambodia 67.2 5.3 Niger 6.0 3.1
Central African Rep. 0.8 1.6 Rwanda 6.2 4.0
Chad 16.6 10.0 Sao Tome and Princip. 0.4 3.4
Comoros 6.8 11.8 Senegal 22.5 3.9
Congo, Dem. Rep. 44.9 6.2 Sierra Leone 6.0 5.2
Djibouti 29.9 1.5 Solomon Islands 1.9 9.3
Equatorial Guinea 29.3 7.5 Somalia - -
Eritrea 1.6 7.1 Sudan - -
Ethiopia 76.0 5.3 Tanzania 37.8 4.6
Gambia, The 4.5 3.2 Togo 14.9 2.3

Final Draft: Impacts of Green Trade Liberalisation on LDCs
37
Tariff revenue Tariff revenue Country $ million % of
total tariff
revenue
Country $ million % of total tariff
revenue
Guinea 14.8 3.9 Tuvalu 0.0 1.2
Guinea-Bissau 0.7 3.0 Uganda 10.3 2.4
Haiti 4.0 3.1 Vanuatu 2.4 4.9
Kiribati - - Yemen 26.5 5.3
Lao PDR 30.3 6.0 Zambia 52.8 9.9
Lesotho - -
Source: Own calculations based on data from the BACI database, HS 2002 revision, and WITS, latest year.
3.6 Implementation costs
During the Uruguay Round, developing country undertook an unprecedented
number of commitments, some of which proved much more costly to
implement than foreseen. Ever since, LDCs have been understandingly worried
over the potential costs of new commitments.
Prior to the Uruguay Round, the implementation costs of trade agreements
were small because liberalising trade consisted mainly of general cuts in
tariffs and the removal of quantitative restrictions. The Uruguay Round
introduced regulation on many beyond-the-border issues that required deep
institutional reforms. This regulation was articulated in the SPS and TBT
Agreements, the TRIPS Agreement, the Custom Valuation Agreement and
several other agreements. Finger and Schuler (2000) have estimated that full
implementation of the Uruguay Round commitments in such agreements would
costs many LDCs the equivalent of a full year’s development budget (Finger and
Schuler 2000). LDC scepticism towards such agreements have been heightened
by the fact that this type of agreement has to a large extent been included
following pressure from high income countries with little input from LDCs in the
negotiation of these agreements. Thus, LDC saw little need for these agreements
and had little voice in their design, but had to carry the full costs of their
implementation.
Final Draft: Impacts of Green Trade Liberalisation on LDCs
38
The EGA will require changes in customs procedures because the Harmonized
System used to classify goods for customs purposes does not allow customs
officials to properly identify environmental goods. The HS only standardizes
products to the six digit level meaning that broad categories of goods are lumped
together in aggregate categories including both environmental goods and
conventional products.
The EGA negotiators discuss two approaches to the problem presented by the
current HS system. Either to identify so-called “ex outs” that is individual
environmental goods which must be separated from similar products without
green credentials by reforming the HS codes thus creating internationally
harmonized codes at a higher level than the current six digits. Or to adopt a more
pragmatic approach and allow goods that are not environmental goods to be
liberalised alongside environmental goods through the liberalisation of entire HS
six digit level categories. The choice is between on one side the environmental
credibility of an EGA and on the other ease of implementation. Reforming the HS
system will lead to implementation costs of the EGA. Too many ex outs, and the
difficulties of reforming customs procedures will increase.
Many LDCs have reformed customs procedures over the two latest decades
and the trend has been toward customs simplification. LDCs have historically
applied complex tariff schedules with highly variable tariffs for different
products. The many different tariff levels have caused confusion for traders and
been the basis for extended negotiations between customs officials and traders on
how to classify goods. Customs simplification has aimed to reduce the multitude
of different tariff levels and replace them with a few broad bands.
Zake (2011) finds that most African countries have rationalized, simplified and
reduced the number of tariff bands. Tanzania exemplifies this approach. Prior
to the establishment of the East African Customs Union of which Tanzania is a
part today, Tanzania had reduced its tariff structure to five bands, namely 0, 5,
10, 20 and 35%. The formation of the East African Customs Union reduced the
number of bands even further to three, namely 0%, 10% and 25%.

Final Draft: Impacts of Green Trade Liberalisation on LDCs
39
LDCs could worry that an EGA and especially an EGA with many ex outs
would threaten the gains already made through customs simplification. A
complicated EGA would remove tariffs on specific products while leaving others
at their historical levels and therefore increase the complexity of the tariff
schedule.
3.7 Green protectionism
Developing countries including LDCs often look with suspicion to linking of
trade and environment fearing that environmental concerns will be misused as
green protectionism. LDCs may be worried that the EGA distinguishes between
green goods and conventional ones and grants the first ones the best treatment.
Developing countries including the LDCs have traditionally opposed ideas of
distinguishing products by environmentally defined production methods. In the
discussion of green liberalisation in the WTO Trade and Environment
Committee, many developing countries did not submit lists of environmental
goods because they were opposed to the idea of distinguishing between products
on the basis of their production methods. They fear that even if an agreement of
the liberalisation of environmental goods could be written in a way that
accommodates their fears of green protectionism, the mere acknowledgement of
the principle of differentiation on the basis of production methods could be used
in other negotiations areas. LDCs likely fear that high income countries would
hinder their imports because of the generally poor environmental conditions in
LDCs (Howse and van Bork 2006). LDCs may face a difficult choice of viewing
EPPs as examples of the differentiation between products on the basis of
production methods against which they have been strongly opposed historically
or as opportunities for the valuation of the environmental characteristics of parts
of their export portfolio. Hamwey (2005) argues LDCs’ potential for exporting
environmental goods is based on EPPs.
Final Draft: Impacts of Green Trade Liberalisation on LDCs
40
4. How the Environmental Goods Agreement may impact Myanmar
Myanmar is a country with 53 million inhabitants neighbouring Bangladesh
and India to the North West, China to the North East, Laos and Thailand to the
East and with a long coastline bordering the Andaman Sea to the South.
Myanmar is only just opening up after a prolonged period of political and
economic isolation that ended after a series of political reforms were enacted
during 2011-12. The opening has spurred a process of economic growth and
restructuring that begins to change Myanmar society.
Incomes are much lower than in the countries currently negotiation the EGA
agreement. The average Myanmar citizen earns $1,270 yearly4 while that average
for the negotiating parties is almost 20 times as high, e.g. about $23,000; ranging
from Norway’s $103,050 to China’s $7,3805. The low income of Myanmar is a
good indicator that the economic structure of the country is radically different
from the one found in the negotiating parties. Myanmar exports primarily
natural gas, mineral products, food and garments with virtually no domestic
production of the advanced technologies that constitute nearly all the
environmental goods discussed in the EGA negotiations.
We visited Myanmar from August 16th to 23rd 2015 to conduct a case study on
how the EGA will impact the country. Our general analysis of LDCs did not
identify an LDC likely to be strongly affected – positively or negatively – by the
EGA. We chose Myanmar as our case because of its location in dynamic South
East Asia that lead us to suspect that Myanmar is one of the LDCs most likely to
benefit from global environmental goods value chains. We hypothesized that
such value chains will benefit from Myanmar’s abundance of cheap labour. Thus
Myanmar might reap benefits from the EGA on the export side if it becomes a
supplier of environmental goods components. On the import side, Myanmar
needs access to green technology to combat environmental problems and to
develop its energy sector. Among the LDCs, Myanmar has some of the lowest
4 Measured as Gross National Income (GNI) per capita. 5 Calculated from the World Bank databank (databank.worldbank.org) using figures for 2014.

Final Draft: Impacts of Green Trade Liberalisation on LDCs
41
tariffs for imports of environmental goods with an average tariff of 2.2% and
maximum tariffs of 15.0%. Yet the complex import regime of Myanmar gives
reason to believe that non-tariff measures are substantial. In our case study, we
focus on four issues: market access, access to imports, tariff revenue and
implementation costs.
4.1 Market access
4.1.1 Myanmar exports of environmental goods
Myanmar’s exports of environmental goods are very small. In 2013, Myanmar
exported only $36.4 million worth of environmental goods including $26.2
millions’ worth for countries participating in the EGA negotiations (primarily
China) as illustrated in table 10. These values correspond to 0.39% and 0.28% of
Myanmar’s total exports. But these small numbers may be vastly exaggerated.
Most of the exports of environmental goods reported here (roughly 85%) is under
the category, “HS 900190: Mirrors, prisms and lenses”. Likely, an ex-out will
detail that only “Fresnel and parabolic mirrors” used to concentrate sunlight in
solar power plants will be covered by the EGA. To the extent that Myanmar’s
export under category HS 900190 mostly reflects other products under the
product category, such as prisms or standard mirrors, the country’s export of
environmental goods may be far smaller than suggested here.
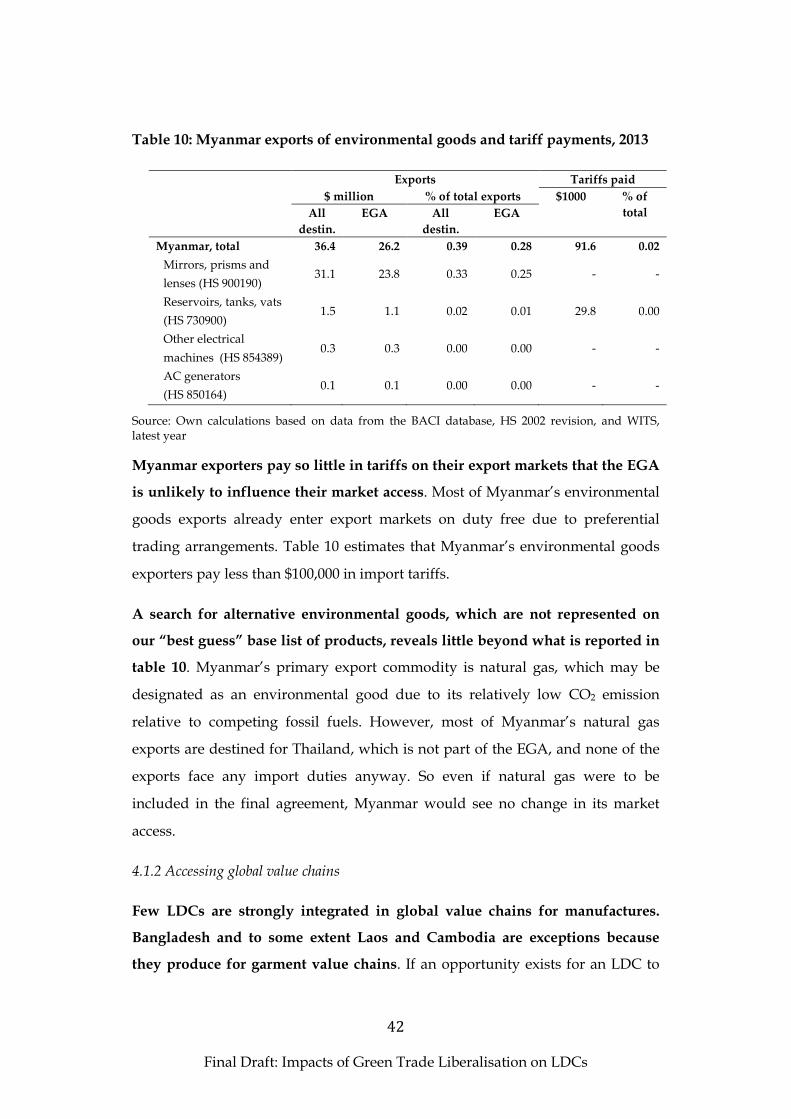
Final Draft: Impacts of Green Trade Liberalisation on LDCs
42
Table 10: Myanmar exports of environmental goods and tariff payments, 2013
Exports Tariffs paid
$ million % of total exports $1000 % of
total All
destin.
EGA All
destin.
EGA
Myanmar, total 36.4 26.2 0.39 0.28 91.6 0.02
Mirrors, prisms and
lenses (HS 900190) 31.1 23.8 0.33 0.25 - -
Reservoirs, tanks, vats
(HS 730900) 1.5 1.1 0.02 0.01 29.8 0.00
Other electrical
machines (HS 854389) 0.3 0.3 0.00 0.00 - -
AC generators
(HS 850164) 0.1 0.1 0.00 0.00 - -
Source: Own calculations based on data from the BACI database, HS 2002 revision, and WITS, latest year
Myanmar exporters pay so little in tariffs on their export markets that the EGA
is unlikely to influence their market access. Most of Myanmar’s environmental
goods exports already enter export markets on duty free due to preferential
trading arrangements. Table 10 estimates that Myanmar’s environmental goods
exporters pay less than $100,000 in import tariffs.
A search for alternative environmental goods, which are not represented on
our “best guess” base list of products, reveals little beyond what is reported in
table 10. Myanmar’s primary export commodity is natural gas, which may be
designated as an environmental good due to its relatively low CO2 emission
relative to competing fossil fuels. However, most of Myanmar’s natural gas
exports are destined for Thailand, which is not part of the EGA, and none of the
exports face any import duties anyway. So even if natural gas were to be
included in the final agreement, Myanmar would see no change in its market
access.
4.1.2 Accessing global value chains
Few LDCs are strongly integrated in global value chains for manufactures.
Bangladesh and to some extent Laos and Cambodia are exceptions because
they produce for garment value chains. If an opportunity exists for an LDC to
Final Draft: Impacts of Green Trade Liberalisation on LDCs
43
integrate into global environmental good value chain, it would be a South East
Asian LDC because of the proximity to major industry players in countries like
China and Korea who might want to locate parts of the value chain in an LDC.
Myanmar is not likely to start producing components for global environmental
goods value chains. During fieldwork in Myanmar for this report, no local
production of parts or components for environmental good value chains could be
found. Even relatively simple products like household solar energy stations were
imported assembled and ready to use.
Myanmar is just beginning to integrate into the global garment value chain
(Jensen 2015). The industry has grown fast, doubling in size in about three years
(MGMA 2015). Today, Myanmar exports for about $1.5 billion a year. However,
Myanmar remains a small exporter. Cambodia is about three times bigger,
Vietnam and Bangladesh 10-15 times bigger and China more than 100 times
bigger. The Myanmar garment industry looks towards the global brands that
control the global value chains. The German sportswear brand Adidas has begun
sourcing Myanmar garments and San Francisco-based GAP has announced it
will buy from a South Korean firm owning factories in Myanmar. The brands
only put technologically simple activities in Myanmar. Myanmar produces “cut,
make and pack” garments, where the producer receives all materials (fabric,
buttons, thread, etc.) and patterns from the buyer, produces according to the
patterns and pack the garment for export. The level of technological
sophistication displayed in such production is not yet sufficient to attract
investors interested in the production of environmental goods.
4.1.3 Standards and sustainability criteria
The Myanmar capacity to influence international standard setting and to
certify compliance is very low (Jensen 2015). This lack of capacity can diminish
Myanmar’s ability to export EPPs under the EGA should Myanmar choose to join
and should the right EPPs become recognized as environmental goods in the
EGA.
Final Draft: Impacts of Green Trade Liberalisation on LDCs
44
APEC discussed potential EPPs that could be of interest to Myanmar during
the negotiations leading to the APEC environmental goods initiative. These
potential EPPs are primarily agricultural products not discussed by EGA
negotiators. Indonesia pushed for the recognition of palm oil and rubber – that
are both exported by Myanmar – as environmental goods. Despite numerous
attempts, primarily developed APEC members rejected the idea. Especially palm
oil is a controversial product because it is frequently linked with large scale
deforestation and would threaten the environmental credibility of the initiative.
However, it is perfectly possible to produce environmentally sustainable palm
oil, but to recognize such palm oil as an environmental good would require
international agreement on sustainability criteria and a credible certification
mechanism.
The case of forestry exemplifies the difficulties of using sustainability criteria
in Myanmar. In Myanmar, around 500,000 people depend on the production of
forestry products. The export of forestry products constitutes about 10% of
official Myanmar exports. Logging is an important source of income for ethnic
minorities especially in the Kachin State along the Chinese border and in the
Karen State along the Thai border (Woods and Canby 2011). Forestry is a
contentious issue because of high rates of unsustainable and illegal logging and
high activity in ethnic minority areas marked by civil conflict. Myanmar has no
internationally recognized certification system (Republic of the Union of
Myanmar 2014).
The Ministry of Environmental Conservation and Forestry has established the
Myanmar Forestry Certification Committee and tasked it with developing an
internationally recognized certification scheme. This Committee was
established in 1998, yet progress has been modest. As a result, the teak forests
that have made Myanmar forestry famous have become fragmented and greatly
reduced.
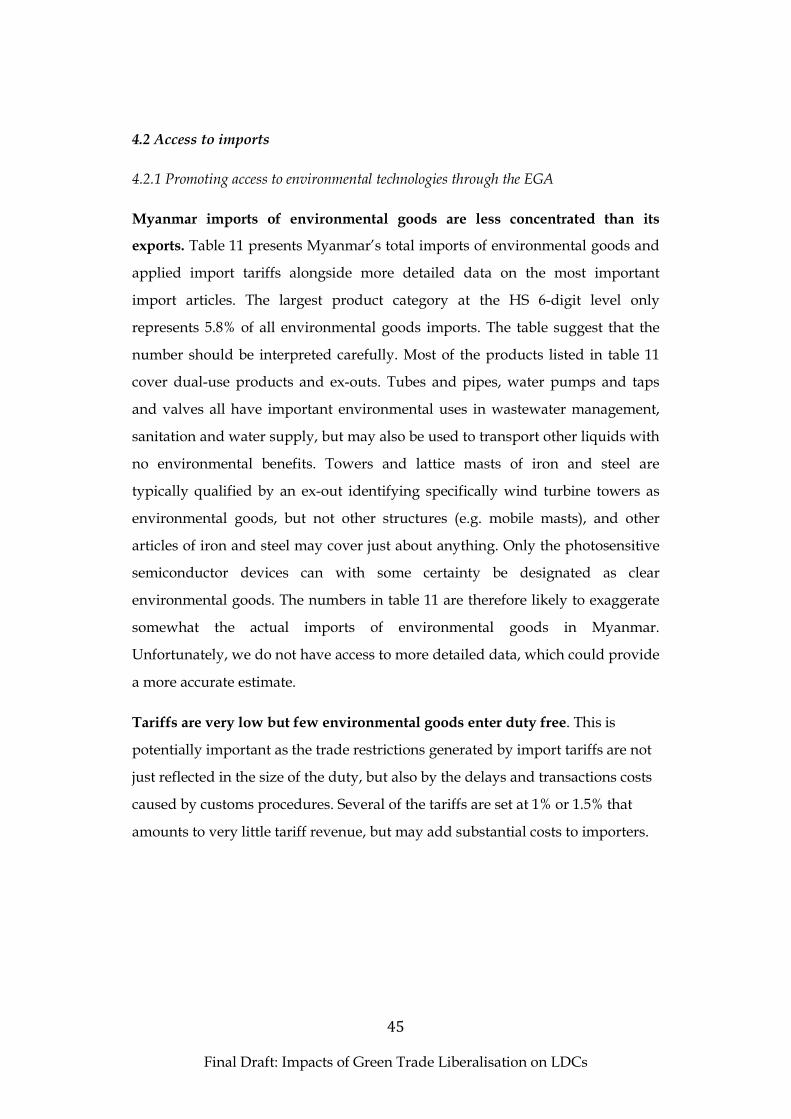
Final Draft: Impacts of Green Trade Liberalisation on LDCs
45
4.2 Access to imports
4.2.1 Promoting access to environmental technologies through the EGA
Myanmar imports of environmental goods are less concentrated than its
exports. Table 11 presents Myanmar’s total imports of environmental goods and
applied import tariffs alongside more detailed data on the most important
import articles. The largest product category at the HS 6-digit level only
represents 5.8% of all environmental goods imports. The table suggest that the
number should be interpreted carefully. Most of the products listed in table 11
cover dual-use products and ex-outs. Tubes and pipes, water pumps and taps
and valves all have important environmental uses in wastewater management,
sanitation and water supply, but may also be used to transport other liquids with
no environmental benefits. Towers and lattice masts of iron and steel are
typically qualified by an ex-out identifying specifically wind turbine towers as
environmental goods, but not other structures (e.g. mobile masts), and other
articles of iron and steel may cover just about anything. Only the photosensitive
semiconductor devices can with some certainty be designated as clear
environmental goods. The numbers in table 11 are therefore likely to exaggerate
somewhat the actual imports of environmental goods in Myanmar.
Unfortunately, we do not have access to more detailed data, which could provide
a more accurate estimate.
Tariffs are very low but few environmental goods enter duty free. This is
potentially important as the trade restrictions generated by import tariffs are not
just reflected in the size of the duty, but also by the delays and transactions costs
caused by customs procedures. Several of the tariffs are set at 1% or 1.5% that
amounts to very little tariff revenue, but may add substantial costs to importers.
Final Draft: Impacts of Green Trade Liberalisation on LDCs
46
Table 11: Imports of environmental goods and applied tariffs in Myanmar,
2013
Imports Tariffs
$ million % of total Simple
average Min. Max.
Myanmar 1,185 6.6 2.2 0 15
Centrifugal pumps
(HS 841370) 69 0.4 0 0 0
Parts for combustion
engines (HS 840999) 59 0.3 3.4 1 5
Towers and lattice masts
of iron/steel (HS 730820) 58 0.3 1.5 1.5 1.5
Tubes, pipes & hollow
profiles (HS 730660) 51 0.3 1.5 1.5 1.5
Other articles of iron
and steel (HS 732690) 49 0.3 1.3 0 1.5
Taps, cocks and valves
(HS 848180) 47 0.3 1 1 1
Photosensitive semi-
conductor devices (HS
854140)a)
46 0.3 7.5 7.5 7.5
Notes: a) Business representatives in Yangon reported that the government has recently eliminated the tariff on solar panels. The data reported here, based on the WITS database may be a bit outdated. Source: Own calculations based on data from the BACI database, HS 2002 revision, and WITS, latest year.
Besides environmental benefits produced by improved access to environmental
technologies, simplifying the tariff structure and eliminating such “nuisance
tariffs” may lower transaction costs.
Table 11 suggests that the tariff on “photosensitive semiconductor devices”
(solar panels) may be relatively high, 7.5%, but in this particular case, the
numbers in the WITS database may outdated. Some of business representatives
we met in Yangon reported that imports of solar panels have recently become
duty free.
4.2.2 Technology transfer
While the tariffs for the import of environmental goods are generally
conducive to the import of green technology, Myanmar struggles with a
Final Draft: Impacts of Green Trade Liberalisation on LDCs
47
number of other constraints to technology transfer. This section looks at the
case of renewable energy.
Myanmar has one of the world’s lowest rates of electrification. Only a third of
the population have access to electricity and most villages use traditional sources
like kerosene lamps for lighting. The government – assisted by international
donors like the World Bank, the Asian Development Bank (ADB) and the Japan
International Cooperation Agency (JICA) – has committed to achieving universal
electricity access by 2030. This plan implies that 7.2 million new households must
be connected to a source of electricity within the next 15 years (World Bank 2014).
Technologies are available that may address the energy needs of Myanmar.
Hydropower is the dominant source of electricity today, and could be developed
much further. The wind energy company Vestas has signed an agreement with
one of Myanmar’s leading power developer Zeya & Associates that aims at
developing projects for wind power. Myanmar also has unexploited geothermal
potential. Finally, solar energy has high potential due to Myanmar’s tropical
location. Solar energy is a source of both large scale solar farm projects and small
scale village and household projects that may deliver electricity to villages
without access to the national electricity grid because solar energy is ideal for
small and micro scale power plants.
UNDP (2013) discusses the challenges Myanmar faces in energy access. These
challenges are summarized in table 12. UNDP (2013) paint a picture of Myanmar
as a place where investments in renewable energy is deterred by both political
and financial factors, a picture that is confirmed by the analytical work of other
donors (ADB 2011). First, the government focuses on fossil fuel extraction mostly
for export and on developing the central electricity grid rather than promoting
renewable energy sources apart from large scale hydropower dams. Second,
resources are few and hard to access. Private investments are scarce partly
because Myanmar remains a state controlled economy with restrictions on
foreign investment. Parliament is elaborating a new investment law, but has not
adopted it yet. The resources of the government itself are scarce. The

Final Draft: Impacts of Green Trade Liberalisation on LDCs
48
government’s resources have been curtailed by falling prices for Myanmar’s
natural gas exports. The banking system is heavily controlled and very
inefficient. The rural population in particular faces big problems in accessing
finance and even private firms in the capital of Yangon have difficulties in
financing investments that would be profitable under normal interest rates.
Third, government policy is uncoordinated and different agencies fight for
control.
Table 12. Summary of Challenges to Expanding Energy Access
Challenge Description
Conflicting priorities
The government remains focused on producing crude oil and natural gas for export to meet regional energy demands
The government is committed to upgrading the national grid and building centralized hydroelectric, fossil-fuel, and even nuclear plants to power industrial and agricultural facilities instead of addressing off-grid energy access issues
Lack of resources
The country’s state-controlled economy makes it difficult to procure international financing and investment in the energy sector
A growing deficit and rising inflation constrain government budgets for electricity and energy
Declining natural gas prices have further reduced state revenue available for energy projects
Poor access to credit and limited rural banking networks compound efforts to give loans to energy-deprived households
Policy
More than a dozen government agencies opt for control and jurisdiction over energy and electricity planning
Scores of actors in the private sector and civil society further complicate the regulatory landscape
Source: UNDP (2013), Table 10.
4.3 Tariff revenue
Protecting tariff revenue, a traditional argument for staying outside trade
liberalisation agreements, is not a valid reason for Myanmar to not participate
in the EGA negotiations. Tariffs are already very low and we estimate
Final Draft: Impacts of Green Trade Liberalisation on LDCs
49
Myanmar’s total loss of tariff revenue to be roughly $24.5 million or 2.7% of all
estimated tariff revenue. This is, however, too much. Accounting for dual-use
products and ex-outs is likely to substantially reduce the import volumes
designated as environmental and thereby the tariff exemptions.
4.4 Implementation costs
During fieldwork, the authors interviewed a series of firms supplying off grid
solar technology to remote villages. Such technologies include solar lamps and
solar battery charging stations. Villagers use the technology for lighting and to
charge cells phone and similar small electronics. Solar battery charging stations
may be the basis for a small village business selling charging services to their
community.
In Myanmar, imports are subject to complex and intransparent procedures
including import permits and customs classification and valuation often
causing considerable delays that increase costs and decrease the flexibility and
predictability of the importer. The importers of solar technology universally
complained about the lack of transparency of customs procedures. Overall, tariff
rates are low, but as one importer stated “they are different for every shipment”.
The costs caused by these procedures create an additional burden to the tariffs
imposed.
The nature of the technology imported partly explains the intransparent
customs procedures. The firms supply the technology as a package containing a
small solar panel (typically ranging between the sizes of an A5 and an A4 sheet),
battery, charger, lamp, USB outlet and wires. Each individual component may
fall under its own individual tariff line. The customs officer will need to decide
how to treat the technology. Importers report that this leads to lengthy
negotiations. Some officials will put the full package under one tariff line, others
will try to assess the total value of the package and calculate a compound tariff.
Importers complain that customs officials do not trust the documentation
supplied. A shipment is accompanied by a commercial invoice and a customs

Final Draft: Impacts of Green Trade Liberalisation on LDCs
50
value declaration indicating the type of equipment and its value, but rather than
trust these, customs officials often search the internet to assess what they regard
as the true value of the product.
Why the customs officials do not apply procedures uniformly and predictably
is unknown. One explanation is that much of the technology imported is new to
Myanmar and thus unknown to the officials. Another is that by creating
uncertainty about the proper valuation and classification of the technology, the
officials establish negotiation issues that can eventually be settled through
unofficial payments. No matter what the reason is, it is certain that the basis of
the system is the complexity of the tariff schedule requiring different pieces of
the technology to be treated differently.
Importers interviewed state that their main concern is not tariffs to be paid,
because tariffs are generally low in the order of between 0% and 10%. They are
worried about the costs of delays and the lack of predictability. If Myanmar were
to join a future EGA, the problem of complex and intransparent customs
procedures may worsen if the EGA would include many ex outs. Thus, what
would be a liberalisation in theory because tariffs would officially fall – although
not much because they are already low – could in practice hinder trade through
the increased costs of intransparent customs procedures.

Final Draft: Impacts of Green Trade Liberalisation on LDCs
51
5. Conclusions and policy recommendations
The EGA currently being discussed will neither benefit nor harm LDCs. LDCs
exports will hardly be affected. LDCs export about $1 billion of environmental
goods equivalent to about half a per cent of their total exports. LDCs export a
third of the total to the countries negotiating the EGA, thus the EGA will reduce
the tariffs of this third only. The aggregate impact of the EGA on LDCs export
performance will therefore be very small. Furthermore, LDCs already access the
markets of most EGA negotiating countries tariff free due to preferential trading
arrangements. China is the major exception.
The impact on individual industries looks to be insignificant in most cases too.
The environmental goods being discussed in the EGA are almost exclusively
technology intensive manufactured products traded in global value chains that
LDCs are not taking part in. We analysed the potential of Myanmar to integrate
into such value chains. Myanmar is, because of its large size and its location in
dynamic South East Asia, one of the best placed LDCs to export through global
environmental goods value chains. But Myanmar is already struggling to
integrate into simpler garment value chains and the South East Asian countries
experiencing increased integration are middle income countries like Thailand
and the Philippines.
LDCs need green technologies to combat a multitude of environmental
problems, but in most LDCs the EGA is unlikely to provide significantly
better access to these technologies. In total, LDCs import about $13 billion’s
worth of environmental goods, more than ten times of what they export – a trade
pattern that reflects the high-technology nature of most environmental goods. To
increase imports and thus exploit available green technologies, LDCs can join the
EGA negotiations (or unilaterally lower tariffs). Tariffs will not, however, fall
much in most LDCs because LDCs tax their environmental goods imports
moderately. The average tariff is 8.6%. For selected industries in selected LDCs
cutting tariffs is a tool to increase imports because for these industries and
countries tariff peaks of up to 40% are in place. Eleven LDCs have relatively high

Final Draft: Impacts of Green Trade Liberalisation on LDCs
52
average tariffs (more than 10%). It is, however, an open question how technology
transfer will react to moderately lower prices of imported technology brought
about by cutting import tariffs. In Myanmar, for example, many factors beyond
price constrain the adoption of renewable energy technology, like adverse
government policy and low private investment.
With LDCs unlikely to gain new markets and almost as little likely to increase the
use of green technology, the EGA under negotiation looks like an insignificant
agreement for them. But the EGA might evolve over time and if it does, it may
become more relevant to the LDCs. Some EGA countries push to include a
review mechanism that could open the agreement to new products and market
barriers in the future. Observers like UNCTAD (2005) and Hamwey (2005) argue
that LDCs will have strong export interests in the inclusion of many EPPs. Yet,
we find that the types of EPPs discussed by these two observers are improbable
to be included in the future both because of many EGA countries reluctance to
include agricultural goods and the questionable environmental benefits of EPPs
like cotton and cotton-based products.
The inclusion of non-tariff measures could interest LDCs. Standards and
sustainability criteria have been mentioned as measures likely to be included. If
the EGA evolves into a forum for settling difficult questions of what is perceived
to be a “green” product, LDCs will want to participate in those discussions.
Because of the economic weight of the EGA countries, standards and
sustainability criteria adopted under a future EGA will become de facto global
standards. They may become reference points even for products not covered by
the EGA.
Should LDCs decide to join the EGA, the demand for both SDT and A4T is
limited if the EGA only includes environmental goods from the list being
negotiated now. The main issues are assistance to tax reform, compensation for
lost tariff revenues, and assistance to technology transfer. An EGA with many ex
out complicates the tariff schedule and go against the trend in customs reform in
developing countries towards simplification. As the Myanmar case study
Final Draft: Impacts of Green Trade Liberalisation on LDCs
53
exemplified, LDCs struggle when tariff schedules are complex. A limited number
of LDCs earn a sizeable share of their tariff revenue from environmental goods
and will need compensation if cutting tariffs on such goods. Compensation could
be in the form of assistance to customs reform that identifies new sources of
revenue. Technology transfer is a most complex issue and various mechanisms to
promote it are already under development, for example under the UNFCCC. It
appears more sensible to view technology transfer as a broad capacity building
issue than a narrow trade issue especially as the impetus to it from the EGA
looks to be minimal for LDCs.
The demand for SDT and A4T may be much higher if the EGA expands to
regulate more complex market barriers like standards and sustainability
criteria. The EGA most likely to be adopted – a narrow EGA focusing on tariff
reductions on high technology products and components – will incorporate a
strong element of SDT to LDCs in the form of extension of any benefits agreed
through the MFN principle. But the EGA countries cannot extend the benefits of
negotiations on standards and sustainability criteria to LDCs in the same way.
The MFN principle would dictate that LDC products should adhere to agreed
standards the same way as for the products of EGA countries (and of all other
WTO members). But the LDCs’ interests are not only to be treated in the same
way; rather their interests are in influencing the substance of the standards. That
influence they can only get by joining the EGA. To participate effectively in the
technically demanding issues of standards and sustainability criteria, LDCs
would need A4T.
The interests of LDCs in international trade negotiation are a Danish priority
as is the conclusion of the EGA negotiations. These two priorities are aligned.
The EGA under negotiation does not harm LDC interests. A future EGA
incorporating more products and more market access barriers offers
opportunities to offer benefits to LDCs. These benefits will be the inclusion of
carefully chosen EPPs and the regulation of non-tariff measures like standards
and sustainability criteria. The exact choice of products and the degree to which

Final Draft: Impacts of Green Trade Liberalisation on LDCs
54
LDCs will be able to take part in the discussion of non-tariff barriers will
determine how successful they will be in enjoying the benefits of this future,
larger EGA. Denmark can play an important role in supporting LDCs to choose
the right EPPs for liberalisation and to discuss non-tariff barriers.

Final Draft: Impacts of Green Trade Liberalisation on LDCs
55
References
Abiola, Victor O. and John S. Wilson. 2004. Standards and Global Trade – A Voice for Africa. Washington DC: World Bank.
ADB. 2011. Myanmar Energy Sector Initial Assessment. Manila: Asian Development Bank (ADB).
APEC. 2012. 20th APEC Economic Leaders’ Declaration, Vladivostock, Russia, Annex C: APEC list of environmental goods.
Basel Convention Secretariat. Undated. Introduction to WTO Environmental Goods and Services Negotiations Background information for Parties to the Basel Convention. Geneva: Basel Convention.
Blanco, Gabriel; Heleen de Coninck and Laura Würtenberger. 2012. The Technology Mechanism under the UNFCCC: The Way Forward. Policy Brief, October 2012. Climate Technology and Development Project. Climate and Development Knowledge Network.
Brenton, Paul; Gareth Edwards-Jones and Michael Friis Jensen. 2010. Do Current Accounting Methodologies Disadvantage Developing Countries? Carbon Footprints and Food Systems. Washington DC: World Bank.
Bridges BioRes. 3 August 2015. Environmental Goods Agreement trade talks eye August list. Bridges BioRes News Digest. Geneva: International Centre for Trade and Sustainable Development.
Bucher, H., Drake-Brockman, J., Kasterine, A., and M. Sugathan. 2014. Trade in Environmental Goods and Services: Opportunities and Challenges. International Trade Centre Technical Paper, Geneva.
Development Solutions. 2015. Trade Sustainability Impact Assessment on the Environmental Goods Agreement – Draft Inception Report. Brussels: Development Solutions.
Diringer, Elliot. 2009. Technology Transfer in a New Global Climate Agreement. Recommendations from the 2009 Brookings Blum Roundtable. Brookings Institute.
Draper, Peter and Memory Dube. 2013. Plurilaterals and the Multilateral Trading System. In ICTSD and World Economic Forum: Regional Trade Agreements and Plurilateral Approaches: Proposals and Analysis. E15Initiative. Geneva: International Centre for Trade and Sustainable Development (ICTSD) and World Economic Forum.
Final Draft: Impacts of Green Trade Liberalisation on LDCs
56
Eaton, Jonathan and Samuel Kortum. 1996. Trade in ideas – Patenting and productivity in the OECD. Journal of International Economics, Vol. 40, pp. 251 - 278
Finger, J. Michael and Philip Schuler. 2000. Implementation of Uruguay Round Commitments: The Development Challenge. World Economy, Vol. 23, Issue 4, pp. 511-525.
Fontagne, Lionel, Christina Mitaritonna and David Laborde. 2008. An Impact Study of the EU-ACP Economic Partnership Agreements (EPAs) in the Six ACP Regions. Report prepared for the Chief Economist Unit of DG Trade, the Commission of the European Union
Gaulier, Guillaume and Soledad Zignago. 2010. BACI: International Trade Database at the Product-level. The 1994-2007 Version. Centre D’Études Prospectives et D’Informations Internationales (CEPII) Working Paper No 2010-23
Hamwey, Robert. 2005. Environmental goods: where do the dynamic trade opportunities for developing countries lie? Centre for Economic and Ecological Studies.
Haselip, James; Ivan Nygaard; Ulrich Hansen and Emmanuel Ackom, editors. 2011. Diffusion of renewable energy technologies: case studies of enabling frameworks in developing countries. Technology Transfer Perspectives Series. UNEP Risø Centre Denmark.
Howse, Robert and Petrus B. van Bork. 2006. Options for Liberalising Trade in Environmental Goods in the Doha Round. Issue Paper No. 2. Geneva: International Centre for Trade and Sustainable Development (ICTSD).
ICTSD. 2015a. “Negotiators Work to Refine Product List for Environmental Goods Agreement.” Bridges, Vol 19, No 32.
ICTSD. 2015b. “Environmental Goods Agreement trade talks eye August list”, Biores, 3 August 2015, http://www.ictsd.org/bridges-news/biores/news/ environmental-goods-agreement-trade-talks-eye-august-list/
ICTSD. 2014. Written submission on Environmental Goods Trade Agreement: Advice on the Probable Economic Effect of Providing Duty-Free Treatment for Imports. Investigation No. TA-131-039. Geneva: International Centre for Trade and Sustainable Development (ICTSD).
ICTSD. 2009. Liberalization of Climate-friendly Environmental Goods: Issues for Small Developing Countries. Information note Number 14, October 2009. Geneva: International Centre for Trade and Sustainable Development (ICTSD).
Final Draft: Impacts of Green Trade Liberalisation on LDCs
57
ICTSD. 2008. Liberalization of Trade in Environmental Goods for Climate Change Mitigation: The Sustainable Development Context. Background paper for the Trade and Climate Change Seminar, June 18-20, 2008, Copenhagen, Denmark. Geneva: International Centre for Trade and Sustainable Development (ICTSD).
IIED. 2014. Technology transfer for Least Developed Countries. IIED Backgrounder, September 2014. London: International Institute for Environment and Development (IIED).
IPPC. 2000. Methodological and Technological Issues in Technology Transfer. Cambridge: Cambridge University Press.
ITC. 2014. Trade in Environmental Goods and Services: Opportunities and Challenges. International Trade Centre Technical Paper. Geneva: International Trade Centre.
Jaffee, Steven; Spencer Henson and Luz Diaz Rios. 2011. Making the Grade: Smallholder Farmers, Emerging Standards, and Development Assistance Programs in Africa. Washington DC: World Bank.
Jensen, Michael Friis. 2015. Developing Exports through Investing in Quality Infrastructure and SPS Management in Myanmar. Chapter for the Diagnostic Trade Integration Study (DTIS) of Myanmar. Washington DC: World Bank.
Jha, Veena. 2009. Climate Change, Trade and Production of Renewable Energy Supply Goods: The Need to Level the Playing Field. Paper prepared for the ICTSD.
Kennett, Maxime and Ronald Steenblik. 2005. Environmental Goods and Services: A Synthesis of Country Studies. OECD Trade and Environment Working Papers, 2005/03. Paris: Organisation for Economic Co-operation and Development (OECD).
Khatun, Fahmida. 2010. Trade Negotiations on Environmental Goods and Services in the LDC Context. Discussions Paper, August 2010. New York: United Nations Development Program (UNEP).
Kim, Joy Aeree. 2011. Facilitating Trade in Services Complimentary to Climate-friendly Technologies. ICSTD issues paper #16.
Kirkegaard Jakob Funk, Thilo Hanemann, and Lutz Weischer. 2009. It should be a breeze: harnessing the potential of open trade and investment flows in the wind energy industry. World Resources Institute, Working Paper Series. WP 09-14. December 2009. Washington DC.
Final Draft: Impacts of Green Trade Liberalisation on LDCs
58
Kirkpatrick (2006) “Trade in Environmental Services: Assessing the Implications for Developing Countries in the GATS”, ICSTD issues paper #5.
Knudson, Haley; Dina Margrethe Aspen and John Eilif Hermansen. 2015. An Evaluation of Environmental Goods (EGs) for the WTO EGA: EGs for Developing Countries. Department of Industrial Economics and Technology Management, Norwegian University of Science and Technology.
Lendo, Enrique. 2005. Defining Environmental Goods and Services and their Trade and Sustainable Development Implications: A Case Study of Mexico. Issue Paper No. 1. Geneva: International Centre for Trade and Sustainable Development (ICTSD).
Melo, Jaime de and Mariana Vijil (2014) “Barriers to Trade in Environmental Goods and Services: How Important Are they? How Much Progress at Reducing Them?” CEPR DP #8161.
Melo, Jaime de and Mariana Vijil. 2014b. The Critical Mass Approach to Achieve a Deal on Green Goods and Services: What is on the Table? How Much to Expect?. Working Paper #107, June 2014. Fondation pour les études et recherches sur le développement international (FERDI).
Ministry of Foreign Affairs. 2014. A Shared Agenda: Denmark’s Action Plan for Policy Coherence for Development. Copenhagen: Ministry of Foreign Affairs of Denmark.
Monkelbaan, Joachim. 2011. Trade Preferences for Environmentally Friendly Goods and Services. Geneva: International Centre for Trade and Sustainable Development (ICTSD).
Nampoothiri, Madhavan and Hari Manoharan. 2013. International Trade and Access to Sustainable Energy: Issues and Lessons from Country Experiences. Geneva: International Centre for Trade and Sustainable Development (ICTSD).
National Board of Trade. 2014. Making Green Trade Happen – Environmental Goods and Indispensable Services. Stockholm: National Board of Trade.
Ockwell, David and Alexandra Mallett, editors. 2012. Low Carbon Technology Transfer: From Rhetoric to Reality. New York: Routledge.
Page, Sheila. 2007. Policy space: Are WTO rules preventing development? ODI Briefing Paper 14, January 2007. London: Overseas Development Institute.
Republic of the Union of Myanmar. 2014c. National Export Strategy: Forestry Products Sector Strategy 2015-2019. The Department of Trade Promotion, Ministry of Commerce.
Final Draft: Impacts of Green Trade Liberalisation on LDCs
59
Saito, Mika; Michele Ruta and Jarkko Turunen. 2013. Trade Interconnectedness: the World with Global Value Chains. Washington DC: International Monetary Fund.
Steenblik, Ronald (2005a) “Liberalizing Trade in ‘Environmental Goods’: Some Practical Considerations”, chp. 3 in OECD (2005), pp. 73-92.
Steenblik, Ronald. 2005b. Environmental Goods: A Comparison of the APEC and OECD Lists. OECD Trade and Environment Working Paper No. 2005-04. Paris: Organization for Economic Cooperation and Development (OECD)
Steenblik, Ronald and M. Geloso Grosso (2011) “Trade in Services Related to Climate Change: An Exploratory Analysis”, OECD Trade and Environment Working Papers, 2011/03 .
Sugathan, Mahesh. 2014. “Product Coverage and Tariffs in the Green Goods Initiativ: Ensuring an Effective Outcome”, presentation made at the ICTSD Dialogue meeting “Green Goods Initiative: A stepping stone towards effective climate change action” on 8 July 2014.
Sugathan, Mahesh. 2013a. Lists of Environmental Goods: An Overview. Information Note, December 2013. Geneva: International Centre for Trade and Sustainable Development (ICTSD).
Sugathan, Mahesh. 2013b. Winds of Change and Rays of Hope: How Can the Multilateral Trading System Facilitate Trade in Clean Energy Technologies and Services? Overview Paper produced by the E15 Expert Group on Clean Energy Technologies and the Trade System. Geneva: International Centre for Trade and Sustainable Development (ICTSD).
Sugathan, Mahesh. 2009. Liberalisation of Climate-friendly Environmental Goods: Issues for Small Developing Countries. Information Note Number 18, October 2009. Geneva: International Centre for Trade and Sustainable Development (ICTSD).
Sugathan, Mahesh. 2008. Enhancing market access for biofuels: What role for environmental goods negotiations? Biores Vol. 2, Number 4.
UNCTAD. 2011. Building a development-led green economy. Policy brief N° 23, June 2011. Geneva: United Nations Conference on Trade and Development (UNCTAD).
UNCTAD. 2009. Trade and Environment Review 2009/2010 – Promoting Poles of Green Growth to Foster the Transition to a more Sustainable Economy. Geneva: United Nations Conference on Trade and Development (UNCTAD).
Final Draft: Impacts of Green Trade Liberalisation on LDCs
60
UNCTAD. 2005. Environmental Goods: Identifying Items of Export Interest to Developing Countries. UNEP-UNCTAD Capacity-Building Task Force (CBTF) Briefing Note. Geneva: United Nations Conference on Trade and Development (UNCTAD).
UNCTAD. 2004. São Paolo Consensus, UNCTAD XI, São Paolo, 13-18 June 2004. TD/410, 25/06/04.
UNCTAD. 2003. Environmental Goods: Trade Statistics of Developing Countries. Geneva: United Nations Conference on Trade and Development (UNCTAD).
UNCTAD. 1995. Environmentally Preferable Products (EPPs) as a Trade Opportunity for Developing Countries. UNCTAD/COM/70. Geneva: United Nations Conference on Trade and Development (UNCTAD).
UNDP. 2013. Accelerating Energy Access for all in Myanmar. United Nations Development Programme (UNDP), Myanmar.
Vossenaar, Réne. 2014. Identifying Products with Climate and Development Benefits for an Environmental Goods Agreement. Geneva: International Centre for Trade and Sustainable Development (ICTSD).
Vossenaar, Réne. 2013. The APEC List of Environmental Goods – An Analysis of the Outcome and Expected Impact. Issue Paper No. 18. Geneva: International Centre for Trade and Sustainable Development (ICTSD).
Vossenaar, Réne and Veena Jha. 2010a. Technology Mapping of the Renewable Energy, Buildings and Transport Sectors: Policy Drivers and International Trade Aspects – an ICTSD Synthesis Paper. Issue Paper No. 12 Geneva: International Centre for Trade and Sustainable Development (ICTSD).
Vossenaar, Réne and Veena Jha. 2010b. Deploying Energy-Efficiency and Renewable-Energy Technologies in Residential and Commercial Buildings. Issue Paper No. 11. Geneva: International Centre for Trade and Sustainable Development (ICTSD).
Wind, Izaak. 2010. HS Codes and the Transport Sector. Geneva: International Centre for Trade and Sustainable Development (ICTSD).
Woods, Keving and Kerstin Canby. 2011. Baseline Study 4, Myanmar – Overview of Forest Law Enforcement, Governnance and Trade. Forest Trends for FLEGT Asia Regional Programme. August 2011. Regional Support Programme for the EU FLEGT Action Plan in Asia.World Bank. 2008. International Trade and Climate Change: Economic, Legal, and Institutional Perspectives. Washington DC: World Bank.

Final Draft: Impacts of Green Trade Liberalisation on LDCs
61
World Bank. 2014. Myanmar - Development of a Myanmar national electrification plan
towards universal access 2015-2030. Washington, DC : World Bank Group
World Bank. 2008. International Trade and Climate Change: Economic, Legal and Institutional Perspectives. Washington DC: World Bank.
WTO. 2010. Report of the Chairman, Ambassador Manuel A. J. Teehankee, to the Trade Negotiations Committee for the purpose of the TNC stocktaking exercise. TN/TE/19. 22 March 2010. Geneva: World Trade Organization (WTO).
WTO. 2011. Report of the Chairman, Ambassador Manuel A. J. Teehankee, to the Trade Negotiations Committee. TN/TE/20. 21 April 2011. Geneva: World Trade Organization (WTO).
WTO. 2002. List of environmental goods. TN/TE/W/18. Geneva: World Trade Organization (WTO).
WTO and OECD. 2013. Aid for Trade at a Glance 2013 – Connecting to Value Chains. Geneva and Paris: World Trade Organization (WTO) and the Organization for Economic Cooperation and Development (OECD).
Wu, Mark. 2014. Why Developing Countries Won’t Negotiate: The Case of the WTO Environmental Goods Agreement. Trade, Law and Development 6(1).
Zake, Justin. 2011. Customs Administration Reform and Modernization in Anglophone Africa – Early 1990s to Mid-2010. IMF Working Paper 11/184. Washington DC: International Monetary Fund.
Zhang, ZhongXiang. 2011. Trade in Environmental Goods, with Focus on Climate-Friendly Goods and Technologies. East-West Center Working Papers Economics Series, No. 120, October 2011. Honolulu: East-West Center.


