F o i s i e S c h o o l o f B u s i n e s s | 1 0 0 I n s t i t u t e R d . | W o r c e s t e r , M A 0 1 6 0 9 5 0 8 - 8 3 1 - 5 2 1 8 | w w w . w p i . e d u / + C S B
2014
Green Supply Chain Practices Evaluation in the Mining Industry using a Joint Rough
Sets and Fuzzy TOPSIS Methodology Working Paper WP3-2014
Simonov Kusi-Sarpong, Chunguang Bai, Joseph Sarkis and Xuping Wang

Green Supply Chain Practices Evaluation in the Mining Industry using a Joint Rough Sets and Fuzzy TOPSIS Methodology
Simonov Kusi-Sarpong School of Management Science and Engineering
Dalian University of Technology No .2 Linggong Road, Ganjingzi District
Dalian Liaoning Province (116023) P.R of China E-mail: [email protected]
Chunguang Bai School of Management Science and Engineering
Dongbei University of Finance & Economics Jianshan Street 217 | Dalian, 116025, P.R.China
Tel: (86411) 8690-4888 | Fax: (86411) 87403733 E-mail: [email protected]
Joseph Sarkis School of Business
Worcester Polytechnic Institute 100 Institute Road | Worcester, MA 01609-2280, USA
Tel: (508) 831-4831 E-mail: [email protected]
Xuping Wang School of Management Science and Engineering
Dalian University of Technology No .2 Linggong Road, Ganjingzi District
Dalian Liaoning Province (116023) P.R of China School of Business | Dalian University of Technology
Panjin Liaoning Province (124221) P.R of China E-mail: [email protected]
November 2013 Revised: October 2014
FOR INQUIRY PLEASE REFERENCE THIS WORKING PAPER AS WP3-2014

1
Green Supply Chain Practices Evaluation in the Mining Industry using a Joint Rough Sets and Fuzzy TOPSIS Methodology
ABSTRACT
Environmental issues from the extractive industries and especially mining are prevalent and
maleficent. An effective way to manage these pernicious environmental problems is through
organizational practices that include the broader supply chain. Green supply chain practices and
their role in mining industry strategy and operations have not been comprehensively addressed. To
address this gap in the literature, and building upon literature in general green supply chain
management and environmental decision tools, we introduce a comprehensive framework for green
supply chain practices in the mining industry. The framework is categorized into six areas of practice,
with detailed practices described and summarized. The green supply chain practices framework is
useful for practical managerial decision making purposes such as programmatic evaluation. The
framework may also be useful as a theoretical construct for empirical research on green supply chain
practices in the mining industry. To exemplify the practical utility of the framework we introduce a
multiple criteria evaluation of green supply programs using a novel multiple criteria approach that
integrates rough set theory elements and fuzzy TOPSIS. Using illustrative data we provide an
example of how the methodology can be used with the green supply chain practices framework for
the mining industry. This paper sets the foundation for significant future research in green supply
chain practices in the mining industry.
Keywords: Green Supply Chain Practices, Program Evaluation, Rough Set Theory, Mining
Industry, Information Theory

2
1. INTRODUCTION
Mining operations and supply chain activities are mired with serious socio-environmental
consequences, and underlying economic implications (Hilson and Nayee, 2002; Poulton et al., 2013).
These mining activities have brought about massive environmental degradation and natural
resources depletion, threatening future opportunities for sustainable industrial development and
economic growth. Mining companies generate a wide range of environmental impacts from their
mining operations. Mining activities such as exploration, ore mining, and maintenance activities all
contribute to serious environmental problems such as soil erosion, tailings contamination, oil spills,
cyanide release, dust or noise nuisance, and acid mine drainage (Hilson and Nayee, 2002; Muduli et
al., 2013). The design and extraction of natural resources (ore) through mining activities using high
toxic reagents can generate carbon dioxide (CO2) emissions and pollutants; deplete water and land
resources, and produce waste products disposed into the environment. During exploration stages,
vegetation is removed to enable the creation of access roads to the mineralized zone for drilling
activities. These exploration and mining activities result in serious soil erosion, destruction of
habitat, and soil and water contamination from hazardous materials and oil spills. Additionally,
during the mines mineral leaching and extraction stages, cyanide, an extremely toxic chemical is used
in the process and becomes part of the tailings (waste) which are ultimately disposed into a tailings
dam. This type of environmental damage may result in the release of cyanide from the tailing dam to
the water bodies causing intoxication of wildlife drawn to water.
As a result of these and additional environmental issues facing mining operations, mining
companies are mired with numerous environmental challenges which require them to carefully
address regulatory concerns while meeting diverse stakeholder groups’ demands (Hilson and Nayee,
2002; Mzembe et al., 2013; Dobele et al., 2014). Therefore, mining companies are seeking to reduce
the impact of their operations on the environment. Environmental concerns in mining industries

3
have grown to include extended producer responsibility to help address their environmental impacts
(Lenzen et al., 2007).
The extended producer responsibilities are not just for products but also for materials and
byproducts such as those in extractive industries. Thus, concerns upstream and downstream in the
mining supply chain, in addition to operations within a focal mining organization, all influence the
supply chain. In this paper our objective is to introduce general factors and practices that may be
elements of green supply chain management (GSCM) programs, with an especial focus on the
mining industry. We also seek to introduce and evaluate novel multiple-criteria decision making
(MCDM) tools to evaluate mining industry green supply chain practices.
To help accomplish these goals, we provide some contextual background to greening the supply
chain in the mining industry with a review of various green supply chain practices that set the
foundation for a general practices framework. Then, background on two core tools, rough set theory
(entropy) valuations are used for weighting purposes to help in a multiple criteria evaluation of
GSCM programs in a mining industry context. After introduction of the tools, an illustrative
application and analysis is provided to exemplify the utility of this tool. Finally, we identify some of
the major issues faced, implications, and future research directions associated with GSCM and
decision making in the mining industry.
The contribution of this paper is multifold. First, we develop and introduce some green supply
chain practices in a new typology and specifically for the mining industry. Second, we introduce a
set of tools to help evaluate green supply chain practice programs in the mining industry. Third, this
set of tools is novel for the first time integrating rough set (information theory) based weighting
schemes within a TOPSIS decision framework. Overall, the development of factors, example
illustration, and unique integration of tools, sets the foundation for further research in green supply
chain sustainability of the mining industry and corporate sustainability practices in general.
4
2. BACKGROUND
The mining industry has been an imperative economic activity for thousands of years. In fact,
mining, such as gold mining has been a major industry in both developed and developing countries.
But the economic benefits of mining of natural resources have been offset by its environmental
degradation. In the mining industry efforts have been introduced to improve environmental
performance. In managing this situation, tools to help mining company decision makers make sound
decisions could be valuable. Overall, in greening and sustainability research model development, to
help manage multiple criteria and tradeoffs associated with environmental, organizational, and
economic performance have started to receive greater recognition amongst scholars (Bai et al., 2012;
Brandenberg et al., 2014). In the GSCM literature, the use of quantitative models has only started to
see increased evidence (Seuring, 2013; Brandenburg et al., 2014).
Sustainability decision tools that incorporate mining industry GSCM characteristics do not exist.
This paper seeks to address this gap. Specifically this study focuses on the use of multiple-criteria
decision making tools to help in GSCM programmatic development. Various environmentally
supportive (green) supply chain practices can be administered through various programs that may be
adopted by organizations. Sometimes these programs may be technological or organizational
solutions, or a mixture. For example training programs may exist for a number of green supply
practices, enterprise-wide information systems may support various green supply chain efforts, or
suppliers and vendors may be selected that can support these practices. Choosing amongst these
programs and how they influence practices is a critical issue faced by organizations. We shall utilize
multiple criteria tools to help managers in a mining industry environment select amongst these
programs.
The background section will begin with providing development of the major green supply chain
practices faced by the mining industry. We then summarize these practices in a general green supply

5
chain practices framework within the mining industry. We then introduce the methodologies in a
second part of the background section.
2.1. Factors (practices) of Green Supply Chain Management implementation in the Mining
Industry
In spite of increased development and adoption of environmental management strategies among
many mining companies in Ghana (and around the world), an increasing rise of environmental
issues, especially from various supply chain activities, still exist. Factors hindering mining company
environmental management improvements and capability building include the lack of approaches to
identify, confirm, and validate, holistic mining industry GSCM practices.
This study identifies six (6) distinctive GSCM practices (factors) and sub-practices (factors) that
include Green Information Technology and Systems (GITS), Strategic Supplier Partnership (SSP),
Operations and Logistics Integration (OLI), Internal Environmental Management (IEM), Eco-
Innovation practices (ECO), and End-of-Life practices (EOL). To initially arrive at these practices
and sub-practices for GSCM implementation in the mining industry, literature on GSCM, in general,
and in the mining industry in particular was reviewed. Industrial experts, academicians, and
government officials within Ghana were then consulted to help evaluate, confirm and focus the
factors and sub-factors.
In the initial development methodology, the sub-factors were first grouped and listed under each
of the major factors in a table with brief descriptions and explanations of the sub-factors provided.
This list was first submitted to three respondents from the ministry of lands, forestry and mines and
ministry of environment and science including two mining engineers with over 12 years of prior
working experience in the Ghanaian mining industry as well as two respondents from academics,
one with research interest in environmental science and the other with research interest in supply
6
chain management for an initial review. This initial review resulted in a listing of 6 factors and 34
sub-factors.
The major factors and sub-factors were then distributed to four different industrial experts with a
minimum of 10 years mining work experience from various mining companies in Ghana. The four
industrial experts who were chosen for this exercise include; a Supply Manager with 18years mining
work experience, an Environmental Manager with 10 years mining work experience, a Health, Safety
and Environmental Manager with 22 years mining work experience, and a Mining Manager with 12
years work experience in the mining industry. These respondents were asked to share their opinions
in what they perceive as either necessary, actual, or appropriate GSCM practices and sub-practices
for the mining industry’s GSCM implementation on a “Yes” or “No” basis. They were asked to
add/suggest additional major factors and sub-factors they considered necessary but were not
captured by the literature review. No additions or suggestions were made. The responses received
were then tabulated and based on the number of respondent (4 in number), a threshold value of not
less than 3“Yes” per practice was agreed by the research team as the necessary number of
affirmative votes for a sub-factor to be included in the final listing.
This methodology resulted in a final set of six major factors and thirty sub-factors. See Table 1
for the final listing. We now overview the remaining GSCM factors based on the literature review.
2.1.1 Green Information Technology and Systems (GITS)
Information Technology and Systems (ITS) are critical supply chain enablers in the mining
industry (Gunasekaran and Ngai, 2004) with substantial benefits (Jenkin et al., 2011; Bai and Sarkis,
2013). Mining companies use traditional ITS’ that enable them to integrate functional departments
and suppliers (Gunasekaran and Ngai, 2004). For example, the use of enterprise resources planning
(ERP) systems by mining companies makes it possible to easily track various transactions that take
place across the various functional departments. Since mines operate almost continuously, all these

7
IT systems, especially servers are required to be supporting this continuous operation. In mining
companies, ITS’ are seen as basic necessity for working and communicating, nearly every employee
uses one kind of ITS’ or the other, making ITS’ operations alone contributes significantly to the
environmental footprint (Faucheux and Nicolaï, 2011; Uddin and Rahman, 2012).
Although some harmful practices and effects on the environment from the use of ITS, ‘Green’
ITS can bring significant economic saving and minimize the environmental impact (Berl et al., 2010;
Jenkin et al., 2011). With a large number of ITS uses in mining companies, mining companies need
to switch from high energy consumption hardware systems to energy-efficient hardware systems.
These energy-efficient hardware systems have the capacity to reduce data center (servers, network
and storage devices) energy consumption through energy-saving devices in greening operations.
Mining companies can also adopt and use collaborative group software and telepresence systems
built with energy-saving devices which uses videoconferencing as an alternative to employees
traveling (including meetings with suppliers).
These initiatives can also bring further energy reduction in transportation and promote the use of
Green ITS-solutions based equipment. It further enables faster decision making and scale scarce
resources (e.g. information is valuable in managing and reducing pipeline inventories (Christopher,
2005; 2010)) and waste. Another area that can increase the energy savings of the mining companies
is server consolidation based on service virtualization. This divides computation resources and
enables hardware sharing among various mines promoting energy efficiency. Server consolidation
requires less hardware generally; hence cooling energy wasted is drastically reduced.
The mine SCMs encompass various functional departments and critical suppliers, hence, in
managing these critical suppliers, ITS tools are used to collaboration the mines and these suppliers,
increasing integration of the various value-added activities. This integration reduces logistics costs,

8
through paperless transactions and reduced transportation carbon footprints (Allenby et al., 2001;
Setterstrom, 2008; Watson et al., 2008; Chou et al., 2012).
2.1.2. Strategic Supplier Partnership (SSP)
Implementing GSCM practices in the mining industry requires partnership beyond the mining
company’s boundaries (Spekman and Carraway, 2006; Mentzer et al., 2000). Since mining companies
are in a ‘primary industry’1, the finish products (for example gold, manganese, and other precious
ores) are in the raw material stage. Demands for these products are nearly always high with
significant customer competition for these materials. As a result, mining companies have a relatively
lessened focus on downstream partnership practices (i.e. outbound logistics) since customers
provide these services due to the competitive nature of this market. This lack of downstream focus
is evident in green supply chain practices, for example customers have very little impact on
environmental investment decisions (Vachon, 2007).
The cases of strategic partnerships in the mining industry are typically oriented toward the
upstream portion of the supply chain. Mining companies form partnerships to strengthen their
strategic and operational competences, develop mutual supply chain benefits, and improve total
supply chain control (Tan et al, 2002; Vachon & Klassen, 2006a; Vachon & Klassen, 2006b; Vachon
& Mao, 2008; Gunasekaran et al., 2004).
These strategic partnerships promote direct, long-term alliances, mutual planning, problem
solving initiatives, shared environmental management knowledge, and joint development of
environmental management solutions or programs to reduce or eliminate materials use in mining
companies (Geffen and Rothenberg 2000, Gunasekaran et al, 2001, Rao 2002; Simpson et al., 2007).
1 Primary industries are involved with primary commodities by extracting natural resources or harvesting raw materials prior to processing.

9
These strategic partnerships further allow mining companies to collaborate with their critical
suppliers and enable mines to communicate their sustainability goals to these suppliers and set
environmental targets to monitor suppliers’ environmental compliance status and practices in their
operations. For example, the supplies of sodium cyanide procured by mines require strong
adherence to the ICMC2 (if the mines signatory members) standards. Collaboration needs to occur
between the mines and their suppliers to ensure best practices are applied to protect the
environment.
2.1.3. Operations and Logistics Integration (OLI)
The activities related to logistics integration and production system operations may be considered
the ‘internal supply chain’. Logistics activities within mining companies involve organizing the
delivery of raw materials, equipment and parts, and services to the mines. These activities include
stocking supplies, ordering, transportation management3, inventory management, warehousing, and
delivery to internal customers. The logistics and operations management processes may be
integrated using ERP systems, and thus, may provide operations and logistics integration.
Effective logistics and operations integration in mines require crossing organizational boundaries
(Chen and Paulraj, 2004; Stock et al., 1998, 2000). The lack of mining organizations’ external
integration can have serious economic and environmental consequences. A typical example is the
2 The ICMC - "International Cyanide Management Code for the manufacture, transport, and use of cyanide in the production of gold" (Code) was developed by a multi-stakeholder Steering Committee under the guidance of the United Nations Environmental Program (UNEP) and the then- International Council on Metals and the Environment (ICME)” <http://www.cyanidecode.org/about-cyanide-code#sthash.BiUnOFky.dpuf >(Assessed: 15 October, 2013). ICMC focuses on safe cyanide and cyanidation leach solution and mill tails management. Once a mining company that uses cyanide for gold recovery sign-on-to this code, they are require to be audited by an independent body to ascertain their level of compliance of the Code requirement. Once the requirements of the code are met by such mining company, they are certified and a unique trademark symbol can be utilized by the mines and subsequently, the audit report made public. 3 To enable the flow of supplies from the suppliers to the mining companies, various long-term freight forwarders contracts for air- and ocean-freight at highly dominated purchased zones along in-country clearing agents and transporters have being signed between the mining companies and the freight agents and local clearing agents and transporters.
10
purchase of large quantities of raw materials and spares causing overstocks in warehouse inventory
which may result in many types of material, space and energy waste.
Seamless integration with the mine’s supply chain partners especially onto the mines ERP system
offers real-time information sharing and visibility, promoting supplier’s advance replenishment
preparations, and a quick adjustment to sustain the mines operations when the mines observes
changes/delays in their consignment (parts or materials) which improves plant availability, reduces
persistence stock-out and overall cost of production. It further encourages electronic-ordering and
tracking system as against paper-based ordering and tracking system. Integration helps promote
green logistics activities such as green purchasing, vendor management, and collaboration, helping to
minimize the impact of environmental issues associated with the flow of materials (example sodium
cyanide which needs to meet UN codes) in the supply chain (Bowen et al., 2001; Min and Galle,
2001; Vachon and Klassen, 2008; Carter and Easton, 2011).
The core capabilities in mining companies are acquisition, maintenance and operating of mine
machinery for the extraction and processing of mineralized ore body. Maintenance cost is estimated
as 30% of the total operational cost of mining companies4. The use of mines-wide asset reliability
approach of integrating all the key internal operational processes and activities will help to achieve
operational reliability optimization leading to improve operational efficiencies and freeing up
additional capacity (efficient resources use), thus enabling mining companies to minimize cost, use
resources efficiently and increase production throughput5.
2.1.4. Internal Environmental Management (IEM)
Addressing environmental concerns in mines requires total commitment and input from all
members within the mining company. Internal environmental management (IEM) initiatives are
4 Accenture (2011) “Global Operating Models for Mining Companies: Adding value beyond the individual assets”, Mining Executive Series, pp 1-28 5 ibid
11
required to be implemented company-wide to achieve this goal (Vachon & Klassen, 2006a) of
continuously integrating project processes from exploration to closure to achieve cleaner production
(CP) (Hilson and Nayee, 2002).
Mining companies are required to have environmental pollution prevention plans as guides for
employees. These plans and policies are meant to address environmental and safety concerns. Top
management commitment for these plans and policies is required for IEM initiatives
implementation. Allocating resources and funds to hire and maintain environmental experts (teams)
for IEM is needed for continuous employee training on imperative environmental practices and
management system procedures including auditing and reporting (Hilson and Nayee, 2002). IEM
could incorporate Total Quality (environmental) Management (TQM) techniques to help suppliers
reduce environmental pollution (Curkovic et al., 2000; Barla, 2007).
2.1.5. Eco-Innovation Practices (ECO)
Eco-innovation may be defined as the production, application or exploitation of a good, service,
production process, organizational structure, or business method that is novel to the firm and results
in reduction of environmental risk, pollution and burdens of resources use throughout their life
cycle (Kemp & Foxon, 2007). In the early stages of mining operations where minerals are processed
into metals, by-products are produced and using innovations these byproducts can be converted to
usable materials (Lutandola and Maloba, 2013). This eco-innovation may result in reduction of
substantial amounts of mining waste.
Eco-innovative ideas are also enablers. For example, consider the use of environmentally friendly
substitute reagents or chemicals with low-impact for high toxic reagent/chemicals (Azevedo et al.,

12
2012). Within mining operations the use of ‘ammoniacal thiosulfate’6 to process carbonaceous ores
as an alternative to sodium cyanide for gold recovery is a substitution example. To reduce these
environmental impacts and make more efficient use of natural resources, mining companies should
integrate cleaner production system/cleaner extraction technologies. These eco-innovations improve
the efficiency of previously used technologies and contribute to pollution reduction (Azevedo et al.,
2012).
As another example, process metallurgy can be designed to maximize the recovery of minerals,
decrease water use and impacts, improve mineral recovery efficiency and by-product values. Process
plant redesign can also lead to effective use of resources and materials efficiency, greenhouse gas
emissions and consumption of energy reduction, and improve minor elements control and toxic
materials while reducing process waste generation (Carter and Easton, 2011; Azevedo et al., 2012).
2.1.6. End-of-Life Practices (EOL)
End-of-life solutions rely on external recycling and recovery of waste (Sarkis and Cordeiro, 2001;
Wang and Gaustad, 2012) in response to decreased overall environmental impact and an
economically beneficial alternative to ordering new products. Two kinds of end-of-life activities are
involved in mining operation; reverse logistics for parts and components and recovery for
chemical/reagents and re-mining of tailings.
Reverse logistics (RL) in the supply chain results in products, parts, components, warranted-
components traveling in the opposite direction from consumers (downstream) to
manufactures/suppliers (upstream) (Bell et al., 2013), for the purpose of defect reworking, product
returns, refurbishment, rebuilding or repairing for reuse, reprocessing or controlled scrapping,
6 The use of ammoniacal thiosulphate is a better alternative for gold extraction as it is a non-toxic and environmentally safe to use by the mining companies as compared to the high toxic sodium cyanide system of gold extraction (Rath, 2003).

13
old/obsolete items being replaced to reduce the environmental impact (Stock, 2001; Rogers and
Tibben-Lembke, 2001; Sarkis, 2003). Mining companies use heavy mining machinery and equipment
requiring the replacement of expensive worn-out parts or components after running for certain
design hours or unforeseen breakdowns.
The use of RL initiatives by mining companies can generate substantial revenue from these older,
used assets, selling them as used pumps and motors to secondhand markets. Some of this equipment
may be put through component exchange programmes and sold back to the market. RL initiatives
benefits may include revenue gain, secondary raw material gain by suppliers, avoidance of
environmental issues related to improper disposal, raw material sustenance as a result of recycling
products, freeing up or reduce storage space, and eliminating the risk and environment impacts
involved in having them around (Cottrill, 1997; Atkinson, 2002).
Recovery activities (RA) decrease direct mining and mineral processing pollutants. RA may
include cyanide, arsenic and sulphide solution recovery, carbon recovery and mining of tailings
dams. During the adsorption stages of the extractive metallurgy, activated carbons are used for
mineral recovery. These carbons must be effectively activated by “regeneration” for repeated use
reducing fresh activated carbon purchase as input. Tailings contain fine-grained slurry mix with toxic
substances such as sulphide, arsenic, and cyanide, which requires proper handling (Driussi and Jansz,
2006). Even though excessive waters are removed using screw classifiers and thickeners prior to
discharging the tails into the dam, (Eswaraiah et al. 2012), yet tailings generally still remain 20%
saturated (Driussi and Jansz, 2006). As a result, the saturated solutions in the tailings are pump back
to the process plant for reuse reducing the amount of fresh chemical to be purchase and use as
input, and maximizing natural resources use by mining the remaining solid tails to recover the
minerals concentrate that was previously not captured.
14
Table 1 provides a summary of GSCM practices and sub-factors identified through literature and
confirmed through expert opinions from managers within the mining industry of Ghana.
[Table 1 about here]
2.2. Overview of Environmental Multi-Criteria Decision-Making in the Mining Industry
The past decade has seen an increasing volume of environmental management and supply chains
decision modeling. Evaluating these green initiatives and programs are multidimensional issues.
Thus, the need for and growth of MCDM tools to aid in these evaluations.
A number of efforts have occurred for general MCDM for environmental sciences decision
making in general (Huang et al., 2011). Yet, within this context the mining industry has had very
limited identified general application with only one article identified by Huang et al., 2011 (i.e.
Soltanmohammadi, et al., 2009). The development of MCDM approaches to sustainable supply
chains and green supplier selection has grown overall (Govidan et al., 2013). Researchers have
utilized a variety of similar MCDM approaches such as combined fuzzy-ANP and Fuzzy-
PROMETHEE (Tuzkava et al., 2009); generalized Fuzzy TOPSIS (Awasthi et al., 2010; Awasthi et
al, 2011) and fuzzy hierarchical TOPSIS (Wang et al., 2013) to investigate issues related to
sustainable supply chain planning and supplier selection. Thus, the application of fuzzy TOPSIS is a
good approach supported by the literature. But none of these and other MCDM approaches, until
this special issue (e.g. Sivakumar et al., 2014 and Jia et al., 2014), have focused primarily on the
mining industry. The inclusion of a filtering approach to help make TOPSIS and other MCDM
techniques easier to apply and accept by management has not been considered. This is why we
introduce rough set as an approach to initially filter the factors to a more manageable size for
environmental decision making. This filtering occurs with minimal loss of information from factor
reduction.

15
We now provide background to the methodology introduced in this paper with respect to jointly
linking up rough set theory with fuzzy TOPSIS.
2.3. Methodological Background
Now that we have a summary and hierarchical framework of GSCM practices applicable to the
mining industry, these multiple practices can serve as a foundation for tools evaluating GSCM
programs using multiple dimensional/criteria analysis. We now introduce two complementary tools
both with capabilities for multiple factor and dimensional analysis that will be an illustrative
application utilizing the GSCM practices facing the mining industry and introduced in the previous
section. The two techniques are rough set theory (entropy analysis) and TOPSIS, in a fuzzy logic
context.
2.3.1. Rough Set Theory and Methodology
Rough set theory (Pawlak, 1982) is a mathematical approach to evaluate process vagueness and
ambiguous data. The method classifies objects into similarity clusters, called elementary sets,
containing objects and evaluating these sets’ indiscernibility. The objects in a cluster may have a
relationship with the corresponding attributes. These similarity clusters are next employed to
determine hidden patterns, as in data mining (Cheng et al., 2010; Shyng et al., 2010; Bai and Sarkis,
2010). Rough set theory has significant application in data mining approaches and applied to the
management of a number of issues, including medical diagnosis, engineering reliability, expert
systems, empirical study of insurance data, and business failure prediction (Shyng et al., 2010).
In rough set theory, the lower and upper approximation operators are based on an equivalence
relation. Lower approximations describe the domain objects which definitely belong to the subset of
interest. Upper approximations describe objects which may possibly belong to the subset of interest.
The difference between the upper and the lower approximations constitutes a boundary region for
the vague set. Hence, rough set theory expresses vagueness by employing a boundary region of a set.

16
If the boundary region of a set is empty it means that the set is crisp, otherwise the set is rough
(inexact). Some notation and definitions are now introduced to help set the stage for the
multicriteria evaluation approach.
Definition1: Let U be the universe and let R be an equivalence relation on U. For any
subset UX ∈ , the pair ),( RUT = is called an approximation space.
The two subsets
{ |[ ] }RRX x U x X= ∈ ⊆ (1)
{ |[ ] }RRX x U x X φ= ∈ ≠ (2)
are called the R-lower (1) and R-upper (2) approximation of X, respectively.
( )RBN X RX RX= − (3)
Thus the R-boundary region of X is represented by expression (3). If ( )RBN X = 0, then we have a
crisp set, a ( )RBN X > 0 provides us with a rough set for our evaluation.
2.3.2. TOPSIS
TOPSIS (technique for order preference by similarity to an ideal solution) (Hwang and Yoon
1981) is a multiple criteria evaluation approach used to rank alternatives based on the shortest
distance from the ideal solution and the furthest distance from the negative-ideal (nadir) solution.
This method has been widely applied in the literature Error! Reference source not found..
Definition 2: Let S = (U, C, V, f ) be an “information system” where U is the universe, and C is
decision attribute sets for U; cc C
V V∈
= indicates the factor range of factor c; :f U C V× → is an
information function, that is for x U∀ ∈ if c C∈ then ( , ) cf x c V∈ .
The TOPSIS can be expressed the following steps:
(1) Determine the ideal and nadir solution.
17
1{ , , }
{(max ), (min )},m
ij ijii
P v vv j I v j J
+ + +=
= ∈ ∈
(4)
1{ , , }
{(min ), (max )},m
ij iji i
P v vv j I v j J
− − −=
= ∈ ∈
(5)
where I is associated with benefit criteria, and J is associated with cost criteria.
(2) Calculate the separation measures, using the n-dimensional Euclidean distance. The
separation of each alternative from the ideal solution is given as
2
1( ) , 1, , .
m
i ij jj
v v i nµ+ +
=
= − =∑ (6)
Similarly, the separation from the nadir solution is given as
2
1( ) , 1, , .
m
i ij jj
v v i nµ− −
=
= − =∑ (7)
(3) Calculate the relative closeness to the ideal solution. The relative closeness of the alternative
iP with respect to P+ is defined as
ii
i i
T µµ µ
−
+ −=+
(8)
(4) Rank the preference order. The larger the value of iT , the better the alternative iP . The best
alternative is the one with the greatest relative closeness to the ideal solution. Ranking for
alternatives can be completed using a decreasing order value for iT (Opricovic and Tzeng, 2004).
2.3.3. Triangular Fuzzy Numbers
A fuzzy number is a convex fuzzy set, characterized by a given interval of real numbers, each
with a grade of membership between 0 and 1. The most commonly used fuzzy numbers are

18
triangular fuzzy numbers. We now briefly introduce some basic definitions of the triangular fuzzy
number function.
The triangular fuzzy number is based on a three-value judgment: the minimum possible value lx ,
the most possible value mx and the maximum possible value ux . Then the definition of a triangular
fuzzy number is:
Definition 3: A triangular fuzzy number x can be defined by a triplet ( , , )l m ux x x . The membership
function is defined as Error! Reference source not found., depicted as in Figure 1.
( ) / ( ),1,
( )( ) / ( ),0,
l m l l m
mx
u u m m u
x x x x x x xx x
xx x x x x x x
otherwise
µ
− − ≤ < == − − < ≤
(9)
where l m ux x x≤ ≤ , and lx and ux are the lower and upper bounds of x , respectively. mx is the
mean of x .
[Figure 1 about here]
Obviously, if lx = mx = ux then the triangular fuzzy number x is reduced to a real number.
Thus, the triangular fuzzy number can be flexible to represent various semantics of uncertainty
(Li, 2012).
Definition 4: Let 1 1 1 1( , , )l m ux x x x= and 2 2 2 2( , , )l m ux x x x= be two triangular fuzzy numbers. The
triangular fuzzy number mathematical operations are defined asError! Reference source not
found.:
1 2 1 2 1 2 1 2( , , )l l m m u ux x x x x x x x⊕ = + + + (10)
1 2 1 2 1 2 1 2( , , )l l m m u ux x x x x x x x⊗ = (11)

19
1 1 11
2 2 2 2( , , )l m u
l m u
x x xxx x x x
=
(12)
( , , ), 0,l m ux x x x Rλ λ λ λ λ λ× = × × × ≥ ∈ (13)
Definition 5: Let the distance measure of two triangular fuzzy numbers be a Minkowski space
distance which is represented in expression (11) Error! Reference source not found..
11 2 1 2 1 2 1 2( , ) [1 3(( ) ( ) ( ) )]p p p p
l l m m u uL x x x x x x x x= − + − + − (11)
where p is some exponential power, in our application p = 2 (quadratic power).
3. ILLUSTRATIVE EXAMPLE
This hypothetical illustrative case will provide insights into application of rough set and fuzzy-
TOPSIS approaches for evaluation of programs based on GSCM practices. The technique proposed
is composed of two stages and nine steps and are summarized in Table 2. The methodology to
arrive at a final evaluation and/or ranking of GSCM practices is now presented. The first stage seeks
to populate a decision table and determine the relative importance weights using rough set
approaches.
[Table 2 about here]
Stage 1: Identify the Importance (Weight) of GSCM Practices by Rough Set
Step 1: Populate the Original Decision System (Table)
First, a decision table of GSCM practices needs to be formed. This decision table is defined by T
= (U, C, D, V, f), where U = {P1, P2, ... , Pm} is a set of m programs that have certain characteristics
of the GSCM practices called the universe. C = {c1, c2, ... , cn} is a set of n practices for the GSCM
called the condition attributes. D= {d1, d2, ...} a specific set of decision attributes representing
performance outcomes of programs as defined by decision makers. Where the f is a function used
to define the values V. In this case f is U × C → V is the description function.

20
For our illustrative case U = {Pi, i = 1, 2, ... , 30} (i.e. thirty programs) with thirty conditional
attributes C = {cj, j =1, 2, 3, ... , 30}. The conditional attributes are represented by the six major
practices (subdivided into sub-practices) for GSCM summarized in Table 1. For the illustration we
assume two decisions attributes d1 and d2. d1 represents a column whose outcome (decision
attribute) is environmentally oriented performance. It can be the amount of wastes generated,
resource consumption, or a number of other environmental performance categories. d2 represents a
column whose outcomes are business-oriented performance. It may include such characteristics of
cost, time, quality, flexibility in meeting volume requirements, etc.
Step 2: Evaluate and assign the level of GSCM practice involvement within each program.
There are two sub-steps in this step. First determine GSCM practice involvement for each
program. One way of completing this evaluation is for a team of managers, using historical
involvement data, to assign textual perceptual scores ranging from no involvement to very
significant practice involvement within each program (Vc). The hypothetical data in this illustrative
application is randomly generated by the authors for illustrative purposes. The thirty GSCM
practices have information functions that are discrete with 5 levels including No Involvement (NI),
Low Involvement (LI), Moderate Involvement (MI), High Involvement (HI) and Full Involvement
(FI) depending on level of involvement included in these programs. These discretized values may be
determined from either actual or perceptual data. For example, using high amount of energy
efficient hardware and data centers (GITS1) in a Program 1 will be assigned a textual perceptual
value of FI (i.e. 1( ,GITS1) FIf P = ). In some cases perceptual/intangible values may need to be
assigned. For example, the jointly develop environmental management solutions GSCM practice
may be less tangible and require managerial input on relative participation. Let us assume that
managerial input showed that Program 1 had low levels of involvement or participation in the
communicate goals of sustainability to suppliers (SSP5), then 1( ,SSP5) LIf P = .

21
Second, we make the textual evaluations of each program’s performance. The decision attributes
(performance data) are also assigned three levels (1- Low performance, 2-Moderate Performance,
and 3-High Performance). These values may also be assigned based on actual or perceptual data.
Discretizing the information helps in discrimination within the process. Two types of performance
data are included for the illustrative application (Environmental and Business performance). The
performance outcome and GSCM practice involvement level for each program are shown in Table
3.
[Table 3 about here]
The decision table to analyze the importance (weight) of each GSCM practice is now completed.
Step 3: Determine GSCM Practice Information Content for Weighting Purposes
One aspect of rough set theory (RS) is that of attribute reduction. Attribute reduction seeks to
remove superfluous attributes from information systems (decision tables) according to an attribute’s
information content Error! Reference source not found.. In this step we use rough set theory to
determine each GSCM practice information content and information content base on the
performance outcomes (the decision attributes). To complete these steps, the various ‘elementary
sets’ (X) of GSCM practices for the programs are determined.
The first step in this process is to determine how the level of information content across the
decision attribute (D) in the information system table using the expression (12) based on Liang et
al.(2006) .
21
1( )=1 | |U
Di
iI D X
U =
− ∑ (12)

22
In expression (12) ( )I D is the information content7 over the decision attribute (in this illustrative
case the GSCM program performance outcome), |U| is the cardinality of the universe of programs
(30 programs in our example). | DiX | is the number of programs with similar decision attribute
levels for a program i.
That is, two programs i and k are members of the same set only if d(i) = d(k) for a decision
attribute, where d (i) denotes the value of decision attribute d for program i. Expression (13)
describes this as a binary relationship between two elements in the set U with complete information
(Kryszkiewicz, 1998; Kryszkiewicz, 1999).
SIM( )={( , ) | , ( ) ( )}D i k U U d D d i d k∈ × ∀ ∈ = (13)
DiX is defined as the set of { | ( , ) SIM( )}i U i k D∈ ∈ . Thus, D
iX is the maximal set of objects which
are indiscernible by D with program i.
The second step in this process is to determine how the level of information content across the
conditional attributes ( jc ) given the decision attribute (D) by using the expression (14).
21
1( )=1 | |U
j ii
I c D XU =
− ∑ (14)
Expression (15) describes this as a binary relationship between two elements in the set U with a
decision attribute.
SIM( )={( , ) | , , ( ) ( ), ( ) ( )}j j j jc D i k U U c C d D c i c k d i d k∈ × ∀ ∈ ∈ = = (15)
Xi is defined as the set of { | ( , ) SIM( )}ji U i k c D∈ ∈ . Thus, Xi is the maximal set of objects which
are possibly indiscernible by jc and D with program i.
7 This term has also been defined as information entropy of a system (Liang and Shi, 2004).
23
As an example, program 1 has the same decision value as programs 3, 8, 17, 19, 21, and 24 with a
similar environmental performance attribute level, thus |X1| = 7. This situation also makes |X3|
=|X8| =|X17| =|X19| =|X21| =|X24| = 7. Another, program 1 is in the same GITS1 conditional
attribute level and decision attribute d1 as programs 3, 8, and 17, thus 11dX = 4. This situation also
makes 13dX = 1
8dX = 1
17dX = 4. See table 4 for the listing of each program information content
|Xj| and 1diX within the GITS1 conditional attribute.
[Table 4 about here]
Step 4: Determine Information Significance and Weight of each GSCM Practice
We have two sub-steps in this step. First, we identify the information significance of each of the
conditional attributes (GSCM Practices). The information significance will help to determine the
importance (weight) of practices that provide strong relationships with the performance outcomes.
To determine the information significance of a conditional attribute ( ( )jSig c ) we use expressions
(12), (14) and (16).
( ) ( ) ( )j jSig c I c D I D= − (16)
Expression (16) identifies the difference between the information content of a decision attribute
and the information content of the attribute set that does include the conditional attribute. Thus the
significance of the GSCM practice GITS1 is written as:
(GITS1) (GITS1 ) ( )Sig I D I D= −
From step 3 we know 1( )I d = 0.607. Using Expression (14) we calculate I(GITS1| d1) = 0.889.
Thus, Sig (GITS1) = 0.889 - 0.607 = 0.282. The other GSCM practices’ information significances
are shown in the Table 5.
24
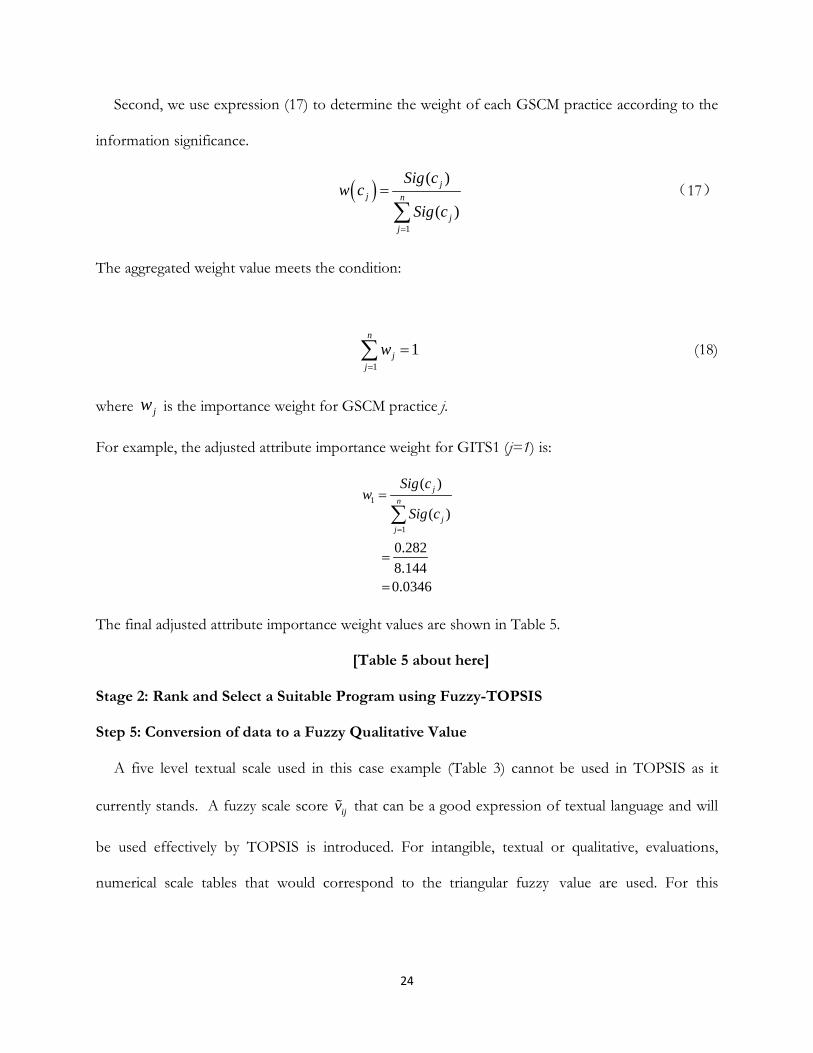
Second, we use expression (17) to determine the weight of each GSCM practice according to the
information significance.
( )1
( )
( )
jj n
jj
Sig cw c
Sig c=
=
∑ (17)
The aggregated weight value meets the condition:
11
n
jj
w=
=∑ (18)
where jw is the importance weight for GSCM practice j.
For example, the adjusted attribute importance weight for GITS1 (j=1) is:
1
1
( )
( )
0.2828.1440.0346
jn
jj
Sig cw
Sig c=
=
=
=
∑
The final adjusted attribute importance weight values are shown in Table 5.
[Table 5 about here]
Stage 2: Rank and Select a Suitable Program using Fuzzy-TOPSIS
Step 5: Conversion of data to a Fuzzy Qualitative Value
A five level textual scale used in this case example (Table 3) cannot be used in TOPSIS as it
currently stands. A fuzzy scale score ijv that can be a good expression of textual language and will
be used effectively by TOPSIS is introduced. For intangible, textual or qualitative, evaluations,
numerical scale tables that would correspond to the triangular fuzzy value are used. For this
25
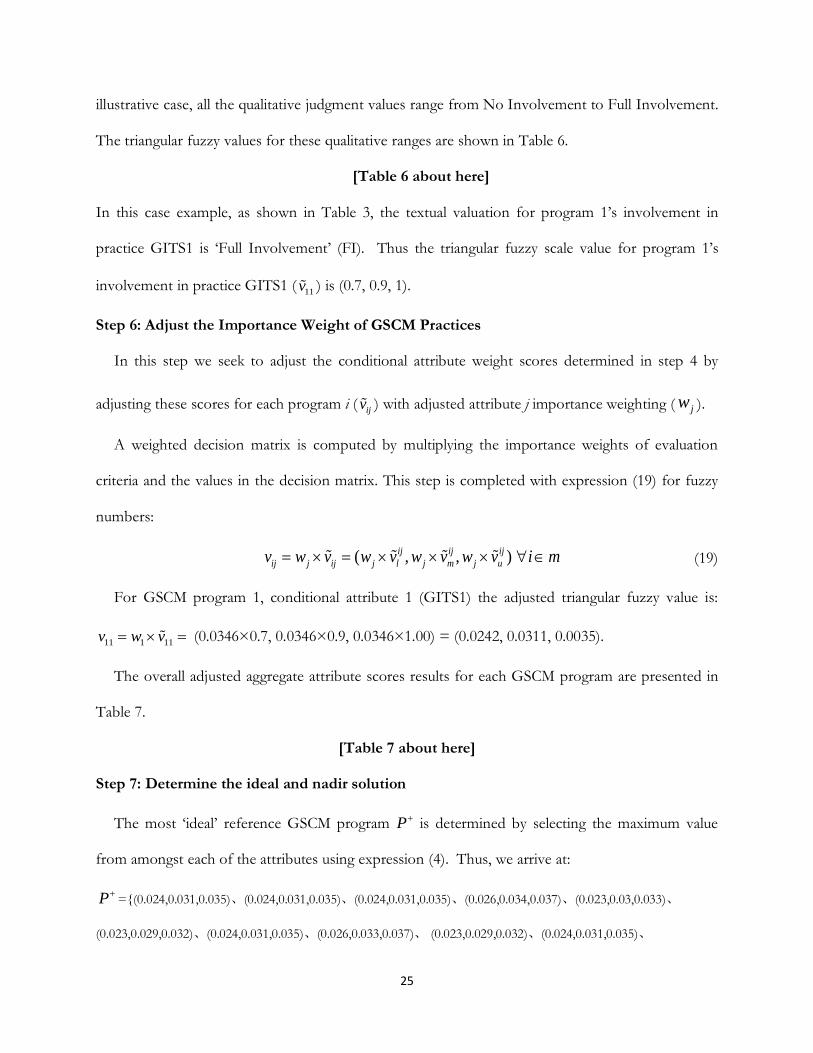
illustrative case, all the qualitative judgment values range from No Involvement to Full Involvement.
The triangular fuzzy values for these qualitative ranges are shown in Table 6.
[Table 6 about here]
In this case example, as shown in Table 3, the textual valuation for program 1’s involvement in
practice GITS1 is ‘Full Involvement’ (FI). Thus the triangular fuzzy scale value for program 1’s
involvement in practice GITS1 ( 11v ) is (0.7, 0.9, 1).
Step 6: Adjust the Importance Weight of GSCM Practices
In this step we seek to adjust the conditional attribute weight scores determined in step 4 by
adjusting these scores for each program i ( ijv ) with adjusted attribute j importance weighting ( jw ).
A weighted decision matrix is computed by multiplying the importance weights of evaluation
criteria and the values in the decision matrix. This step is completed with expression (19) for fuzzy
numbers:
( , , ) ij ij ij
ij j ij j l j m j uv w v w v w v w v i m= × = × × × ∀ ∈ (19)
For GSCM program 1, conditional attribute 1 (GITS1) the adjusted triangular fuzzy value is:
11 1 11v w v= × = (0.0346×0.7, 0.0346×0.9, 0.0346×1.00) = (0.0242, 0.0311, 0.0035).
The overall adjusted aggregate attribute scores results for each GSCM program are presented in
Table 7.
[Table 7 about here]
Step 7: Determine the ideal and nadir solution
The most ‘ideal’ reference GSCM program P+ is determined by selecting the maximum value
from amongst each of the attributes using expression (4). Thus, we arrive at:
P+ ={(0.024,0.031,0.035)、(0.024,0.031,0.035)、(0.024,0.031,0.035)、(0.026,0.034,0.037)、(0.023,0.03,0.033)、
(0.023,0.029,0.032)、(0.024,0.031,0.035)、(0.026,0.033,0.037)、 (0.023,0.029,0.032)、(0.024,0.031,0.035)、

26
(0.021,0.028,0.031)、(0.025,0.032,0.036)、(0.025,0.032,0.036)、(0.024,0.03,0.034)、(0.026,0.034,0.037)、
(0.019,0.024,0.027)、(0.025,0.032,0.036)、(0.024,0.03,0.034)、(0.021,0.027,0.03)、(0.023,0.03,0.034)、
(0.021,0.028,0.031)、(0.022,0.028,0.031)、(0.022,0.028,0.031)、(0.022,0.028,0.031)、(0.023,0.03,0.033)、
(0.015,0.021,0.028)、(0.024,0.03,0.034)、(0.025,0.032,0.036)、(0.022,0.028,0.032)、(0.024,0.031,0.034) }
Second, we will define the nadir reference GSCM program P− by selecting the minimum value
from amongst each of the attributes using expression (5). Thus, we arrive at:
P−= {(0,0.003,0.01)、(0,0.003,0.01)、(0,0.003,0.01)、(0,0.004,0.011)、(0,0.003,0.01)、(0,0.003,0.01)、(0,0.003,0.01)、
(0,0.004,0.011)、(0,0.003,0.01)、(0,0.003,0.01)、(0,0.003,0.009)、(0,0.004,0.011)、(0,0.004,0.011)、(0,0.003,0.01)、
(0,0.004,0.011)、(0,0.003,0.008)、(0,0.004,0.011)、(0,0.003,0.01)、(0.003,0.009,0.015)、(0,0.003,0.01)、(0,0.003,0.009)
、(0,0.003,0.009)、(0.003,0.009,0.016)、(0,0.003,0.009)、(0,0.003,0.01)、(0,0.003,0.009)、(0,0.003,0.01)、
(0,0.004,0.011)、(0,0.003,0.009)、(0,0.003,0.01)}
Step 8: Calculate the separation measures, using the n-dimensional Euclidean distance.
We will determine the difference between the ideal and negative-ideal reference GSCM program
and each of the respective comparative GSCM programs separately using expressions (6) and (7).
The separations iµ+ of each alternative from the ideal solution and the separations iµ
− of each
alternative from the negative-ideal solution are presented in columns 2 and 3 of Table 8.
[Table 8 about here]
Step 9: Calculate the relative closeness to the ideal solution.
The relative closeness of the GSCM program iP with respect to P+ is calculated using expression
(8). The separations iT of each alternative from the ideal solution are presented in column 4 of
Table 7.
Thus, with a score of 0.723 for the relative closeness, Program 08 is the most preferred GSCM
program from among the GSCM programs in the original set. We have just shown the results of an

27
analysis of the GSCM programs given a situation where business-oriented performance is
considered.
4. SENSITIVITY ANALYSIS
In the initial illustrative example and analysis we rank GSCM programs given a situation where
environmentally oriented performance (D=d1) is only considered. Additional scenarios could easily
be investigated to determine the robustness of the solution given this data set. Two possible
scenarios for sensitivity analysis of the solutions include focusing on a different decision attribute
(performance measure) or altering the weights of the conditional attributes. In this illustrative
sensitivity analysis the sensitivity of the GSCM programs ranking shift is evaluated by first choosing
the business decision attribute, and secondly by not considering a variable weighting for the
conditional attributes, an equal weighting across all conditional attributes. A sensitivity analysis will
help us to determine the impact of changing decision attribute or weight of attributes has on the
final ranking solution.
The results of all three scenarios (including the initial scenario case illustration) are shown in
Table 8. The results for the best and worse GSCM programs do not change in any of the scenarios,
but some ranks of GSCM programs have changed in both scenarios. An example of a shift is the
rank of Program05, which went from a rank of 19 when considering environmentally oriented
performance as the decision condition, a rank of 21 when considering the business oriented
performance decision condition. Program05 ranked 20th when no variations in weight occurred
across the conditional attributes. Overall, given these relatively minor shifts, we can state that the
solutions are relatively robust and that managers can be relatively confident with the solutions. But,
these results are more dependent on the data and the methodology introduced can determine
robustness. Managers should still be cautious in how they select performance to determine weights
and to carefully consider their evaluations.

28
Practically, these results also symbolize the importance with the decision attributes and provide
insights into the possible misapplication of a rough set tool that may have some decisions based on
criteria that are only part of the overall decision framework. Another issue is that the organization
needs to know how important it is for the company to achieve its environmentally oriented
performance relative to its business oriented performance. That is, weighting and integration of
multiple dimensions of performance can be integrated into the evaluation. There are many ways to
apply these tools and this is just one step in the process.
5. DISCUSSION AND CONCLUSION
The environmental issues facing mining organizations are extensive and pervasive. Their
impact resonates throughout the supply chain. Thus, understanding how various green supply
practices can influence mining industry environmental impact is an issue that requires investigation
and evaluation. This paper introduced a comprehensive framework for green supply chain practices
that can prove useful to management and researchers. The framework separates the practices into
six major factors groupings including Green Information Technology and Systems, Strategic
Suppliers Partnership, Operations and Logistics Integration, Internal Environmental Management,
Eco-Innovation Practices, and End-of-Life Practices. These factors were separated into 30 sub-
practices.
The comprehensive framework is only one possible framework, others have developed
variations and different categories (e.g. Zhu and Sarkis, 2004; Zhu, et al., 2008). The framework was
practically validated and partially developed using inputs from Ghanaian mining industry managers.
But, more thorough scientific and empirical validation is required, especially in the mining industry.
Most of the other frameworks developed did not explicitly focus on the mining industry. Thus, this
is one of the first that integrates issues facing the mining industry and mining industry input to be
developed.

29
The utility of this framework was shown through its application of evaluating organizational
programs that would seek to implement these practices at some level. Using a novel multiple
dimension multiple criteria methodology that integrated, for the first time, rough set theory and
fuzzy TOPSIS, an illustrative evaluation was completed to determine how well various programs
integrated these practices and their relative influence on overall environmental or business
performance. Those programs that showed good performance and integrated significant levels of
these practices were then ranked. Programs that covered the largest amount of highly influential on
performance green supply practices were ranked more highly.
These factors and the methodology introduced can be used to evaluate other strategic and
tactical decisions such as technologies, broader business processes, or even suppliers. Thus, there is
flexibility in application of both the framework and the methodology.
Although this research has a number of contributions, limitations and concerns do exist. These
limitations also provide ample opportunity for future research directions. For example, the
comprehensiveness and applicability of this framework for the mining industry requires additional
empirical investigation. Given that only a few managers were asked their opinion, a more careful and
scientific evaluation to cover a broader set of organizations, mining industries, and regions are
needed to determine how much each of these green supply practices are required or practiced.
From a methodological perspective, the evaluation was completed using hypothetical data.
Whether real data can be easily acquired and implemented within these frameworks needs
investigation. Whether managers find these tools and the results practically useful is another area
that requires additional investigation. The tools, although novel and potentially useful, require a
more thorough comparative analysis with other tools. For example, other weighting techniques such
as the use of scoring or the analytical hierarchy process (AHP) should be compared. The use of
rough set is advantageous because the weightings can be determined without any managerial input

30
(if all the data is historical/archival data for instance). AHP would require input from managers in
pairwise comparisons. But, whether this rough set weighting advantage offsets the validity of the
weights (i.e. are the rough set weights more valid than other techniques’ weight determination) needs
study.
Extensions of this work can also be completed by determining whether other tools can be
integrated (e.g. performance measurement tools to provide initial decision attribute performance
values), are additional avenues of future research.
We believe this paper sets an initial foundation for additional and needed research investigation
and practical application of green supply practices in the mining industry.
REFERENCES Allenby, B. R., Compton, W. D., & Richards, D. J. (2001). Information systems and the environment: Overview and perspectives. In D. J. Richards, B. R. Allenby, & W. D. Compton (Eds.), Information systems and the environment. Washington, D.C.: National Academy Press. Atkinson, W. (2002). Team turns costs of wastes into profits. Purchasing, 131(8), 22-4. Awasthi, A., Chauhan, S. S., & Goyal, S. K. (2010). A fuzzy multicriteria approach for evaluating environmental performance of suppliers. International Journal of Production Economics, 126(2), 370-378.
Awasthi, A., Chauhan, S. S., & Omrani, H. (2011). Application of fuzzy TOPSIS in evaluating sustainable transportation systems. Expert systems with Applications, 38(10), 12270-12280. Azevedo, S., Cudney, E.A. Grilo, A., Carvalho, H and Cruz-Machado, V (2012) “The influence of eco-innovation supply chain practices on business eco-efficiency”, University of Beira Interior, Missouri University of Science and Technology, Universidade Nova de Lisboa, MPRA Paper No. 42704, posted 18. November 2012 [online] Available from: http://mpra.ub.uni-muenchen.de/42704/ (Assessed: 10 September, 2013) Bai, C., & Sarkis, J. (2013). Green information technology strategic justification and evaluation. Information Systems Frontiers, 15(5), 831-847. Bai, C., & Sarkis, J. (2010). Integrating sustainability into supplier selection with grey system and rough set methodologies. International Journal of Production Economics, 124(1), 252-264.

31
Bai, C., Sarkis, J., Wei, X., & Koh, L. (2012). Evaluating ecological sustainable performance measures for supply chain management. Supply Chain Management: An International Journal, 17(1), 78-92. Baram, M. S., & Partan, D. G. (1990). Corporate Disclosure of Environmental Risks: US and European Law. Lexis Pub. Barla, P. (2007). ISO 14001 certification and environmental performance in Quebec's pulp and paper industry. Journal of environmental economics and management, 53(3), 291-306. Bell, J., Mollenkopf, D. A., & Stolze, H. (2013). Natural resource scarcity and the closed-loop supply chain: a resource-advantage view. International Journal of Physical Distribution & Logistics Management, 43(5), 2-12 Berl, A., Gelenbe, E., Di Girolamo, M., Giuliani, G., De Meer, H., Dang, M. Q., & Pentikousis, K. (2010). Energy-efficient cloud computing. The Computer Journal, 53(7), 1045-1051. Bowen, F. E., Cousins, P. D., Lamming, R. C., & Farukt, A. C. (2001). The role of supply management capabilities in green supply. Production and operations management, 10(2), 174-189. Brandenburg, M., Govindan, K., Sarkis, J., & Seuring, S. (2014). Quantitative models for sustainable supply chain management: Developments and directions. European Journal of Operational Research, 233(2), 299-312. Carter, C. R., & Easton, P. L. (2011). Sustainable supply chain management: evolution and future directions. International Journal of Physical Distribution & Logistics Management, 41(1), 46-62. Chen, C. T. (2000). Extensions of the TOPSIS for group decision-making under fuzzy environment. Fuzzy sets and systems, 114(1), 1-9. Chen, I. J., & Paulraj, A. (2004). Towards a theory of supply chain management: the constructs and measurements. Journal of operations management, 22(2), 119-150. Chen, M. F., & Tzeng, G. H. (2004). Combining grey relation and TOPSIS concepts for selecting an expatriate host country. Mathematical and Computer Modelling, 40(13), 1473-1490. Chen, S. J. J., Hwang, C. L., Beckmann, M. J., & Krelle, W. (1992). Fuzzy multiple attribute decision making: methods and applications. Springer-Verlag New York, Inc. Cheng, J. H., Chen, H. P., & Lin, Y. M. (2010). A hybrid forecast marketing timing model based on probabilistic neural network, rough set and C4. 5. Expert systems with Applications, 37(3), 1814-1820 Chou, D. C., & Chou, A. Y. (2012). Awareness of Green IT and its value model. Computer Standards & Interfaces, 34(5), 447-451. Christopher, M., (2005). Logistics and Supply Chain Management: Creating Value-adding Networks. 3rd ed., Prentice-Hall, Englewood Cliffs, NJ

32
Christopher, M. (2010). Logistics and supply chain management. Financial Times/Prentice Hall. Cottrill, K. (1997). Turning trash into profit. Journal of Business Strategy, 18(4), 30-35. Curkovic, S., Melnyk, S. A., Handfield, R. B., & Calantone, R. (2000). Investigating the Linkage Between Total Quality Management and Environmentally Responsible Manufacturing. IEEE Transactions on Engineering Management, 47(4), 444-463 Dobele, A. R., Westberg, K., Steel, M., & Flowers, K. (2014). An examination of corporate social responsibility implementation and stakeholder engagement: A case study in the Australian mining industry. Business Strategy and the Environment, 23(3), 145-159. Driussi, C., & Jansz, J. (2006). Technological options for waste minimisation in the mining industry. Journal of Cleaner Production, 14(8), 682-688. Dubois, D., & Prade, H. (1980). Systems of linear fuzzy constraints. Fuzzy Sets and Systems, 3(1), 37-48. Eswaraiah, C. Biswal, S.K. and Mishra, B.K. (2012). Settling characteristics of ultrafine iron ore slimes, International Journal of Minerals, Metallurgy and Materials, 19(2), 95-99. Faucheux, S., & Nicolaï, I. (2011). IT for green and green IT: A proposed typology of eco-innovation. Ecological Economics, 70(11), 2020-2027. Geffen, C. A., & Rothenberg, S. (2000). Suppliers and environmental innovation: the automotive paint process. International Journal of Operations & Production Management, 20(2), 166-186. Govindan, K., Khodaverdi, R., & Jafarian, A. (2013). A fuzzy multi criteria approach for measuring sustainability performance of a supplier based on triple bottom line approach. Journal of Cleaner Production, 47, 345-354. Gunasekaran, A., & Ngai, E. W. (2004). Information systems in supply chain integration and management. European Journal of Operational Research, 159(2), 269-295. Gunasekaran, A., Patel, C., & Tirtiroglu, E. (2001). Performance measures and metrics in a supply chain environment. International journal of operations & production Management, 21(1/2), 71-87. Gunasekaran, A., Patel, C., & McGaughey, R. E. (2004). A framework for supply chain performance measurement. International journal of production economics, 87(3), 333-347. Hilson, G. (2000). Barriers to implementing cleaner technologies and cleaner production (CP) practices in the mining industry: a case study of the Americas. Minerals Engineering, 13(7), 699-717. Hilson, G., & Nayee, V. (2002). Environmental management system implementation in the mining industry: a key to achieving cleaner production. International journal of mineral processing, 64(1), 19-41. Huang, I. B., Keisler, J., & Linkov, I. (2011). Multi-criteria decision analysis in environmental sciences: ten years of applications and trends. Science of the total environment, 409(19), 3578-3594.

33
Hwang, C. L., & Yoon, K. (1981). Multiple attribute decision making. Berlin: Springer. Jenkin, T. A., Webster, J., & McShane, L. (2011). An agenda for ‘Green’information technology and systems research. Information and Organization, 21(1), 17-40. Jia, P., Diabat, A., & Mathiyazhagan, K. (2014). Analyzing the SSCM practices in the mining and mineral industry by ISM approach. Resources Policy. Kemp, R. and T. Foxon (2007). Eco-innovation from an innovation dynamics perspective: Deliverable 1 of MEI project (D1). Project Report [online].Available from: http://www.merit.unu.edu/MEI/ (Assessed: 10 September, 2013) Kleindorfer, P. R., Singhal, K., & Wassenhove, L. N. (2005). Sustainable operations management. Production and operations management, 14(4), 482-492. Krohling, R. A., & Campanharo, V. C. (2011). Fuzzy TOPSIS for group decision making: A case study for accidents with oil spill in the sea. Expert Systems with Applications, 38(4), 4190-4197. Kryszkiewicz, M. (1998). Rough set approach to incomplete information systems. Information sciences, 112(1), 39-49. Kryszkiewicz, M. (1999). Rules in incomplete information systems. Information Sciences, 113(3), 271-292. Lenzen, M., Murray, J., Sack, F., & Wiedmann, T. (2007). Shared producer and consumer responsibility—theory and practice. Ecological Economics, 61(1), 27-42. Liang, J., Shi, Z., Li, D., & Wierman, M. J. (2006). Information entropy, rough entropy and knowledge granulation in incomplete information systems. International Journal of general systems, 35(6), 641-654. Li, D. F. (2012). A fast approach to compute fuzzy values of matrix games with payoffs of triangular fuzzy numbers. European Journal of Operational Research, 223(2), 421-429. Lutandula, M. S., & Maloba, B. (2013). Recovery of cobalt and copper through reprocessing of tailings from flotation of oxidised ores. Journal of Environmental Chemical Engineering, 1(4), 1085-1090. Mentzer, J. T., Min, S., & Zacharia, Z. G. (2000). The nature of interfirm partnering in supply chain management. Journal of Retailing, 76(4), 549-568 Min, H., & Galle, W. P. (2001). Green purchasing practices of US firms. International Journal of Operations & Production Management, 21(9), 1222-1238. Muduli, K., Govindan, K., Barve, A., Kannan, D., & Geng, Y. (2013). Role of behavioural factors in green supply chain management implementation in Indian mining industries. Resources, Conservation and Recycling, 76: 50–60

34
Mzembe, A. N., & Meaton, J. (2013). Driving Corporate Social Responsibility in the Malawian Mining Industry: A Stakeholder Perspective. Corporate Social Responsibility and Environmental Management. Forthcoming, DOI: 10.1002/csr.1319.
Opricovic, S., & Tzeng, G. H. (2004). Compromise solution by MCDM methods: A comparative analysis of VIKOR and TOPSIS. European Journal of Operational Research, 156(2), 445-455. Paulraj, A. (2009). Environmental motivations: a classification scheme and its impact on environmental strategies and practices. Business Strategy and the Environment, 18(7), 453-468. Pawlak, Z. (1982). Rough sets. International Journal of Computer & Information Sciences, 11(5), 341-356. Poulton, M. M., Jagers, S. C., Linde, S., Van Zyl, D., Danielson, L. J., & Matti, S. (2013). State of the World s Nonfuel Mineral Resources: Supply, Demand, and Socioinstitutional Fundamentals. Annual Review of Environment and Resources, 38(1), 345-371.
Rao, P. (2002). Greening the supply chain: a new initiative in South East Asia. International Journal of Operations & Production Management, 22(6), 632-655. Rao, P., & Holt, D. (2005). Do green supply chains lead to competitiveness and economic performance?. International Journal of Operations & Production Management, 25(9), 898-916. Rath, R. K., Hiroyoshi, N., Tsunekawa, M., & Hirajima, T. (2003). Ammoniacal thiosulphate leaching of gold ore. ejmp & ep (European Journal of Mineral Processing and Environmental Protection), 3(3), 344-352. Rogers, D. S., & Tibben‐Lembke, R. (2001). An examination of reverse logistics practices. Journal of business Logistics, 22(2), 129-148.
Sarkis, J., & Cordeiro, J. J. (2001). An empirical evaluation of environmental efficiencies and firm performance: pollution prevention versus end-of-pipe practice. European Journal of Operational Research, 135(1), 102-113. Sarkis, J. (2003). A strategic decision framework for green supply chain management. Journal of cleaner production, 11(4), 397-409. Sarkis, J., & Zhu, H. (2008). Information technology and systems in China's circular economy: implications for sustainability. Journal of Systems and Information Technology, 10(3), 202-217. Soltanmohammadi, H., Osanloo, M., & Bazzazi, A. A. (2009). Deriving preference order of post-mining land-uses through MLSA framework: application of an outranking technique. Environmental geology, 58(4), 877-888. Setterstrom, A. (2008). The natural resource-base view of a firm: Strategic opportunities in IT. Paper presented at the Annual Academy of Management Meetings, Anaheim, CA Seuring, S. (2013). A review of modeling approaches for sustainable supply chain management. Decision Support Systems, 54(4), 1513-1520.

35
Shyng, J. Y., Shieh, H. M., & Tzeng, G. H. (2010). An integration method combining Rough Set Theory with formal concept analysis for personal investment portfolios. Knowledge-Based Systems, 23(6), 586-597. Simpson, D. F., & Power, D. J. (2005). Use the supply relationship to develop lean and green suppliers. Supply Chain Management: An International Journal, 10(1), 60-68. Simpson, D., Power, D., & Samson, D. (2007). Greening the automotive supply chain: a relationship perspective. International Journal of Operations & Production Management, 27(1), 28-48. Sivakumar, R., Devika Kannan, and P. Murugesan. (2014). Green vendor evaluation and selection using AHP and Taguchi loss functions in production outsourcing in mining industry. Resources Policy. Spekman, R. E., & Carraway, R. (2006). Making the transition to collaborative buyer–seller relationships: An emerging framework. Industrial Marketing Management, 35(1), 10-19. Stock, G. N., Greis, N. P., & Kasarda, J. D. (1999). Logistics, strategy and structure: a conceptual framework. International Journal of Physical Distribution & Logistics Management, 29(4), 224-239. Stock, G. N., Greis, N. P., & Kasarda, J. D. (2000). Enterprise logistics and supply chain structure: the role of fit. Journal of Operations Management, 18(5), 531-547. Stock, J. R. (2001). Reverse logistics in the supply chain. Revista Transport & Logistics, 44. Tan, K.C., Lyman, S., & Wisner, J. (2002). Supply chain management: a strategic perspective. International Journal of Operations and Production Management, 22 (6), 614-631.
Tuzkaya, G., Ozgen, A., Ozgen, D., & Tuzkaya, U. R. (2009). Environmental performance evaluation of suppliers: A hybrid fuzzy multi-criteria decision approach. International Journal of Environmental Science & Technology, 6(3), 477-490.
Uddin, M., & Rahman, A. A. (2012). Energy efficiency and low carbon enabler green IT framework for data centers considering green metrics. Renewable and Sustainable Energy Reviews, 16(6), 4078-4094. Vachon, S. (2007). Green supply chain practices and the selection of environmental technologies. International Journal of Production Research, 45(18-19), 4357-4379. Vachon, S. (2013). Technological Capacity and Environmental Performance: A Research Note Using Country Level Data. Journal of Operations and Supply Chain Management, 1(1), 21-28. Vachon, S., & Klassen, R. D. (2006a). Extending Green Practices across the Supply Chain: The Impact of Upstream and Downstream Integration. International Journal of Operations and Production Management, 26(7), 795-821. Vachon, S., & Klassen, R. D. (2006b). Green Project Partnership in the Supply Chain: The Case of the Package Printing Industry. Journal of Cleaner Production, 14(6-7), 661-671.

36
Vachon, S., & Klassen, R. D. (2008). Environmental management and manufacturing performance: the role of collaboration in the supply chain. International Journal of Production Economics, 111(2), 299-315. Vachon, S., & Mao, Z. (2008). Linking Supply Chain Strength to Sustainable Development: A Country-Level Analysis. Journal of Cleaner Production, 16(15), 1552-1560. Vachon, S., Klassen, R.D. and Johnson, P.F. (2001). Customers as Green Suppliers: Managing the Complexity of the Reverse Supply Chain. In Greening Manufacturing: From Design to Delivery and Back, edited by J. Sarkis, (Greenleaf publisher: Sheffield, UK). Wagner, S., Hespenheide, E., & Pavlovsky, K. (2009). The responsible and sustainable board. Deloitte Review Issue, 4, 59-71. Watson, R. T., Boudreau, M. C., Chen, A., & Huber, M. H. (2008). Green IS: Building sustainable business practices. In R. T. Watson (Ed.), Information Systems. Athens, GA, USA: Global Text Project Wee, Y. S., & Quazi, H. A. (2005). Development and validation of critical factors of environmental management. Industrial Management & Data Systems, 105(1), 96-114. Wang, X., & Gaustad, G. (2012). Prioritizing material recovery for end-of-life printed circuit boards. Waste Management, 32(10), 1903-1913. Wang, X., & Chan, H. K. (2013). A hierarchical fuzzy TOPSIS approach to assess improvement areas when implementing green supply chain initiatives. International Journal of Production Research, 51(10), 3117-3130. Yu, V. F., & Hu, K. J. (2010). An integrated fuzzy multi-criteria approach for the performance evaluation of multiple manufacturing plants. Computers & Industrial Engineering, 58(2), 269-277. Zhu, Q., & Sarkis, J. (2004). Relationships between operational practices and performance among early adopters of green supply chain management practices in Chinese manufacturing enterprises. Journal of Operations Management, 22(3), 265-289. Zhu, Q., Sarkis, J., & Lai, K. H. (2008). Confirmation of a measurement model for green supply chain management practices implementation. International Journal of Production Economics, 111(2), 261-273. Zsidisin, G. A., & Hendrick, T. E. (1998). Purchasing’s involvement in environmental issues: a multi-country perspective. Industrial Management & Data Systems, 98(7), 313-320.

37
Figure 1 A triangular fuzzy number x
0
1
lx ux
( )x xµ
mx
x

38
Table 1. GSCM practices (factors) and their sub-factors in the mining industry Pos GSCM Factors and Sub-factors Literature
1 Green Information Technology and Systems (GITS)
Sub-
Fact
ors
GITS1 Use of energy efficient hardware and data centers Watson et al., 2008; Jenkin et al., 2011; Chou et al., 2012; Setterstrom, 2008; Sarkis and Zhu,
2008: Wagner et al., 2009; Uddin and Rahman, 2012
GITS2 Consolidating servers using virtualization software GITS3 Reducing waste associated with obsolete equipment GITS4 Collaborative group software and telepresence systems
GITS5 Eco-labeling of IT products
2 Strategic Suppliers Partnership (SSP)
Sub-
Fact
ors
SSP1 Jointly develop environmental management solutions
Vachon et al. 2001; Rao 2002; Geffen and Rothenberg 2000,
Simpson and Power, 2005; Simpson et al., 2007
SSP2 Jointly build programs to reduce or eliminate materials use SSP3 Share environmental management techniques and knowledge
SSP4 Collaborate with suppliers to manage reverse flows of materials and packaging
SSP5 Communicate goals of sustainability to suppliers
SSP6 Monitor environmental compliance status and practices of supplier’s operations
3 Operations and Logistics Integration (OLI)
Sub-
Fact
ors
OLI1 Lean and green operations Kleindorfer, 2005; Hajmohammed et al.,
2012; Vachon, 2007; Wee & Quazi, 2005; Min and Galle, 2001; Carter and Easton, 2011; Zsidisin
and Hendrick, 1998
OLI2 Process redesign to reduce use of scarce or toxic resources and energy consumption
OLI3 Community/environmental, employee health and safety concerns
OLI4 Internal process integration and production automation
4 Internal Environmental Management (IEM)
Sub-
Fact
ors
IEM1 Total quality environment management Vachon and Klassen, 2008; Min and Gall, 2001;
Azevedo et al., 2012; Simpson et al., 2007; Vachon and Klassen,
2006a; Baram and Partan, 1990
IEM2 Environmental compliance monitoring and auditing IEM3 Pollution prevention plans IEM4 Environmental manager and training for employees
IEM5 Environmental standards/ISO14001 certification by suppliers
IEM6 Employee incentive programs for environmental suggestions
5 Eco-Innovation practices(ECO)
Sub-
Fact
ors
ECO1 Substituting toxic inputs with environmentally friendly ones Carter and Easton, 2011; Vachon, 2013; Azevedo
et al., 2012; Paulraj, 2009; Rao & Holt, 2005
ECO2 Use of fewer inputs to minimize the environmental risks and impacts
ECO3 Switching from "dirty" to cleaner technologies ECO4 Internal recycling of inputs, materials and wastes
6 End-of-Life practices (EOL)
Sub-
Fact
ors
EOL1 Resale of used parts or components Stock, 2001; Sarkis, 2003;
Rogers and Tibben-Lembke, 2001; Bell et al.,
2013
EOL2 Recondition and refurbishing of used parts or components EOL3 Old/obsolete items being replaced
EOL4 Cyanide and arsenic solution recovery and carbon regeneration
EOL5 Mining of Tailings

39
Table.2 Overview of Rough set and fuzzy-TOPSIS methodology for Green Supply Chain Practices No Activity Activity description Stage 1: Identify the Importance (Weight) of GSCM Practices by Rough Set Step
1 Build Original Decision System (Table)
The decision table should be comprised of matrix with m programs (evaluation alternatives) in the row and n practices (criteria to be used in evaluating the programs/alternatives) and k performance outcomes.
Step 2
Evaluate and assign the level of GSCM practice involvement within each program
Sub-step 1. Managers can allocate historic data to each cell in the matrix or evaluate the importance of each practice on each program and assign perceptual data using the 5-point measurement scale from No Involvement (NI) to Full Involvement (FI). Sub-step 2. Managers allocate another set of actual/historic data of the importance of each program on the performance outcome or perceptual data are assigned using a 3 point measurement scale (1- Low performance, 2-Moderate Performance, and 3-High Performance).
Step 3
Determine GSCM Practice Information Content for Weighting Purposes
Sub-step 1. Information content for each decision attributes/variables with respect to the programs is determined. Sub-step 2. Information content for each of the conditional attributes/evaluation criteria (e.g. GITS1) is determined.
Step 4
Determine Information Significance and Weight of each GSCM Practice
Sub-step 1. Information significance of the each conditional attribute or evaluation criteria is determined by the difference between the information content for a specific conditional attribute/evaluation criterion, for a given decision attribute/variable, and information content for other decision attributes/variables. Sub-step 2. The weight of each conditional attribute/evaluation criterion according to the information significance is determined by dividing the information significance of each conditional attribute/criterion by the total information significance in the evaluation table
Stage 2: Rank and Select a Suitable Program using Fuzzy-TOPSIS Step
5 Conversion of data to a Fuzzy Qualitative Value
Equivalent triangular fuzzy values are used to replace the textual scale to assign the values in the decision table.
Step 6
Adjust the Importance Weight of GSCM Practices
A weighted decision matrix is computed by multiplying the importance weights of each corresponding evaluation criterion in the decision matrix.
Step Determine the ideal and nadir Sub-step 1. The ‘ideal’ reference value for evaluation

40
7 solution
program P+ is determined by selecting the maximum value from each of the attributes/evaluation criteria. Sub-step 2. The ‘nadir’ reference of the evaluation program P− is determined by selecting the minimum value from amongst each of the attributes/evaluation criteria
Step 8
Calculate the separation measures, using the n-dimensional Euclidean distance.
Sub-step 1. The separation of each alternative from the ideal solution is determined Sub-step 2. The separation of each alternative from the nadir solution is determined
Step 9
Calculate the relative closeness to the ideal solution and rank the preference order.
Sub-step 1. The relative closeness of the alternative
iP (e.g. Program 1) with respect to P+ (‘ideal’ reference) is computed. Sub-step 2. The ranking of the preference order is then followed. The larger the value of iT (relative closeness), the better the alternative iP . Thus, the best alternative is the one with the greatest relative closeness to the ideal solution.

41
Table 3: Information System Table for GSCM practices Involvement and Normalized Aggregate Performance Outcome.
Green Information Technology and Systems (GITS) Strategic Suppliers Partnership (SSP) Operations and logistics
integration (IOLI) Internal environmental management (IEM) Eco-innovation practices(ECO) End-of-life practices (EOL) Performance
GITS1
GITS2
GITS3
GITS4
GITS5
SSP1
SSP2
SSP3
SSP4
SSP5
SSP6
OLI1
OLI2
OLI3
OLI4
IEM1
IEM2
IEM3
IEM4
IEM5
IEM6
ECO1
ECO2
ECO3
ECO4
EOL1
EOL2
EOL3
EOL4
EOL5
d1
d2
Program01 FI MI FI MI HI FI FI HI FI LI MI FI MI HI FI LI FI HI HI HI NI HI HI HI NI LI NI HI MI HI 3 3 Program02 LI MI NI HI NI MI HI MI MI HI MI HI HI LI FI LI HI NI LI NI MI LI MI LI NI HI NI NI NI NI 1 2 Program03 FI FI MI LI MI HI HI FI MI MI HI LI FI MI MI HI MI HI FI HI NI FI FI HI NI HI FI HI MI FI 3 3 Program04 LI MI NI HI NI LI LI NI NI LI FI LI NI NI HI FI MI NI MI MI NI LI FI NI MI HI MI MI LI FI 1 2 Program05 HI FI LI LI FI MI HI LI MI NI MI NI LI NI LI MI LI MI LI FI LI MI HI FI LI MI LI HI NI HI 2 2 Program06 LI FI MI LI HI FI FI MI LI FI LI MI HI FI LI MI LI MI MI MI NI LI FI NI MI HI MI FI LI HI 2 2 Program07 LI FI MI LI HI FI FI MI MI HI MI HI HI LI FI LI HI LI MI NI MI NI LI NI LI MI LI MI FI NI 2 1
Program08 FI LI MI HI MI FI HI HI FI HI NI HI FI HI NI MI HI HI FI HI MI FI HI HI FI MI FI HI FI HI 3 3
Program09 MI LI FI HI LI MI MI FI FI MI LI NI HI HI MI LI MI MI MI HI MI HI HI LI FI LI HI FI LI HI 2 1 Program10 MI LI MI FI LI LI NI MI LI MI FI LI LI NI NI HI NI LI MI NI MI NI LI MI LI MI LI LI LI FI 1 1 Program11 HI HI LI FI HI FI HI NI LI NI MI LI MI LI NI HI NI FI LI MI MI MI HI HI LI MI FI FI NI FI 2 2
Program12 NI LI MI LI MI LI MI LI LI LI MI NI NI LI MI LI NI NI FI LI MI LI MI LI MI LI MI NI NI NI 1 1
Program13 MI LI FI HI MI LI MI MI LI FI HI LI LI MI HI LI HI NI MI MI NI LI FI NI MI HI MI HI MI HI 2 1
Program14 HI LI NI MI LI NI LI HI FI LI MI FI MI HI FI LI FI LI MI NI MI NI LI NI LI MI LI HI NI HI 2 3
Program15 MI MI HI FI HI MI LI FI FI MI LI NI HI HI MI LI MI MI LI FI LI MI HI FI LI MI LI NI LI FI 2 3
Program16 LI HI LI MI MI MI LI LI FI MI LI HI FI FI LI LI HI HI HI HI NI HI FI HI NI LI NI LI MI LI 2 2
Program17 FI MI MI HI MI HI HI FI HI FI NI HI FI FI LI NI MI FI FI MI LI MI HI HI MI LI MI NI MI LI 3 2
Program18 MI MI MI NI LI MI NI NI MI MI NI LI FI NI MI HI MI MI LI MI FI LI LI NI NI HI NI HI NI HI 1 1
Program19 MI MI HI FI HI MI LI LI HI LI MI MI MI LI HI HI MI HI FI HI MI FI MI HI FI LI FI NI MI LI 3 2 Program20 LI HI LI MI MI MI LI LI HI LI MI MI MI LI HI FI MI FI FI MI LI NI HI HI MI LI MI NI NI NI 2 2
Program21 HI HI LI FI HI HI HI MI MI HI MI HI HI LI FI LI HI LI FI MI LI HI FI FI LI LI HI MI LI FI 3 2
Program22 NI MI MI NI LI FI NI HI FI LI MI FI MI HI FI LI FI FI HI FI NI HI FI FI LI NI MI LI MI NI 2 1 Program23 NI MI MI NI LI FI NI HI HI HI NI HI FI HI NI LI NI NI MI MI NI LI FI NI MI HI MI HI MI HI 2 1 Program24 HI FI LI LI FI MI HI FI LI MI MI MI HI HI LI MI FI HI FI LI HI FI MI HI FI LI FI MI MI LI 3 3 Program25 FI FI MI LI MI MI HI LI FI MI LI HI FI FI LI LI HI HI HI HI NI HI FI HI NI LI NI LI MI MI 2 3 Program26 LI MI NI HI NI LI HI FI FI MI LI NI HI HI MI LI MI NI FI MI LI HI FI FI LI LI HI FI MI HI 2 1 Program27 LI HI LI MI MI MI LI NI FI MI LI HI FI FI LI LI LI LI HI LI MI NI MI LI HI LI MI HI FI LI 2 2 Program28 HI MI NI MI LI NI LI LI HI LI MI MI MI LI HI LI MI NI LI NI MI LI LI LI NI NI NI MI NI MI 1 3 Program29 MI LI FI HI MI LI MI MI LI MI FI LI LI NI NI HI NI HI HI HI NI HI HI HI NI LI NI LI NI LI 2 1 Program30 NI NI LI FI LI NI NI NI LI NI MI LI MI LI NI MI NI NI LI NI MI LI MI LI NI HI NI NI MI NI 1 1

42
Table 4: Objects Count in an Elementary set Based on Similar Attribute Values of Programs.
Program | DiX | | iX |
Program01 7 4 Program02 7 2
Program03 7 4
Program04 7 2
Program05 16 3
Program06 16 6
Program07 16 6
Program08 7 4
Program09 16 4
Program10 7 2
Program11 16 3 Program12 7 2 Program13 16 4
Program14 16 3
Program15 16 4
Program16 16 6
Program17 7 4
Program18 7 2
Program19 7 1
Program20 16 6
Program21 7 2
Program22 16 2
Program23 16 2
Program24 7 2
Program25 16 1
Program26 16 6
Program27 16 6
Program28 7 1
Program29 16 4
Program30 7 2

43
Table 5: The Weight and Information Significance of GSCM practices. GSCM
practices Information Significance Weight
GITS1 0.282 0.0346
GITS2 0.282 0.0346
GITS3 0.284 0.0349
GITS4 0.304 0.0373
GITS5 0.271 0.0333
SSP1 0.262 0.0322
SSP2 0.282 0.0346
SSP3 0.297 0.0365
SSP4 0.264 0.0324
SSP5 0.284 0.0349
SSP6 0.249 0.0306
OLI1 0.291 0.0357
OLI2 0.289 0.0355
OLI3 0.275 0.0338
OLI4 0.304 0.0373
IEM1 0.217 0.0266
IEM2 0.293 0.036
IEM3 0.275 0.0338
IEM4 0.246 0.0302
IEM5 0.273 0.0335
IEM6 0.249 0.0306
ECO1 0.251 0.0308
ECO2 0.253 0.0311
ECO3 0.251 0.0308
ECO4 0.269 0.033
EOL1 0.249 0.0306
EOL2 0.275 0.0338
EOL3 0.289 0.0355
EOL4 0.257 0.0316
EOL5 0.277 0.034
Table 6. The linguistic variables and their corresponding triangle fuzzy numbers. linguistic variables triangular fuzzy numbers v
No Involvement (NI) (0,0.1,0.3) Low Involvement (LI) (0.1,0.3,0.5) Moderate Involvement (MI) (0.3,0.5,0.7) High Involvement (HI) (0.5,0.7,0.9) Full Involvement (FI) (0.7,0.9,1.0)
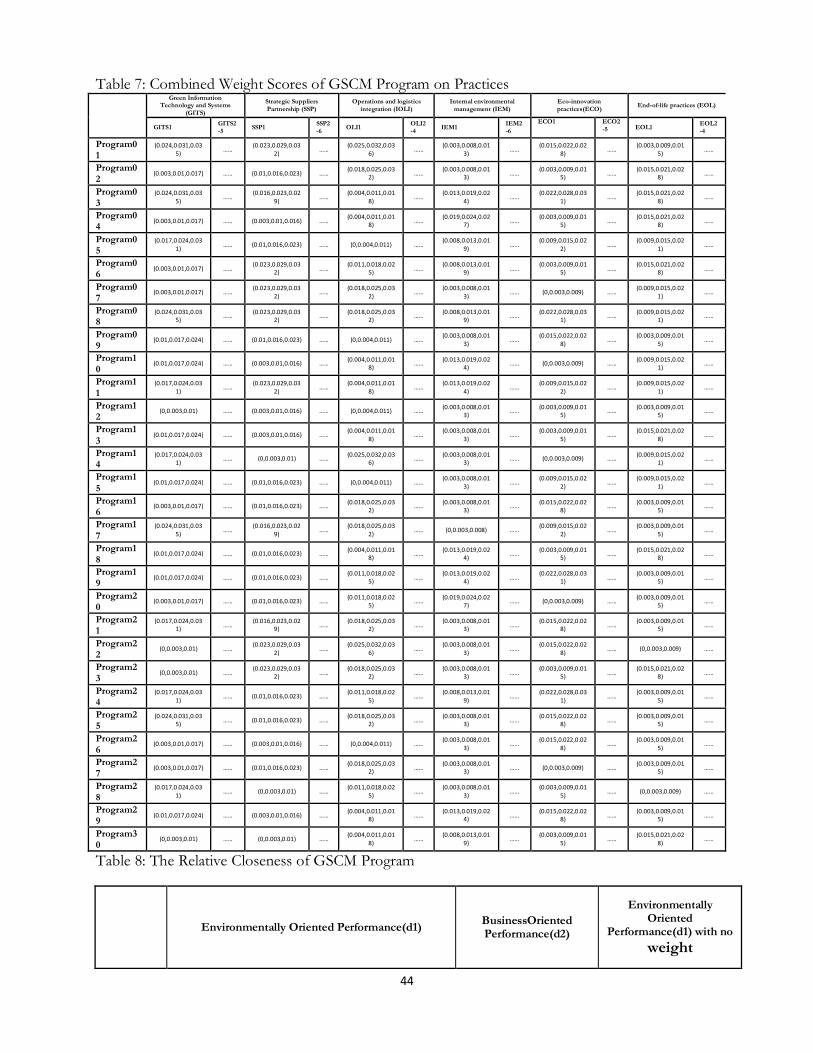
44
Table 7: Combined Weight Scores of GSCM Program on Practices
Green Information Technology and Systems
(GITS)
Strategic Suppliers Partnership (SSP)
Operations and logistics integration (IOLI)
Internal environmental management (IEM)
Eco-innovation practices(ECO) End-of-life practices (EOL)
GITS1 GITS2-5 SSP1 SSP2
-6 OLI1 OLI2-4 IEM1 IEM2
-6 ECO1 ECO2
-5 EOL1 EOL2-4
Program01
(0.024,0.031,0.035) …… (0.023,0.029,0.03
2) …… (0.025,0.032,0.036) …… (0.003,0.008,0.01
3) …… (0.015,0.022,0.028) …… (0.003,0.009,0.01
5) ……
Program02
(0.003,0.01,0.017) …… (0.01,0.016,0.023) …… (0.018,0.025,0.032) …… (0.003,0.008,0.01
3) …… (0.003,0.009,0.015) …… (0.015,0.021,0.02
8) ……
Program03
(0.024,0.031,0.035) …… (0.016,0.023,0.02
9) …… (0.004,0.011,0.018) …… (0.013,0.019,0.02
4) …… (0.022,0.028,0.031) …… (0.015,0.021,0.02
8) ……
Program04
(0.003,0.01,0.017) …… (0.003,0.01,0.016) …… (0.004,0.011,0.018) …… (0.019,0.024,0.02
7) …… (0.003,0.009,0.015) …… (0.015,0.021,0.02
8) ……
Program05
(0.017,0.024,0.031) …… (0.01,0.016,0.023) …… (0,0.004,0.011) …… (0.008,0.013,0.01
9) …… (0.009,0.015,0.022) …… (0.009,0.015,0.02
1) ……
Program06
(0.003,0.01,0.017) …… (0.023,0.029,0.032) …… (0.011,0.018,0.02
5) …… (0.008,0.013,0.019) …… (0.003,0.009,0.01
5) …… (0.015,0.021,0.028) ……
Program07
(0.003,0.01,0.017) …… (0.023,0.029,0.032) …… (0.018,0.025,0.03
2) …… (0.003,0.008,0.013) …… (0,0.003,0.009) …… (0.009,0.015,0.02
1) ……
Program08
(0.024,0.031,0.035) …… (0.023,0.029,0.03
2) …… (0.018,0.025,0.032) …… (0.008,0.013,0.01
9) …… (0.022,0.028,0.031) …… (0.009,0.015,0.02
1) ……
Program09
(0.01,0.017,0.024) …… (0.01,0.016,0.023) …… (0,0.004,0.011) …… (0.003,0.008,0.013) …… (0.015,0.022,0.02
8) …… (0.003,0.009,0.015) ……
Program10
(0.01,0.017,0.024) …… (0.003,0.01,0.016) …… (0.004,0.011,0.018) …… (0.013,0.019,0.02
4) …… (0,0.003,0.009) …… (0.009,0.015,0.021) ……
Program11
(0.017,0.024,0.031) …… (0.023,0.029,0.03
2) …… (0.004,0.011,0.018) …… (0.013,0.019,0.02
4) …… (0.009,0.015,0.022) …… (0.009,0.015,0.02
1) ……
Program12
(0,0.003,0.01) …… (0.003,0.01,0.016) …… (0,0.004,0.011) …… (0.003,0.008,0.013) …… (0.003,0.009,0.01
5) …… (0.003,0.009,0.015) ……
Program13
(0.01,0.017,0.024) …… (0.003,0.01,0.016) …… (0.004,0.011,0.018) …… (0.003,0.008,0.01
3) …… (0.003,0.009,0.015) …… (0.015,0.021,0.02
8) ……
Program14
(0.017,0.024,0.031) …… (0,0.003,0.01) …… (0.025,0.032,0.03
6) …… (0.003,0.008,0.013) …… (0,0.003,0.009) …… (0.009,0.015,0.02
1) ……
Program15
(0.01,0.017,0.024) …… (0.01,0.016,0.023) …… (0,0.004,0.011) …… (0.003,0.008,0.013) …… (0.009,0.015,0.02
2) …… (0.009,0.015,0.021) ……
Program16
(0.003,0.01,0.017) …… (0.01,0.016,0.023) …… (0.018,0.025,0.032) …… (0.003,0.008,0.01
3) …… (0.015,0.022,0.028) …… (0.003,0.009,0.01
5) ……
Program17
(0.024,0.031,0.035) …… (0.016,0.023,0.02
9) …… (0.018,0.025,0.032) …… (0,0.003,0.008) …… (0.009,0.015,0.02
2) …… (0.003,0.009,0.015) ……
Program18
(0.01,0.017,0.024) …… (0.01,0.016,0.023) …… (0.004,0.011,0.018) …… (0.013,0.019,0.02
4) …… (0.003,0.009,0.015) …… (0.015,0.021,0.02
8) ……
Program19
(0.01,0.017,0.024) …… (0.01,0.016,0.023) …… (0.011,0.018,0.025) …… (0.013,0.019,0.02
4) …… (0.022,0.028,0.031) …… (0.003,0.009,0.01
5) ……
Program20
(0.003,0.01,0.017) …… (0.01,0.016,0.023) …… (0.011,0.018,0.025) …… (0.019,0.024,0.02
7) …… (0,0.003,0.009) …… (0.003,0.009,0.015) ……
Program21
(0.017,0.024,0.031) …… (0.016,0.023,0.02
9) …… (0.018,0.025,0.032) …… (0.003,0.008,0.01
3) …… (0.015,0.022,0.028) …… (0.003,0.009,0.01
5) ……
Program22
(0,0.003,0.01) …… (0.023,0.029,0.032) …… (0.025,0.032,0.03
6) …… (0.003,0.008,0.013) …… (0.015,0.022,0.02
8) …… (0,0.003,0.009) ……
Program23
(0,0.003,0.01) …… (0.023,0.029,0.032) …… (0.018,0.025,0.03
2) …… (0.003,0.008,0.013) …… (0.003,0.009,0.01
5) …… (0.015,0.021,0.028) ……
Program24
(0.017,0.024,0.031) …… (0.01,0.016,0.023) …… (0.011,0.018,0.02
5) …… (0.008,0.013,0.019) …… (0.022,0.028,0.03
1) …… (0.003,0.009,0.015) ……
Program25
(0.024,0.031,0.035) …… (0.01,0.016,0.023) …… (0.018,0.025,0.03
2) …… (0.003,0.008,0.013) …… (0.015,0.022,0.02
8) …… (0.003,0.009,0.015) ……
Program26
(0.003,0.01,0.017) …… (0.003,0.01,0.016) …… (0,0.004,0.011) …… (0.003,0.008,0.013) …… (0.015,0.022,0.02
8) …… (0.003,0.009,0.015) ……
Program27
(0.003,0.01,0.017) …… (0.01,0.016,0.023) …… (0.018,0.025,0.032) …… (0.003,0.008,0.01
3) …… (0,0.003,0.009) …… (0.003,0.009,0.015) ……
Program28
(0.017,0.024,0.031) …… (0,0.003,0.01) …… (0.011,0.018,0.02
5) …… (0.003,0.008,0.013) …… (0.003,0.009,0.01
5) …… (0,0.003,0.009) ……
Program29
(0.01,0.017,0.024) …… (0.003,0.01,0.016) …… (0.004,0.011,0.018) …… (0.013,0.019,0.02
4) …… (0.015,0.022,0.028) …… (0.003,0.009,0.01
5) ……
Program30
(0,0.003,0.01) …… (0,0.003,0.01) …… (0.004,0.011,0.018) …… (0.008,0.013,0.01
9) …… (0.003,0.009,0.015) …… (0.015,0.021,0.02
8) ……
Table 8: The Relative Closeness of GSCM Program
Environmentally Oriented Performance(d1) BusinessOriented Performance(d2)
Environmentally Oriented
Performance(d1) with no weight
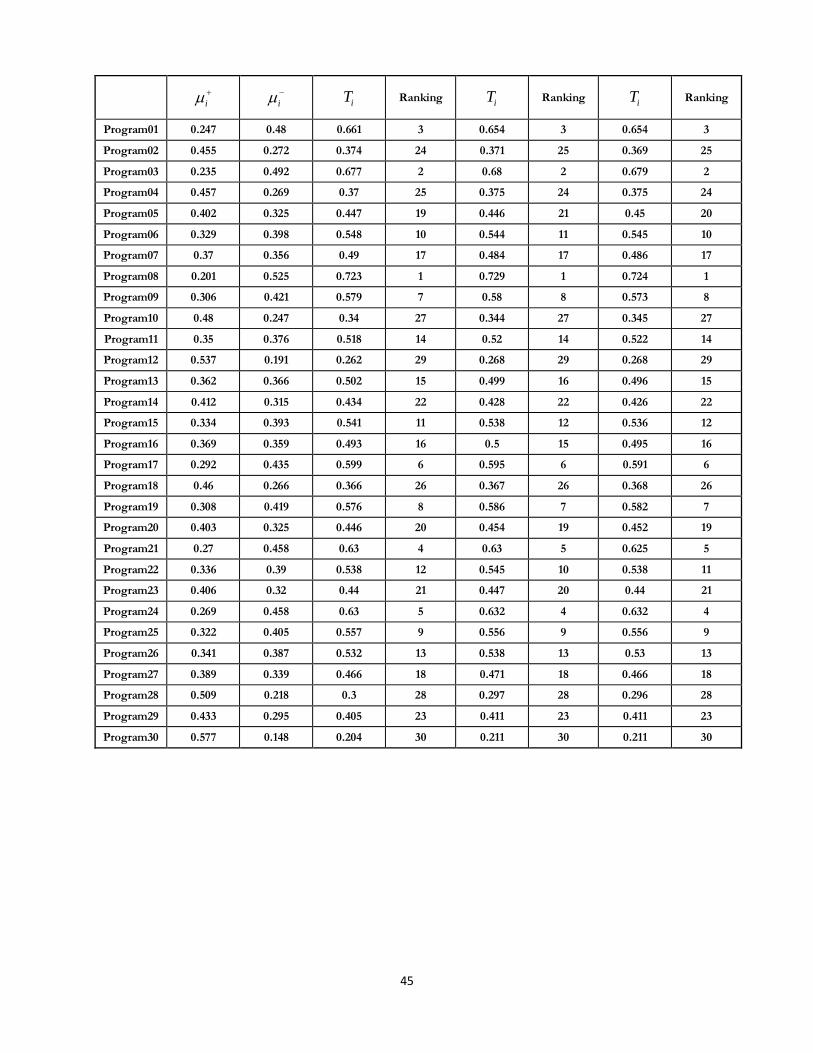
45
iµ+ iµ
− iT Ranking iT Ranking iT Ranking
Program01 0.247 0.48 0.661 3 0.654 3 0.654 3
Program02 0.455 0.272 0.374 24 0.371 25 0.369 25
Program03 0.235 0.492 0.677 2 0.68 2 0.679 2
Program04 0.457 0.269 0.37 25 0.375 24 0.375 24
Program05 0.402 0.325 0.447 19 0.446 21 0.45 20
Program06 0.329 0.398 0.548 10 0.544 11 0.545 10
Program07 0.37 0.356 0.49 17 0.484 17 0.486 17
Program08 0.201 0.525 0.723 1 0.729 1 0.724 1
Program09 0.306 0.421 0.579 7 0.58 8 0.573 8
Program10 0.48 0.247 0.34 27 0.344 27 0.345 27
Program11 0.35 0.376 0.518 14 0.52 14 0.522 14
Program12 0.537 0.191 0.262 29 0.268 29 0.268 29
Program13 0.362 0.366 0.502 15 0.499 16 0.496 15
Program14 0.412 0.315 0.434 22 0.428 22 0.426 22
Program15 0.334 0.393 0.541 11 0.538 12 0.536 12
Program16 0.369 0.359 0.493 16 0.5 15 0.495 16
Program17 0.292 0.435 0.599 6 0.595 6 0.591 6
Program18 0.46 0.266 0.366 26 0.367 26 0.368 26
Program19 0.308 0.419 0.576 8 0.586 7 0.582 7
Program20 0.403 0.325 0.446 20 0.454 19 0.452 19
Program21 0.27 0.458 0.63 4 0.63 5 0.625 5
Program22 0.336 0.39 0.538 12 0.545 10 0.538 11
Program23 0.406 0.32 0.44 21 0.447 20 0.44 21
Program24 0.269 0.458 0.63 5 0.632 4 0.632 4
Program25 0.322 0.405 0.557 9 0.556 9 0.556 9
Program26 0.341 0.387 0.532 13 0.538 13 0.53 13
Program27 0.389 0.339 0.466 18 0.471 18 0.466 18
Program28 0.509 0.218 0.3 28 0.297 28 0.296 28
Program29 0.433 0.295 0.405 23 0.411 23 0.411 23
Program30 0.577 0.148 0.204 30 0.211 30 0.211 30


