I I
. \
$?(f) GPO PRICE $
ITHRU)
CFSTI PRICE(S) $ N65-29380 .. s (ACCESSION NUMBER)
> (CODE)
z P 29
Microfiche (MF) 7mk'pA2+ (NASA CR OR TMX OR AD NUMBER) 79 zp- ICATFOORY) I
5 r!
Hard copy (HC) /& do 2
I L/v- ' ff 653 July65
I
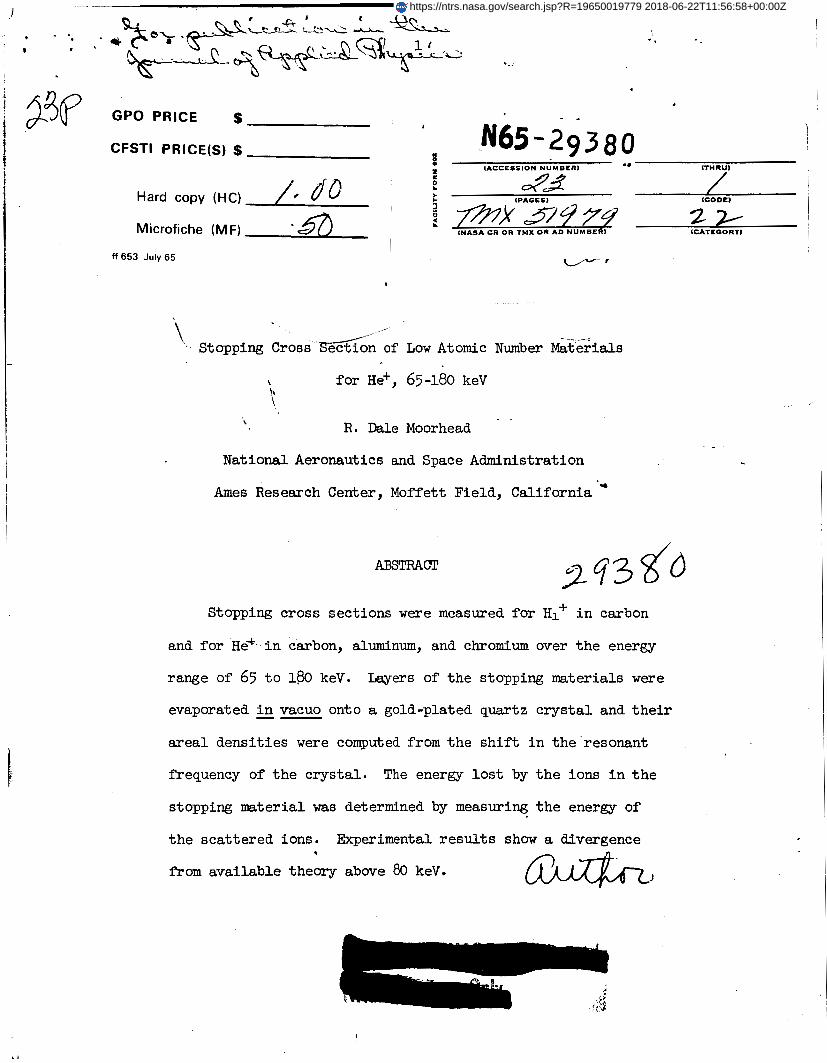
\ Stopping C r o s s ^ d n of Low Atomic Number Materials -- -5
\ for He+, 65-180 keV \
\ R. Dale Moorhead
National Aeronautics and Space Administration
Ames Research Center, Moffett Field, California *
ABSTRACC
Stopping cross sections w e r e measured for HI+ i n carbon
and fo r Hes.- i n carbon, aluminum, and chromium over the energy
range of 65 t o 180 keV.
evaporated -- i n vacuo onto a gold-plated quartz c rys t a l and t h e i r
a r ea l densit ies w e r e computed f romthe s h i f t i n the resonant
frequency of the crystal .
stopping material was determined by measuring the energy of
the scat tered ions. Experimental results show a divergence
Layers of the stopping materials were
The e n e r a l o s t by t h e ions i n t h e
. *om available theory abwe 80 keV.
r i
https://ntrs.nasa.gov/search.jsp?R=19650019779 2018-06-22T11:56:58+00:00Z

- 2
INTRODUCTION
There a r e many areas of physics where a knowledge of stopping cross
sections is important. I n particular, they aid i n the determination of the
screened-interaction potent ia l which i s fundamental t o t h e theore t ica l
understanding of radiation damage and sputtering phenomena.
ping cross sections a re a l so required for the proper interpretat ion of
various nuclear reaction cross section measurements. Finally, recent tal-
culationsl re la ted t o the d i f fe ren t ia l energy loss suffered by low energy
ions have reached the point where detai led comparison with experiment is
desirable.
Accurate stop-
- -
The present experiments were undertaken t o provide absolute stopping - L
cross section measurements for selected ion-medium combinatkons i n the
range of ion energy from 65 t o 180 keV where data a r e re la t ive ly sparse
or nonexistent.
The stop@ing cross
penetrating pa r t i c l e i s
\ where N i s the number
EXPERIMERCAL PROCEDURE
section per atom, So, of
defined by t h e equation
so = .-(1/N) ( , 1’’
of stopping atoms per unit
a
\ \* . -. .
substance for a
volume of t he substance
and dE i s the e&rgy l o s t by the pa r t i c l e i n traversing a distance dR
through the stopping substance. . .
To measure stopping cross sections direct ly , two quantit ies m u s t be
determined: NaR, which i s re lated t o the mass per uni t area of the stopping
!
i

. 3
medium pa ra l l e l t o the path of the penetrating ions; and
energy lo s t by the ions as they pass through t h i s amount of material.
AF,, t he amount 02 .
I n
t h i s experiment,m was measured with a high resolution (0.1s) electro-
s t a t i c energy analyzer operated symmetrically. The quantity NAR was
determined by noting the change i n the fundamental frequency of a piezo-
e l ec t r i c quartz c rys ta l as a layer of the stoppi& material was evaporated
onto one of i t s faces.
- -- Apparatus \
-. . \-
Positive ion beams were generated and mass separated i n a 50 t o 200 keV
Cockcroft-Walton accelerator equipped with a Von Ardenne ion source and a
19.5' magnetic analyzer.
a se r i e s of apertures tha t reduced the beam diameter t o 1.27 mm (Fig. 1)
and the\current t o .about 0-2 pAc ' The target w a s located at the f irst focus
of the 117' energy analyzer.
of 160° entered t h 4 analyzer through s l i t
t o suppress secbndary electrons.
detected by a NaI-photomultiplier combination behind ex i t s l i t sa located
a t the second focus.
The ions were collimated onto t h e ta rge t through .- *
- ./
Part ic les scat tered by the target at an angle
SI which was biased t o -300 v \
Ions selected by the analyzer were .
The pressure i n the target chamber was maintained a t less than
5 ~ 1 0 ~ mm Hg with cryogenically baffled diffusion pumps.
Targets
Targets were prepared on commercially available A.T. cut c rys ta l s that
had a natural frequency of 7.5 Mc/sec. The c rys ta l s were quartz disks of
. :: : . 5

L . - '
of 1.34-cm diameter with a matte finish. Gold electrodes, approximately
equal i n thickness, were evaporated onto each face of the c rys ta l s so as
t o cover both surfaces completely.
The stopping material was evaporated onto one s ide of the gold-plated
c rys t a l inside the t e s t chamber (see Fig. 1) and a l l subsequent measure-
ments were made a t h o u t exposing the t e s t material t o the atmosphere.
The a r e a l density of t h e evaporated layer was monitored by continuously
measuring the c rys ta l frequency during eaborat ion.
ranged from 4x10- t o 13~10'~ g/cn?, corresponding t o frequency s h i f t s of
500 t o 1600 cps.
The dens i t i e s used
Most of t he targets were 8 x 1 0 ~ g/c& (A€' = 1000 cps).
The areal density of the stopping layer, cp, was computed from the
formula2 .. cp = (afK/f2) , g/cm2*
Y 9%-
I n t h i s equation nf represents the frequency change, K i s a constant of
t he crystal , i n t h i s case 4.425X1O5 cps g/cn?, and f i s t h e frequency of \
- the c rys t a l jus t pr ior t o evaporation and includes the effects of th7,gold
electrodes and crys ta l holder. .
/ /
The ta rge t was mounted s o it could be rotated 180' around an axis
perpendicular t o the beam. Thus, both faces could be exposed t o the inc i -
dent ions. Transverse motion along t h i s axis was a lso possible. I n addi-
t ion , the target could be rotated slowly around an axis normal t o i t s
surface. With t h i s latter axis passing through the surface at a point
offset f romthe beam, rotat ion resulted i n scanning an annular region of
the t a rge t during a measurement. This scanning was found t o be necessary
\

V -
5
i n order t o avoid errors associated with changes i n the ta rge t surface
caused by prolonged ion bombardment.
checking the uniformity of t h e stopping layer.
Furthermore, it provided a means of
Energy Measurements
The e lec t ros ta t ic analyzer had a mean radius of 11.375 in . and a
p l a t e separation of 0.100 in .
direct reading precision power supplies.
AV,, between the plates, the energy of acceptance, Ea, of t h e analyzer
w a s computed from the equation
Voltage t o the plates was supplied by two
For a potent&&-difference,
Ea = (L/2t) AVaq L .. where L i s the mean radius, 2 i s the p la te separation, and q i s the
charge on the ion.
The ion current t o the target was metered through a current integrator.
The number of scat tered ions reaching the analyzer detector for a fixed
integrated current on the target was recorded as a function of t he accept-
ante energy of the analyzer.
t e red beam a r e shown i n Fig. 2. Curve (b) i s for ions scattered from the
clean gold face of t he target, while curve (a) i s for ions which have gone
. Typical energy dis t r ibut ions of the scat-
*#
through the stopping substance and rebounded from t h e underlying gold
electrode. The effect ive energy of the ions was taken as tha t correspond-
ing t o half the maxim accumulated count^.^ The energy measured from
curve (b) , when correc€ed t o account fo r t he r e c o i l energy of the gold
atoms, i s equal t o the energy of the incident ions. The operating voltage

c . ,/ . ,
6
of the accelerator, known t o within about 58, thus served as a secondary
measure of ion energy.
t Data Reduction
The events tha t change t h e energy of the ions at t h e target a re
Fig- 3 < diagrammed i n Fig. 3 . The energy of the ions from %he accelerator i s El,
and t h e i r energy in to the analyzer i s E4. The energy transferred t o t h e
stopping material i s E l - E2 i n a thickness LE1, and----& - E4 i n a thick-
ness CJI-9. The quantity E2 - E3 i s the energy l o s t i n t he r eco i l process
from the gold substratum; t h i s can be estimated on the a s s u p t i o n of an
e l a s t i c coll ision: \
Y e.. ( 1) \.*
E2 - E3 = (1- PIE2
where p, the well-known e l a s t i c scattering factor, i s given by,
Ms2 - M 1 2 ( 1 - 2 cos2 a) f 2Ml cos a(M22 - M12 ' s in2 r
I- -- - --./ \ -
I n t h i s notation MI is the mass of t h e pro jec t i le par t ic le , M2 t he mass
of t h e ta rge t atoii (gold i n t h i s experiment), and a
angle (160' fors ions entering the analyzer) Values of p were 0.92 f o r
He+ 4nd 0.98 fo r Hl+.
i s the scat ter ing
The quantity E l - E4 can be writ ten i n terms of the foregoing
individual loss processes as follows:
. J ' Y . .
*" 7
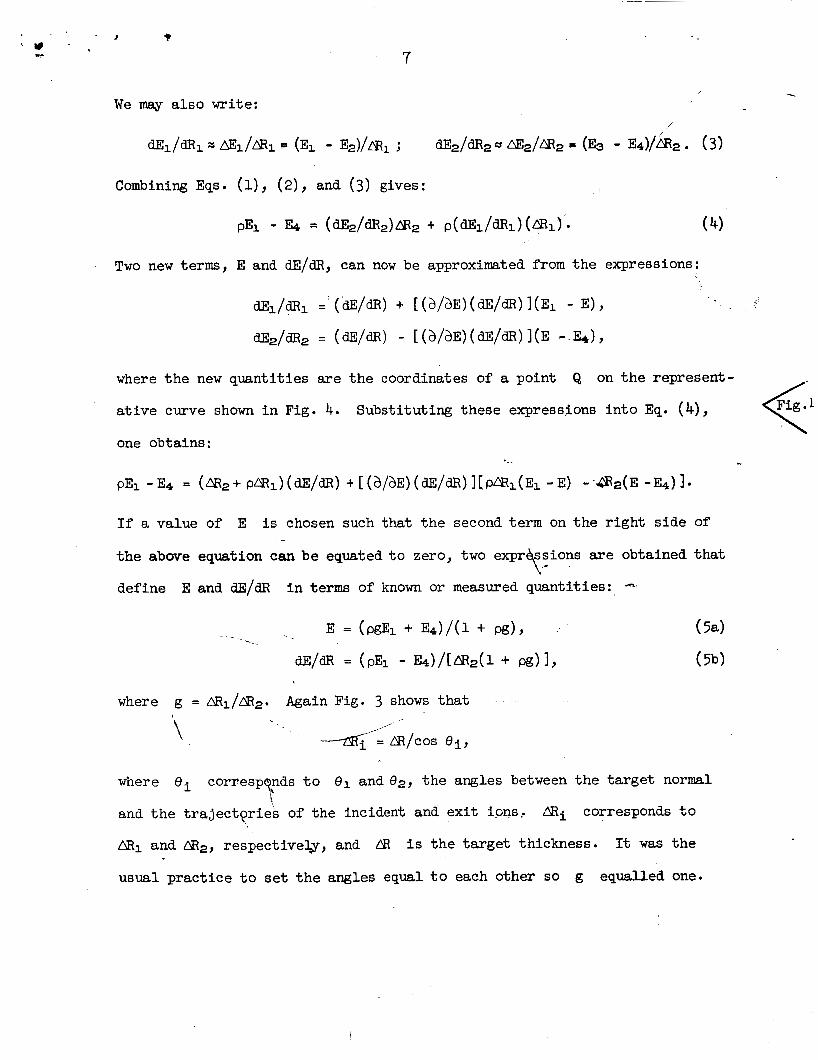
Combining Eqs. (l), (2), and (3) gives:
Two new terms, E and dE/dR, can now be approximated from the expressions:
where t h e new quantit ies a re the coordinates of a point
a t ive curve shown i n Fig. 4.
one obtains:
Q on the represent-
Fig. < Substituting these expressions in to Eq. (4))
. _ pEl = (& + Pml) ( dE/m) + [ (a /aE) ( dE/dR) I [ Pml (El - E) - E -E4) I
If a value of E
t h e above equation can be e q u t e d t o zero, two expr ssions a r e obtained tha t
define E and dE/dR
i s chosen such that the second term on the r igh t s ide of
j- i n terms of known o r measured quantit ies:
\
where ei correspqpds t o el and 02, t h e angles between the target normal
and the t ra jec tpr ies of the incident and ex i t ions.. mi corresponds t o
AR1 and m2, respectively, and A? i s the ta rge t thickness. It was t he
usual pract ice t o set t h e angles equal t o each other so
\.
g equalled one.
8
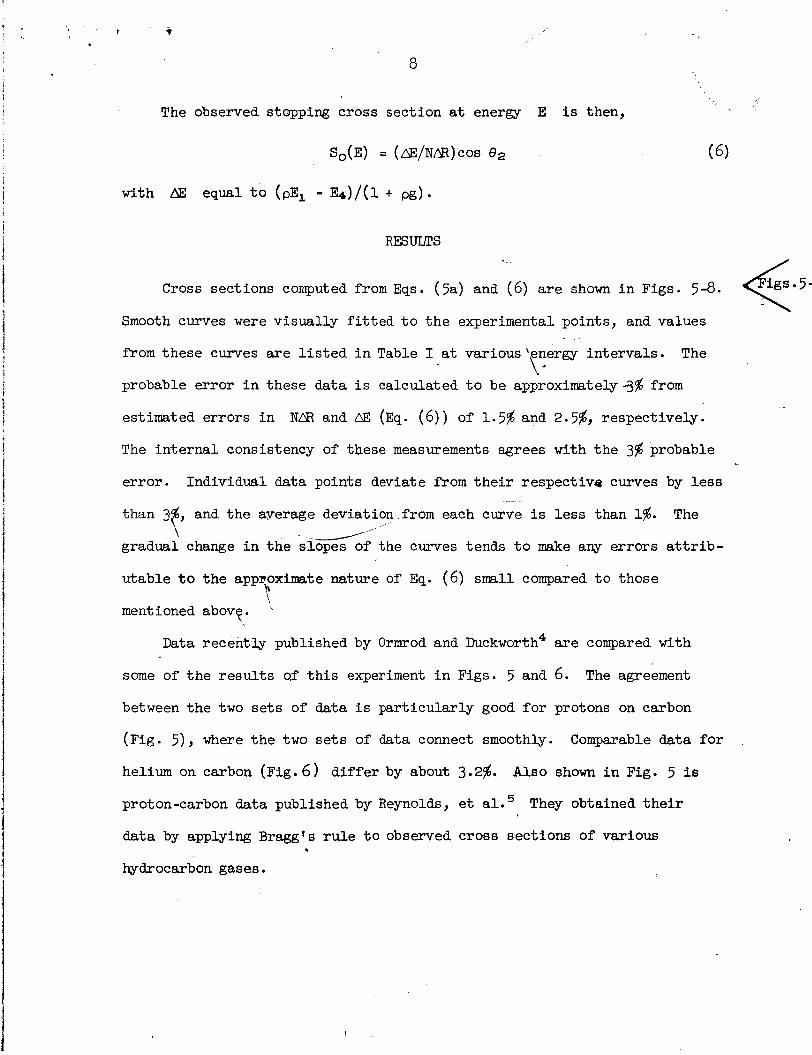
The observed stopping cross section at energy E i s then,
with f% equal t o (pE, - E4)/(1 + pg) .
RESWPS *..
igs . 5 - e Cross sections computed from Eqs. (5a) and (6) a r e shown i n Figs. 5-8.
Smooth curves were visually f i t t e d t o the experimental points, and values
from these curves a re l i s t e d i n Table I at various ‘energy intervals . The
probable error i n these data i s calculated t o be approximately+$ from
estimated errors i n
\ *
NLR and aF, (Eq. (6 ) ) of 1.5% and 2.5$, respectively.
The in te rna l consistency of tbese measurements agrees with the 3s probable
error . Individml data points deviate from t h e i r respective curves by less
, and the ayerage deviation from each curve i s l e s s than 1%.
gradual change i n the slopes of the curves tends t o make any errors a t t r i b -
The than 1
utable t o the approximate nature of Eq. (6) small compared t o those
mentioned abov?. \I ‘,
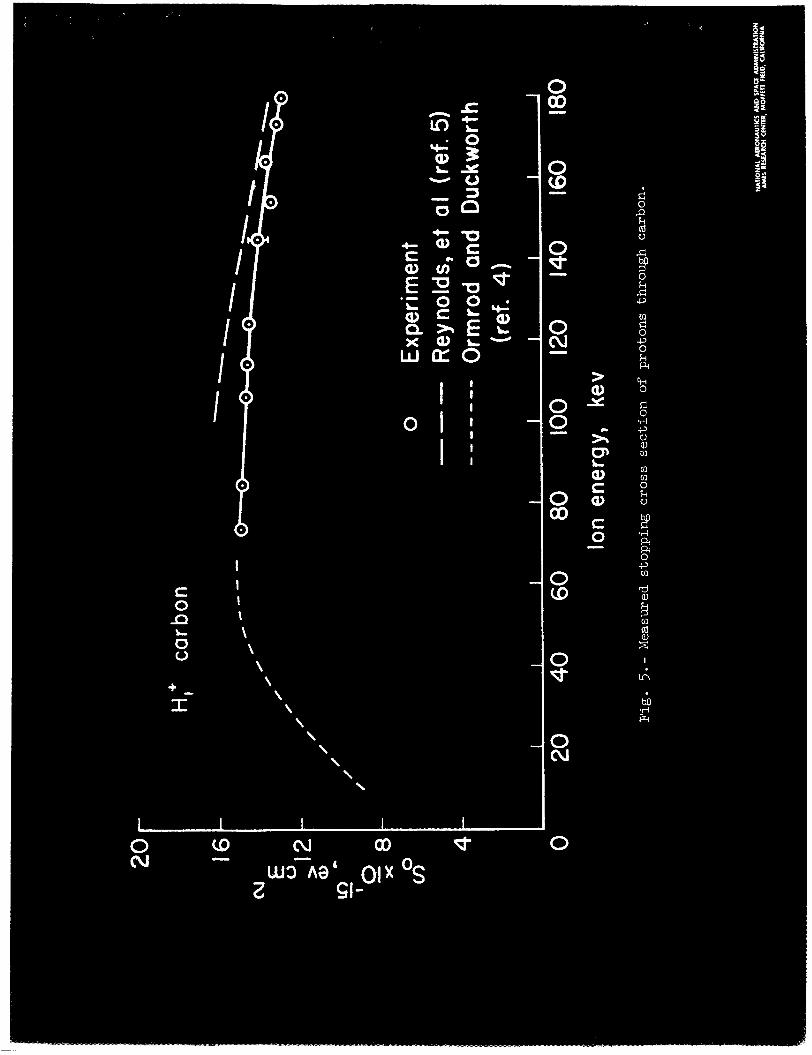
Data recently published by Ormrod and Duckworth* a re compared with
some of t he resu l t s qf t h i s experiment i n Figs. 5 and 6. The agreement
between the two se t s of data i s par t icular ly good for protons on carbon
(Fig. 5), where the two sets of data connect smoothly.
helium on carbon (Fig. 6 ) d i f f e r by about 3.2%.
proton-carbon data published by Reynolds, e t ai.’
data by applying Bragg’s ru l e t o observed cross sections of various
hydrocarbon gases.
Comparable data f o r
Also sham i n Fig. 5 is
They obtained t h e i r

DISCUSSION
Throughout the greater par t of t h e i r range, the predominant
mechanism by which ions lose energy i s ine las t ic electronic col l is ions.
An expression for t h e electronic stopping cross section per atom, Se,
appropriate t o the energy range of t h i s experiment was derived theoret-
i c a l l y by Lindhard and Scharff' and can be writ ten i n term of t h e energy
of t he penetrating ions, E, as
Se
where Eo i s
v1 =vOz1 J 2 / 3 .
the kinet ic energy of the ions when t h e i r speed i s
vo i s the velocity of the electron i n the first Bohr orb i t
i n hydrogen; Z and M (Eq. (8)) represent atomic numbers and mass; and a.
i s the Bohr radius. The subscripts 1 and 2 re fer t o the penetrating ions
L
*
and the stopping medium, respectively. The factor s e i s thought t o have
a value between 1 and 2 and possibly equal t o
supposed t o be va l id for E < Eo. For He+, Eo 250 keV.
Z 1 ' I 6 . Equation (7) i s
When the io-ns approach t h e terminal portion of t h e i r range, e l a s t i c
col l is ions tha t impart energy t o the nuclei of t he stopping medium become
important. Bohr' has found t h a t when these col l is ions a r e predominantly
of t he Rutherford type, t h e nuclear stopping cross section per atom, Sn,
can be expressed approximately as
2 2 sn B I ( M ' / M ~ ) ~ ~ ( Z ~ z2 / E ) z ~ ( ~ E ) ,
where
Y c

. . Y . . c
LO
. A correction t o Eq. (8) (small for the ion ve loc i t ies of t h i s experiment) -
t o account fo r screening effects on nuclear col l is ions has been computed
by Lindhard and T h ~ m s e n . ~
The total stopping cross section per atom is, of course, the sum of
the separate components Se + Sn.
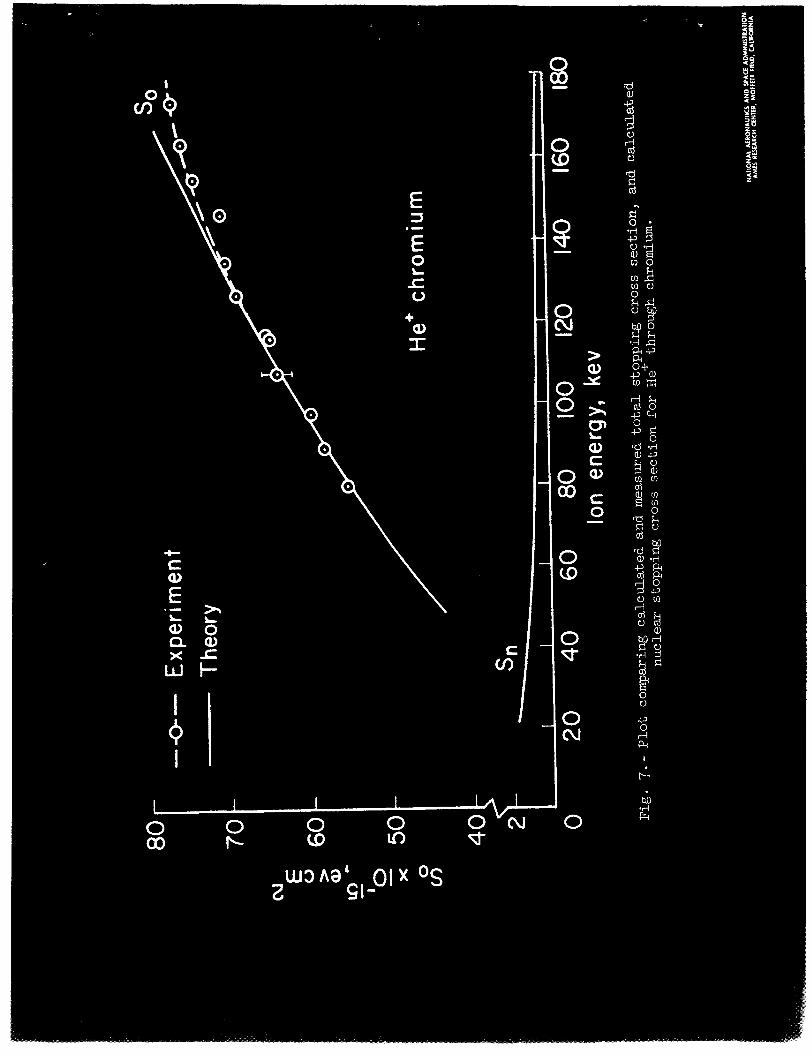
The theoret ical curves plotted i n Figs. 6, 7, and 8 were computed k x
from Eq. (7) plus a small contribution (< 2% of So) from Eq. (8) cor-
rected fo r screening effect^.^ The parameter t e was chosen i n each
case for agreement with experiment at a low value of energy (81 keV) where
the theory should be most valid. The values of !e SO determined are
l i s t e d below. Stopping
E-& - Ion material Z.2 - - He' C 6 1.23
-8
e..
Since the largest contribution t o the t o t a l stopping cross section i n
the energy range covered by t h i s experiment i s f romthe electronic compo-
nent, it i s appropriate at t h i s point t o mention the l imitat ions of Eq. (7).
In Ref . 1, Lindhard and Scharff s ta te : "The dependence of S on Z1 and
Z2 i s '$n expedient t o g e t y ' s t i m t e s . " Elsewhere,' Lindhard has
been quoted as saying:
mate i n more than &e sense. The constant (Ee f Z11'6) i s based on Thomas-
- "It should be emphasized tha t Eq. (7) i s approxi-
Fermi arguments:. and it i s t o be expected tha t f luctuations around t h i s
constant can occur, esp6cially for
t i ona l i t y t o v (i .e. , E l l 2 ) w i l l not be correct over t h e whole of t he
velocity region v < v1 (E < Eo) ."
Z1 2 10. Moreover, a precise propor-

c
11 I
Within the confines of these limitations, we f ind essent ia l agreement
I n Figs. 6 , between our experimental r e su l t s and theore t ica l predictions.
7, and 8, it i s seen tha t t he agreement i s l imited t o the low energy region
as expected.
ence on Se i n t h i s region, when a small correction fo r nuclear e f fec ts i s
included i n the ketal measured cross section.
range of agreement fo r a given ion varies with the stopping material.
Agreement stops at 80 keV f6r He' on carl%n and 130 keV-for He' on aluminum
or on chromium.
Moreover, t h i s agreement i s evidence of a velocity depend-
We note, however, t ha t t he
1 Although the values of se l i s t e d above l i e between 1 and 2 within
F experimental sca t te r , !e
i . e . , Z2, and the increasing trend found here would suggest values of
i s definitely dependent on t h e stopping m a t e r i a l , *
.. se > 2 for larger values of Z2. This var ia t ion of with 22 may be
due t o the "simplified" Z dependence assumed fo r Se mentioned above.
If t h i s should be the case, the simple relat ionship between U w
se and 22
found from t h i s work may be of interest .
t h i s experiment, we f ind
r e s u l t may be ent i re ly fortuitous or may be re la ted t o the fac t t ha t t he
From the three values obtained'in
E e aZ2°'354. We hasten t o point out that , this ..
atomic numbers of t h e stopping materials are nemly i n t h e r a t i o 1:2:4
(a periodic var ia t ion of !e w i t h Z 1 was found by Ormrod, e t a1.).4
I n any event, we wish t o emphasize tha t t h i s result cannot be considered
as anything mor'e than an interesting observation at t h i s time. I '
\

a
12
SUMMARY
Absolute measurements of t he t o t a l stopping cross section have been
made for
energies ranging from 65 t o 180 keV.
H1+ i n carbon and for He+ i n carbon, aluminum, and chromium fo r
The resu l t s are l i s t e d i n Table I.
The r e su l t s of t he He+ measurements have been used t o compare the
dependence of Eq. (7) on the parameters E and 22 with experiment. I n
the l o w energy region the implicit velocity dependence of Eq. (7) i s i n
essent ia l agreement with experimental findings.
r e su l t s indicate C h a t the 22 dependence of Eq. (7) does not adequately
.--
However, the experimental
r e l a t e t h i s parameter t o the physics of the stopping pracess.
ACKNOWLEDGMENTS ..' .. The author i s indebted t o Dr. M. Bader for suggesting the experiment
and for h is constructive comments on the manuscript; t o M r . L. Haughney
for operating the Cockcroft-Walton accelerator; and t o Messrs. E. Klingler
and D. Magnuson for t h e i r assistance i n the construction and maintenance
\*
of t h e equipment-;
\
'J. Lindhasd and M. Scharff, Phys. Rev. 124, 128 (1961).
%. Sauerbrey, Z. Physik,. 155, 206 (1959).
3A technique similar t o t h i s was used by: M. Bader, R. E. Pixley,
F. S. Mozer, and W. Whaling, Phys. Rev. 103, 32 (1956).
*J. H. Ormrod and H. E. Duckworth, Can. J. Phys. 41, 1424 (1963).
?-I- K. Reynolds, D. N. F. Dunbar, W. A . Wenzel, and W. Whaling, Phys.
Rev. 92, 732 (1953).
6N. Bohr, K g l . Danske Videnskab. Selskab, Mat. - Fys. Medd. 18, No- 8 (1948).
7J. Lindhard and P. V. Thomen, ?Radiation Damage i n Solids, Vol. I."
(Internat ional ATomic Energy Agency, Vienna, 1962), pp. 65-76.
'A. Van W i jngaarden and H. E. Duckworth, Can. J. Phys. 9 1749 (1962). !e-
/ ,/

14
TABLE I. Observed stopping cross sections taken from smooth
curves drawn through the experimental resu l t s .
s , x ~ o - ~ ~ ev cm2 Energy,
keV He’ - C He+ - A1 He+ - C r H1+ - C
66 *’ 78
90
102
114
126
138
150
162
174
180
21. Ta
23.4
25.0
26.3
27.5
28.5
29.4
30.3
31.0
31.7
32.0
34.8
37.6
40.3
42.9
45.2
47.5
49.6
51.3
52.6
53 -6
54.0
49.8&
54.0
57.9
61.5
65.0
68.2
70.9
73.1
74.9
76.3
76.8&
15. la
15.0 -.- 14.8
14.7
, 14.6
14.4
14.1
13.8 .4
13-5
13.1
12.9
aVaTues taken f r o m curve extrapolated beyond ,//
experiment@ date.
I’
.
\

' 15
. ' .
FIGURE CAPTIONS
Fig. 1. Essential features of the experimental equipment.
Fig. 2. Typical energy distributions of ions scat tered from the target .
(Nominal energy of incident He+ beam = 100 keV) . Fig. 3. Events degrading t h e energy of the ions a t the ta rge t .
Fig. 4. Representative curve indicating the significance of various
terms i n the derivation of Eqs. (5a) and (6) . _ -
Fig. 5. Measured stopping cross section of protons through carbon.
Fig. 6. P lo t comparing calculated and measured t o t a l stopping cross
section, and calculdted nuclear stopping cross section for He' through
I . .
carbon. \
Fig. 7. Plot comparing calculated and measured t o k. a1 stopping cross
section, and calculated nuclear stopping cross section fo r He' through
chromium.
Fig. 8. Plot comparing calculated and measured t o t a l stopping cross
section, and calculated nuclear stopping cross seccion fo r He' through
alumin . --- \ ' . -1'
\ ,
\ \