
JSPS Grant-in-Aid for Scientific Research (S)
Central Bank Communication Design
working paper seriesNo.36 (November 2021)
Going Cashless: Evidence from Japan’s Point Reward Program
Toshitaka SekineToshiaki ShojiTsutomu Watanabe
Research Project on Central Bank Communication702 Faculty of Economics, The University of Tokyo,
7-3-1 Hongo, Bunkyo-ku, Tokyo 113-0033, Japan Tel: +81-3-5841-5595 E-mail: [email protected]
http://www.centralbank.e.u-tokyo.ac.jp/en/
Working Papers are a series of manuscripts in their draft form that are shared for discussion and comment purposes only. They are not intended for circulation or
distribution, except as indicated by the author. For that reason, Working Papers may not be reproduced or distributed without the expressed consent of the author.

Going Cashless: Evidence from Japan’s Point Reward
Program
Toshitaka Sekine∗ Toshiaki Shoji† Tsutomu Watanabe‡
November 5, 2021
Abstract
In October 2019, the Japanese government started a unique program that offeredpoints (discounts) for cashless payments. Using credit card transaction data, we com-pare credit card usage at restaurants that participated in this program and those thatdid not. Our main findings are as follows. First, the number of card users was 9-12 percent higher in participating than in non-participating restaurants. Second, thepositive impact of the program on the number of card users persisted even after the pro-gram ended in June 2020, indicating that the program had a lasting effect to promotecashless payments. Third, the impact of the program was significantly larger at restau-rants that started accepting credit cards more recently, since the share of cash usersat those restaurants was larger just before the program started. Finally, two-thirdsof the difference between participating and non-participating restaurants disappearedduring the first surge of COVID-19 in April 2020, suggesting that customers switchedfrom cash to cashless payments to reduce the risk of infection both at participating andnon-participating restaurants, but the extent to which customers switched was largerat non-participating restaurants with a larger share of cash users just before the pan-demic.JEL codes: E42, O33, O38
∗Hitotsubashi University (E-mail: [email protected])†Seikei University (E-mail: [email protected]). Corresponding author. We thank Hidehiko Ichimura,
Daiji Kawaguchi, and seminar participants at Seikei University and the University of Tokyo for helpfulcomments. We are grateful to Shinya Kubodera, Yosuke Nakanishi, and Naoto Omori of JCB Co., Ltd., andMasashi Tsujinaka of Nowcast Inc., for providing the credit card transaction data and to Takamasa Nozakiof Ministry of Economy, Trade, and Industry (METI) for providing a list of businesses that participated inthe point reward program. This research is funded by JSPS Grants-in-Aid for Scientific Research (19K23201for Shoji and 18H05217 for Watanabe). All errors are our own.
‡University of Tokyo (E-mail: [email protected])
1
Keywords: Cash and cashless payments, technology adoption, promotion program,COVID-19
2

1 Introduction
The share of payments using cashless methods is much lower in Japan than many other
countries. BIS statistics, for example, show that total payments via cashless means such as
credit cards, debit cards, and e-money in Japan amounted to 74 trillion yen or 24 percent
of household final consumption expenditure in 2018. This percentage is considerably lower
than the 40 percent or more in other developed countries such as the United States, the
United Kingdom, and Singapore. The social cost of relying on cash payments is substantial.
For instance, using data for several European countries, Schmiedel et al. (2012) show that
the unit cost of cash payments is higher than that of debit card payments. In addition,
Rogoff (2015) argues that cash makes transactions anonymous, which potentially facilitates
underground or illegal activities and leads to law-enforcement costs.
To raise the share of cashless payments, the Japanese government in October 2019 intro-
duced a unique program offering reward points for cashless payments. The program, which
ran until June 2020, provided an incentive to switch from cash to cashless payments by of-
fering a discount of 5 percent. Government figures suggest that the program succeeded in
raising the share of payments via cashless means.1 The increase can be divided into two
parts: the extensive margin and the intensive margin. Specifically, the extensive margin
refers to the increase in the number of consumers newly using cashless payment means, while
the intensive margin refers to the increase in the frequency or amount of cashless payments
by those already using such means.
Using a dataset covering credit card transactions at restaurants in Tokyo, we examine
the increase in cashless payments (especially the intensive margin) by comparing credit card
usage at restaurants that participated in the point reward program and those that did not.
Our main findings are as follows. First, we find that the amount paid via credit card was
1According to the Ministry of Economy, Trade, and Industry of Japan, the share of cashless paymentsincreased to 29.7 percent of household final consumption expenditure in 2020.
3

26-46 percent higher and the number of card users 9-12 percent higher at restaurants that
participated in the program than in those that did not. This result suggests that the amount
of credit card payments increased in response to the government’s point reward program.
This finding is consistent with the findings of studies such as those by Ching and Hayashi
(2010) and Carbo-Valverde and Linares-Zegarra (2011) showing that rewards offered by card
issuers have a significant impact on consumers’ choice of payment method.
Second, the positive impact of the program on the amount of credit card payments per-
sisted even after the program ended in June 2020. This finding suggests that the program
had a lasting rather than just a transitory effect in promoting cashless payments. In other
words, once consumers switch from cash to credit card payments, they do not switch back.
This is inconsistent with the framework proposed by earlier studies such as Alvarez and Lippi
(2017), where consumers have multiple payment methods and choose the most convenient
one at each payment opportunity. Rather, this finding suggests that the spread of credit
card usage can be described as akin to the adoption process of new technologies or products,
which economists have tried to model. One of the earliest examples is the model proposed
by Griliches (1957), in which the fraction of adopters increases monotonically.
We present a simple framework of technology adoption, which illustrates how cash users
in a restaurant switch to credit card payments. In this framework, the promotion of cashless
payments leads some cash users to switch to paying by credit card. This means that the
extent to which such promotion succeeds in getting consumers to switch depends on the
percentage of cash users among total customers: the larger the percentage of cash users at a
particular restaurant, the larger the impact of campaigns such as the point reward program
is likely to be. We test this implication of our framework in two ways. First, we use the
time elapsed since each restaurant started to accept credit card payments as a proxy for the
share of cash users, given that this share is decreasing over time. This means that the point
reward program had a smaller impact on restaurants that have been accepting credit card
4
payments for longer. Second, we use the variation in the percentage of cash users across
restaurants participating and not participating in the program. Before the program ended
in June 2020, Japan was hit by the first surge of COVID-19 in April and May 2020, which
provided an incentive for consumers to use cashless payment means in order to reduce the
risk of infection. Given that the share of cash users was smaller in participating than in
non-participating restaurants, we would expect the difference between the two in terms of
customers’ use of credit cards to decrease during this period. In this study, we provide
evidence consistent with these arguments.
This study contributes to three strands of literature. The first is studies examining
consumers’ choice of payment method, both from a theoretical and an empirical perspective,
such as McAndrews and Wang (2012), Wang and Wolman (2016), and Alvarez and Lippi
(2017).2 An important point highlighted in these studies is that consumers and businesses
face positive externalities in adopting and using cashless payments. Our results suggest that
Japan’s program promoting cashless payments raised the number of credit card users, which
in turn increased the benefits of using credit cards (i.e., externalities), so that consumers did
not switch back to cash payments even after the program had ended.
The second strand of literature to which this study is related focuses on the diffusion
of new technologies and products. Griliches (1957) and Jovanovic and Wang (2020), for
example, use the logistic function as a tool to describe the speed and upper limit of diffusion,
while Young (2009) and Mobius and Rosenblat (2014) construct models of diffusion in terms of
social learning or contagion. Their models describe developments in the share of adopters of a
new technology over time, depending on different assumptions on how information about new
technologies is transmitted. Our results indicate that policy intervention by the government
accelerated the speed of technology adoption regarding cashless payments, and that the
impact of this intervention decreased as the use of cashless payments increased.
2Other studies on this topic include Borzekowski et al. (2008), Klee (2008), Bourguignon et al. (2014),Koulayev et al. (2016), Jonker et al. (2017), and Wakamori and Welte (2017).
5
The third strand of literature focuses on effects of the COVID-19 pandemic on consumers’
choice of payment method. For example, Cevik (2020), Chen et al. (2020), and Wisniewski
et al. (2021) document that consumers decreased the use of cash to avoid the risk of infec-
tion, while Rogoff and Scazzero (2021) show that the use of electronic payments increased
during the pandemic period. In this study, we empirically show that the COVID-19 pan-
demic promoted the use of credit cards and its impact was heterogeneous across restaurants.
More specifically, we show that restaurants that did not participate in the point reward pro-
gram experienced higher growth in credit card spending than participating restaurants (after
controlling for the negative impact due to people avoid outings during the pandemic).
The remainder of the study proceeds as follows. The next section provides a brief overview
of Japan’s point reward program for cashless payments. Section 3 explains the data used for
the analysis. Section 4 describes the methodology we employ to examine the impact of the
program. Section 5 presents empirical results, while Section 6 provides various robustness
checks. Finally, Section 7 concludes.
2 Overview of Japan’s Point Reward Program
The Japanese government implemented the point reward program for cashless payments
from October 2019 to June 2020 with the aim of boosting consumption expenditure after the
standard consumption tax rate increased from 8 to 10 percent. This program to stimulate
demand was unique in that the point rewards consumers could receive depended solely on
their method of payment: consumers could receive points if they used a cashless payment
method (such as paying by credit or debit card, by QR code using their mobile phone,
or using e-money) when purchasing a product from a participating business but could not
receive points if they chose to pay by cash for the same purchase. The program therefore
incentivized consumers to switch from cash to cashless payments.
6

Consumers in most cases received point rewards equivalent to 5 percent of the value
of the purchases.3 Moreover, this program included several policy measures to encourage
merchants to adopt cashless payment methods. Specifically, the government covered retailers’
costs of adopting payment terminals and shouldered part of the transaction fees, in order to
incentivize businesses as well as consumers to go cashless.
However, businesses needed to meet certain conditions to participate in the point reward
program. Cafes and restaurants, for example, had to satisfy at least one of the following
two conditions: (i) the paid-in capital of the firm operating the business could not exceed
50 million yen, and/or (ii) they could not have more than 100 employees. The purpose of
these conditions was to boost demand primarily for such smaller businesses. These condi-
tions enable us to treat the program as a quasi-experiment and compare the use of cashless
payments at participating and non-participating businesses.
Japan’s government program differs from the incentive schemes examined in other studies
in several respects. Ching and Hayashi (2010) and Carbo-Valverde and Linares-Zegarra
(2011), for example, examine the impact of point reward programs implemented by card
issuers, not the government. The purpose of the point reward programs by card issuers was
to promote a brand. In contrast, Japan’s program offered the same rewards for all card issuers
and providers of other cashless payment services to promote cashless payments throughout the
economy. Meanwhile, the study by Jonker et al. (2017) focuses on a nationwide campaign
in the Netherlands to promote debit card usage that, however, did not provide financial
incentives. While this campaign may have led consumers and businesses to switch to cashless
payments based on the expectation that everyone else would be switching, it likely was less
effective than Japan’s program that provided financial incentives.
3The rate of points was 2 percent (offsetting the consumption tax hike) for purchases at retail shopsbelonging to large franchise chains.
7

3 Data
We use two sets of data for our analysis. The first is a list of restaurants participating in
the point reward program, which was compiled by the Ministry of Economy, Trade, and
Industry of Japan (METI). This list includes the name of each restaurant, the cashless
payment methods available, and the date that a restaurant joined the program. Because it
took time for the government to verify that restaurants satisfied the conditions mentioned in
the preceding section, in many cases applications were approved only after the program had
started in October 2019.
The second dataset we use consists of credit card transaction records for restaurants
located in Shinjuku, a major business and shopping district in central Tokyo, provided by
JCB, a major card brand in Japan. The total number of restaurants covered in this dataset
is 8,241. Checking the names of these restaurants against METI’s list, we find that 2,129 of
these 8,241 restaurants participated in the program. The observation period for this dataset
is from April 2018 to December 2020, and the dataset allows us to observe on a monthly basis
how much individual card users paid at particular restaurants. It should be noted, however,
that the identifiers of individual card users are reshuffled quarterly to protect their privacy.
Based on this dataset, Figure 1 shows monthly developments in the amount of JCB credit
card spending, the number of card users at restaurants in Shinjuku, Tokyo, and the number
of restaurants accepting payment by credit card. The figure indicates that while credit card
spending displays strong seasonality, spending accelerated rapidly following the start of the
point reward program in October 2019. A similar pattern is observed for the number of card
users. However, these values declined substantially in December 2019 and reached a low in
April 2020, when the first surge of COVID-19 hit Japan.4 The figure also indicates that the
number of restaurants that accept credit card payment increased steadily, while the number
4While our dataset is restricted to one particular area in Japan, developments in the data closely followthose in nationwide restaurant sales.
8

Figure 1: Monthly developments in credit card usage from April 2018 to December 2020
Notes: The figure shows the total amount of JCB credit card spending at restaurants in Shinjuku, Tokyo, thenumber of card users at these restaurants, the number of restaurants accepting payment by credit card, andthe number of restaurants for which there are records of credit card transactions in our JCB card database(i.e., restaurants frequented by JCB card users).
of restaurants for which our database shows actual transactions was more volatile.
As a preliminary check, Figure 2 compares the growth rates of spending at restaurants
that participated in the point reward program (the treatment group) and those that did not
(the control group). Specifically, we calculate the year-on-year rate of change in spending at
each restaurant for each month and take the median for each group. The figure indicates that
the growth rates for both groups were very similar prior to the program, but the treatment
group experienced higher growth in January and February 2020, suggesting that the program
had a positive impact. It should be noted that we can calculate year-on-year growth rates
only for restaurants that had been accepting credit cards for at least a year, meaning that
9

Figure 2: Comparison of spending growth rates
Notes: The figure shows the growth rate of JCB credit card spending for the treatment and control groupsfrom April 2019 to December 2020. See the text for a full description.
restaurants that had only just started accepting credit cards are excluded in Figure 2.
4 Methodology
Using records of credit card transactions at restaurants in Tokyo from April 2018 to December
2020, we examine the impact of the point reward program for cashless payments.
As mentioned earlier, the impact of the program can be decomposed into two parts:
the extensive margin (the increase in consumers using cashless payment methods) and the
intensive margin (the increase in the frequency and/or amount of cashless payments). The
purpose of Japan’s program was to increase both. In practical terms, the implications are
10

as follows. Given that in 2018 there were already 280 million credit cards—or 2.3 cards
per capita—in circulation in Japan,5 most consumers already had a credit card before the
program started. This means that the extensive margin can be regarded as the increase in
the number of consumers using new cashless payment methods, such as payment by QR code,
while the intensive margin can be regarded as the increase in the frequency and amount of
payments by existing cashless payment methods (i.e., credit cards).
Our focus is on the impact of the point reward program on credit card usage, i.e., the in-
tensive margin. More specifically, an increase in the intensive margin means that consumers
who already have credit cards use them at more payment opportunities. For example, con-
sumers that used to pay at restaurants in cash choose to pay by credit card instead. In this
case, the adoption process of credit card payments can be described as follows. Suppose that
the set of customers of a particular restaurant is fixed. In the beginning, all customers choose
to pay by cash; however, they gradually switch to paying by credit card over time.6
In this study, we regard the spread of cashless payment methods (e.g., credit cards) as
technology adoption, which can be modelled by the following simple equation:
∆xit = λ(1− xi,t−1), (1)
where xit represents the fraction of cashless payments at restaurant i in period t, and λ
denotes the probability with which customers using cash in the previous period switch to
cashless payment in the current period. Equation (1) shows that the increase in cashless
5These numbers are reported in the BIS statistics on payments, which can be accessed via the followingwebsite: https://www.bis.org/statistics/payment_stats.htm.
6Previous studies have proposed two types of diffusion models that potentially describe the adoption ofpayment by credit card. The first type focuses on the aspect of externalities in using a particular paymentmethod, as considered by McAndrews and Wang (2012). The other type highlights the aspect that adoptersof a new technology have some influence on non-adopters’ behavior through networks, as described by Young(2009). More specifically, contact with adopters may directly change non-adopters’ choice (contagion), orindirectly provide information persuading non-adopters to adopt the new technology (social learning). Thesestudies can be arguably regarded as focusing on the extensive margin, while our study mainly examines theintensive margin.
11
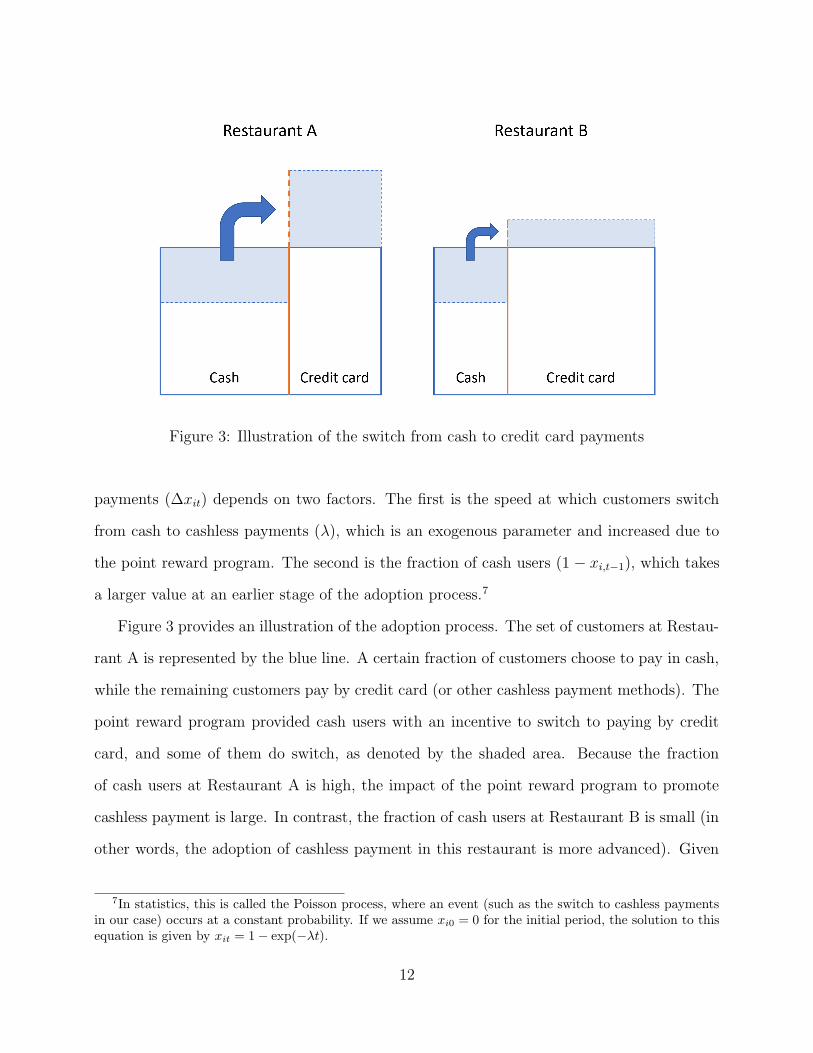
Figure 3: Illustration of the switch from cash to credit card payments
payments (∆xit) depends on two factors. The first is the speed at which customers switch
from cash to cashless payments (λ), which is an exogenous parameter and increased due to
the point reward program. The second is the fraction of cash users (1 − xi,t−1), which takes
a larger value at an earlier stage of the adoption process.7
Figure 3 provides an illustration of the adoption process. The set of customers at Restau-
rant A is represented by the blue line. A certain fraction of customers choose to pay in cash,
while the remaining customers pay by credit card (or other cashless payment methods). The
point reward program provided cash users with an incentive to switch to paying by credit
card, and some of them do switch, as denoted by the shaded area. Because the fraction
of cash users at Restaurant A is high, the impact of the point reward program to promote
cashless payment is large. In contrast, the fraction of cash users at Restaurant B is small (in
other words, the adoption of cashless payment in this restaurant is more advanced). Given
7In statistics, this is called the Poisson process, where an event (such as the switch to cashless paymentsin our case) occurs at a constant probability. If we assume xi0 = 0 for the initial period, the solution to thisequation is given by xit = 1− exp(−λt).
12

that the probability with which cash users switch to credit cards is assumed to be identical
across restaurants, the impact of the point reward program is smaller than at Restaurant A.
What matters for our analysis here is that the fraction of cash users differs between these two
restaurants, which is denoted by the orange line. Although our dataset does not include cash
transactions, we can proxy the location of the orange line by the time that has elapsed since
a restaurant started accepting credit card payments. Using this approach, we empirically
test the model.
To discuss how our model is related to those used in earlier studies, we employ the
following extended version of Equation (1):
∆xit = (θxi,t−1 + λ)(1− xi,t−1). (2)
In this equation, the fraction of cash users still plays a role in determining the increase in
cashless payments; however, the probability with which they switch to cashless payments is
more complex. Specifically, λ is an exogenous parameter capturing the impact of the point
reward program, while θxi,t−1 is an endogenous variable that captures the effect of imitation;
i.e., the more customers use cashless payments, the higher is the probability with which cash
users switch to cashless payments (where θ > 0). This can be interpreted as the impact of
the diffusion of cashless payment technology. If we assume λ = 0, Equation (2) reduces to
the standard logistic function.8
To quantify the heterogeneous impact of the point reward program depending on the
stage of the adoption process, we estimate the following:
ln
(yit +
√y2it + 1
)= α(sit)Dit + β(sit)Hit + γi + δt + ϵit, (3)
8In the general case where λ > 0, and assuming xi0 = 0 for the initial period, the solution of Equation
(2) is xit =1−exp(−(θ+λ)t)
1+(θ/λ) exp(−(θ+λ)t) . The relationship between these equations is discussed by Young (2009).
13

where yit denotes the amount paid via credit cards at restaurant i in month t.9 Dit is a
dummy variable that takes one if restaurant i participated in the program in month t, and
zero otherwise. Hit is another dummy variable that takes one if restaurant i participated
in the program and t is one of the months from July to December 2020.10 Note that the
coefficients on these dummy variables (α and β) depend on how long a restaurant has been
accepting payment by credit card (measured in terms of sit, the number of quarters that have
elapsed since restaurant i started accepting credit card payments), which we use as a proxy
for the extent to which customers of a particular restaurant adopted payment by credit card.
Finally, γi denotes restaurant fixed effects, while δt represents time fixed effects.11 ϵit is the
error term.
The parameters of interest in Equation (3) are α(s), β(s), and ∂α∂sit
. First, α(s) represents
the average impact of the point reward program on credit card spending at restaurants that
participated in the program from October 2019 to June 2020 (i.e., the treatment effect),
where s denotes the average of the adoption of credit card payments across restaurants. We
estimate this parameter based on a staggered difference-in-differences approach. Second, β(s)
represents the average impact of the point reward program on credit card spending at partici-
pating restaurants after the program. As discussed, this program accelerated the adoption of
credit card usage, indicating that its impact persisted after the program ended, even though
the financial incentive provided by the government was temporary. The parameters α and
β are expected to be positive. Third, ∂α∂sit
denotes the dependence of the treatment effects
on the degree to which cashless payments had been adopted at individual restaurants. This
9The payment amounts at different restaurants and in different months follow highly skewed distributionsand there are many cases in which the payment amount is zero. We therefore use a transformation calledthe inverse hyperbolic sine rather than the natural logarithm. See Burbidge et al. (1988) for a detaileddiscussion.
10This dummy variable captures the potential effect of the point reward program after it ended in June2020.
11We also use time fixed effects specific to types of restaurants and find that the results are almost identicalto those presented below. Specifically, we classify restaurants covered in the dataset into cafes, Japanese-stylerestaurants, non-Japanese-style restaurants, chain restaurants, bars, and Japanese-style pubs.
14

parameter is expected to be negative, which we estimate by including the interaction term
sit ×Dit as an explanatory variable.
5 Estimation Results
5.1 Baseline Results
The estimation results are shown in Table 1. First, column (1) indicates that the point reward
program had a significant positive impact on credit card spending, which is estimated to have
increased by 46 percent on average. In column (2), the sample is restricted to restaurants
that had at least one record of a credit card transaction during the first surge of COVID-19
(April and May 2020). In this case, the impact of the program is estimated to be 26 percent,
which is somewhat smaller but still statistically significant. Second, columns (3) and (4)
show that the impact on credit card spending at restaurants in the treatment group was
positive and significant after the point reward program ended, suggesting that the impact of
the program persisted and was not simply transitory. Third, columns (5) and (6) indicate
that the more advanced the adoption of credit card payments at a restaurant, the smaller
was the impact of the program.
In Table 2, we use the number of credit card users instead of spending as the dependent
variable. The results are very similar. Specifically, the impact of the program on the number
of credit card users at restaurants in the treatment group was positive and significant both
during and after the program. In addition, the impact was smaller at restaurants that
were more advanced in the adoption of credit cards (i.e., where already a larger number of
customers were making payments by credit card).
Next, we estimate the impact of the point reward program on a monthly basis by defining
the dummy variables for the treatment group for each of the months from October 2019 to
December 2020. In this estimation, we also include a dummy variable that takes a value
15
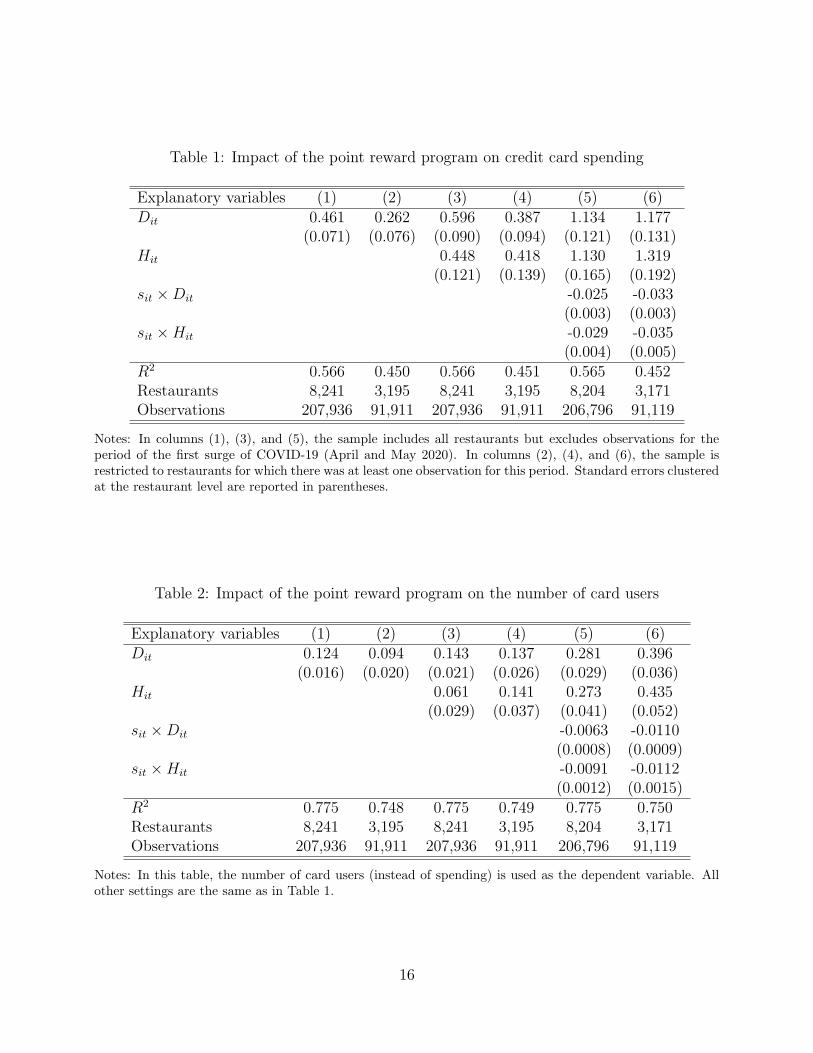
Table 1: Impact of the point reward program on credit card spending
Explanatory variables (1) (2) (3) (4) (5) (6)Dit 0.461 0.262 0.596 0.387 1.134 1.177
(0.071) (0.076) (0.090) (0.094) (0.121) (0.131)Hit 0.448 0.418 1.130 1.319
(0.121) (0.139) (0.165) (0.192)sit ×Dit -0.025 -0.033
(0.003) (0.003)sit ×Hit -0.029 -0.035
(0.004) (0.005)R2 0.566 0.450 0.566 0.451 0.565 0.452Restaurants 8,241 3,195 8,241 3,195 8,204 3,171Observations 207,936 91,911 207,936 91,911 206,796 91,119
Notes: In columns (1), (3), and (5), the sample includes all restaurants but excludes observations for theperiod of the first surge of COVID-19 (April and May 2020). In columns (2), (4), and (6), the sample isrestricted to restaurants for which there was at least one observation for this period. Standard errors clusteredat the restaurant level are reported in parentheses.
Table 2: Impact of the point reward program on the number of card users
Explanatory variables (1) (2) (3) (4) (5) (6)Dit 0.124 0.094 0.143 0.137 0.281 0.396
(0.016) (0.020) (0.021) (0.026) (0.029) (0.036)Hit 0.061 0.141 0.273 0.435
(0.029) (0.037) (0.041) (0.052)sit ×Dit -0.0063 -0.0110
(0.0008) (0.0009)sit ×Hit -0.0091 -0.0112
(0.0012) (0.0015)R2 0.775 0.748 0.775 0.749 0.775 0.750Restaurants 8,241 3,195 8,241 3,195 8,204 3,171Observations 207,936 91,911 207,936 91,911 206,796 91,119
Notes: In this table, the number of card users (instead of spending) is used as the dependent variable. Allother settings are the same as in Table 1.
16

Figure 4: Monthly impact of the point reward program on credit card use
Notes: This figure shows the estimated coefficient on the dummy variable for participating restaurants ineach month. The shaded areas denote the 95 percent confidence intervals. The sample and specification usedin these panels are essentially the same as those used in column (4) of Tables 1 and 2.
17

of one for the month of September 2019—the month before the program took effect—for
restaurants that participated in the program in October 2019. The purpose of this “placebo
variable” is to examine whether there are any systematic differences in terms of credit card
spending and/or the number of card users between the treatment group and the control
group.
Panel (a) of Figure 4 shows that the monthly impact of the program was significantly
positive for most of the period from October 2019 to December 2020 (the exception being the
period of the first surge in COVID-19 infections in April and May 2020 and the second surge
in August 2020), and that there was no significant placebo effect in September 2019. This
finding is consistent with our hypothesis that restaurants that participated in the program
saw a faster increase in payments by credit card. Panel (b) shows the monthly impact on
the number of credit card users. The pattern is very similar to Panel (a). We discuss why
the impact of the point reward program was smaller during the first surge of COVID-19 in
the next part.
5.2 Impact of the COVID-19 Pandemic on the Choice of Payment
Method
In our observation period, not only the point reward program but also the COVID-19 pan-
demic may have influenced the payment method used by consumers (as discussed by Cevik
2020 and Wisniewski et al., 2021). In this part, we examine the impact of the COVID-19
pandemic.
We again use the framework shown in Figure 3. Specifically, the pandemic has had two
different effects on payment behavior. First, people have refrained from going out during the
pandemic, leading to a decrease in the number of customers and hence credit card users at
restaurants. We assume that the extent to which restaurants are affected by this is identical
across restaurants participating and not participating in the point reward program, so that
18

this effect is absorbed by the time fixed effects. Second, during the pandemic, some customers
previously using cash switched to credit cards in an attempt to reduce the risk of infection.
We assume that customers that visited restaurants in this period were identical in terms of
their behavior to avoid infection, meaning that the probability with which cash users switched
to cashless payments was identical across restaurants. This implies that the share of cash
users plays a central role in determining the impact of the pandemic to promote cashless
payments, as discussed in Section 4. On the one hand, the share of cash users at restaurants
that participated in the point reward program was already small just before the surge of
COVID-19 infections in April and May 2020, since many cash users had already switched to
paying by credit card due to the program (as at Restaurant B). On the other hand, the share
of cash users at restaurants that did not participate in the program (as at Restaurant A) was
still large since the customers of those restaurants could not take advantage of the program,
suggesting that the impact of the COVID-19 pandemic on card usage was heterogeneous
across participating and non-participating restaurants.
We examine the impact of the pandemic in two ways. First, we use the fact that the
Japanese government declared a state of emergency in Tokyo from April 7, 2020, to May 25,
2020. The state of emergency highlighted the risk of infection and may have led people to
pay by card even at restaurants that did not participate in the point reward program. It is
therefore likely that the difference between restaurants participating and not participating
in the program in terms of customers’ use of credit cards became smaller. To test this, we
construct a dummy variable, Ct, that takes one during the state of emergency period and zero
otherwise, and add the interaction term Dit × Ct as an explanatory variable in the baseline
estimation. Second, we use the mobility data provided by Google. Given that avoiding
outings and switching to cashless payments have the same purpose of reducing the risk of
infection, it is likely that the extent to which consumers engaged in these behaviors is closely
linked. This implies that people were more likely to switch to cashless payment methods at
19

Figure 5: Number of people visiting retail shops during the pandemic
Notes: This figure shows the year-on-year rate of change in the number of people visiting retail shops inTokyo from February to December 2020. The original data provided by Google are daily data, which weconvert to monthly data by taking the simple average.
times that they also refrained more from going out. We therefore use the Google mobility
data as a proxy for payment behavior. Specifically, we include the interaction term Dit ×mt
in the estimation, where mt denotes the year-on-year rate of change in the number of visitors
to retail shops in Tokyo (which is shown in Figure 5).12
The results are presented in Tables 3 and 4. Table 3 shows that restaurants that par-
ticipated in the point reward program from October 2019 to June 2020 experienced higher
growth in both credit card spending and the number of card users, but that most of the
impact of the program vanished during the state of emergency period (the coefficients on
12The Google dataset reports the numbers from February 2020, which we use in this estimation. For otherperiods, we impute mt = 0 assuming that the impact of the point reward program was unrelated to thenumber of people going out before the COVID-19 pandemic.
20

Table 3: Impact of the point reward program during the state of emergency period
Payment amounts Number of card usersExplanatory variables (1) (2) (3) (4)Dit 0.346 0.466 0.121 0.162
(0.076) (0.091) (0.019) (0.024)Dit × Ct -0.346 -0.332 -0.109 -0.104
(0.127) (0.128) (0.037) (0.038)Hit 0.414 0.140
(0.139) (0.037)R2 0.450 0.451 0.748 0.749Restaurants 3,195 3,195 3,195 3,195Observations 91,911 91,911 91,911 91,911
Notes: Ct is a dummy variable that takes one for April and May 2020 (the state of emergency period), andzero otherwise. Standard errors clustered at the restaurant level are reported in parentheses.
Table 4: Impact of the point reward program and the number of people going out
Payment amounts Number of card usersExplanatory variables (1) (2) (3) (4)Dit 0.389 0.505 0.130 0.169
(0.084) (0.094) (0.022) (0.025)Dit ×mt 0.0067 0.0063 0.0018 0.0017
(0.0027) (0.0027) (0.0008) (0.0008)Hit 0.829 0.279
(0.405) (0.099)Hit ×mt 0.0185 0.0062
(0.0159) (0.0038)R2 0.450 0.451 0.748 0.749Restaurants 3,195 3,195 3,195 3,195Observations 91,911 91,911 91,911 91,911
Notes: mt denotes the year-on-year rate of change in the number of people visiting retail shops in Tokyo.Standard errors clustered at the restaurant level are reported in parentheses.
21

Dit×Ct are negative and statistically significant). This is consistent with the finding in Fig-
ure 4 that the impact of the program is not statistically significant for this period, suggesting
that cash users switched to credit cards even at non-participating restaurants in order to
avoid the risk of infection.
By comparing the results in Tables 2 and 3, we can estimate the impact of the COVID-19
pandemic on the choice of payment method relative to the point reward program. First,
looking at column (4) of Table 2 as an example, the coefficient on the dummy variable for
participating restaurants is 0.137, while the corresponding value in column (4) of Table 3
at 0.162 is considerably larger. This indicates that by controlling for the emergency period,
we can remove biases from the estimated impact of the point reward program. Second, the
coefficient estimates for the dummy variable for the period after the program in these tables
are 0.141 and 0.140, indicating that they are not subject to biases. Third, the coefficient
estimate for the interaction term in column (4) of Table 3 is -0.104 and statistically significant.
This finding indicates that while the pandemic had an impact on both restaurants that
participated and restaurants that did not participate in the point reward program, the impact
of the pandemic was larger for non-participating restaurants (due to the larger share of cash
users). Quantitatively, while the impact of the program was 0.162, that of the pandemic
was 0.104 + g for non-participating restaurants and g for participating ones, where g is the
impact of the COVID-19 surge on credit card usage common across restaurants (g > 0). If g
is very close to zero, the impact of the pandemic was 0.104 for non-participants, which is the
most conservative estimate (around two-thirds of the impact of the point reward program).
On the other hand, if g is somewhat positive, the pandemic may have had a larger impact
on consumers’ choice of payment method than the point reward program.
Next, Table 4 reports how the impact of the program depends on the number of people
going out. In column (1), for example, the average impact of the program is estimated to
be 0.389 and the coefficient on the interaction term is estimated to be 0.0067 (both are
22

statistically significant). The number of people going out decreased by 50 percent in April
2020, meaning that the impact of the program declined by 0.335 (= 0.0067 × 50) in this
month. The other columns show similar results. In sum, during the first surge of COVID-
19, the difference between restaurants participating and not participating in the program in
terms of customers’ use of credit cards decreased.
6 Robustness Checks
6.1 Robustness Check Using Similar Restaurants
Of the roughly 8,000 restaurants in our sample, around 2,000 participated in the point re-
ward program, while the remaining 6,000 did not. This large asymmetry in the number of
restaurants that participated and those that did not suggests that the two groups may differ
in terms of their underlying characteristics. In this part, we address this issue.
We check the robustness of the baseline results focusing on restaurants that are similar.
Specifically, we take advantage of the fact that the database we use provides anonymized
identifiers of individual credit card users.13 Using the identifiers of credit card users at
participating restaurants, we calculate the share that the card spending of these customers
accounts for in the total card spending at each non-participating restaurant. If this share is
high, a non-participating restaurant is similar to participating restaurants in that they are
frequented by similar customers. Based on this criterion, we construct a sample in which
the number of non-participating restaurants is equal to that of participating restaurants and
repeat the baseline estimation.
The estimation results are presented in Tables 5 and 6. Columns (1) and (2) of Table 5
indicate that the point reward program increased the amount paid by credit card by 25-52
13As mentioned, such identifiers, in addition to being anonymized, are reshuffled quarterly for privacyprotection.
23

Table 5: Robustness check using similar restaurants: Spending
Explanatory variables (1) (2) (3) (4) (5) (6)Dit 0.522 0.257 0.499 0.273 1.020 1.076
(0.086) (0.085) (0.105) (0.103) (0.130) (0.136)Hit -0.082 0.059 0.651 1.002
(0.142) (0.153) (0.181) (0.204)sit ×Dit -0.025 -0.034
(0.003) (0.003)sit ×Hit -0.032 -0.036
(0.005) (0.005)R2 0.559 0.436 0.559 0.436 0.558 0.439Restaurants 4,258 2,156 4,258 2,156 4,236 2,141Observations 105,468 61,269 105,468 61,269 104,793 60,774
Notes: The table shows the estimation results based on a sample consisting of similar restaurants. See thetext for how this sample is constructed. Standard errors clustered at the restaurant level are reported inparentheses.
Table 6: Robustness check using similar restaurants: Number of card users
Explanatory variables (1) (2) (3) (4) (5) (6)Dit 0.138 0.069 0.110 0.073 0.247 0.336
(0.019) (0.022) (0.023) (0.029) (0.030) (0.038)Hit -0.106 0.013 0.125 0.320
(0.032) (0.040) (0.042) (0.055)sit ×Dit -0.0067 -0.0113
(0.0008) (0.0009)sit ×Hit -0.0102 -0.0118
(0.0012) (0.0015)R2 0.758 0.721 0.758 0.721 0.758 0.725Restaurants 4,258 2,156 4,258 2,156 4,236 2,141Observations 105,468 61,269 105,468 61,269 104,793 60,774
Notes: In this table, the number of card users (instead of spending) is used as the dependent variable. Allother settings are the same as in Table 5.
24

percent, which is similar to the baseline results. However, columns (3) and (4) show that
this positive impact did not persist after the program ended in June 2020. One possible
interpretation is that the COVID-19 pandemic led people to use cashless payment methods
at non-participating restaurants (as shown in the previous section), so that the difference
between participants and non-participants of the program is not statistically significant.
Columns (5) and (6) indicate that the coefficients on the interaction terms are negative and
statistically significant, which is consistent with the baseline results. Similar findings are
obtained in Table 6, where the number of card users is used as the dependent variable.
6.2 Robustness Check: Potential Bias due to Heterogeneous Treat-
ment Effects
The baseline analysis showed that the impact of the points reward program was heterogeneous
in that the size of the impact depended on how advanced the adoption of credit card payments
at a particular restaurant already was when the program started. However, the presence of
such heterogeneity means that the estimates of the average treatment effect may be incorrect,
as discussed, for example, by de Chaisemartin and D’Haultfœuille (2020) and Goodman-
Bacon (2021). In this subsection, we address this issue.
De Chaisemartin and D’Haultfœuille (2020) provide a clear description of the circum-
stances under which estimates may be incorrect. They show theoretically that the aver-
age treatment effect is obtained as the weighted sum of individual treatment effects, i.e.,
difference-in-differences that compare the outcomes between consecutive time periods across
groups. This means that a group classified as the control group in a comparison may be
treated in both periods, so that the individual treatment effect regarding this group will
be subtracted in the next period, to which negative weights are assigned. Thus, given that
these effects are heterogeneous across groups or periods, the average treatment effect may be
biased.
25

Table 7: Robustness check: Potential bias arising from heterogeneous treatment effects
Payment amounts Number of card usersExplanatory variable (1) (2) (3) (4)Dit 0.350 0.485 0.095 0.180
(0.077) (0.099) (0.014) (0.023)Observations 207,936 91,911 207,936 91,911
Notes: The table reports the estimation results based on de Chaisemartin and D’Haultfœuille’s (2020)method, which addresses heterogeneity in treatment effects. The estimation includes fixed effects for restau-rants and periods. Standard errors clustered at the restaurant level are reported in parentheses.
We address this issue by following the estimation method proposed by de Chaisemartin
and D’Haultfœuille, which consists of two parts. The first is to simply calculate the fraction
of negative weights, which we find to be very small (less than 5 percent) in our dataset. This
suggests that the baseline estimates are unlikely to be sensitive to heterogeneity. The second
part is to obtain estimates of the average treatment effect that are robust to heterogeneous
treatment effects by using their computation package (called fuzzydid in Stata). The results
are shown in Table 7 and are essentially similar to those in Tables 1 and 2; however, in
this table the impact of the program is larger for small sample cases (columns (2) and (4))
than large sample cases (columns (1) and (3)), which is somewhat different from the baseline
results.
7 Concluding Remarks
In this study, we examined the impact of Japan’s point reward program for cashless payments
using credit card transaction data. Our main findings are as follows. First, the program had
a positive impact on both the amounts paid by credit card and the number of card users.
Second, this positive impact persisted even after the program ended in June 2020. Third,
the impact of this program depended on the extent to which customers of a restaurant had
26

already adopted payment by credit card.
Our findings have two policy implications. First, we showed that the impact of the point
reward program is persistent rather than transitory, so that the government program to
promote cashless payments was effective during and after the surges in COVID-19 infections.
Our results indicate that the impact of the government program in terms of boosting cashless
payments was comparable to that of the risk of infection, although we estimated the lower
bound of the impact of COVID-19, not the impact itself. Second, we showed that the
program had heterogeneous impacts depending on the stage of the adoption process. This is
informative for policy makers in promoting the adoption of new technologies such as FinTech
or a central bank digital currency.
References
[1] Alvarez, F., and F. Lippi (2017), “Cash Burns: An Inventory Model with a Cash-Credit
Choice,” Journal of Monetary Economics, 90, 99-112.
[2] Borzekowski, R., E. K. Kiser, and S. Ahmed (2008), “Consumers’ Use of Debit Cards:
Patterns, Preferences, and Price Response,” Journal of Money, Credit and Banking,
40(1), 149-172.
[3] Bourguignon, H., R. Gomes, and J. Tirole (2014), “Card Surcharges and Cash Discounts:
Simple Economics and Regulatory Lessons,” Competition Policy International, 10(2),
12-27.
[4] Burbidge, J. B., L. Magee, and A. L. Robb (1988), “Alternative Transformations to
Handle Extreme Values of the Dependent Variable,” Journal of the American Statistical
Association, 83(401), 123-127.
27

[5] Carbo-Valverde, S., and J. M. Linares-Zegarra (2011), “How Effective Are Rewards
Programs in Promoting Payment Card Usage? Empirical Evidence,” Journal of Banking
and Finance, 35(12), 3275-3291.
[6] Cevik, S. (2020), “Dirty Money: Does the Risk of Infectious Disease Lower Demand for
Cash?” International Finance, 23, 460-471.
[7] Chen, H., W. Engert, K. P. Huynh, G. Nicholls, M. Nicholson, and J. Zhu (2020), “Cash
and COVID-19: The Impact of the Pandemic on the Demand for and Use of Cash,”
Staff Discussion Paper 2020-06, Bank of Canada.
[8] Ching, A. T., and F. Hayashi (2010), “Payment Card Rewards Programs and Consumer
Payment Choice,” Journal of Banking and Finance, 34, 1773-1787.
[9] de Chaisemartin, C., and X. D’Haultfœuille (2020), “Two-Way Fixed Effects Estimators
with Heterogeneous Treatment Effects,” American Economic Review, 110(9), 2964-2996.
[10] Goodman-Bacon, A. (2021), “Difference-in-Differences with Variation in Treatment
Timing,” Journal of Econometrics, forthcoming.
[11] Griliches, Z. (1957), “Hybrid Corn: An Exploration in the Economics of Technological
Change,” Econometrica, 25(4), 501-522.
[12] Jonker, N., M. Plooij, and J. Verburg (2017), “Did a Public Campaign Influence Debit
Card Usage? Evidence from the Netherlands,” Journal of Financial Services Research,
52, 89-121.
[13] Jovanovic, B., and Z. Wang (2020), “Idea Diffusion and Property Rights,” NBER Work-
ing Paper Series 28019, National Bureau of Economic Research.
[14] Klee, E. (2008), “How People Pay: Evidence from Grocery Store Data,”Journal of
Monetary Economics, 55, 526-541.
28

[15] Koulayev, S., M. Rysman, S. Schuh, and J. Stavins (2016), “Explaining Adoption and
Use of Payment Instruments by US Consumers,” RAND Journal of Economics, 47(2),
293-325.
[16] McAndrews, J., and Z. Wang (2012), “The Economics of Two-Sided Payment Card
Markets: Pricing, Adoption and Usage,” Working Paper 12-06, The Federal Reserve
Bank of Richmond.
[17] Mobius, M., and T. Rosenblat (2014), “Social Learning in Economics,” Annual Review
of Economics, 6, 827-847.
[18] Rogoff, K. (2015), “Costs and Benefits to Phasing out Paper Currency,” in J. A. Parker
and M. Woodford (eds.), NBER Macroeconomics Annual 2014, Volume 29, 445-456.
[19] Rogoff, K., and J. Scazzero (2021), “COVID Cash,” Cato Journal, 41(3), 571-592.
[20] Schmiedel, H., G. Kostova, and W. Ruttenberg (2012), “The Social and Private Costs of
Retail Payment Instruments: A European Perspective,” ECB Occasional Paper Series
137, European Central Bank.
[21] Wakamori, N., and A. Welte (2017), “Why Do Shoppers Use Cash? Evidence from
Shopping Diary Data,” Journal of Money, Credit and Banking, 49(1), 115-169.
[22] Wang, Z., and A. L. Wolman (2016), “Payment Choice and Currency Use: Insights from
Two Billion Retail Transactions,” Journal of Monetary Economics, 84, 94-115.
[23] Wisniewski, T. P., M. Polasik, R. Kotkowski, and A. Moro (2021), “Switching from Cash
to Cashless Payments during the COVID-19 Pandemic and Beyond,” NBP Working
Paper 337, Narodowy Bank Polski.
[24] Young, H. P. (2009), “Innovation Diffusion in Heterogeneous Populations: Contagion,
Social Influence, and Social Learning,” American Economic Review, 99(5), 1899-1924.
29


