Global Wind Energy Development and its Operational Challenges
China – Korea Joint Seminar on Wind Energy, Beijing, China 16 October 2013 Prof. Saifur Rahman
2
www.saifurrahman.org
Virginia Tech Research Center Arlington, Virginia, USA

Outline
• Wind Power in U.S. and China • High Wind Power Penetration Challenges • Wind Power Uncertainty • Wind Power Forecasting • Negative Price in Electricity Market • Wind Power Variability • Large Scale Energy Storage Technologies
3
Total Wind Capacity in 2012 (MW)
Source: http://en.wikipedia.org/wiki/Wind_power_by_country
4

Wind Penetration by Annual Electricity Consumption
Source: Berkeley Lab estimates based on data from BTM Consult and elsewhere. Available online at http://www.eolianenergy.com/blog/category/wind-facts/
5
U.S. Wind Power Capacity Growth
Source: “AWEA U.S. Wind Industry First Quarter 2013 Market Report Executive Summary”, Product of AWEA Data Services, April, 2013, available online at http://awea.files.cms plus.com/FileDownloads/pdfs/AWEA%20US%20Wind%20Industry%201Q%202013%20Market%20Report_Executive%20Summary.pdf 6

U.S. Wind Power Capacity, MW (By state)
Source: h3p://awea.files.cms plus.com/File Downloads/pdfs/AWEA%20US%20Wind%20Industry%201Q%202013%20Market%20Report_ExecuMve%20Summary.pdf
7
China Wind Power Capacity, MW
Source: http://www.gwec.net/wp-content/uploads/2012/11/China-Outlook-2012-EN.pdf 8

China Wind Atlas
Source: www.gcchinaturbine.com
9
Source: Zhao Xiaoxin, China EPRI
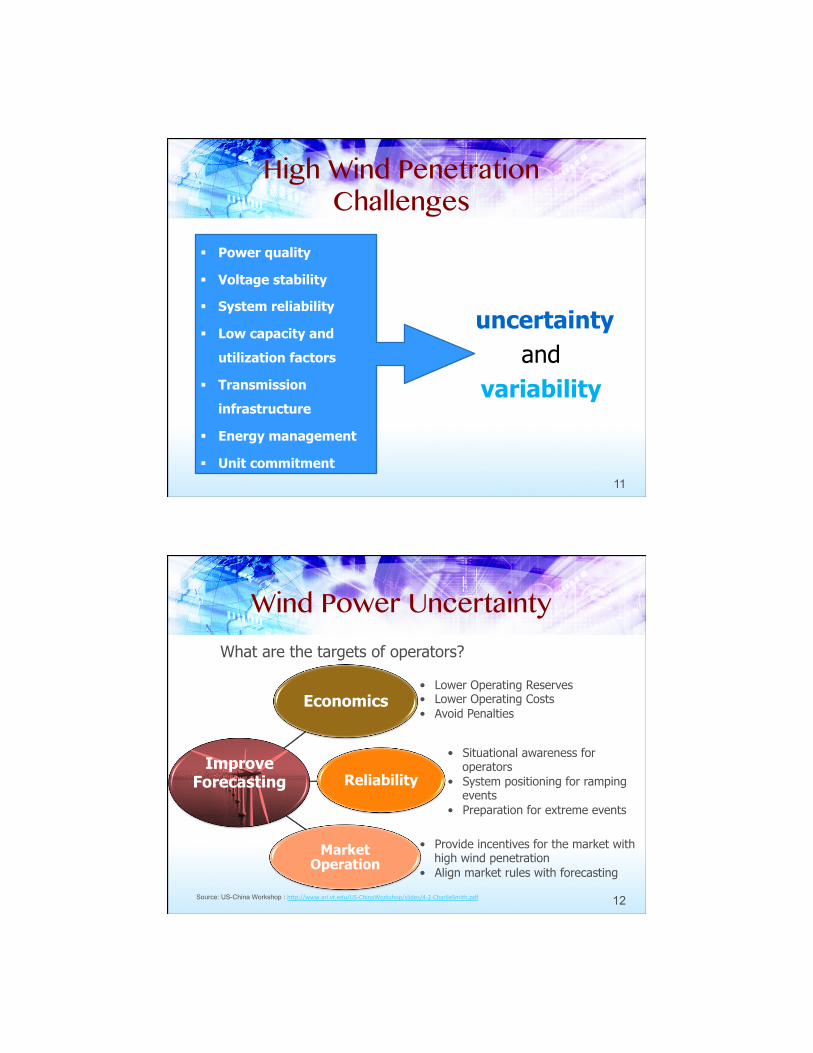
High Wind Penetration Challenges
uncertainty and
variability
§ Power quality
§ Voltage stability
§ System reliability
§ Low capacity and
utilization factors
§ Transmission
infrastructure
§ Energy management
§ Unit commitment
11
Wind Power Uncertainty
What are the targets of operators?
Economics
Reliability
Market Operation
Improve Forecasting
• Provide incentives for the market with high wind penetration
• Align market rules with forecasting
• Situational awareness for operators
• System positioning for ramping events
• Preparation for extreme events
• Lower Operating Reserves • Lower Operating Costs • Avoid Penalties
Source: US-China Workshop : h3p://www.ari.vt.edu/US-‐ChinaWorkshop/slides/4-‐2-‐CharlieSmith.pdf 12

Wind Power Forecasting and ISO Market Rules
PJM MISO ERCOT CAISO
Dispatch Frequency
5 min 5 min
5 min
5 min
Description of Wind Forecasts
Short Term: every 10 min, forecast interval of 5 min for next 6 hours.
Medium Term: hourly, 6 to 48 hours ahead.
Long Term: hourly,
from 48 to 168 hours ahead.
Updates every 5 minutes are
provided for the next 6
hours.
Also hourly updated
forecasts for each hour beyond
6 hours for the next
6 ½ days.
Short-Term : Hourly forecast for an upcoming 48
hour period, updated hourly
and delivered 15 minutes past
the hour.
Next day: hourly forecast
Next hour: each of the next 7 hours,
delivered by 15 minutes after each hour
and at least 1 hour and
45 minutes before real time.
Negative Price Bidding
Allowed
Allowed Allowed
Allowed
Source: US-China Workshop: http://www.uwig.org/windinmarketstableOct2011.pdf 13
Negative Price in Electricity Market
Technical and cost recovery
reasons
Policies for renewable energies
Fossil-fuel plans run for
security reasons
Negative Price
Indicate Supply
Inflexibility
• Can be avoided by shutting down and starting up large turbines
• Production tax credit cause wind generators to se l l ene rgy a t negative price
• Nuclear Power plants operate at full power
Source: available online at h3p://theenergycollecMve.com/michaelgiberson/90061/negaMve-‐power-‐prices-‐rto-‐and-‐bilateral-‐power-‐markets 14
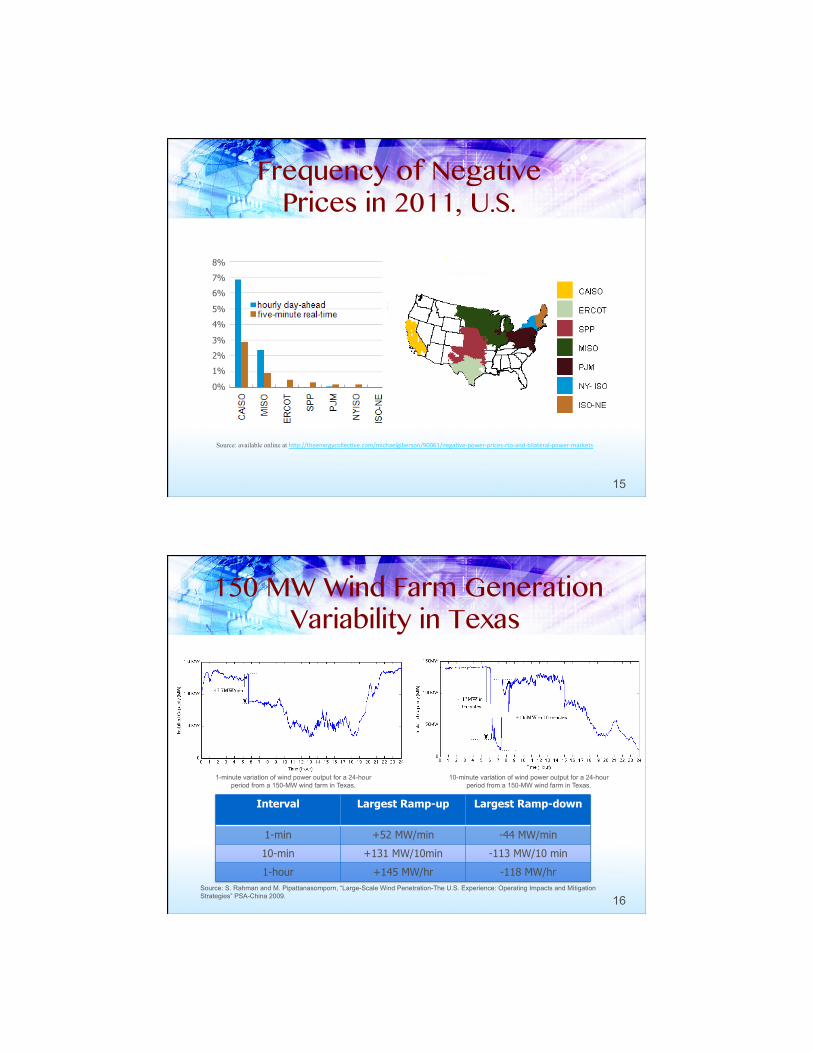
Frequency of Negative Prices in 2011, U.S.
Source: available online at h3p://theenergycollecMve.com/michaelgiberson/90061/negaMve-‐power-‐prices-‐rto-‐and-‐bilateral-‐power-‐markets
15
8%
7%
6%
5%
4%
3%
2%
1%
0%
150 MW Wind Farm Generation Variability in Texas
1-minute variation of wind power output for a 24-hour period from a 150-MW wind farm in Texas.
10-minute variation of wind power output for a 24-hour period from a 150-MW wind farm in Texas.
Interval Largest Ramp-up Largest Ramp-down
1-min +52 MW/min -44 MW/min
10-min +131 MW/10min -113 MW/10 min
1-hour +145 MW/hr -118 MW/hr Source: S. Rahman and M. Pipattanasomporn, “Large-Scale Wind Penetration-The U.S. Experience: Operating Impacts and Mitigation Strategies” PSA-China 2009. 16
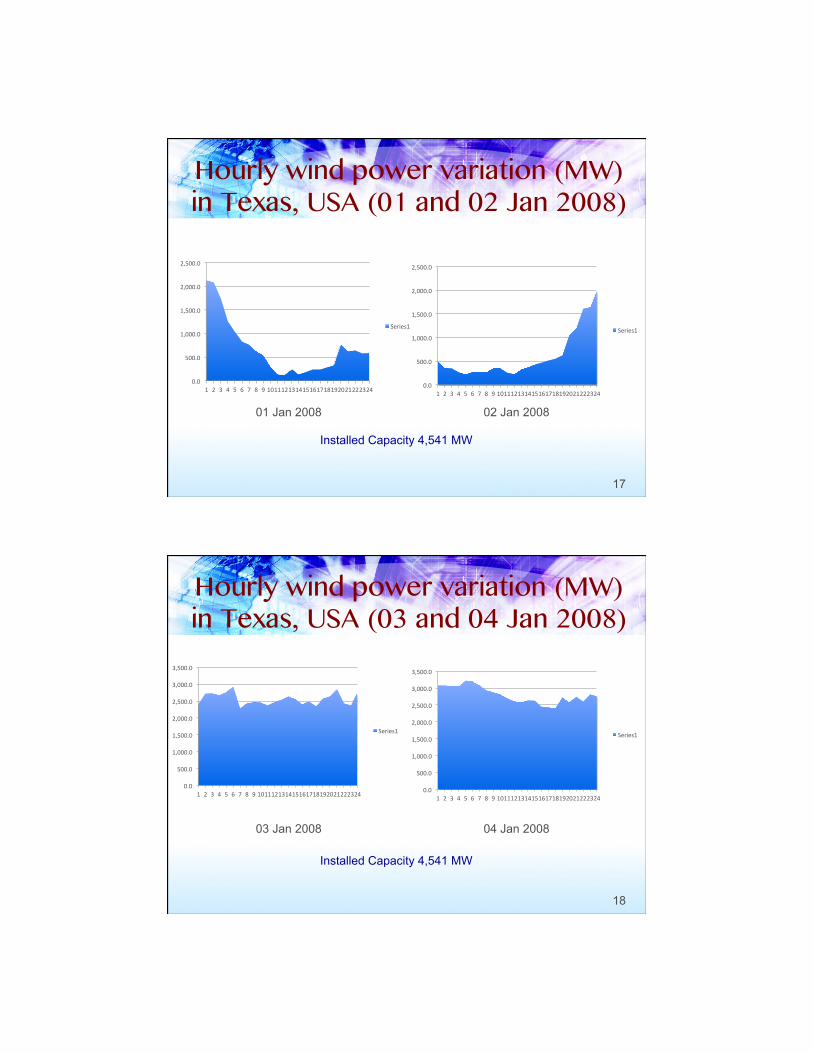
Hourly wind power variation (MW) in Texas, USA (01 and 02 Jan 2008)
17
0.0
500.0
1,000.0
1,500.0
2,000.0
2,500.0
1 2 3 4 5 6 7 8 9 10 11 12 13 14 15 16 17 18 19 20 21 22 23 24
Series1
0.0
500.0
1,000.0
1,500.0
2,000.0
2,500.0
1 2 3 4 5 6 7 8 9 10 11 12 13 14 15 16 17 18 19 20 21 22 23 24
Series1
01 Jan 2008 02 Jan 2008
Installed Capacity 4,541 MW
Hourly wind power variation (MW) in Texas, USA (03 and 04 Jan 2008)
18
03 Jan 2008 04 Jan 2008
Installed Capacity 4,541 MW
0.0
500.0
1,000.0
1,500.0
2,000.0
2,500.0
3,000.0
3,500.0
1 2 3 4 5 6 7 8 9 10 11 12 13 14 15 16 17 18 19 20 21 22 23 24
Series1
0.0
500.0
1,000.0
1,500.0
2,000.0
2,500.0
3,000.0
3,500.0
1 2 3 4 5 6 7 8 9 10 11 12 13 14 15 16 17 18 19 20 21 22 23 24
Series1

Wind Power Variability Solutions
ü Wind farm aggregation would decrease the total wind power output variability.
Wind Farm
Largest Ramp-‐up Largest Ramp-‐down
(MW/hour) % of total capacity
(MW/hour) % of total capacity
150 MW wind
farm 145 97 -‐118 79
4,614 MW mulMple farms
928 20 -‐1,005 22
Largest hourly wind power output fluctuations for a 150-MW farm and an aggregated 4,614MW from multiple wind farms
Source: S. Rahman and M. Pipattanasomporn, “Large-Scale Wind Penetration-The U.S. Experience: Operating Impacts and Mitigation Strategies” PSA-China 2009. 19
Wind Power Variability Solutions, contd.
ü Generation and Demand Mismatch would be managed by balancing authority and frequency regulation.
ISO Acceptable frequency deviation
(Hz)
Frequency Bias (MW/
0.1 Hz)
Mismatch (MW)
PJM ±0.02 1,579 315.8
MISO ±0.02 1,406 281.2
Hz
Load Export Losses
Generation Imports
60 60.02 59.98
Sources: *http://www.pjm.com/~/media/training/core-curriculum/ip-gen-101/how-pjm-oper-and-dispatch.ashx **https://www.misoenergy.org/Library/Repository/Meeting%20Material/Stakeholder/RSC/2012/20120124/20120124%20RSC%20Item%2011%20Frequency%20Response%20Update.pdf 20
Storage
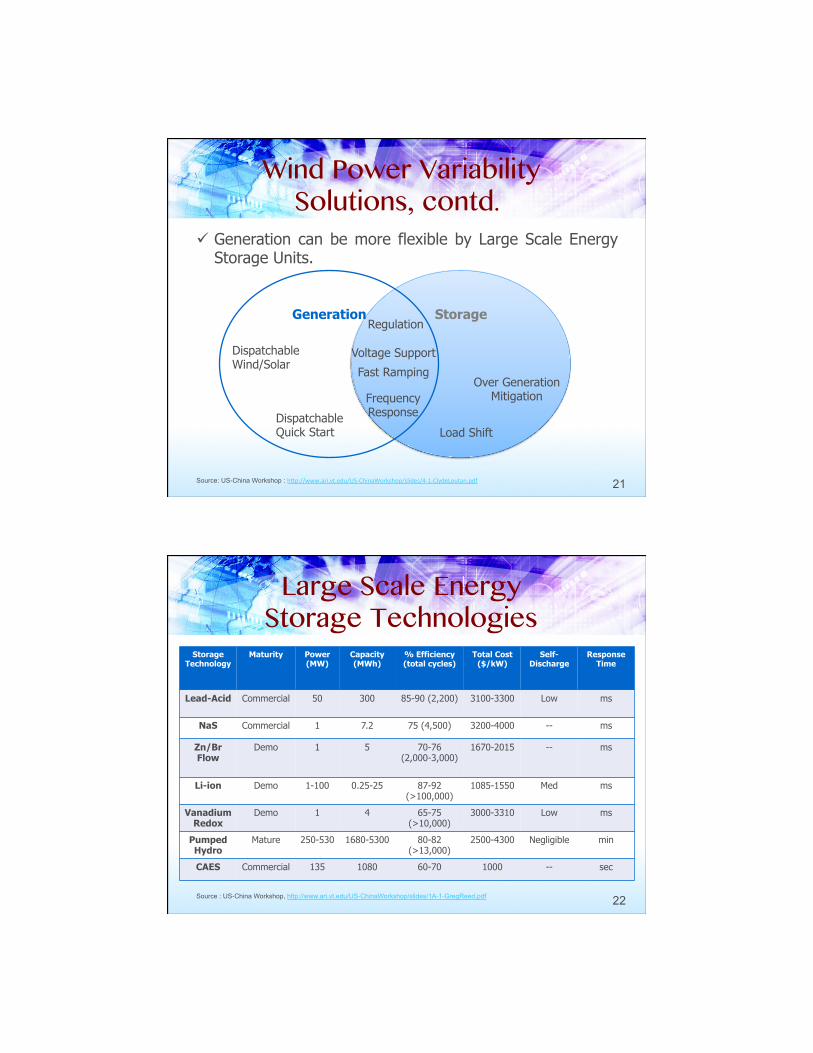
ü Generation can be more flexible by Large Scale Energy Storage Units.
Generation
Dispatchable Wind/Solar
Dispatchable Quick Start
Voltage Support
Regulation
Fast Ramping
Frequency Response
Over Generation Mitigation
Load Shift
Source: US-China Workshop : h3p://www.ari.vt.edu/US-‐ChinaWorkshop/slides/4-‐1-‐ClydeLoutan.pdf 21
Wind Power Variability Solutions, contd.
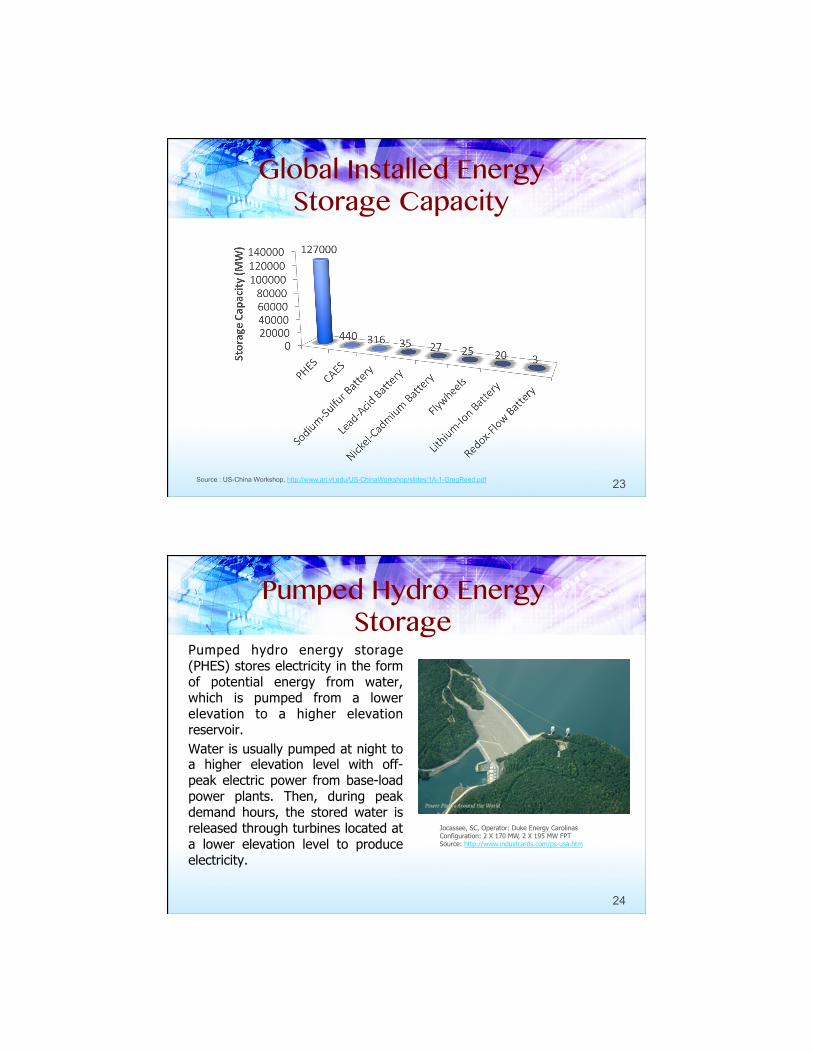
Large Scale Energy Storage Technologies
Storage Technology
Maturity Power (MW)
Capacity (MWh)
% Efficiency (total cycles)
Total Cost ($/kW)
Self- Discharge
Response Time
Lead-Acid Commercial 50 300 85-90 (2,200) 3100-3300 Low ms
NaS Commercial 1 7.2 75 (4,500) 3200-4000 -- ms
Zn/Br Flow
Demo 1 5 70-76 (2,000-3,000)
1670-2015 -- ms
Li-ion Demo 1-100 0.25-25 87-92 (>100,000)
1085-1550 Med ms
Vanadium Redox
Demo 1 4 65-75 (>10,000)
3000-3310 Low ms
Pumped Hydro
Mature 250-530 1680-5300 80-82 (>13,000)
2500-4300 Negligible min
CAES Commercial 135 1080 60-70 1000 -- sec
Source : US-China Workshop, http://www.ari.vt.edu/US-ChinaWorkshop/slides/1A-1-GregReed.pdf 22
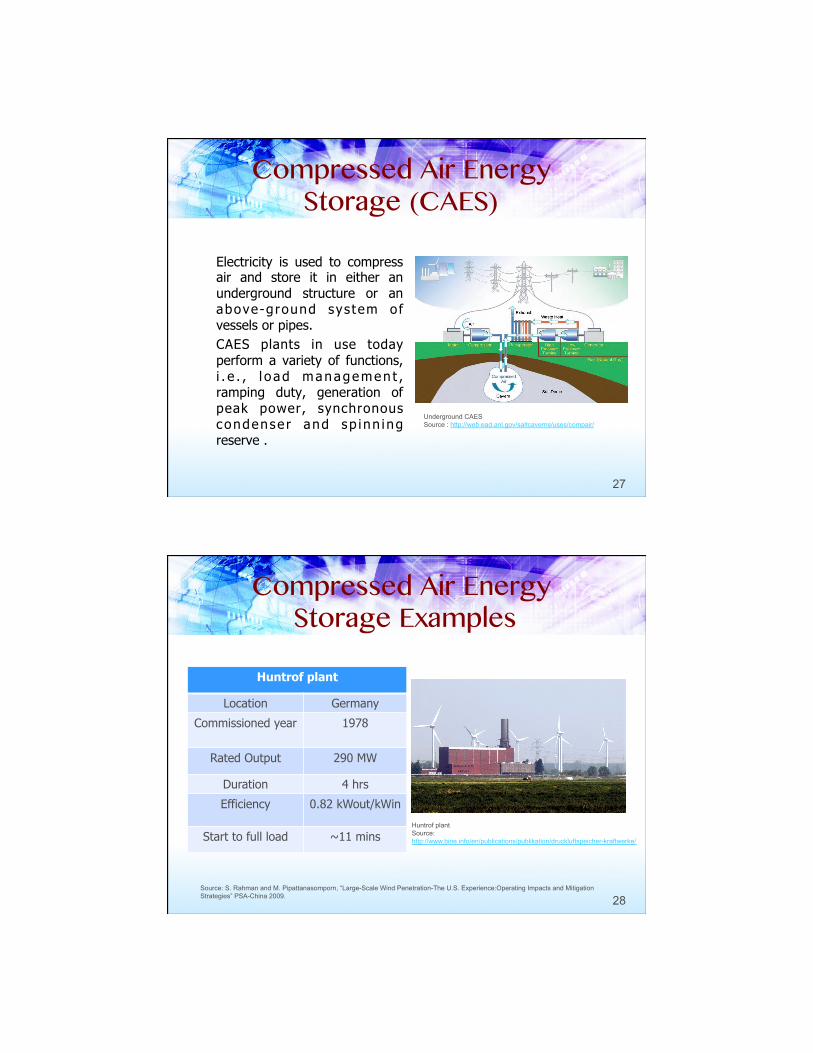
Global Installed Energy Storage Capacity
Source : US-China Workshop, http://www.ari.vt.edu/US-ChinaWorkshop/slides/1A-1-GregReed.pdf 23
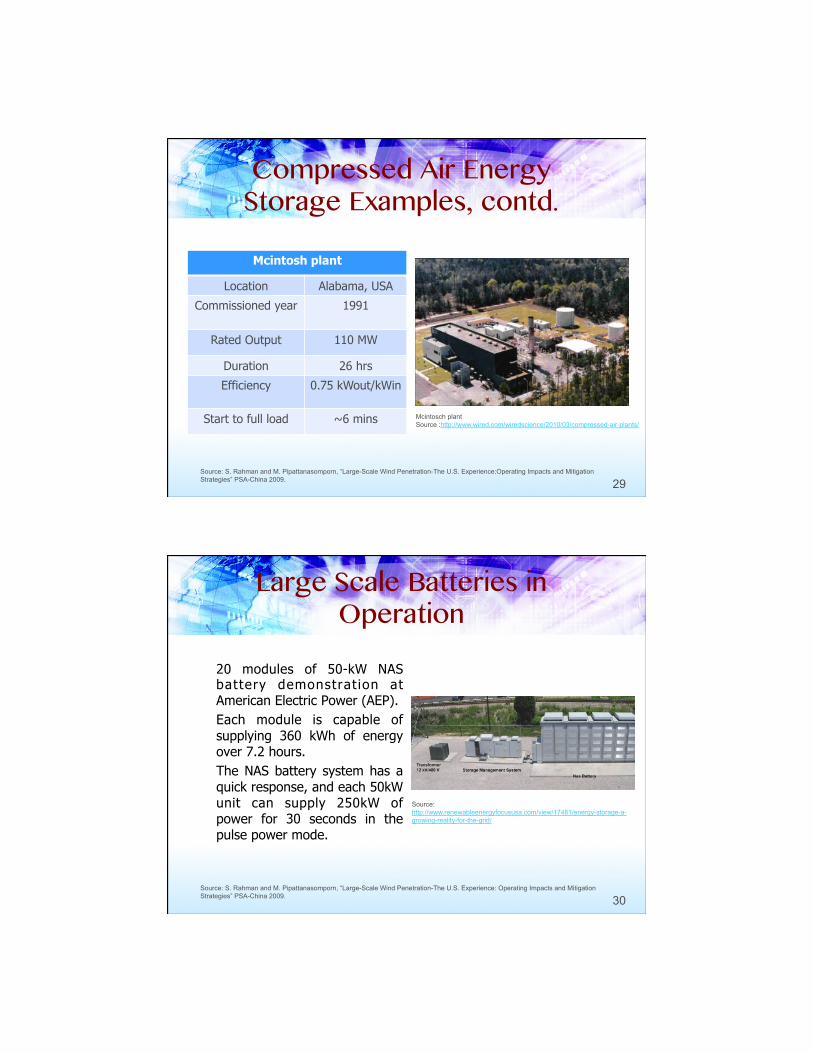
Pumped Hydro Energy Storage
Pumped hydro energy storage (PHES) stores electricity in the form of potential energy from water, which is pumped from a lower elevation to a higher elevation reservoir. Water is usually pumped at night to a higher elevation level with off-peak electric power from base-load power plants. Then, during peak demand hours, the stored water is released through turbines located at a lower elevation level to produce electricity.
Jocassee, SC, Operator: Duke Energy Carolinas Configuration: 2 X 170 MW, 2 X 195 MW FPT Source: http://www.industcards.com/ps-usa.htm
24

Pumped Hydro Energy Storage Example in U.S.
The largest pumped storage unit in the world is located in Bath County, Virginia, USA. It was commissioned in 1985 with the installed capacity of 2.77 GW .
Bath County, VA. Operator: Dominion Virginia Power Configuration: 6 X 462 MW FPT Source: http://www.industcards.com/ps-usa.htm
25
Pumped Hydro Energy Storage Example in China
The second largest pumped storage power station is the Guangzhou pumped storage power station in Guangdong, China. The plant has installed capacity of 2.4 GW.
Source: http://en.wikipedia.org/wiki/Guangdong_Pumped_Storage_Power_Station
26
Compressed Air Energy Storage (CAES)
Electricity is used to compress air and store it in either an underground structure or an above-ground sys tem of vessels or pipes. CAES plants in use today perform a variety of functions, i . e . , l o ad managemen t , ramping duty, generation of peak power, synchronous condense r and sp inn ing reserve .
Underground CAES Source : http://web.ead.anl.gov/saltcaverns/uses/compair/
27
Compressed Air Energy Storage Examples
Huntrof plant
Location Germany
Commissioned year 1978
Rated Output 290 MW
Duration 4 hrs
Efficiency 0.82 kWout/kWin
Start to full load ~11 mins Huntrof plant Source: http://www.bine.info/en/publications/publikation/druckluftspeicher-kraftwerke/
Source: S. Rahman and M. Pipattanasomporn, “Large-Scale Wind Penetration-The U.S. Experience:Operating Impacts and Mitigation Strategies” PSA-China 2009. 28
Compressed Air Energy Storage Examples, contd.
Mcintosh plant
Location Alabama, USA
Commissioned year 1991
Rated Output 110 MW
Duration 26 hrs
Efficiency 0.75 kWout/kWin
Start to full load ~6 mins Mcintosch plant Source :http://www.wired.com/wiredscience/2010/03/compressed-air-plants/
Source: S. Rahman and M. Pipattanasomporn, “Large-Scale Wind Penetration-The U.S. Experience:Operating Impacts and Mitigation Strategies” PSA-China 2009. 29
Large Scale Batteries in Operation
20 modules of 50-kW NAS battery demonstrat ion at American Electric Power (AEP). Each module is capable of supplying 360 kWh of energy over 7.2 hours. The NAS battery system has a quick response, and each 50kW unit can supply 250kW of power for 30 seconds in the pulse power mode.
Source: http://www.renewableenergyfocususa.com/view/17481/energy-storage-a-growing-reality-for-the-grid/
Source: S. Rahman and M. Pipattanasomporn, “Large-Scale Wind Penetration-The U.S. Experience: Operating Impacts and Mitigation Strategies” PSA-China 2009. 30

Large Scale Batteries in Operation, contd.
15-MW battery at Oahu, Hawaii to control ramp rate of a 30 MW wind farm to ±1 MW/min. Each modules rated at 1.5MW/10MWh. Each battery module can p r o v i d e m a x i m u m instantaneous output of 200% of its rated power for 3 seconds, if needed. This project was commissioned in early 2011, and by far the biggest battery application for wind energy storage systems.
Source: http://www.greentechmedia.com/articles/read/xtreme-power-on-hawaii
Source: S. Rahman and M. Pipattanasomporn, “Large-Scale Wind Penetration-The U.S. Experience: Operating Impacts and Mitigation Strategies” PSA-China 2009. 31
Grid-Interactive Electric Thermal Storage (ETS)
Grid-interactive electric thermal storage is a distributed and fast responding storage technology that can be based on either space heating or water heating units. The basis of its operation is the smart controller that is attached to each space heating or water heating unit. This controller can adjust the input wattage up or down in response to renewable power output or conditions of the grid. Space heating with 1.3kW to 160kW inputs can be perceived as 13kWh to 960kWh of storage. For water heating, a 397 liter water heater can be considered as 26-kWh battery storage.
Source: S. Rahman and M. Pipattanasomporn, “Large-Scale Wind Penetration-The U.S. Experience: Operating Impacts and Mitigation Strategies” PSA-China 2009. 32

Grid-Interactive Electric Thermal Storage Example
At present, a 397 liter electric w a t e r h e a t e r i s u n d e r demonstration at the PJM headquarters to provide hot water to the building. The unit is configured to respond to the PJM wholesale price signal and the PJM frequency regulation Signal. It is estimated that the cost of grid-interactive thermal storage is in the range of $100-$200/kW. Source:
http://pluggedin.pjm.com/2013/06/not-your-fathers-water-heater/
Source: S. Rahman and M. Pipattanasomporn, “Large-Scale Wind Penetration-The U.S. Experience: Operating Impacts and Mitigation Strategies” PSA-China 2009. 33
Conclusion
• High wind penetration challenges are caused by the uncertainty and variability of the wind power as a source of renewable energy.
• The uncertainty of wind power can be managed by improving the forecasting ability.
• The wind variability would be reduced by aggregating wind farms. It can also be managed by deploying large scale energy storage units.
• Optimal storage size and schedule can be designed depending on the characteristics and requirements of a particular system, as well as wind and load forecasts.
34

As they say…
In Texas:
If all you ever do is all you ever done,
then all you’ll ever get is all you ever got!
In China:
固步则自封, 求新才能大不同
35 Source: Charles Smith, UWIG
Prof. Saifur Rahman
Virginia Tech, USA
Email: [email protected]
www.saifurrahman.org
Thank you
Thank You


