
Consumer Business
Global powers of the consumer products industry. Thinking inside, outside, and all around the box


Contents
Global powers of the consumer products industry – top 250 consumer products companies, fiscal 2006 ..........3
The value of intangibles: understanding Q ratio ............20
Trends in the consumer products industry ....................23
Consumer business contacts ..........................................27

2 |
Consumer Business

| 3
Global powers of the consumer products industry
Global powers of the consumer products industry – top 250 consumer products companies, fiscal 2006Strong consumer spending drives growthIn 2006, the global economy was very strong, with global GDP rising an astounding 5.4%, one of the fastest rates ever recorded. Relatively rapid economic expansion took place in such disparate locations as Argentina, Canada, China, Germany, India, Russia, the UK, and the US. Even long-stagnant Japan experienced growth far better than in recent years. In many countries, elevated home prices added substantially to consumer wealth, thereby stimulating expanded spending. This was especially true in Australia, Spain, the UK, and the US. Big emerging markets continued to experience rapid growth in consumer incomes, with millions shifting from poverty to the middle class. Economically, this was a good time to be in the business of selling consumer products.
DT rank (FY06)
Company name Country Region Product sectorFY06 net
sales (US$mil)FY06 net
profits (US$mil)FY06 sales
growth
1 Altria Group, Inc. United States North America Food, Drink & Tobacco 101,407 12,185 3.6%
2 Hewlett-Packard Company United States North America Electronic Products 91,658 6,198 5.7%
3 Samsung Electronics Co., Ltd. Korea (South) Asia/Pacific Electronic Products 90,551 8,685 5.9%
4 Nestle SA Switzerland Europe Food, Drink & Tobacco 78,625 7,865 8.1%
5 Matsushita Electric Industrial Co., Ltd. Japan Asia/Pacific Electronic Products 77,966 2,126 2.4%
6 The Procter & Gamble Company United States North America Personal & Household Products 76,476 10,340 12.1%
7 Sony Corporation Japan Asia/Pacific Electronic Products 64,777 1,085 13.1%
8 Toshiba Corporation Japan Asia/Pacific Electronic Products 60,916 1,311 12.2%
9 Dell Inc. United States North America Electronic Products 57,420 2,583 2.9%
10 Nokia Corporation Finland Europe Electronic Products 51,657 5,485 20.3%
11 Unilever Group United Kingdom Europe Personal & Household Products 49,799 6,300 3.2%
12 LG Electronics Inc. Korea (South) Asia/Pacific Electronic Products 49,120 -233 4.3%
13 Motorola, Inc. United States North America Electronic Products 42,879 3,661 21.6%
14 Japan Tobacco Inc. Japan Asia/Pacific Food, Drink & Tobacco 40,826 1,847 2.8%
15 Canon Inc. Japan Asia/Pacific Electronic Products 35,748 4,050 10.7%
16 PepsiCo, Inc. United States North America Food, Drink & Tobacco 35,137 5,642 7.9%
17 Koninklijke Philips Electronics N.V. Netherlands Europe Electronic Products 33,888 6,767 4.7%
18 Sharp Corporation Japan Asia/Pacific Electronic Products 26,774 877 11.8%
19 Bridgestone Corporation Japan Asia/Pacific Tires 25,725 732 11.1%
20 Tyson Foods, Inc. United States North America Food, Drink & Tobacco 25,559 -196 -1.7%
21 The Coca-Cola Company United States North America Food, Drink & Tobacco 24,088 5,080 4.3%
22 Fujifilm Holdings Corporation Japan Asia/Pacific Electronic Products 23,818 403 4.3%
23 Imperial Tobacco Group PLC United Kingdom Europe Food, Drink & Tobacco 21,028 1,545 4.0%
24 Mars, Incorporated United States North America Food, Drink & Tobacco 21,000 e na 16.7%
25 Michelin Group France Europe Tires 20,582 720 5.1%
26 The Goodyear Tire & Rubber Company United States North America Tires 20,258 -330 2.7%
27 Christian Dior SA France Europe Fashion Goods 20,120 2,680 10.0%
28 L'Oreal SA France Europe Personal & Household Products 19,836 2,590 8.7%
e=estimate
4 |
Consumer Business
DT rank (FY06)
Company name Country Region Product sectorFY06 net
sales (US$mil)FY06 net
profits (US$mil)FY06 sales
growth
29 Coca-Cola Enterprises Inc United States North America Food, Drink & Tobacco 19,804 -1,143 5.7%
30 Apple Inc. United States North America Electronic Products 19,315 1,989 38.6%
31 Sanyo Electric Co., Ltd. Japan Asia/Pacific Home Furnishings & Equipment 18,964 -388 -7.6%
32 SABMiller plc United Kingdom Europe Food, Drink & Tobacco 18,620 1,883 21.6%
33 Whirlpool Corporation United States North America Home Furnishings & Equipment 18,080 441 26.3%
34 British American Tobacco plc United Kingdom Europe Food, Drink & Tobacco 17,991 3,774 4.7%
35 Groupe Danone France Europe Food, Drink & Tobacco 17,679 1,960 8.1%
36 Kimberly-Clark Corporation United States North America Personal & Household Products 16,747 1,594 5.3%
37 InBev NV Belgium Europe Food, Drink & Tobacco 16,718 2,671 14.2%
38 NIKE, Inc. United States North America Fashion Goods 16,326 1,492 9.2%
39 Henkel KGaA Germany Europe Personal & Household Products 16,004 1,094 6.4%
40 Anheuser-Busch Companies, Inc. United States North America Food, Drink & Tobacco 15,717 1,965 4.5%
41 Altadis, S.A. Spain Europe Food, Drink & Tobacco 15,707 639 -1.6%
42 Gallaher Group Plc United Kingdom Europe Food, Drink & Tobacco 15,483 752 2.3%
43 Heineken NV Netherlands Europe Food, Drink & Tobacco 14,860 1,690 9.6%
44 Lenovo Group Limited Hong Kong Asia/Pacific Electronic Products 14,590 161 9.9%
45 Diageo plc United Kingdom Europe Food, Drink & Tobacco 14,456 3,007 3.0%
46 Kirin Brewery Company, Limited Japan Asia/Pacific Food, Drink & Tobacco 14,327 522 2.1%
47 Electrolux AB Sweden Europe Home Furnishings & Equipment 14,109 523 3.1%
48 Svenska Cellulosa AB SCA Sweden Europe Personal & Household Products 13,782 743 5.2%
49 Sony Ericsson Mobile Communications AB United Kingdom Europe Electronic Products 13,767 e 1,252 e 50.8%
50 Cadbury Schweppes plc United Kingdom Europe Food, Drink & Tobacco 13,688 2,147 15.5%
51 Eastman Kodak Company United States North America Electronic Products 13,274 -601 -7.0%
52 Masco Corporation United States North America Home Improvement Products 12,778 515 1.7%
53 The Pepsi Bottling Group, Inc. United States North America Food, Drink & Tobacco 12,730 522 7.1%
54 adidas AG Germany Europe Fashion Goods 12,668 623 52.0%
55 General Mills, Inc. United States North America Food, Drink & Tobacco 12,442 1,144 6.9%
56 Asahi Breweries, Ltd. Japan Asia/Pacific Food, Drink & Tobacco 12,439 394 1.1%
57 Sara Lee Corp. United States North America Food, Drink & Tobacco 12,278 504 7.1%
58 Colgate-Palmolive Company United States North America Personal & Household Products 12,238 1,353 7.4%
59 Seiko Epson Corporation Japan Asia/Pacific Electronic Products 12,121 -121 -8.6%
60 ConAgra Foods, Inc. United States North America Food, Drink & Tobacco 12,028 765 3.9%
61 Smithfield Foods, Inc. United States North America Food, Drink & Tobacco 11,911 167 4.4%
62 Fomento Economico Mexicano S.A.B de C.V. Mexico Latin America Food, Drink & Tobacco 11,574 845 13.5%
63 Tchibo Holding AG Germany Europe Food, Drink & Tobacco 11,354 e 1,362 e 2.8%
64 Acer Incorporated Taiwan Asia/Pacific Electronic Products 11,350 318 16.0%
65 Kellogg Company United States North America Food, Drink & Tobacco 10,907 1,004 7.2%
66 Associated British Foods plc United Kingdom Europe Food, Drink & Tobacco 10,775 554 6.7%
67 Kao Corporation Japan Asia/Pacific Personal & Household Products 10,544 616 26.8%
68 BSH Bosch und Siemens Hausgerate GmbH Germany Europe Home Furnishings & Equipment 10,437 467 13.2%
69 Dean Foods Company United States North America Food, Drink & Tobacco 10,099 225 -0.7%
70 Swift & Company United States North America Food, Drink & Tobacco 10,000 e na 7.0%
71 Ajinomoto Co., Inc. Japan Asia/Pacific Food, Drink & Tobacco 9,917 287 4.7%
72 Groupe Lactalis France Europe Food, Drink & Tobacco 9,422 na 21.0%
73 Vion NV Netherlands Europe Food, Drink & Tobacco 9,222 87 18.0%
74 Reckitt Benckiser plc United Kingdom Europe Personal & Household Products 9,071 1,242 17.8%
75 H.J. Heinz Company United States North America Food, Drink & Tobacco 9,002 786 4.1%
e=estimate

| 5
Global powers of the consumer products industry
DT rank (FY06)
Company name Country Region Product sectorFY06 net
sales (US$mil)FY06 net
profits (US$mil)FY06 sales
growth
76 Fortune Brands, Inc. United States North America Food, Drink & Tobacco 8,769 830 24.2%
77 Avon Products, Inc. United States North America Personal & Household Products 8,677 480 7.6%
78 Reynolds American, Inc. United States North America Food, Drink & Tobacco 8,510 1,210 3.1%
79 Pernod Ricard France Europe Food, Drink & Tobacco 8,413 1,118 6.2%
80 Nippon Meat Packers Japan Asia/Pacific Food, Drink & Tobacco 8,366 97 1.4%
81 Nintendo Co., Ltd. Japan Asia/Pacific Leisure Goods 8,274 1,492 89.8%
82 Dr August Oetker KG Germany Europe Food, Drink & Tobacco 8,081 e na -8.5%
83 Orkla ASA Norway Europe Food, Drink & Tobacco 8,051 1,764 12.0%
84 Uni-President Enterprises Corporation Taiwan Asia/Pacific Food, Drink & Tobacco 7,923 111 6.3%
85 Mohawk Industries, Inc. United States North America Home Improvement Products 7,906 456 19.4%
86 Sherwin-Williams Company United States North America Home Improvement Products 7,810 576 8.6%
87 Arla Foods amba Denmark Europe Food, Drink & Tobacco 7,663 158 -1.9%
88 S.C. Johnson & Son, Inc. United States North America Personal & Household Products 7,500 e na 7.1%
89 Campbell Soup Company United States North America Food, Drink & Tobacco 7,343 766 3.8%
90 Land O'Lakes, Inc. United States North America Food, Drink & Tobacco 7,275 89 -3.7%
91 Coca-Cola Greece Europe Food, Drink & Tobacco 7,055 429 17.5%
92 Nikon Corporation Japan Asia/Pacific Electronic Products 7,043 469 12.6%
93 The Estee Lauder Companies Inc. United States North America Personal & Household Products 7,038 456 8.9%
94 BenQ Corporation Taiwan Asia/Pacific Electronic Products 6,988 -833 28.5%
95 Carlsberg A/S Denmark Europe Food, Drink & Tobacco 6,920 366 8.0%
96 Pioneer Corporation Japan Asia/Pacific Electronic Products 6,783 -58 6.2%
97 CJ Corporation Korea (South) Asia/Pacific Food, Drink & Tobacco 6,637 170 16.4%
98 The Black & Decker Corporation United States North America Home Improvement Products 6,447 486 -1.2%
99 Yamazaki Baking Co., Ltd. Japan Asia/Pacific Food, Drink & Tobacco 6,443 40 1.6%
100 Beiersdorf AG Germany Europe Personal & Household Products 6,432 839 7.2%
101 Alticor Inc. United States North America Personal & Household Products 6,300 e na -1.6%
102 Newell Rubbermaid Inc. United States North America Personal & Household Products 6,201 385 8.5%
103 Compagnie Financiere Richemont SA Switzerland Europe Fashion Goods 6,192 e 1,705 e 12.0%
104 Dole Food Company, Inc. United States North America Food, Drink & Tobacco 6,171 -89 5.9%
105 V.F. Corporation United States North America Fashion Goods 6,138 534 10.0%
106 Ferrero S.p.A. Italy Europe Food, Drink & Tobacco 6,136 e 641 e 5.0%
107 Scottish & Newcastle plc United Kingdom Europe Food, Drink & Tobacco 6,133 558 2.1%
108 Pirelli & C. SpA Italy Europe Tires 6,081 -1,318 6.5%
109 Meiji Dairies Corporation Japan Asia/Pacific Food, Drink & Tobacco 6,016 118 -3.1%
110 Shiseido Company, Limited Japan Asia/Pacific Personal & Household Products 5,946 245 3.5%
111 TCL Corporation China Asia/Pacific Electronic Products 5,884 -467 -9.3%
112 Royal Friesland Foods NV Netherlands Europe Food, Drink & Tobacco 5,873 204 5.8%
113 Grupo Bimbo C.A. de C.V. Mexico Latin America Food, Drink & Tobacco 5,845 333 8.5%
114 Molson Coors Brewing Company United States North America Food, Drink & Tobacco 5,845 377 6.1%
115 Hormel Foods Corporation United States North America Food, Drink & Tobacco 5,745 286 6.1%
116 Mattel, Inc. United States North America Leisure Goods 5,650 593 9.1%
117 Steinhoff International Holdings Limited South AfricaAfrica/ Middle East
Home Furnishings & Equipment 5,344 e na 18.9%
118 Casio Computer Co., Ltd. Japan Asia/Pacific Electronic Products 5,314 226 7.0%
119 Pilgrim's Pride Corp. United States North America Food, Drink & Tobacco 5,236 -34 -7.6%
120 Constellation Brands, Inc. United States North America Food, Drink & Tobacco 5,216 332 13.3%
121 Maple Leaf Foods Inc. Canada North America Food, Drink & Tobacco 5,200 9 -3.8%
e=estimate

6 |
Consumer Business
DT rank (FY06)
Company name Country Region Product sectorFY06 net
sales (US$mil)FY06 net
profits (US$mil)FY06 sales
growth
122 Lexmark International, Inc. United States North America Electronic Products 5,108 338 -2.2%
123 Kohler Co. United States North America Home Improvement Products 5,000 e na 19.0%
124 Liz Claiborne, Inc. United States North America Fashion Goods 4,994 255 3.0%
125 Bacardi & Company, Limited Bermuda Latin America Food, Drink & Tobacco 4,967 e 730 e 9.0%
126 Morinaga Milk Industry Co.,Ltd. Japan Asia/Pacific Food, Drink & Tobacco 4,950 47 4.7%
127 The Hershey Company United States North America Food, Drink & Tobacco 4,944 559 2.6%
128 Arcelik Anonim Sirketi TurkeyAfrica/Middle
EastHome Furnishings & Equipment 4,885 251 11.4%
129 San Miguel Corporation Philippines Asia/Pacific Food, Drink & Tobacco 4,883 199 10.1%
130 Parmalat Group Italy Europe Food, Drink & Tobacco 4,875 245 5.4%
131 The Clorox Company United States North America Personal & Household Products 4,847 501 4.4%
132 Yamaha Corporation Japan Asia/Pacific Leisure Goods 4,711 243 3.0%
133 Wm. Wrigley Jr. Company United States North America Food, Drink & Tobacco 4,686 529 12.7%
134 Jones Apparel Group, Inc. United States North America Fashion Goods 4,670 -144 -6.9%
135 Sumitomo Rubber Industries Ltd. Japan Asia/Pacific Tires 4,593 244 4.1%
136 Skandinavisk Tobakskompagni A/S Denmark Europe Food, Drink & Tobacco 4,587 e 396 e 4.6%
137 Grupo Modelo, S.A. de C.V. Mexico Latin America Food, Drink & Tobacco 4,574 1,039 9.0%
138 Campina Melkunie UA Netherlands Europe Food, Drink & Tobacco 4,552 e 58 e 1.5%
139 Chiquita Brands International, Inc. United States North America Food, Drink & Tobacco 4,499 -96 15.2%
140 Hanesbrands Inc. United States North America Fashion Goods 4,403 e 208 e -1.6%
141 Itoham Foods Inc. Japan Asia/Pacific Food, Drink & Tobacco 4,317 -12 -2.5%
142 Sony Bmg Music Entertainment United States North America Electronic Products 4,314 e na -13.7%
143 Polo Ralph Lauren Corporation United States North America Fashion Goods 4,295 401 14.6%
144 The Yokohama Rubber Company Limited Japan Asia/Pacific Tires 4,258 140 10.1%
145 Bongrain SA France Europe Food, Drink & Tobacco 4,193 149 -0.3%
146 The Stanley Works United States North America Home Improvement Products 4,109 290 3.6%
147 Levi Strauss & Co. United States North America Fashion Goods 4,107 239 -1.1%
148 Hallmark Cards, Inc. United States North America Leisure Goods 4,100 e na -2.4%
149 Husqvarna AB Sweden Europe Home Improvement Products 3,995 258 2.2%
150 Gateway, Inc. United States North America Electronic Products 3,981 10 3.3%
151 PepsiAmericas, Inc. United States North America Food, Drink & Tobacco 3,972 158 6.6%
152 Namco Bandai Holdings Inc. Japan Asia/Pacific Leisure Goods 3,930 208 1.8%
153 Q.P. Corporation Japan Asia/Pacific Food, Drink & Tobacco 3,918 62 0.2%
154 Nichirei Corporation Japan Asia/Pacific Food, Drink & Tobacco 3,918 94 -2.5%
155 Mccain Foods Limited Canada North America Food, Drink & Tobacco 3,911 na -22.1%
156 Groupe Terrena France Europe Food, Drink & Tobacco 3,894 e na -1.2%
157 The Swatch Group Ltd. Switzerland Europe Fashion Goods 3,849 663 12.3%
158 Jarden Corporation United States North America Personal & Household Products 3,846 106 20.6%
159 Fenaco Switzerland Europe Food, Drink & Tobacco 3,789 e 41 e 8.4%
160 Alberto-Culver Company United States North America Personal & Household Products 3,772 205 6.8%
161 TCL Multimedia Technology Holdings Ltd. Hong Kong Asia/Pacific Electronic Products 3,758 -322 -10.2%
162 Sapporo Holdings Limited Japan Asia/Pacific Food, Drink & Tobacco 3,742 20 -4.1%
163 Foster's Group Limited Australia Asia/Pacific Food, Drink & Tobacco 3,741 762 5.0%
164 Vestel Elektronik Sanayi ve Ticaret A.S. TurkeyAfrica/Middle
EastElectronic Products 3,672 e 11 e 18.7%
165 Nisshin Seifun Group Inc. Japan Asia/Pacific Food, Drink & Tobacco 3,580 e 126 e -0.8%
166 Miele & Cie. KG Germany Europe Home Furnishings & Equipment 3,578 e na 7.9%
167 Harman International Industries Inc./DE/ United States North America Electronic Products 3,551 312 9.3%
e=estimate
| 7
Global powers of the consumer products industry
DT rank (FY06)
Company name Country Region Product sectorFY06 net
sales (US$mil)FY06 net
profits (US$mil)FY06 sales
growth
168 The Schwan Food Company United States North America Food, Drink & Tobacco 3,500 e na 3.7%
169B & C Tönnies Holding GmbH und Company KG
Germany Europe Food, Drink & Tobacco 3,459 na 5.9%
170 Austria Tabak GmbH & Co KG Austria Europe Food, Drink & Tobacco 3,435 na -40.1%
171 Red Bull GmbH Austria Europe Food, Drink & Tobacco 3,430 na 28.4%
172 Armstrong World Industries United States North America Home Improvement Products 3,426 1,358 3.0%
173 EMI Group plc United Kingdom Europe Electronic Products 3,423 -543 -13.1%
174 Del Monte Foods Company United States North America Food, Drink & Tobacco 3,415 113 13.9%
175 Perdue Farms Incorporated United States North America Food, Drink & Tobacco 3,400 e na 0.0%
176 Funai Electric Co., Ltd. Japan Asia/Pacific Electronic Products 3,396 -31 9.9%
177 Essilor International France Europe Personal & Household Products 3,379 416 11.0%
178 Meiji Seika Kaisha, Ltd. Japan Asia/Pacific Food, Drink & Tobacco 3,371 51 3.0%
179 Hankook Tire Co., Ltd. Korea (South) Asia/Pacific Tires 3,363 177 9.1%
180 Kikkoman Corporation Japan Asia/Pacific Food, Drink & Tobacco 3,361 107 9.1%
181 Montres Rolex SA Switzerland Europe Fashion Goods 3,350 e na 21.8%
182 RPM International Inc. United States North America Home Improvement Products 3,339 208 11.0%
183 Coca-Cola Amatil Limited Australia Asia/Pacific Food, Drink & Tobacco 3,331 213 6.5%
184 SEB SA France Europe Home Furnishings & Equipment 3,331 110 7.7%
185 Groupe ONA MoroccoAfrica/Middle
EastFood, Drink & Tobacco 3,326 150 9.7%
186 Royal Numico N.V. Netherlands Europe Food, Drink & Tobacco 3,321 255 31.7%
187Charoen Pokphand Foods Public Company Limited
Thailand Asia/Pacific Food, Drink & Tobacco 3,304 67 10.2%
188 SanDisk Corporation United States North America Electronic Products 3,258 201 41.3%
189 Inventec Appliances Corp. Taiwan Asia/Pacific Electronic Products 3,235 e 63 e -12.4%
190 Coty, Inc. United States North America Personal & Household Products 3,200 na 10.3%
191 Barilla G e R Fratelli SpA Italy Europe Food, Drink & Tobacco 3,182 e na -2.9%
192 La Coop Federee Canada North America Food, Drink & Tobacco 3,176 -10 1.1%
193 Hasbro, Inc. United States North America Leisure Goods 3,151 230 2.1%
194 Electronic Arts Inc. United States North America Leisure Goods 3,091 72 4.7%
195 Energizer Holdings, Inc. United States North America Personal & Household Products 3,077 261 2.9%
196 Ebro Puleva S.A. Spain Europe Food, Drink & Tobacco 3,076 226 3.8%
197 Nissin Food Products Co., Ltd. Japan Asia/Pacific Food, Drink & Tobacco 3,067 163 11.4%
198 Carolina Group United States North America Food, Drink & Tobacco 3,056 760 5.7%
199 Research In Motion Limited Canada North America Electronic Products 3,037 632 47.0%
200 Gree Electric Appliances, Inc. of Zhuhai China Asia/Pacific Home Furnishings & Equipment 2,989 79 30.3%
201 KT&G Corporation Korea (South) Asia/Pacific Food, Drink & Tobacco 2,985 685 6.5%
202 Katokichi Co., Ltd. Japan Asia/Pacific Food, Drink & Tobacco 2,979 e -79 e 2.4%
203 D Swarovski & Co Austria Europe Fashion Goods 2,977 e na 12.9%
204 Puma AG Rudolf Dassler Sport Germany Europe Fashion Goods 2,976 334 33.3%
205 Ashley Furniture Industries, Inc. United States North America Home Furnishings & Equipment 2,964 e na 16.2%
206 E. & J. Gallo Winery United States North America Food, Drink & Tobacco 2,927 e na 8.4%
207 Interstate Bakeries Corp. United States North America Food, Drink & Tobacco 2,917 -113 -4.7%
208 Pactiv Corporation United States North America Personal & Household Products 2,917 274 5.8%
209 Cremonini S.p.A. Italy Europe Food, Drink & Tobacco 2,903 33 10.5%
210 JELD-WEN, Inc. United States North America Home Improvement Products 2,900 e na 11.5%
211 PT Gudang Garam Tbk Indonesia Asia/Pacific Food, Drink & Tobacco 2,897 111 6.0%
212 Citizen Watch Co., Ltd. Japan Asia/Pacific Fashion Goods 2,878 62 0.1%
e=estimate

8 |
Consumer Business
DT rank (FY06)
Company name Country Region Product sectorFY06 net
sales (US$mil)FY06 net
profits (US$mil)FY06 sales
growth
213 World Co Ltd. Japan Asia/Pacific Fashion Goods 2,854 44 15.0%
214 Lion Corporation Japan Asia/Pacific Personal & Household Products 2,841 50 -0.4%
215 Coca-Cola West Holdings Company, Limited Japan Asia/Pacific Food, Drink & Tobacco 2,819 65 33.3%
216 Gruma S.A. de C.V. Mexico Latin America Food, Drink & Tobacco 2,816 147 10.0%
217 Techtronic Industries Co. Ltd. Hong Kong Asia/Pacific Home Improvement Products 2,809 139 -2.4%
218 Brown-Forman Corporation United States North America Food, Drink & Tobacco 2,806 390 14.8%
219 Videocon Industries Limited India Asia/Pacific Electronic Products 2,785 171 87.8%
220 Toyo Suisan Kaisha, Ltd. Japan Asia/Pacific Food, Drink & Tobacco 2,751 61 -1.3%
221 Toyo Tire & Rubber Co., Ltd. Japan Asia/Pacific Tires 2,743 52 6.7%
222 ITC Limited India Asia/Pacific Food, Drink & Tobacco 2,741 598 26.3%
223 Onward Kashiyama Co., Ltd. Japan Asia/Pacific Fashion Goods 2,728 106 12.6%
224 McCormick & Company, Inc. United States North America Food, Drink & Tobacco 2,716 205 4.8%
225 The Scotts Miracle-Gro Company United States North America Home Improvement Products 2,697 133 13.8%
226 Cooper Tire & Rubber Company United States North America Tires 2,676 -79 24.2%
227 Ito En, Ltd. Japan Asia/Pacific Food, Drink & Tobacco 2,652 105 7.7%
228 Hunter Douglas N.V. Netherlands Europe Home Furnishings & Equipment 2,629 328 9.0%
229 Dairy Crest Group plc United Kingdom Europe Food, Drink & Tobacco 2,608 93 12.0%
230 Irish Dairy Board Co-operative Ltd. Ireland Europe Food, Drink & Tobacco 2,606 410 5.0%
231 Thai Beverage Public Company Limited Thailand Asia/Pacific Food, Drink & Tobacco 2,586 266 3.0%
232 Unicharm Corporation Japan Asia/Pacific Personal & Household Products 2,584 147 11.7%
233 Yves Rocher SA France Europe Personal & Household Products 2,572 88 2.5%
234 Glen Dimplex Group Ireland Europe Home Furnishings & Equipment 2,566 na 33.3%
235 Spectrum Brands, Inc. United States North America Personal & Household Products 2,552 -434 10.6%
236 Tiger Brands Limited South AfricaAfrica/Middle
EastFood, Drink & Tobacco 2,532 356 12.8%
237 GuangDong Midea Electric Appliances Co., China Asia/Pacific Home Furnishings & Equipment 2,529 96 -5.5%
238 Valentino Fashion Group Italy Europe Fashion Goods 2,466 197 13.6%
239 Qingdao Haier Co., Ltd. China Asia/Pacific Home Furnishings & Equipment 2,464 45 18.9%
240Triumph International Vertriebsgesellschaft AG
Switzerland Europe Fashion Goods 2,455 na 0.8%
241 Nordmilch eG Germany Europe Food, Drink & Tobacco 2,438 e na -4.4%
242 Furniture Brands International, Inc. United States North America Home Furnishings & Equipment 2,418 55 1.3%
243 PT Indofood Sukses Makmur Tbk. Indonesia Asia/Pacific Food, Drink & Tobacco 2,414 83 16.9%
244 Prima Meat Packers, Ltd. Japan Asia/Pacific Food, Drink & Tobacco 2,405 25 -0.2%
245 Perdigão S.A. Brazil Latin America Food, Drink & Tobacco 2,400 57 1.3%
246 Rich Products Corporation United States North America Food, Drink & Tobacco 2,400 e na -4.0%
247 Makita Corporation Japan Asia/Pacific Home Improvement Products 2,396 316 22.2%
248 Snow Brand Milk Products Co., Ltd. Japan Asia/Pacific Food, Drink & Tobacco 2,374 69 -1.0%
249 Quiksilver, Inc. United States North America Fashion Goods 2,362 93 32.6%
250 Sichuan Changhong Electronic Co. Ltd China Asia/Pacific Electronic Products 2,355 38 24.5%
e=estimate
| 9
Global powers of the consumer products industry
Top 250 consumer products companies alphabetical listingAcer Incorporated 64adidas AG 54Ajinomoto Co., Inc. 71Alberto-Culver Company 160Altadis, S.A. 41Alticor Inc. 101Altria Group, Inc. 1Anheuser-Busch Companies, Inc. 40Apple Inc. 30Arcelik Anonim Sirketi 128Arla Foods amba 87Armstrong World Industries 172Asahi Breweries, Ltd. 56Ashley Furniture Industries, Inc. 205Associated British Foods plc 66Austria Tabak GmbH & Co KG 170Avon Products, Inc. 77B & C Tönnies Holding GmbH und Company KG 169
Bacardi & Company, Limited 125Barilla G e R Fratelli SpA 191Beiersdorf AG 100BenQ Corporation 94Black & Decker Corporation 98Bongrain SA 145Bridgestone Corporation 19British American Tobacco plc 34Brown-Forman Corporation 218BSH Bosch und Siemens Hausgerate GmbH 68
Cadbury Schweppes plc 50Campbell Soup Company 89Campina Melkunie UA 138Canon Inc. 15Carlsberg A/S 95Carolina Group 198Casio Computer Co., Ltd. 118Charoen Pokphand Foods Public Company Limited 187
Chiquita Brands International, Inc. 139Christian Dior SA 27Citizen Watch Co., Ltd. 212CJ Corporation 97Clorox Company 131Coca-Cola Amatil Limited 183Coca-Cola Company 21Coca-Cola Enterprises Inc 29Coca-Cola Hellenic Bottling Company SA 91
Coca-Cola West Holdings Company, Limited 215
Colgate-Palmolive Company 58Compagnie Financiere Richemont SA 103
ConAgra Foods, Inc. 60Constellation Brands, Inc. 120Cooper Tire & Rubber Company 226Coty, Inc. 190Cremonini S.p.A. 209D Swarovski & Co 203Dairy Crest Group plc 229Dean Foods Company 69Del Monte Foods Company 174Dell Inc. 9Diageo plc 45Dole Food Company, Inc 104Dr August Oetker KG 82E. & J. Gallo Winery 206
Eastman Kodak Company 51Ebro Puleva S.A. 196Electrolux AB 47Electronic Arts Inc. 194EMI Group plc 173Energizer Holdings, Inc. 195Essilor International 177Estee Lauder Companies Inc. 93Fenaco 159Ferrero S.p.A. 106Fomento Economico Mexicano S.A.B de C.V. 62
Fortune Brands, Inc. 76Foster’s Group Limited 163Fujifilm Holdings Corporation 22Funai Electric Co., Ltd. 176Furniture Brands International, Inc. 242Gallaher Group Plc 42Gateway, Inc. 150General Mills, Inc. 55Glen Dimplex Group 234Goodyear Tire & Rubber Company 26Gree Electric Appliances, Inc. of Zhuhai 200
Groupe Danone 35Groupe Lactalis 72Groupe ONA 185Groupe Terrena 156Gruma S.A. de C.V. 216Grupo Bimbo C.A. de C.V. 113Grupo Modelo, S.A. de C.V. 137GuangDong Midea Electric Appliances Co. 237
H.J. Heinz Company 75Hallmark Cards, Inc. 148Hanesbrands Inc 140Hankook Tire Co., Ltd. 179Harman International Industries Inc./DE/ 167
Hasbro, Inc. 193Heineken N.V 43Henkel KGaA 39Hershey Company 127Hewlett-Packard Company 2Hormel Foods Corporation 115Hunter Douglas N.V. 228Husqvarna AB 149Imperial Tobacco Group PLC 23InBev NV 37Interstate Bakeries Corp. 207Inventec Appliances Corp. 189Irish Dairy Board Co-operative Ltd. 230ITC Limited 222Ito En, Ltd. 227Itoham Foods Inc. 141Japan Tobacco Inc 14Jarden Corporation 158JELD-WEN, Inc. 210Jones Apparel Group, Inc. 134Kao Corporation 67Katokichi Co., Ltd. 202Kellogg Company 65Kikkoman Corporation 180Kimberly-Clark Corporation 36Kirin Brewery Company, Limited 46Kohler Co. 123Koninklijke Philips Electronics N.V. 17KT&G Corporation 201
La Coop Federee 192Land O’Lakes, Inc. 90Lenovo Group Limited 44Levi Strauss & Co. 147Lexmark International, Inc. 122LG Electronics Inc. 12Lion Corporation 214Liz Claiborne, Inc. 124L’Oreal SA 28Makita Corporation 247Maple Leaf Foods Inc. 121Mars, Incorporated 24Masco Corporation 52Matsushita Electric Industrial Co., Ltd 5
Mattel, Inc. 116Mccain Foods Limited 155McCormick & Company, Inc. 224Meiji Dairies Corporation 109Meiji Seika Kaisha, Ltd. 178Michelin Group 25Miele & Cie. KG 166Mohawk Industries, Inc. 85Molson Coors Brewing Company 114Montres Rolex SA 181Morinaga Milk Industry Co.,Ltd. 126Motorola, Inc. 13Namco Bandai Holdings Inc. 152Nestle SA 4Newell Rubbermaid Inc. 102Nichirei Corporation 154NIKE, Inc. 38Nikon Corporation 92Nintendo Co., Ltd 81Nippon Meat Packers 80Nisshin Seifun Group Inc. 165Nissin Food Products Co., Ltd. 197Nokia Corporation 10Nordmilch eG 241Onward Kashiyama Co., Ltd. 223Orkla ASA 83Pactiv Corporation 208Parmalat Group 130Pepsi Bottling Group, Inc. 53PepsiAmericas, Inc. 151PepsiCo, Inc. 16Perdigão S.A. 245Perdue Farms Incorporated 175Pernod Ricard 79Pilgrim’s Pride Corp. 119Pioneer Corporation 96Pirelli & C. SpA 108Polo Ralph Lauren Corporation 143Prima Meat Packers, Ltd. 244Procter & Gamble Company 6PT Gudang Garam Tbk 211PT Indofood Sukses Makmur Tbk. 243Puma AG Rudolf Dassler Sport 204Q.P. Corporation 153Qingdao Haier Co., Ltd. 239Quiksilver, Inc. 249Reckitt Benckiser plc 74Red Bull GmbH 171Research In Motion Limited 199Reynolds American, Inc. 78Rich Products Corporation 246Royal Friesland Foods NV 112
Royal Numico N.V. 186RPM International Inc. 182S.C. Johnson & Son, Inc. 88SABMiller plc 32Samsung Electronics Co., Ltd. 3San Miguel Corporation 129SanDisk Corporation 188Sanyo Electric Co., Ltd. 31Sapporo Holdings Limited 162Sara Lee Corp. 57Schwan Food Company 168Scottish & Newcastle plc 107Scotts Miracle-Gro Company 225SEB SA 184Seiko Epson Corporation 59Sharp Corporation 18Sherwin-Williams Company 86Shiseido Company, Limited 110Sichuan Changhong Electronic Co. Ltd 250
Skandinavisk Tobakskompagni A/S 136Smithfield Foods, Inc. 61Snow Brand Milk Products Co., Ltd. 248Sony Bmg Music Entertainment 142Sony Corporation 7Sony Ericsson Mobile Communications AB 49
Spectrum Brands, Inc. 235Stanley Works 146Steinhoff International Holdings Limited 117
Sumitomo Rubber Industries Ltd. 135Svenska Cellulosa AB SCA 48Swatch Group Ltd. 157Swift & Company 70Tchibo Holding AG 63TCL Corporation 111TCL Multimedia Technology Holdings Ltd. 161
Techtronic Industries Co. Ltd. 217Thai Beverage Public Company Limited 231
Tiger Brands Limited 236Toshiba Corporation 8Toyo Suisan Kaisha, Ltd. 220Toyo Tire & Rubber Co., Ltd. 221Triumph International Vertriebsgesellschaft AG 240
Tyson Foods, Inc. 20Unicharm Corporation 232Unilever Group 11Uni-President Enterprises Corporation 84
V.F. Corporation 105Valentino Fashion Group 238Vestel Elektronik Sanayi ve Ticaret A.S. 164
Videocon Industries Limited 219Vion NV 73Whirlpool Corporation 33Wm. Wrigley Jr. Company 133World Co Ltd 213Yamaha Corporation 132Yamazaki Baking Co., Ltd. 99Yokohama Rubber Company Limited 144
Yves Rocher SA 233

10 |
Consumer Business
Despite the positive economic environment, the consumer products industry faces enormous challenges. Private label competition, rising commodity prices, product integrity issues, diminishing returns on new product development, and declining productivity of traditional marketing programs are just some of the issues putting pressure on the industry. Nevertheless, strong consumer spending resulted in healthy growth for the industry’s Top 250 companies in fiscal 2006, the financial period covered in this report.
Total sales for the Top 250 consumer products companies exceeded $2.67 trillion in 2006. The average year-over-year growth rate for the group was a robust 8.5%.
However, not every company enjoyed strong growth. Forty-one companies, or 16% of the Top 250, experienced declining sales in fiscal 2006, a rather alarming statistic.
Top-line gains translated into solid profitability for most compa-nies in 2006. Despite the challenges noted above, the average net profit margin for the 221 companies that disclosed their net income/loss figures was 6.0%. Of these companies, 24 (or 11%) recorded a net loss in fiscal 2006. Profitability was down slightly from the prior year when the average net profit margin was 6.1% and only half as many companies were unprofitable.
Consistent with that finding, return on assets averaged 5.9% in 2006, a modest decline from 6.0% a year earlier. Consumer products companies were fairly highly leveraged in 2006, with an average financial leverage ratio of 4.0 times (total assets / stockholders equity). This resulted in average return on equity of 18.3%.
To join the ranks of the Top 250 required fiscal 2006 sales of at least $2.36 billion. The average size for the group was $10.7 billion.
A look at the leader boardThe ten largest companies reported combined sales of $751 billion in fiscal 2006, or 28.1% of total Top 250 net sales. This group grew sales 8.6%, on average, slightly ahead of the 8.5% pace for the Top 250.
These consumer products powerhouses have relied on a variety of growth strategies to achieve their current stature. Market-leading brands favored by the big retailers, innovative products that offer unique consumer benefits, strategic acquisitions and partnerships, and entry into high-opportunity geographies have helped to keep these companies on top. At the same time, ongoing restructuring and streamlining measures have helped maintain their ability to react quickly to market trends while cutting costs.
Altria Group (formerly Philip Morris Companies) was the world’s largest consumer products company in 2006. However, this has already changed as the tobacco giant spun off its Kraft Foods division in March 2007. Kraft, when listed as a separate company, will very likely place among the Top 20. Altria also plans to spin off its fast-growing Philip Morris International arm to separate it from the declining US tobacco business, at which point the company will drop well out of the Top 10.
DT rank (FY 06) Company name Country Product sector Net sales
(US$mil)Y-o-Y sales
growthNet profit
margin ROA Financial leverage ROE
1 Altria United States Food, Drink & Tobacco 101,407 3.6% 12.0% 11.7% 2.4 28.2%
2 Hewlett-Packard United States Electronic Products 91,658 5.7% 6.8% 7.6% 2.1 16.2%
3 Samsung Electronics Korea (South) Electronic Products 90,551 5.9% 9.6% 10.1% 1.7 17.1%
4 Nestle Switzerland Food, Drink & Tobacco 78,625 8.1% 10.0% 9.7% 1.9 18.6%
5 Matsushita Japan Electronic Products 77,966 2.4% 2.7% 3.1% 1.8 5.6%
6 Procter & Gamble United States Personal & Household Products 76,476 12.1% 13.5% 7.5% 2.1 15.5%
7 Sony Japan Electronic Products 64,777 13.1% 1.7% 1.1% 3.4 3.7%
8 Toshiba Japan Electronic Products 60,916 12.2% 2.2% 2.6% 4.1 10.7%
9 Dell United States Electronic Products 57,420 2.9% 4.5% 10.1% 5.9 59.7%
10 Nokia Finland Electronic Products 51,657 20.3% 10.6% 19.3% 1.9 36.2%
TOP 10 751,453 8.6% 7.4% 8.3% 2.7 21.2%
TOP 250 2,674,602 8.5% 6.0% 5.9% 4.0 18.3%
Economic Concentration of Top 10 28.1%
Global top 10 consumer products companies, 2006
| 11
Global powers of the consumer products industry
Altria is one of only two Food, Drink & Tobacco companies on the Top 10 leader board. Nestlé occupies the #4 spot. The world’s largest food company recently became even larger with the acquisition of Gerber Products in September 2007. In 2006, Nestlé’s relatively strong growth vs. fifth-place holder — consumer electronics maker Matsushita — moved Nestlé up one place from where it would have been positioned in 2005.
Seven of the Top 10 companies are electronics manufacturers. This is not surprising, especially given that these companies’ sales figures include products and services for businesses as well as consumers. With its 2002 acquisition of Compaq, HP (#2) now leads the pack, closely followed by South Korea’s Samsung Electronics. Japan is home to three of the world’s top consumer electronics companies: Matsushita (#5), Sony (#7), and Toshiba (#8). Dell hung onto 9th place despite disappointing sales and earnings in 2006. Nokia, the world’s top cell phone maker, came on strong to finish in the #10 spot.
P&G, the world’s largest supplier of personal & household products, ranks 6th among the leader group. A series of acquisitions, including Gillette in 2005, has been followed by aggressive brand rationalization with a focus on billion-dollar brands. As a result, P&G has nearly doubled in size in the past five years.
The Top 10’s average net profit margin of 7.4% compares favorably with 6.0% for the group as a whole. This translated into higher return on assets and higher return on equity vs. the Top 250. However, with the exception of Toshiba and Dell, the leader group was less highly leveraged.
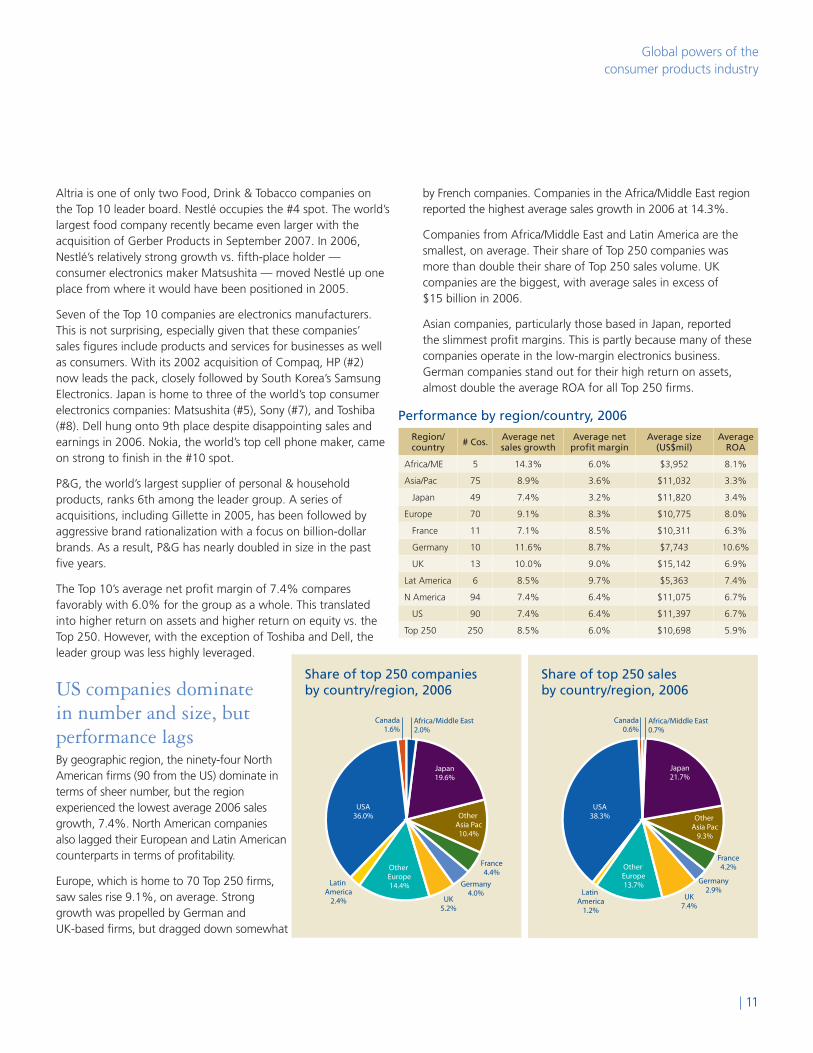
US companies dominate in number and size, but performance lagsBy geographic region, the ninety-four North American firms (90 from the US) dominate in terms of sheer number, but the region experienced the lowest average 2006 sales growth, 7.4%. North American companies also lagged their European and Latin American counterparts in terms of profitability.
Europe, which is home to 70 Top 250 firms, saw sales rise 9.1%, on average. Strong growth was propelled by German and UK-based firms, but dragged down somewhat
by French companies. Companies in the Africa/Middle East region reported the highest average sales growth in 2006 at 14.3%.
Companies from Africa/Middle East and Latin America are the smallest, on average. Their share of Top 250 companies was more than double their share of Top 250 sales volume. UK companies are the biggest, with average sales in excess of $15 billion in 2006.
Asian companies, particularly those based in Japan, reported the slimmest profit margins. This is partly because many of these companies operate in the low-margin electronics business. German companies stand out for their high return on assets, almost double the average ROA for all Top 250 firms.
USA36.0%
Germany4.0%
France4.4%
Japan19.6%
Canada1.6%
Other Asia Pac10.4%
Africa/Middle East2.0%
Other Europe14.4%
UK5.2%
Latin America
2.4%
Performance by region/country, 2006
Region/ country # Cos. Average net
sales growthAverage net
profit marginAverage size
(US$mil)Average
ROA
Africa/ME 5 14.3% 6.0% $3,952 8.1%
Asia/Pac 75 8.9% 3.6% $11,032 3.3%
Japan 49 7.4% 3.2% $11,820 3.4%
Europe 70 9.1% 8.3% $10,775 8.0%
France 11 7.1% 8.5% $10,311 6.3%
Germany 10 11.6% 8.7% $7,743 10.6%
UK 13 10.0% 9.0% $15,142 6.9%
Lat America 6 8.5% 9.7% $5,363 7.4%
N America 94 7.4% 6.4% $11,075 6.7%
US 90 7.4% 6.4% $11,397 6.7%
Top 250 250 8.5% 6.0% $10,698 5.9%
Share of top 250 companies by country/region, 2006
USA38.3%
Germany2.9%
France4.2%
Japan21.7%
Canada0.6%
Other Asia Pac
9.3%
Africa/Middle East0.7%
Other Europe13.7%
UK7.4%
Latin America
1.2%
Share of top 250 sales by country/region, 2006

12 |
Consumer Business
Top consumer products companies by regionThe Top 10 companies in North America, Europe and Asia/Pacific are all positioned among the top 34 consumer products companies globally. The highest-ranked consumer products firm elsewhere in the world is Mexico’s #62 ranked FEMSA (Fomento Económico Mexicano), the largest beverage company in Latin America.
Top 10 North American consumer products companies, 2006
Company name North Am rank Top 250 rank Sector Country FY06 net sales (US$mil)
Altria 1 1 Food, Drink & Tobacco United States 101,407
Hewlett-Packard 2 2 Electronic Products United States 91,658
Procter & Gamble 3 6 Personal & Household Products United States 76,476
Dell 4 9 Electronic Products United States 57,420
Motorola 5 13 Electronic Products United States 42,879
PepsiCo 6 16 Food, Drink & Tobacco United States 35,137
Tyson 7 20 Food, Drink & Tobacco United States 25,559
Coca-Cola 8 21 Food, Drink & Tobacco United States 24,088
Mars 9 24 Food, Drink & Tobacco United States 21,000 e
Goodyear 10 26 Tires United States 20,258
The Top10 North American companies are all US-based. The smallest of this group ranks 26th overall among the Top 250. Eight of these companies are from the Food, Drink & Tobacco and Electronic Products sectors. None are from the Home, Fashion or Leisure sectors.
Top 10 European consumer products companies, 2006
Company name Europe rank Top 250 Rank Sector Country FY06 net sales (US$mil)
Nestle 1 4 Food, Drink & Tobacco Switzerland 78,625
Nokia 2 10 Electronic Products Finland 51,657
Unilever 3 11 Personal & Household Products United Kingdom 49,799
Philips 4 17 Electronic Products Netherlands 33,888
Imperial Tobacco 5 23 Food, Drink & Tobacco United Kingdom 21,028
Michelin 6 25 Tires France 20,582
Christian Dior 7 27 Fashion Goods France 20,120
L'Oreal SA 8 28 Personal & Household Products France 19,836
SABMiller plc 9 32 Food, Drink & Tobacco United Kingdom 18,620
BAT 10 34 Food, Drink & Tobacco United Kingdom 17,991
The Top 10 European consumer products companies are fairly dispersed geographically, but dominated by British and French companies. The largest company in this region is Switzerland’s Nestlé (#4 overall). Luxury goods provider Christian Dior is the only Fashion Goods company in the Top 10 in any of the regional groups.
Top 10 Asia/Pacific consumer products companies, 2006
Company name Asia/Pac rank Top 250 rank Sector Country FY06 net sales (US$mil)
Samsung 1 3 Electronic Products Korea (South) 90,551
Matsushita 2 5 Electronic Products Japan 77,966
Sony 3 7 Electronic Products Japan 64,777
Toshiba 4 8 Electronic Products Japan 60,916
LG Electronics 5 12 Electronic Products Korea (South) 49,120
Japan Tobacco 6 14 Food, Drink & Tobacco Japan 40,826
Canon 7 15 Electronic Products Japan 35,748
Sharp 8 18 Electronic Products Japan 26,774
Bridgestone 9 19 Tires Japan 25,725
Fujifilm 10 22 Electronic Products Japan 23,818
Eight of the Top 10 Asia/Pacific companies are based in Japan, while two are headquartered in South Korea. All but two of these companies — Japan Tobacco and Bridgestone — are electronics manufacturers.
| 13
Global powers of the consumer products industry
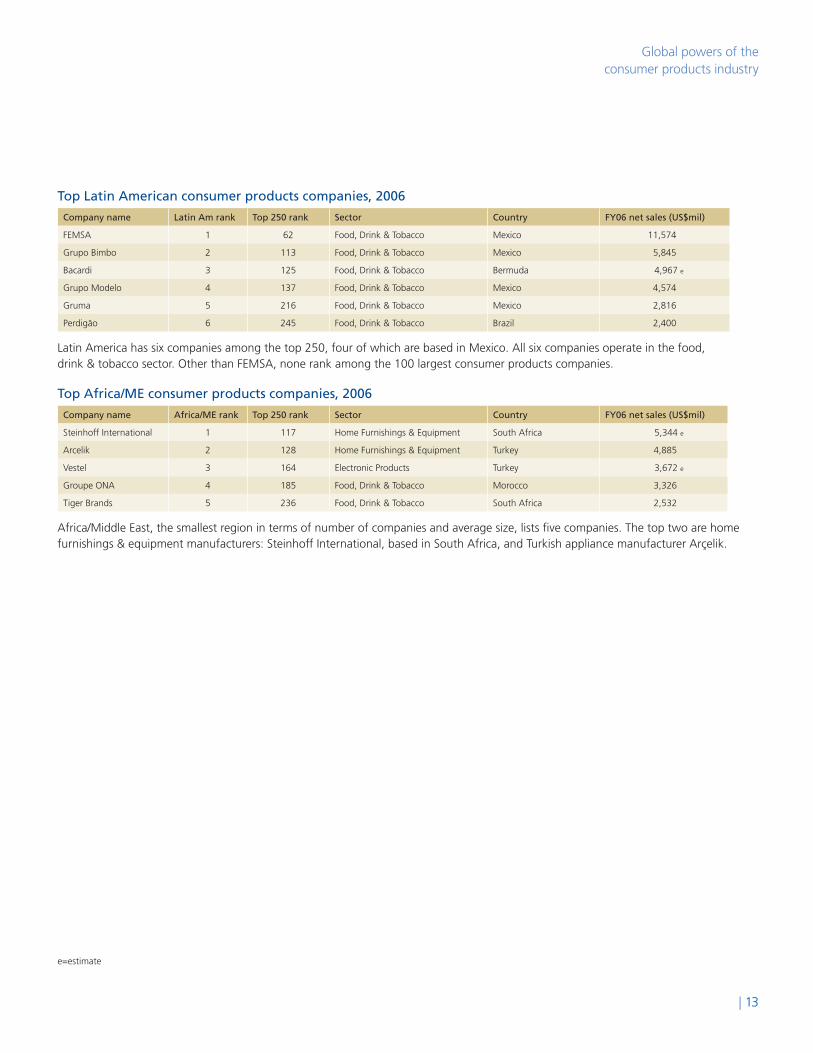
Top Latin American consumer products companies, 2006
Company name Latin Am rank Top 250 rank Sector Country FY06 net sales (US$mil)
FEMSA 1 62 Food, Drink & Tobacco Mexico 11,574
Grupo Bimbo 2 113 Food, Drink & Tobacco Mexico 5,845
Bacardi 3 125 Food, Drink & Tobacco Bermuda 4,967 e
Grupo Modelo 4 137 Food, Drink & Tobacco Mexico 4,574
Gruma 5 216 Food, Drink & Tobacco Mexico 2,816
Perdigão 6 245 Food, Drink & Tobacco Brazil 2,400
Latin America has six companies among the top 250, four of which are based in Mexico. All six companies operate in the food, drink & tobacco sector. Other than FEMSA, none rank among the 100 largest consumer products companies.
Top Africa/ME consumer products companies, 2006
Company name Africa/ME rank Top 250 rank Sector Country FY06 net sales (US$mil)
Steinhoff International 1 117 Home Furnishings & Equipment South Africa 5,344 e
Arcelik 2 128 Home Furnishings & Equipment Turkey 4,885
Vestel 3 164 Electronic Products Turkey 3,672 e
Groupe ONA 4 185 Food, Drink & Tobacco Morocco 3,326
Tiger Brands 5 236 Food, Drink & Tobacco South Africa 2,532
Africa/Middle East, the smallest region in terms of number of companies and average size, lists five companies. The top two are home furnishings & equipment manufacturers: Steinhoff International, based in South Africa, and Turkish appliance manufacturer Arçelik.
e=estimate

Consumer Business
14 |
Food, drink & tobacco is dominant product sector For analytical purposes, the Top 250 companies have been organized into eight major product sectors:
• Electronicproducts
• Fashiongoods
• Food,drink&tobacco
• Homefurnishings&equipment
• Homeimprovement
• Leisuregoods
• Personal&householdproducts
• Tires
Food, drink & tobacco companies are, by far, the largest product group — home to almost half of all Top 250 companies. Food processors comprise the largest subgroup in this sector with 85, followed by 24 beverage makers, and 13 tobacco companies. This huge sector reported sales growth of 5.8%, on average, in 2006, the slowest of all the product sectors.
Companies selling electronic products tend to be far larger, on average, than companies in any of the other product groups, with an average size of $23.5 billion. This is due, in large part, to the fact that these companies’ total sales figures include significant enterprise, as well as consumer, sales. This sector, represented by 37 companies, posted strong growth, but profit margins in this intensely competitive industry sector were slim. Only the tire group, with a negative average net profit margin, had worse profitability.
Among the eight product groups, the leisure goods sector enjoyed the strongest growth in 2006, followed by fashion goods. However, the Leisure group’s result was heavily skewed by Nintendo’s rapid sales growth. Both also posted above-average profitability. The personal & household products sector, with 27 companies, grew on a par with the Top 250 overall. Companies in this group tend to be above-average in size.
The two homegoods sectors also posted solid gains, but average profit margins were significantly higher for the home improvement group compared with the Home furnishings & equipment companies.
Performance by product sector, 2006
# Cos. Average net sales growth
Average net profit margin
Average size (US$mil)
Average ROA
Electronic Products 37 12.3% 3.3% $23,499 2.8%
Fashion Goods 20 12.8% 7.8% $5,640 7.5%
Food, Drink & Tobacco 122 5.8% 6.7% $9,000 6.3%
Home Furnishings & Equipt. 15 12.3% 3.6% $6,486 4.7%
Home Improvement Products 13 8.7% 9.7% $5,047 9.9%
Leisure Goods 7 15.5% 8.1% $4,701 7.1%
Personal & Hshld. Products 27 8.2% 7.1% $11,414 7.8%
Tires 9 8.9% -0.5% $10,031 0.6%
Top 250 250 8.5% 6.0% $10,698 5.9%
Home Improvement
Products2.5%
Home Furnishings & Equipment
3.6%
Fashion Goods4.2%
ElectronicProducts
32.5%
Tires3.4%
Food, Drink & Tobacco
41.1%
Leisure Goods1.2%
Personal &Household
Products11.5%
Share of top 250 sales by product sector, 2006
Home Improvement
Products5.2%
Home Furnishings & Equipment
6.0%
Fashion Goods8.0%
ElectronicProducts
14.8%
Tires3.6%
Food, Drink & Tobacco
48.8%
Leisure Goods2.8%
Personal &Household
Products10.8%
Share of top 250 companies by product sector, 2006

| 15
Global powers of the consumer products industry
Top 10 electronic products companies, 2006
Company name Product sector rank Top 250 rank Country Region FY06 net sales (US$mil)
Hewlett-Packard 1 2 United States North Am 91,658
Samsung 2 3 Korea (South) Asia/Pac 90,551
Matsushita 3 5 Japan Asia/Pac 77,966
Sony 4 7 Japan Asia/Pac 64,777
Toshiba 5 8 Japan Asia/Pac 60,916
Dell 6 9 United States North Am 57,420
Nokia 7 10 Finland Europe 51,657
LG Electronics 8 12 Korea (South) Asia/Pac 49,120
Motorola 9 13 United States North Am 42,879
Canon 10 15 Japan Asia/Pac 35,748
As most of the top 10 largest companies are consumer electronics manufacturers, the top 10 electronic products companies look very much like the overall top 10 list. HP, the highest ranking company in this group, is in a tight race with Samsung. In addition to the electronics companies represented in the overall Top 10, are LG Electronics, Motorola and Canon. All of the top 10 electronics companies are among the top 15 largest consumer products companies worldwide.
Top 10 food, drink & tobacco companies, 2006
Company name Product sector rank Top 250 rank Country Region FY06 net sales (US$mil)
Altria 1 1 United States North Am 101,407
Nestle 2 4 Switzerland Europe 78,625
Japan Tobacco 3 14 Japan Asia/Pac 40,826
PepsiCo 4 16 United States North Am 35,137
Tyson 5 20 United States North Am 25,559
Coca-Cola 6 21 United States North Am 24,008
Imperial Tobacco 7 23 United Kingdom Europe 21,028
Mars 8 24 United States North Am 21,000 e
Coca-Cola Enterprises 9 29 United States North Am 19,804
SABMiller 10 32 United Kingdom Europe 18,620
The top 10 companies in the food, drink & tobacco group rank from first place to 32nd place among the top 250. Six are from the US. Four of the top 10 are drinks manufacturers, three are food companies, and three make tobacco products.
Top 10 personal & household products companies, 2006
Company name Product sector rank Top 250 rank Country Region FY06 net sales (US$mil)
Procter & Gamble 1 6 United States North Am 76,476
Unilever 2 11 United Kingdom Europe 49,799
L'Oreal 3 28 France Europe 19,836
Kimberly-Clark 4 36 United States North Am 16,747
Henkel 5 39 Germany Europe 16,004
SCA 6 48 Sweden Europe 13,782
Colgate-Palmolive 7 58 United States North Am 12,238
Kao 8 67 Japan Asia/Pac 10,544
Reckitt Benckiser 9 74 United Kingdom Europe 9,071
Avon 10 77 United States North Am 8,677
P&G leads the personal & household products group by a significant margin, followed by Unilever. Nine of the top 10 are based in Europe or North America. e=estimate
16 |
Consumer Business
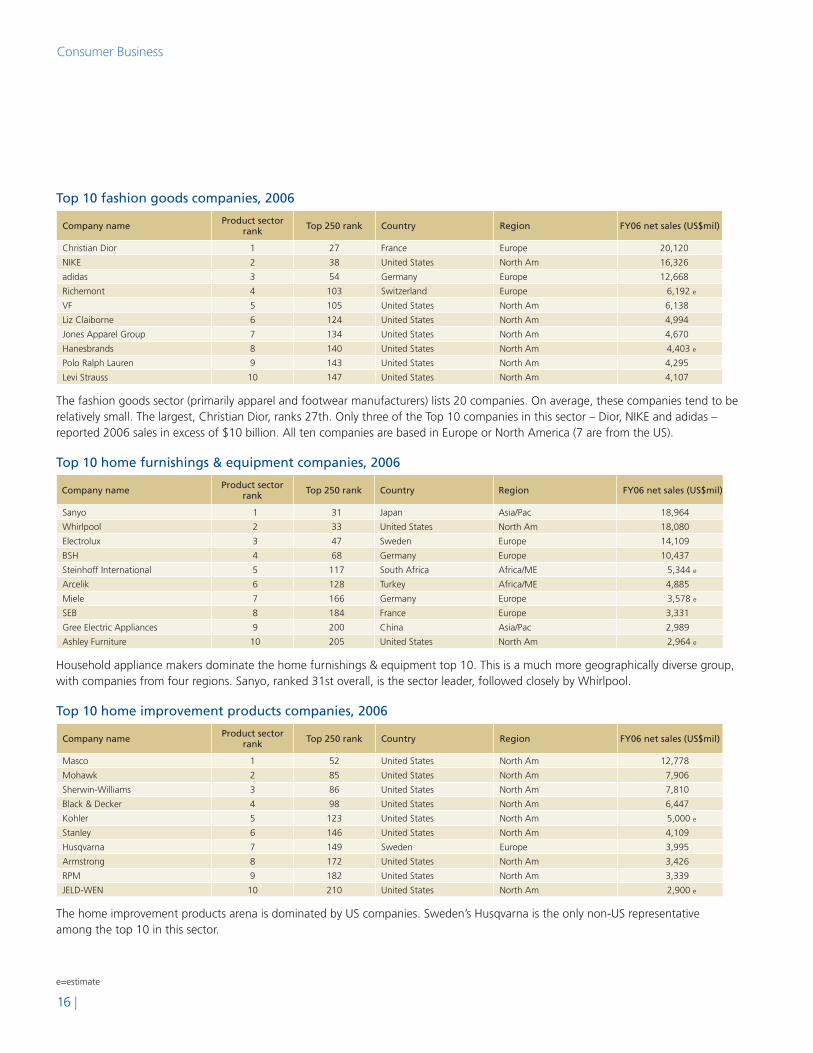
Top 10 fashion goods companies, 2006
Company name Product sector rank Top 250 rank Country Region FY06 net sales (US$mil)
Christian Dior 1 27 France Europe 20,120
NIKE 2 38 United States North Am 16,326
adidas 3 54 Germany Europe 12,668
Richemont 4 103 Switzerland Europe 6,192 e
VF 5 105 United States North Am 6,138
Liz Claiborne 6 124 United States North Am 4,994
Jones Apparel Group 7 134 United States North Am 4,670
Hanesbrands 8 140 United States North Am 4,403 e
Polo Ralph Lauren 9 143 United States North Am 4,295
Levi Strauss 10 147 United States North Am 4,107
The fashion goods sector (primarily apparel and footwear manufacturers) lists 20 companies. On average, these companies tend to be relatively small. The largest, Christian Dior, ranks 27th. Only three of the Top 10 companies in this sector – Dior, NIKE and adidas – reported 2006 sales in excess of $10 billion. All ten companies are based in Europe or North America (7 are from the US).
Top 10 home furnishings & equipment companies, 2006
Company name Product sector rank Top 250 rank Country Region FY06 net sales (US$mil)
Sanyo 1 31 Japan Asia/Pac 18,964
Whirlpool 2 33 United States North Am 18,080
Electrolux 3 47 Sweden Europe 14,109
BSH 4 68 Germany Europe 10,437
Steinhoff International 5 117 South Africa Africa/ME 5,344 e
Arcelik 6 128 Turkey Africa/ME 4,885
Miele 7 166 Germany Europe 3,578 e
SEB 8 184 France Europe 3,331
Gree Electric Appliances 9 200 China Asia/Pac 2,989
Ashley Furniture 10 205 United States North Am 2,964 e
Household appliance makers dominate the home furnishings & equipment top 10. This is a much more geographically diverse group, with companies from four regions. Sanyo, ranked 31st overall, is the sector leader, followed closely by Whirlpool.
Top 10 home improvement products companies, 2006
Company name Product sector rank Top 250 rank Country Region FY06 net sales (US$mil)
Masco 1 52 United States North Am 12,778
Mohawk 2 85 United States North Am 7,906
Sherwin-Williams 3 86 United States North Am 7,810
Black & Decker 4 98 United States North Am 6,447
Kohler 5 123 United States North Am 5,000 e
Stanley 6 146 United States North Am 4,109
Husqvarna 7 149 Sweden Europe 3,995
Armstrong 8 172 United States North Am 3,426
RPM 9 182 United States North Am 3,339
JELD-WEN 10 210 United States North Am 2,900 e
The home improvement products arena is dominated by US companies. Sweden’s Husqvarna is the only non-US representative among the top 10 in this sector.
e=estimate

| 17
Global powers of the consumer products industry
Top leisure goods companies, 2006
Company name Product sector rank Top 250 rank Country Region FY06 net sales (US$mil)
Nintendo 1 81 Japan Asia/Pacific 8,274
Mattel 2 116 United States North Am 5,650
Yamaha 3 132 Japan Asia/Pacific 4,711
Hallmark 4 148 United States North Am 4,100 e
Namco Bandai 5 152 Japan Asia/Pac 3,930
Hasbro 6 193 United States North Am 3,151
Electronic Arts 7 194 United States North Am 3,091
The leisure goods and tires sectors have the fewest firms on the top 250 list, with 7 and 9, respectively. Nintendo is the largest company in the Leisure sector, ranking 81st overall, followed by toy maker Mattel. All of the companies in this small group are based either in Japan (electronic toys & games) or the US.
Top tire companies, 2006
Company name Product sector rank Top 250 rank Country Region FY06 net sales (US$mil)
Bridgestone 1 19 Japan Asia/Pac 25,725
Michelin 2 25 France Europe 20,582
Goodyear 3 26 United States North Am 20,258
Pirelli 4 108 Italy Europe 6,081
Sumitomo Rubber 5 135 Japan Asia/Pac 4,593
Yokohama Rubber 6 144 Japan Asia/Pac 4,258
Hankook Tire 7 179 Korea (South) Asia/Pac 3,363
Toyo Tire & Rubber 8 221 Japan Asia/Pac 2,743
Cooper Tire & Rubber 9 226 United States North Am 2,676
Japan’s Bridgestone leads the pack in the tire category and ranks 19th overall. Michelin and Goodyear are running neck-and-neck in second and third place respectively, with $20+ billion in sales — far ahead of the next biggest competitor, Italy’s Pirelli. Asian companies account for more than half of the tire makers on the top 250 list.
e=estimate

18 |
Consumer Business
Fastest 50 target emerging marketsIn 2006, the 50 fastest-growing consumer products companies grew sales 25%, on average, three times the Top 250’s 8.5% rate. Looking only at the top 10 fastest-growing companies, sales surged 45.2%. Growth for the Top 10 largest companies, by comparison, was 8.6%.
Number one-ranked Nintendo made great progress expanding gaming to the masses in 2006, reversing a long decline in the hand-held video game industry. The company has seen strong performance of both Nintendo DS and Wii.
Acquisitions boosted sales for many of the Fastest 50, including the 2nd fastest-growing company, adidas (acquired Reebok in 2006), Glen Dimplex, Royal Numico, and Whirlpool (acquired Maytag in 2006), among others.
A focus on innovative new products also resulted in strong growth for companies like Research In Motion (Blackberry wireless devices), SanDisk (flash memory products), Apple (iPod, iTunes, iTV, iPhone), and Red Bull (energy drinks).
Geographically, companies based in emerging markets grew rapidly, as would be expected. Both of the India-based manufacturers on the Top 250 list are among the Fastest 50, as are three of the five Chinese companies and two of the four Taiwanese firms. In addition, nearly one-third of the UK firms made the list of fast-growing companies.
From a product perspective, the two home-related sectors are the most over-represented. Fashion Good companies also have a disproportionate share of the Fastest 50. These findings point to a growing middle class around the world with more disposable income to spend on homegoods and apparel.
50 fastest growing consumer products companies 2005-2006Growth
rankSales rank Company name Country Major product sector 2006 net sales
(US$mil)YOY % sales
growth1 81 Nintendo Co., Ltd Japan Leisure Goods 8,274 89.80%
2 54 adidas AG Germany Fashion Goods 12,668 51.96%
3 49 Sony Ericsson Mobile Communications AB United Kingdom Electronic Products 13,767 50.78%
4 199 Research In Motion Limited Canada Electronic Products 3,037 47.00%
5 188 SanDisk Corporation United States Electronic Products 3,258 41.26%
6 30 Apple Inc. United States Electronic Products 19,315 38.65%
7 234 Glen Dimplex Ireland Home Furnishings & Equipment 2,566 33.33%
8 215 Coca-Cola West Holdings Company, Limited Japan Food, Drink & Tobacco 2,819 33.33%
9 204 Puma AG Rudolf Dassler Sport Germany Fashion Goods 2,976 33.29%
10 249 Quiksilver, Inc. United States Fashion Goods 2,362 32.65%
11 186 Royal Numico N.V. Netherlands Food, Drink & Tobacco 3,321 31.67%
12 200 Gree Electric Appliances, Inc. of Zhuhai China Home Furnishings & Equipment 2,989 30.32%
13 94 BenQ Corporation Taiwan Electronic Products 6,988 28.54%
14 171 Red Bull GmbH Austria Food, Drink & Tobacco 3,430 28.39%
15 67 Kao Corporation Japan Personal & Household Products 10,544 26.83%
16 222 ITC Limited India Food, Drink & Tobacco 2,741 26.34%
17 33 Whirlpool Corporation United States Home Furnishings & Equipment 18,080 26.28%
18 250 Sichuan Changhong Electronic Co. Ltd. China Electronic Products 2,355 24.54%
19 76 Fortune Brands, Inc. United States Food, Drink & Tobacco 8,769 24.19%
20 226 Cooper Tire & Rubber Company United States Tires 2,676 24.18%
21 247 Makita Corporation Japan Home Improvement Products 2,396 22.20%
22 181 Montres Rolex SA Switzerland Fashion Goods 3,350 21.82%
23 32 SABMiller plc United Kingdom Food, Drink & Tobacco 18,620 21.64%
24 13 Motorola, Inc. United States Electronic Products 42,879 21.60%
25 72 Groupe Lactalis France Food, Drink & Tobacco 9,422 20.97%
26 158 Jarden Corporation United States Personal & Household Products 3,846 20.61%
27 10 Nokia Corporation Finland Electronic Products 51,657 20.27%
28 85 Mohawk Industries, Inc. United States Home Improvement Products 7,906 19.42%
29 123 Kohler Co. United States Home Improvement Products 5,000 19.05%
30 117 Steinhoff International Holdings Limited South Africa Home Furnishings & Equipment 5,344 18.93%
| 19
Global powers of the consumer products industry
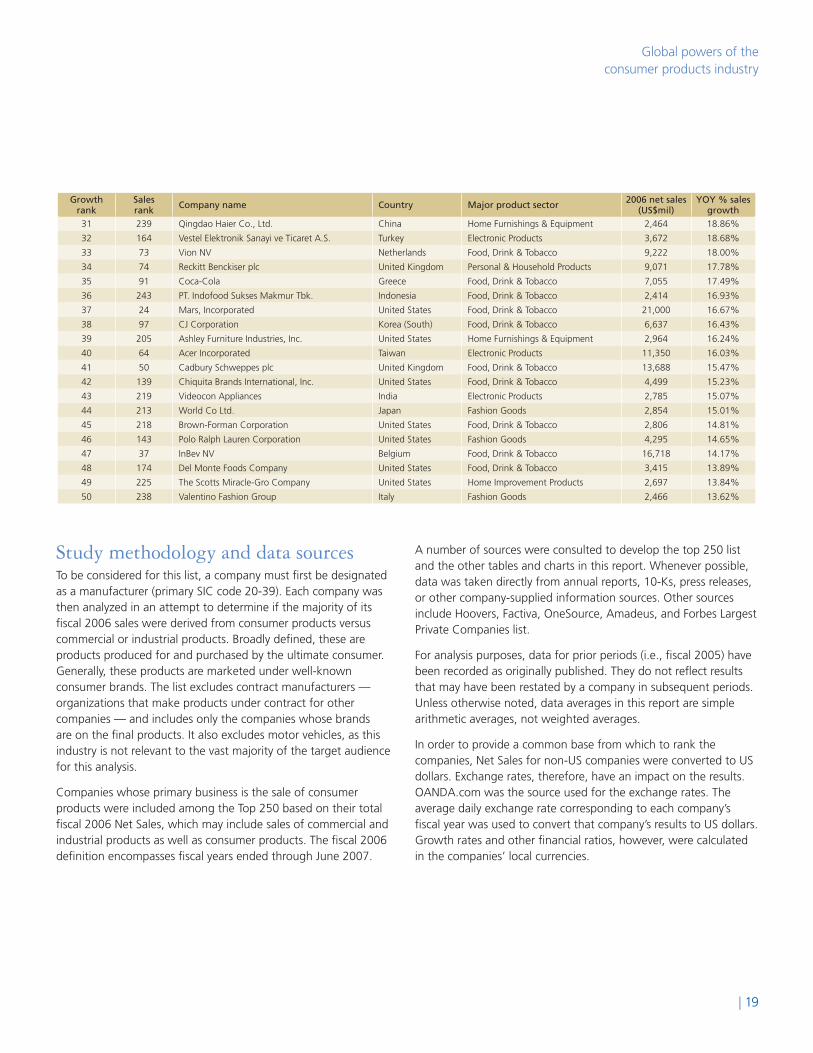
Study methodology and data sourcesTo be considered for this list, a company must first be designated as a manufacturer (primary SIC code 20-39). Each company was then analyzed in an attempt to determine if the majority of its fiscal 2006 sales were derived from consumer products versus commercial or industrial products. Broadly defined, these are products produced for and purchased by the ultimate consumer. Generally, these products are marketed under well-known consumer brands. The list excludes contract manufacturers — organizations that make products under contract for other companies — and includes only the companies whose brands are on the final products. It also excludes motor vehicles, as this industry is not relevant to the vast majority of the target audience for this analysis.
Companies whose primary business is the sale of consumer products were included among the Top 250 based on their total fiscal 2006 Net Sales, which may include sales of commercial and industrial products as well as consumer products. The fiscal 2006 definition encompasses fiscal years ended through June 2007.
A number of sources were consulted to develop the top 250 list and the other tables and charts in this report. Whenever possible, data was taken directly from annual reports, 10-Ks, press releases, or other company-supplied information sources. Other sources include Hoovers, Factiva, OneSource, Amadeus, and Forbes Largest Private Companies list.
For analysis purposes, data for prior periods (i.e., fiscal 2005) have been recorded as originally published. They do not reflect results that may have been restated by a company in subsequent periods. Unless otherwise noted, data averages in this report are simple arithmetic averages, not weighted averages.
In order to provide a common base from which to rank the companies, Net Sales for non-US companies were converted to US dollars. Exchange rates, therefore, have an impact on the results. OANDA.com was the source used for the exchange rates. The average daily exchange rate corresponding to each company’s fiscal year was used to convert that company’s results to US dollars. Growth rates and other financial ratios, however, were calculated in the companies’ local currencies.
Growth rank
Sales rank Company name Country Major product sector 2006 net sales
(US$mil)YOY % sales
growth31 239 Qingdao Haier Co., Ltd. China Home Furnishings & Equipment 2,464 18.86%
32 164 Vestel Elektronik Sanayi ve Ticaret A.S. Turkey Electronic Products 3,672 18.68%
33 73 Vion NV Netherlands Food, Drink & Tobacco 9,222 18.00%
34 74 Reckitt Benckiser plc United Kingdom Personal & Household Products 9,071 17.78%
35 91 Coca-Cola Greece Food, Drink & Tobacco 7,055 17.49%
36 243 PT. Indofood Sukses Makmur Tbk. Indonesia Food, Drink & Tobacco 2,414 16.93%
37 24 Mars, Incorporated United States Food, Drink & Tobacco 21,000 16.67%
38 97 CJ Corporation Korea (South) Food, Drink & Tobacco 6,637 16.43%
39 205 Ashley Furniture Industries, Inc. United States Home Furnishings & Equipment 2,964 16.24%
40 64 Acer Incorporated Taiwan Electronic Products 11,350 16.03%
41 50 Cadbury Schweppes plc United Kingdom Food, Drink & Tobacco 13,688 15.47%
42 139 Chiquita Brands International, Inc. United States Food, Drink & Tobacco 4,499 15.23%
43 219 Videocon Appliances India Electronic Products 2,785 15.07%
44 213 World Co Ltd. Japan Fashion Goods 2,854 15.01%
45 218 Brown-Forman Corporation United States Food, Drink & Tobacco 2,806 14.81%
46 143 Polo Ralph Lauren Corporation United States Fashion Goods 4,295 14.65%
47 37 InBev NV Belgium Food, Drink & Tobacco 16,718 14.17%
48 174 Del Monte Foods Company United States Food, Drink & Tobacco 3,415 13.89%
49 225 The Scotts Miracle-Gro Company United States Home Improvement Products 2,697 13.84%
50 238 Valentino Fashion Group Italy Fashion Goods 2,466 13.62%
20 |
Consumer Business
The value of intangibles: understanding Q ratioIn today’s business environment, producers of consumer goods fight a constant battle against commoditization. Due to advances in manufacturing technology and the ubiquity of discount retailers with low-priced private label goods, consumers have come to expect high quality and low prices. As a result, they are not necessarily convinced that a brand is differentiated from its competitors simply on the basis of good quality. The problem with commoditization is that it leads to margin-killing price competition. The only way to avoid this is to create a compelling brand, clearly differentiated products, and a better consumer experience. This entails innovation in design and technology, clever marketing, closeness to the consumer, and excellence in brand management. This is a tall order, but companies that can do this achieve pricing power, higher margins, better returns to shareholders, and higher market capitalization.
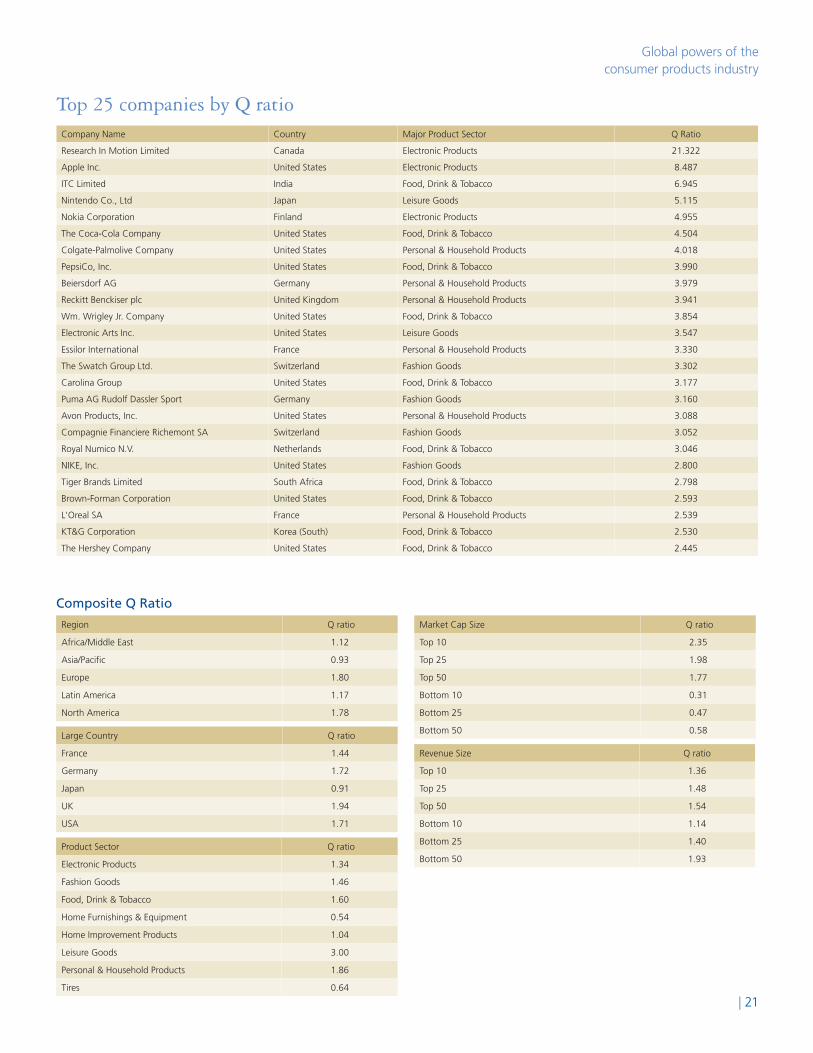
It would be useful to observe the gains to shareholder value that emanate from such non-tangible assets as strong branding, innovation, differentiation, first mover advantage, and market leadership. These strengths are critical in an environment characterized by price pressure, private label competition, and commoditization. The value of such attributes is not reflected in a company’s statement of assets. Instead, the value is captured in the market value assigned by financial markets. As such, the ratio of market capitalization to assets, dubbed the Q ratio by the Nobel-prize winning economist James Tobin, is a good indicator of the ability of a company to generate shareholder value from such intangibles as brand, innovation, and so on.
Deloitte has chosen to measure the Q ratio for the world’s leading consumer product companies. We have done this for the 190 publicly traded companies on our list of the top 250 consumer product companies. To calculate the Q ratio, we took market capitalization (share price times number of shares) as of October 8, 2007 divided by reported assets for fiscal year 2006.
Our analysis of the world’s leading consumer product companies yields some interesting insights. The composite Q ratio for all 190 companies is 1.51. In other words, on average, the world’s leading consumer product companies generate about a third of their financial market value from non-tangible assets such as brand.
Of the 190 companies, 99 had Q ratios greater than one while 91 companies had Q ratios less than one. If the Q ratio is less than one, this implies that there is an arbitrage opportunity. In theory, the company could be acquired and the assets could be sold off for a profit.
There are differences between the Q ratios of companies in different countries and in different sectors:
• Onaverage,companiesbasedinNorthAmericaandEuropehave higher Q ratios than companies in other regions. Companies based in the UK, Germany, and the US have high Q ratios while companies based in Japan have, on average, relatively low ratios. Naturally, there are significant individual exceptions to these averages.
• CompaniesintheleisuresectorhavethehighestaverageQratios. This is not surprising as these companies depend on the strength of their brands. In addition, companies in the personal and household product sector and the food, drink, and tobacco sector have relatively high Q ratios. On the other hand, average Q ratios for home furnishing, home improvement, and tire companies are low.
• Interestingly,companieswithhighmarketcapitalizationshave,on average, high Q ratios. Those with low market values have low average Q ratios. On the other hand, companies that are large in terms of revenue do not, on average, have Q ratios significantly different than companies with low revenues.
• ThetwocompaniesonthelistwiththehighestQratios (Research in Motion and Apple) are those with very high-profile, innovative technologies that have been successfully branded and are clearly differentiated from competitors.
The importance of the Q ratio should not be overstated. Differences between companies can arise over whether assets are owned or leased, or over whether processes are performed in house or are outsourced. Still, the ratio can provide some indication of the degree to which companies have successfully branded, differentiated, innovated, and done other things necessary to maintain pricing power and avoid commoditization.
| 21
Global powers of the consumer products industry
Company Name Country Major Product Sector Q Ratio
Research In Motion Limited Canada Electronic Products 21.322
Apple Inc. United States Electronic Products 8.487
ITC Limited India Food, Drink & Tobacco 6.945
Nintendo Co., Ltd Japan Leisure Goods 5.115
Nokia Corporation Finland Electronic Products 4.955
The Coca-Cola Company United States Food, Drink & Tobacco 4.504
Colgate-Palmolive Company United States Personal & Household Products 4.018
PepsiCo, Inc. United States Food, Drink & Tobacco 3.990
Beiersdorf AG Germany Personal & Household Products 3.979
Reckitt Benckiser plc United Kingdom Personal & Household Products 3.941
Wm. Wrigley Jr. Company United States Food, Drink & Tobacco 3.854
Electronic Arts Inc. United States Leisure Goods 3.547
Essilor International France Personal & Household Products 3.330
The Swatch Group Ltd. Switzerland Fashion Goods 3.302
Carolina Group United States Food, Drink & Tobacco 3.177
Puma AG Rudolf Dassler Sport Germany Fashion Goods 3.160
Avon Products, Inc. United States Personal & Household Products 3.088
Compagnie Financiere Richemont SA Switzerland Fashion Goods 3.052
Royal Numico N.V. Netherlands Food, Drink & Tobacco 3.046
NIKE, Inc. United States Fashion Goods 2.800
Tiger Brands Limited South Africa Food, Drink & Tobacco 2.798
Brown-Forman Corporation United States Food, Drink & Tobacco 2.593
L'Oreal SA France Personal & Household Products 2.539
KT&G Corporation Korea (South) Food, Drink & Tobacco 2.530
The Hershey Company United States Food, Drink & Tobacco 2.445
Top 25 companies by Q ratio
Composite Q Ratio
Region Q ratio
Africa/Middle East 1.12
Asia/Pacific 0.93
Europe 1.80
Latin America 1.17
North America 1.78
Large Country Q ratio
France 1.44
Germany 1.72
Japan 0.91
UK 1.94
USA 1.71
Product Sector Q ratio
Electronic Products 1.34
Fashion Goods 1.46
Food, Drink & Tobacco 1.60
Home Furnishings & Equipment 0.54
Home Improvement Products 1.04
Leisure Goods 3.00
Personal & Household Products 1.86
Tires 0.64
Market Cap Size Q ratio
Top 10 2.35
Top 25 1.98
Top 50 1.77
Bottom 10 0.31
Bottom 25 0.47
Bottom 50 0.58
Revenue Size Q ratio
Top 10 1.36
Top 25 1.48
Top 50 1.54
Bottom 10 1.14
Bottom 25 1.40
Bottom 50 1.93

Top 5 Q ratio by region/countryAsia/Pacific
Company Q ratio
ITC Limited 6.95
Nintendo Co., Ltd 5.12
KT&G Corporation 2.53
Makita Corporation 2.03
Nikon Corporation 1.98
Europe
Company Q ratio
Nokia Corporation 4.95
Beiersdorf AG 3.98
Reckitt Benckiser plc 3.94
Essilor International 3.33
The Swatch Group Ltd. 3.03
Latin America
Company Q ratio
Grupo Modelo, S.A. de C.V. 1.97
Perdigao S.A. 1.74
Fomento Economico Mexicano S.A.B de C.V. 1.03
Molson Coors Brewing Company 0.79
Gruma S.A. de C.V. 0.6
France
Company Q ratio
Essilor International 3.33
L'Oreal SA 2.54
Groupe Danone 1.89
SEB SA 1.13
Michelin Group 0.93
Germany
Company Q ratio
Beiersdorf AG 3.98
Puma AG Rudolf Dassler Sport 3.16
Henkel KGaA 1.26
adidas AG 1.2
Coca-Cola 1.78
Japan
Company Q ratio
Nintendo Co., Ltd 5.12
Makita Corporation 2.03
Nikon Corporation 1.98
Japan Tobacco Inc 1.87
Canon Inc. 1.84
UK
Company Q ratio
Reckitt Benckiser plc 3.94
Imperial Tobacco Group PLC 2.37
Diageo plc 2.2
British American Tobacco plc 2.12
Unilever Group 2.05
USA
Company Q ratio
Apple Inc. 8.49
The Coca-Cola Company 4.5
Colgate-Palmolive Company 4.02
PepsiCo, Inc. 3.99
Wm. Wrigley Jr. Company 3.85
Top 5 Q ratio by product sectorElectronic products
Company Q ratio
Research In Motion Limited 21.32
Apple Inc. 8.49
Nokia Corporation 4.95
Harman International Industries Inc./DE/ 2.26
Nikon Corporation 1.98
Fashion goods
Company Q ratio
The Swatch Group Ltd. 3.3
Puma AG Rudolf Dassler Sport 3.16
Compagnie Financiere Richemont SA 3.05
NIKE, Inc. 2.8
Polo Ralph Lauren Corporation 2.08
Food, drink & tobacco
Company Q ratio
ITC Limited 6.95
The Coca-Cola Company 4.5
PepsiCo, Inc. 3.99
Wm. Wrigley Jr. Company 3.85
Carolina Group 3.18
Home furnishings & equipment
Company Q ratio
Hunter Douglas N.V. 1.36
SEB SA 1.13
Arcelik Anonim Sirketi 0.75
Electrolux AB 0.72
Whirlpool Corporation 0.53
Home improvement products
Company Q ratio
Husqvarna AB 2.37
Makita Corporation 2.03
Sherwin-Williams Company 1.74
The Scotts Miracle-Gro Company 1.26
The Stanley Works 1.19
Leisure goods
Company Q ratio
Nintendo Co., Ltd 5.12
Electronic Arts Inc. 3.55
Hasbro, Inc. 1.49
Namco Bandai Holdings Inc. 1.1
Yamaha Corporation 0.97
Personal & household products
Company Q ratio
Colgate-Palmolive Company 4.02
Beiersdorf AG 3.98
Reckitt Benckiser plc 3.94
Essilor International 3.33
Avon Products, Inc. 3.09
Tires
Company Q ratio
Hankook Tire Co., Ltd. 0.98
Michelin Group 0.93
Cooper Tire & Rubber Company 0.68
Sumitomo Rubber Industries Ltd. 0.63
The Yokohama Rubber Company Limited 0.55
Consumer Business
| 23
Global powers of the consumer products industry
Trends in the consumer products industry 1. Inflation and deflation put the squeeze on suppliersIn the past twenty years, the world has witnessed a new era of unusually low inflation. This came about mainly for two reasons. First, countries adopted sensible monetary policies aimed at keeping inflation low and economic growth stable. Second, the entry into the global economy of nearly one billion workers from formerly closed economies (Russia, Central Europe, China, and India) put downward pressure on global wages and enabled vast improvements in economic efficiency.
This new era of low inflation made consumers more price sensitive, suppliers more cost sensitive, and it made retailers more focused on offering a better value proposition. The real winner in this was the consumer. Yet for suppliers, low product price inflation created new headaches. On the other hand, expanded economic growth in emerging countries has stimulated higher commodity prices. The combination of upward pressure on input prices and downward pressure on product prices has squeezed the profit margins of suppliers. In the future, successful suppliers will be those that can navigate this minefield by keeping costs low and brand equity high.
2. Health and obesity concernsIn discussions with executives of processed food suppliers, one issue that keeps coming up is obesity. This public health issue has reached crisis proportions in the US and is becoming of critical importance in many other developed markets and even some emerging markets. The relatively low-cost and easy availability of fast/fatty foods and the increasingly sedentary lifestyles of many workers have contributed to this problem. The rise of obesity threatens to rapidly increase the incidence of serious illnesses such as diabetes. It could lead to a decline in life expectancies and a large increase in public health expenditures. Obesity among children is of particular concern.
As consumers and governments start to take an interest in this issue, many food suppliers are responding by changing the mix of ingredients and products. A possible government approach to this would be a sin tax, akin to those levied on tobacco, alcohol and gambling. The challenge will be to meet the rigorous taste demands of fickle consumers while providing a healthier eating experience. This is particularly difficult as many consumers have
a certain degree of cognitive dissonance. That is, they indicate a desire for healthy foods, yet they continue to purchase and enjoy relatively unhealthy foods.
3. How to reach the world’s poor?In recent years, a growing share of global consumer spending growth has come from emerging markets, especially China and India. This is likely to continue. Consequently, consumer product suppliers will look to these markets for a large share of their future growth. Of particular interest will be the rising incomes of the poorest consumers in these countries. The challenge will be to develop products on a mass scale that are affordable to relatively low income consumers. Already many such efforts are under way. In India, there is a plan to develop an automobile for under US$2,000. In many countries, computer manufacturers seek to offer personal computers for under US$200. Even when it comes to household and personal care products, manufacturers are trying to find ways to manufacture at very low cost and sell products with minimal packaging (as the latter often accounts for a large share of total cost). This effort is likely to intensify in the next few years. Moreover, it could lead to innovative and lower cost products aimed at affluent markets as well.
4. Retail consolidation drives supplier consolidationOften referred to as “the Wal-Mart effect,” the rise of a handful of powerful low-priced retailers has wreaked havoc for consumer product companies. This consolidation has taken place through merger and acquisition activity as well as through strong organic growth by the largest players.
Large retailers, by virtue of their size, have shifted the balance of power in the supply chain. By focusing on high volume and low prices, they have put price pressure on suppliers and have shifted costs back up the supply chain. By developing strong private brands, the retailers have competed directly with their branded suppliers. Within major merchandise categories, some of these retailers are reducing the number of vendors with which they deal. The goal is to reduce distribution costs as well as create a more focused assortment for consumers. As such, retailers are picking favored vendors in each category they sell. This means that fewer vendors are needed. And this means that many suppliers must fight for shelf space. Finally, large retailers are demanding customized products from suppliers, playing an active role in product development. In essence, the retailers often have a veto over supplier product initiatives.
One effect of retail consolidation has been to make suppliers highly dependent on key retailers. For example, Wal-Mart alone accounts for roughly 14% to 18% of the sales of many large
24 |
Consumer Business
consumer product suppliers. In a few cases, the share is much higher. Moreover, retail consolidation is taking place on a global scale — including in emerging markets.
For consumer product suppliers, these trends have led to merger and acquisition activity. This has been important for several reasons: first, to offset the shifting balance of power by creating larger supplier organizations; second, to reduce overhead costs through scalar efficiency; third, to create organizations that are among the handful of suppliers favored by the big retailers.
Yet supplier consolidation alone is not sufficient. After all, retailers continue to manage and define relationships with consumers. For suppliers, the challenge is to break out of this dilemma by building direct consumer relationships and offering products and brands that are sufficiently differentiated. In doing so, suppliers would be able to exert leverage with retailers. To do this requires bet-ter information about consumers, especially their motivations. It requires innovation in order to differentiate. Yet in order to make such a strategy sustainable, the process of innovation must be institutionalized.
5. Innovating for long-term growthConsumers the world over are becoming richer – especially in emerging markets. Even in the already affluent developed countries, many consumers have accelerated their spending due to increased wealth associated with their homes and financial portfolios. Yet this expanded affluence has not necessarily led to increased purchases of traditional products. After all, there are only so many times you can wash your hair or mop your floor. Instead, most of the incremental spending has had to do with innovative electronics, fashion, and services such as travel, dining, and entertainment.
The challenge for consumer product companies is to find ways to capture some of this extra spending. That means creating innovative, more upscale products and brands. There won’t necessarily be more hair-washing events, but perhaps consumers can be stimulated to spend more on each such event. The sad alternative for suppliers is to dramatically reduce the cost of producing products and, thereby, generate greater margins on the existing range. Yet while this is a good idea, it is a one-shot deal and is not consistent with longer-term growth. In other words, it is not sufficient.
One issue is that mass merchandise retailers are devoting more space to the kinds of products on which consumers spend incremental income. That means less space devoted to food and other fast moving goods and more space devoted to apparel, electronics, appliances, and games. For suppliers of fast moving
consumer goods, this means more competition for space. It also means a greater imperative to come up with ideas that stand out from the crowd — especially ideas that involve premium brands with premium pricing. The challenge for traditional suppliers is to either acquire newer brands or develop brands that meet new consumer needs.
6. Fragmentation of the consumer experienceAt the same time that each retail segment is becoming more consolidated, consumers are being offered a wider range of retail formats for each merchandise category. For consumers purchasing food and household products, for example, there are hypermarkets, supercenters, membership warehouse clubs, hard discount stores, single price stores, supermarkets, drug stores, convenience stores, and websites to choose from. In other categories the choices are great as well. In addition, it appears that consumers are increasingly disloyal to particular formats or fascias – and this is especially true of younger consumers. Moreover, consumers are increasingly seeking alternative venues for low-priced and high-priced goods. At the low end, the rise of hard discounters and one price stores has caused problems for traditional retailers and suppliers. At the upper end, specialty retailers offer alternative categories and brands such as organic, non-GM, and upscale specialty products. Again, this leaves the traditional players with a declining share of wallet.
7. Is it all about price?After many years of rising market share for discount retailers, consumers the world over are becoming trained to expect low prices even for relatively high quality merchandise. Indeed, many upscale consumers have switched from traditional formats to discount formats — even when it comes to fashion apparel and home fashion. Thus, suppliers are under pressure from retailers and consumers to offer a higher sense of value. This sense can emanate from low prices, but a focus on price alone will lead inevitably to lower margins.
The problem stems from the fact that consumers have been trained by price-oriented retailers. These retailers have focused on price to the exclusion of much else, creating the impression that all products are commodities and that purchasing decisions are made only on the basis of price. Indeed some big retailers recognize that they have created a monster and are interested in having differentiated, premium brands that would help to boost margins. This represents an opportunity for suppliers. On the other hand, the success of some retailers in creating private labels for different consumer cohorts indicates that they may actually be more successful at consumer segmentation than their traditional suppliers.
| 25
Global powers of the consumer products industry
8. Finding alternatives to traditional marketingIn recent years, the power of mass marketing has dramatically declined. The advent of new technologies has enabled consumers to obtain entertainment in many more ways than in the past. The proliferation of cable and satellite television channels, the internet, DVDs, and video games means that marketing channels are becoming fragmented and less productive. This is especially true when it comes to the much sought-after young consumer. Moreover, technology now allows consumers to avoid marketing information through channel surfing, recording programming, or purchasing entertainment online.
For suppliers, this means that alternative approaches are essential. These can involve internet advertising, cinema advertising, product placement in films and games, special events, and tie-ins with other brands.
9. The talent dilemmaIn the US, roughly 60% of new MBAs go to work in banking or consulting. Many others pine to work in technology or media. In this environment, it is hard for consumer product companies to attract the best and brightest. Yet the problem goes beyond competition for talent. Much existing talent is aging and near retirement. The soon to retire baby boom generation in the US and Western Europe will be succeeded by a smaller generation and, hence, a smaller pool of talent. For consumer product companies, the challenge then is to retain and transfer group knowledge, attract strong talent, and properly manage a geo-graphically and culturally diverse workforce. The latter will be critical as much of the transfer of knowledge will involve off- shoring of talent, especially to emerging nations such as India and China. Some of this offshore talent will involve managing new business opportunities in emerging markets. Some could involve transferring entire functions to emerging markets.
10. Managing retailer-supplier relationsUnfortunately for suppliers, much of what happens in the retailer supplier relationship will be driven by retailer behavior. Retailers are becoming more concentrated and more powerful, and are increasingly focusing on managing and marketing their own brands. Moreover, retailers are now hiring marketing executives away from consumer product companies in order to improve their own private labels. If retailers become better at managing private labels, they will be more serious competitors to consumer product companies.
That is not to say that suppliers lack choices. Purveyors of the leading brands, especially those with a strong consumer following, will be well positioned to negotiate with retailers from strength. At the same time, the development of niche brands that focus on small, focused consumer cohorts, will take expanded market share. That will leave second tier national brands, however, struggling to survive. Many, in fact, will not. They will be stuck in the middle between leading brands, private brands, and niche brands. It could very well be that the optimal strategy for suppliers will be to rationalize their brand portfolios by shedding second tier brands. They will do best to focus on leading brands and newer niche and innovative brands. Thus, an important part of managing retail relationships will be successfully managing brand portfolios.
Another important part of managing retail relationships will be managing new kinds of retailers. A disproportionate share of the growth of consumer spending will probably be driven through new channels such as organic and health related food retailers, upscale and specialty stores, and downscale retailers (such as one price stores). Managing these will require some new approaches.
11. Grabbing the “long tail” of opportunityThere are not many opportunities to differentiate while at the same time targeting a mass audience. Thus, more differentiation is likely to mean more niche selling. This means exploiting the much-discussed “long tail.” Specifically, if you assume that most consumer cohorts (defined by income, lifestyle, or interests) are distributed in a bell-shaped curve, the mass market is generally in the middle of that bell. Today, that middle is often saturated and increasingly commoditized. The long tails at either end of the bell, however, may offer opportunities that have not been well exploited.
It is in this long tail where future profitable growth opportunities will likely lie. This is especially true as consumers continue to fragment into more narrowly defined groupings. The fragmentation of mass media both reflects and encourages this trend. Thus, targeting the long tail will also involve getting close to a more narrowly defined target consumer through new forms of marketing.
How will suppliers attack the long tail? There is no single solution. Instead, opportunities in the long tail can be exploited through organic innovation, acquisition of existing businesses, or some combination thereof. For example, a large consumer products company can act as a financing tool for small entrepreneurs with innovative ideas. The key is to figure out the right mix of organic, acquisition, and partnership efforts. It requires flexibility and openness to new ideas.
26 |
Consumer Business
12. Social responsibilityIn many parts of the world consumers are becoming increasingly aware of, and concerned about, the impact that companies have on society. This includes concern about the safety and health of workers who produce goods, the impact on the physical environment of producing goods, and the impact on the environment of consuming goods and disposing of waste. This concern is increasingly reflected in the policies of governments as well. Moreover, there is an expectation that future policy initiatives will be more aggressive and, potentially, more costly for companies. To date, government action in this area has been more carrot than stick – deductions for energy- efficient properties, solar energy credits, and clean renewable energy bonds.
Awareness is growing that, for companies, being proactive in this area can be good business. First, taking action now may either mitigate future regulatory costs or at least smooth the cost over time. Second, taking action now can enhance brand equity, especially for consumers who are particularly concerned about these issues. Finally, taking action can actually reduce unit production costs — especially when it comes to packaging. Already many companies are measuring their societal impact and have appointed high-level executives to focus on social responsibility issues. This focus is likely to grow in the future.
13. The brand — more important than everIn this environment, brand equity becomes critical. A brand, of course, is simply an efficient piece of information that defines the differentiating factors about a product or service. In a commoditized world, consumers are increasingly indifferent to brand messages, with the notable exception of luxury goods. The rise of discounters, private brands, no-name brands, and one-price stores reflects this indifference. In such a world, brands are of even greater importance to consumer oriented businesses than in the past. The challenge is greater than just building brand equity. The challenge is to create differentiating factors in order to attract a target consumer, use new marketing tools to engage the target consumer in a dialogue, use that dialogue to build a brand that conveys the differentiating factors, and execute the strategy in order to convince consumers of the reliability of the brand. This is a tall order.
For more information:
Global Consumer Business Leader Lawrence Hutter Deloitte UK [email protected]
Deloitte ResearchIra Kalish Deloitte Services LP [email protected]
Marketing Karthryn Cordes Deloitte Touche Tohmatsu [email protected]
Consumer Products LeadersAmericasBruce Westbrook Deloitte Consulting LLP [email protected]
Europe, Middle East and Africa Koen De Staerke Deloitte Belgium [email protected]

| 27
Global powers of the consumer products industryConsumer business contacts
For Deloitte Touche Tohmatsu and its member firms
North AmericaUnited StatesPat Conroy Deloitte & Touche USA LLP [email protected]
CanadaBrent Houlden [email protected]
Europe, Middle East and Africa BelgiumKoen De Staercke [email protected]
DenmarkHenrik Knak [email protected]
FinlandJussi Konkola [email protected]
FranceGilles Goldenberg [email protected]
GermanyPeter Thormann [email protected]
GreeceGeorge Cambanis [email protected]
IrelandBrendan Jennings [email protected]
ItalyDario Righetti [email protected]
NetherlandsPieter Peerlings [email protected]
NorwayMarius Eriksen [email protected]
PortugalLuis Belo [email protected]
RussiaGraham Povey [email protected]
SloveniaGraham Hayward [email protected]
South AfricaRodger George [email protected]
SpainJuan Jose Roque [email protected]
SwedenLars Egenaes [email protected]
SwitzerlandJ.N. Hill [email protected]
TurkeyUgur Suel [email protected]
UkraineDina Nemirovich [email protected]
United KingdomRichard Lloyd-Owen [email protected]
Latin America, Carribean (LACRO) Argentina Daniel Varde
Bahamas Bruce Knowles
Brazil Altair Rossato [email protected]
Chile Juan Echeverria [email protected]
Colombia Juan Carlos Sanchez Nino [email protected]
Mexico Omar Camacho [email protected]
Venezuela Ignacio Rodriguez [email protected]
Asia Pacific Australia Andrew Griffiths [email protected]
China/Hong Kong Eric Tang [email protected]
India Shyamak Tata [email protected]
Japan Yoshio Matsushita [email protected]
Korea Do-Sung Kim [email protected]
MalaysiaYoon Chong Yee [email protected]
New Zealand Lisa Cruickshank [email protected]
Singapore Alan R. Nisbet [email protected]
Taiwan Ping Lee [email protected]
Thailand Montree Panichakul [email protected]
Copyright © 2008 Deloitte Development LLC. All rights reserved.
Deloitte refers to one or more of Deloitte Touche Tohmatsu, a Swiss Verein, and its network of member firms, each of which is a legally separate and independent entity. Please see www.deloitte.com/about for a detailed description of the legal structure of Deloitte Touche Tohmatsu and its Member Firms.
Disclaimer
These materials and the information contained herein are provided by Deloitte Touche Tohmatsu and are intended to provide general information on a particular subject or subjects and is not an exhaustive treatment of such subject(s).
Accordingly, the information in these materials is not intended to constitute accounting, tax, legal, investment, consulting or other professional advice or services. The information is not intended to be relied upon as the sole basis for any decision which may affect you or your business. Before making any decision or taking any action that might affect your personal finances or business, you should consult a qualified professional adviser.
These materials and the information contained herein is provided as is, and Deloitte Touche Tohmatsu makes no express or implied representations or warranties regarding these materials and the information herein. Without limiting the foregoing, Deloitte Touche Tohmatsu does not warrant that the materials or information contained herein will be error-free or will meet any particular criteria of performance or quality. Deloitte Touche Tohmatsu expressly disclaims all implied warranties, including, without limitation, warranties of merchantability, title, fitness for a particular purpose, noninfringement, compatibility, security, and accuracy.
Prediction of future events is inherently subject to both known and unknown risks, uncertainties and other factors that may cause actual results to vary materially. Your use of these and the information contained herein is at your own risk and you assume full responsibility and risk of loss resulting from the use thereof. Deloitte Touche Tohmatsu will not be liable for any special, indirect, incidental, consequential, or punitive damages or any other damages whatsoever, whether in an action of contract, statute, tort (including, without limitation, negligence), or otherwise, relating to the use of these materials and the information contained herein.


