
Global Infrastructure Stocks/Reliability
H. Scott Matthews
February 12, 2004

Recap of Last LectureDefined and discussed performanceHumplick paper reminded us of multiple
levels and perspectives We hadn’t discussed users much before
Talked about why infrastructure mattersAnd why performance measurement is
difficultOverview of performance methods
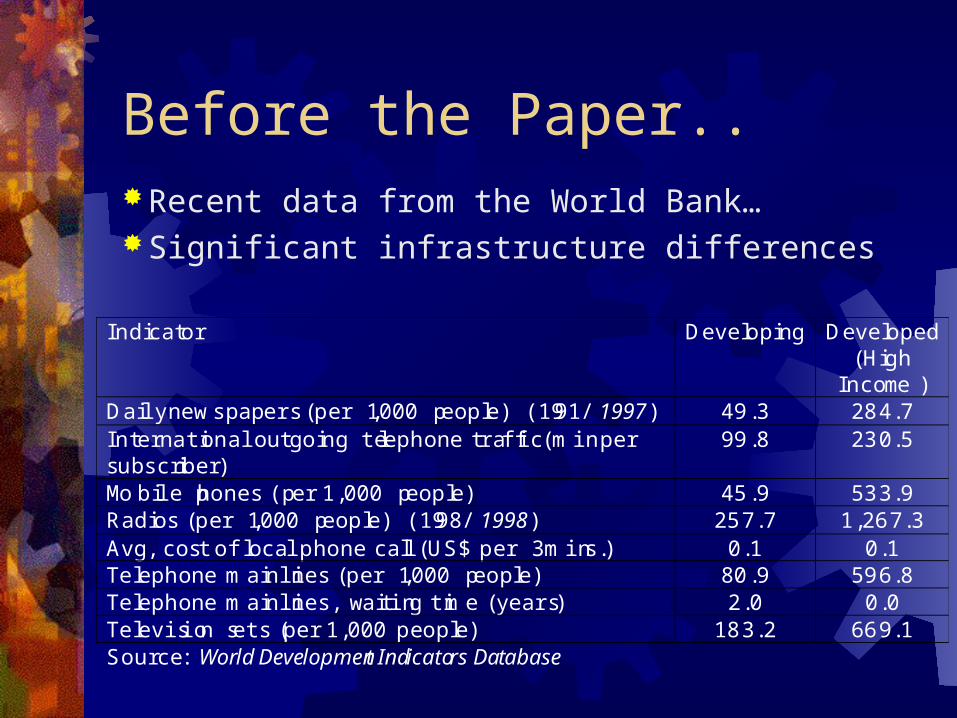
Before the Paper..Recent data from the World Bank…Significant infrastructure differences
Indicator Developing Developed(High
Income)Daily newspapers (per 1,000 people) (1991/ 1997 ) 49 .3 28 4 . 7In ter na ti on al out go ing te le ph one t ra ffic ( m in pe rs u bscr ibe r)
99 .8 23 0 . 5
Mob ile p hone s (p er 1 ,000 p e op le) 45 .9 53 3 . 9Rad ios (p e r 1 ,000 p e op le) (19 98/ 1998 ) 25 7 . 7 1 ,26 7 . 3Avg, cos t o f loca l p hone cal l (US$ p e r 3 m in s. ) 0 .1 0 .1Te le ph one m a in line s (p e r 1 ,000 p eo ple) 80 .9 59 6 . 8Te le ph one m a in line s, w a it in g ti m e ( ye ars ) 2 .0 0 .0Te lev is ion s e ts ( pe r 1 ,000 p e op le ) 18 3 . 2 66 9 . 1Source : World Development Indicators Database

ExpectationsSo we don’t lose sight of global
relevance of these issues..Data on previous slide implies WHAT?
Expect less economic output Lower educational levels Cause or effect?

Canning Paper“A Database of World Infrastructure
Stocks, 1950–95”, David Canning, World Bank Paper #1929, June 1998
Main stock dataset available on web152 countries, generally 45 yrs
Some countries no data until recently What is/is not included in data?

Measures in Dataset Roads, Paved Roads (km) Railway lines (km) Number of telephones Number of telephone main lines KW electricity generating capacity Some infrastructure quality measures
Condition of roads, Percent dropped calls, electricity system losses
What could this data be used for?
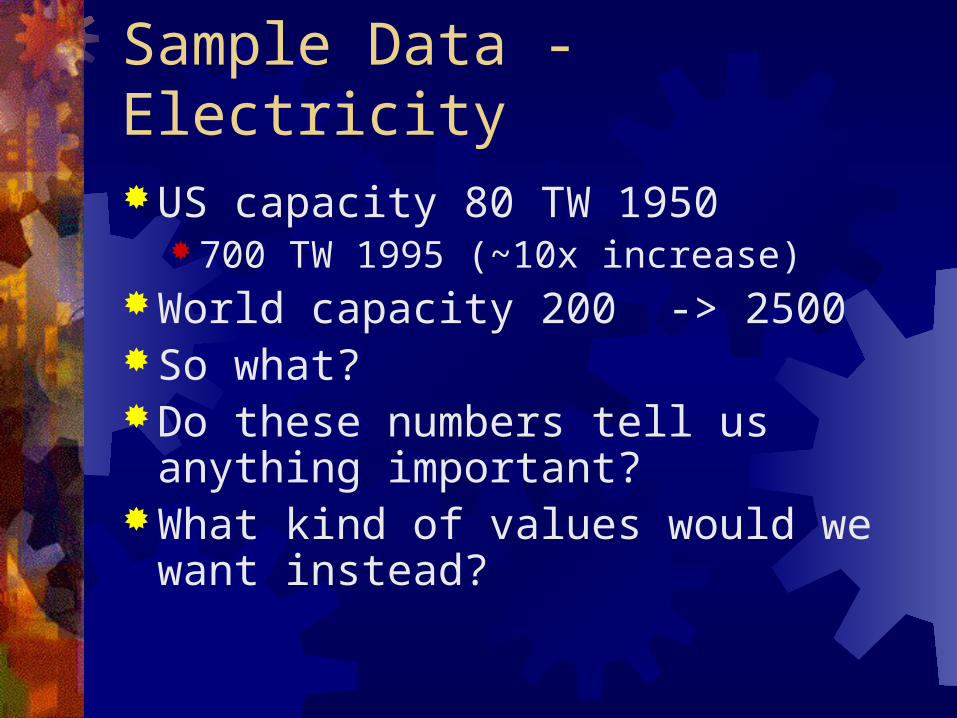
Sample Data - ElectricityUS capacity 80 TW 1950
700 TW 1995 (~10x increase)World capacity 200 -> 2500So what?Do these numbers tell us anything
important?What kind of values would we want
instead?

Population Growth1950 2,556,000,0531960 3,039,451,0231970 3,706,618,1631980 4,453,831,7141990 5,278,639,7892000 6,082,966,429
2010* 6,848,932,9292020* 7,584,821,1442030* 8,246,619,3412040* 8,850,045,8892050* 9,346,399,468

Canning Paper Econometric study of infrastructure stocks as
related to: Economic growth Population Change Investment
‘Full report’ available on web: http://www.worldbank.org/html/dec/Publications/
Workpapers/WPS1900series/wps1929/wps1929-abstract.html (bottom of this page)

Conclusions Non-transportation infrastructure stocks tend to
increase 1:1 with population Increase more than 1:1 with per-cap GDP
Geographic factors appear to affect provision of non-trans in poor countries But not in rich countries
Transport. Infras. increases less than 1:1 with population Increases with income only after threshold reached
Do these conclusions surprise us?
Life Cycle Costing andReliability

Life Cycle Costing (LCC) Mentioned earlier in course Is a tool to assist decision makers in
managing ‘total costs’ of projects Includes design, construction, 4R’s (repair,
rehabilitation, replacement, reconstruction), user costs, disposal Converted into ‘present value’ costs
Generally an “economic-only” (costs only) framework Others (around CMU and elsewhere) have added
consideration of energy/environmental

More Background ISTEA (1991) suggested LCC for
pavement, bridge, tunnel projectsFHWA in 1996 linked funds availability
to use of LCC in major projects Why might you not want to use LCC?
How does this differ from Benefit-Cost Analysis?

Initial CostsUsually site preparation and
constructionShould consider ‘user costs’ (traffic, etc)Where to get data - current/completed
projects similar in design/scope

4R’s and Salvage CostsAre dependent on technology and
materials choices E.g. depth of pavement affects useful life Should not exclude costs that seem ‘too
small’ - you don’t know ‘how small’ until total costs estimated!
Salvage - potential value of materials at end-of-life (e.g. scrap steel, asphalt, etc)
User (Delay) CostsConsideration of opportunity cost of
time for drivers when inconvenienced due to infrastructure downtime E.g. congestion, re-routing around road Should also consider vehicle operating
delay cost (fuel, etc).A cost/vehicle-hour estimate used
$12-$25 for cars/big trucks gets used

Examples (No User Costs) Project B: Construction $350k Prevent. Maint. @ Yr 8
$40k Major Rehab @ Yr 15
$300k Prevent. Maint. @ Yr 20
$40k Prevent. Maint. @ Yr 25
$60k Salvage@ 30 $105k NPV $610k
Project A:Construction $500kPrevent. Maint. @ Yr
15 $40kMajor Rehab @ Yr 20
$300kSalvage@ 30 $150kNPV $705k

What’s Missing?Note LCC for infrastructure generally
does not consider any ‘pure benefits’ of using it
Its presumed that all alternatives would yield similar/equal value
This is usually the case, but could be affected by design or budget constraints (e.g. a 2 vs 4-lane road or bridge)

An Energy Example Could consider life cycle costs of people using
electricity in Texas Assume coal-fired power plants used Coal comes from Wyoming
Option 1 (current): coal mined, sent by train to Texas, burned there
Option 2: coal mined, burned in Wyoming into electricity, sent via transmission line to Texas
Which might be cheaper in cost? What are components of cost that may be relevant? Are there other ‘user costs’?
Reliability-Based Management From Frangopol (2001) paper
“Funds are scarce, need a better way” Have been focused on “condition-based” Unclear which method might be cheaper
Bridge failure led to condition assessment/NBI methods Which emphasized need for 4R’s Eventually money got more scarce
Bridge Management Systems (BMS) born PONTIS, BRIDGIT, etc. Use deterioration and performance as inputs into economic
efficiency measures

Current BMS FeaturesElements characterized by discrete
condition states noting deteriorationMarkov model predicts probability of
state transitions (e.g. good-bad-poor)Deterioration is a single step functionTransition probabilities not time variant

Reliability Assessment Decisions are made with uncertainty
Should be part of the decision model Uses consideration of states, distribution
functions, Monte Carlo simulation to track life-cycle safety and reliability for infrastructure projects
Reliability index use to measure safety Excellent: State 5, >= 9, etc. No guarantee that new bridge in State 5! In absence of maintenance, just a linear,
decreasing function (see Fig 1)
Reliability (cont.) Not only is maintenance effect added, but
random/state/transitional variables are all given probability distribution functions, e.g. Initial performance, time to damage, deterioration
rate w/o maintenance, time of first rehab, improvement due to maint, subsequent times, etc..
Used Monte Carlo simulation, existing bridge data to estimate effects
Reliability-based method could have significant effect on LCC (savings) Why?


