
Glaciers, Snow and Hazards: current EO
limitations and user needs for the future
Claudia Notarnicola
EURAC Research-Institute for Applied Remote Sensing, Bolzano/Bozen, Italy

2
Why snow/glaciers and hazards?
3
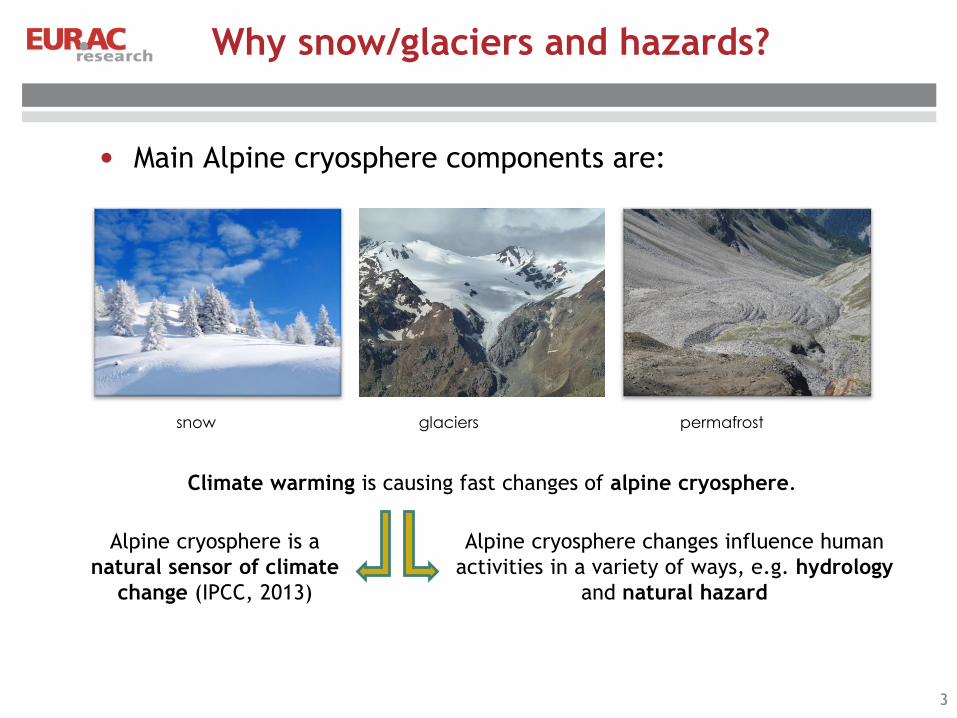
• Main Alpine cryosphere components are:
snow glaciers permafrost
Climate warming is causing fast changes of alpine cryosphere.
Alpine cryosphere is a
natural sensor of climate
change (IPCC, 2013)
Alpine cryosphere changes influence human
activities in a variety of ways, e.g. hydrology
and natural hazard

SNOW
4
WATER AVAILABILITY – SNOW COVER –
SNOW WATER EQUIVALENT- RIVER DISCHARGE
TOURISM – SNOW COVER - SNOW HEIGHT

GLACIERS
5
WATER AVAILABILITY –
GLACIER MELT IN SUMMER MONTHS
INDICATORS FOR CLIMATE CHANGES
E.G. MASS BALANCE
GLACIER LAKE OUTBURST FLOOD

HAZARDS
6
AVALANCHE – SNOW COVER - SNOW STRUCTURE
PERMAFROST CHANGES.
DEBRIS FLOW
RISKS FOR INFRASTRUCTURES
WATER AVAILABILITY– FLOODS
Images from Mair V., et al 2011, PermaNET Synthesis Report

Users Needs
7
Variables
Data Requirements Data Specifications
Context Problems UsersSpatial
Resolution
Time
Resolutio
n
Accura
cy
Lead
TimeScale
Snow cover
Civil Protection (e.g.
avalanche forecast)Resolution
Civil
Protection250 m weekly
Tourism Exposure Consortium daily
monthly
Snow water
equivalent
Civil Protection Hydrographic services SKITOUR 250 m weekly
Idroelectric productivity Wind
Infiltration Agriculture Irrigation Variable
Humidity
Run-off Civil Protection Outlier detection Daily Basin
Weekly
River discharge
Civil Protectionvariability of monthly
discharge with altitude
Water
resourcesBasin
48h forecastingHydroelectric
company
Outlier detection

Field measurements
Mattia Callegari 8
EO Observable Parameters
9
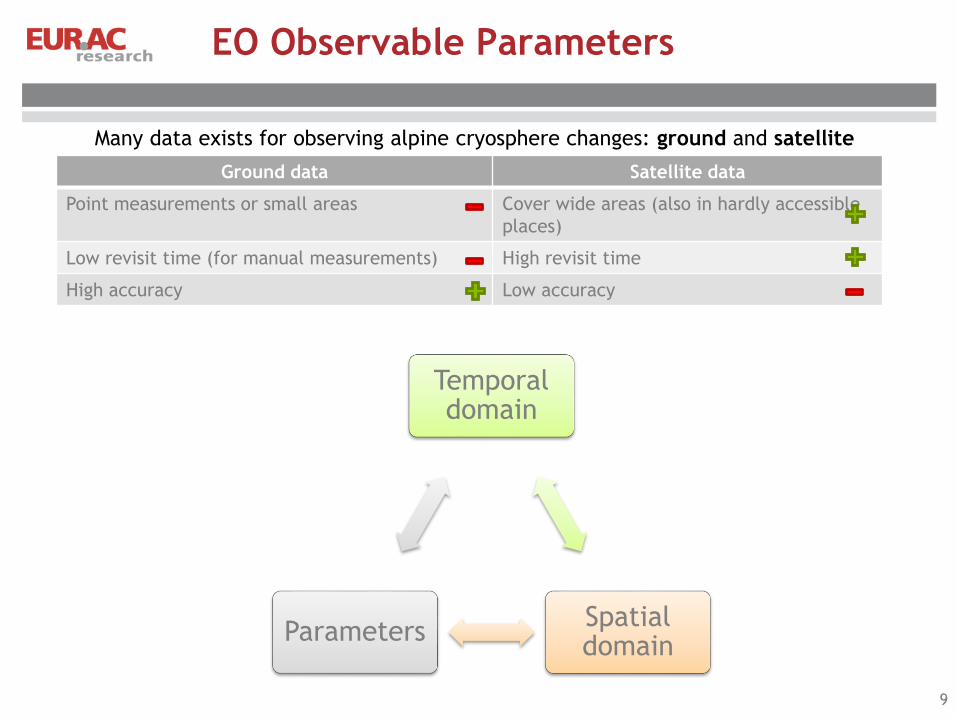
Many data exists for observing alpine cryosphere changes: ground and satellite
Ground data Satellite data
Point measurements or small areas Cover wide areas (also in hardly accessible
places)
Low revisit time (for manual measurements) High revisit time
High accuracy Low accuracy
Temporal domain
Spatialdomain
Parameters

Cryosphere monitoring
EURAC-MODIS Snow cover maps
Oct-2015 – Jun-2016

Snow
11webgis.eurac.edu
Spatially explicit time series of data

High resolution snow maps from S2
snow
no snow

Snow and wet snow cover monitoring

Snow and wet snow cover monitoring
Daily mean discharge
Mean discharge of the 12 days after the S1 acquisition
Wet snow cover area (SAR)
Snow cover area (optical)

Glacier cover maps from S2
snow
firn
ice
soil
cloud
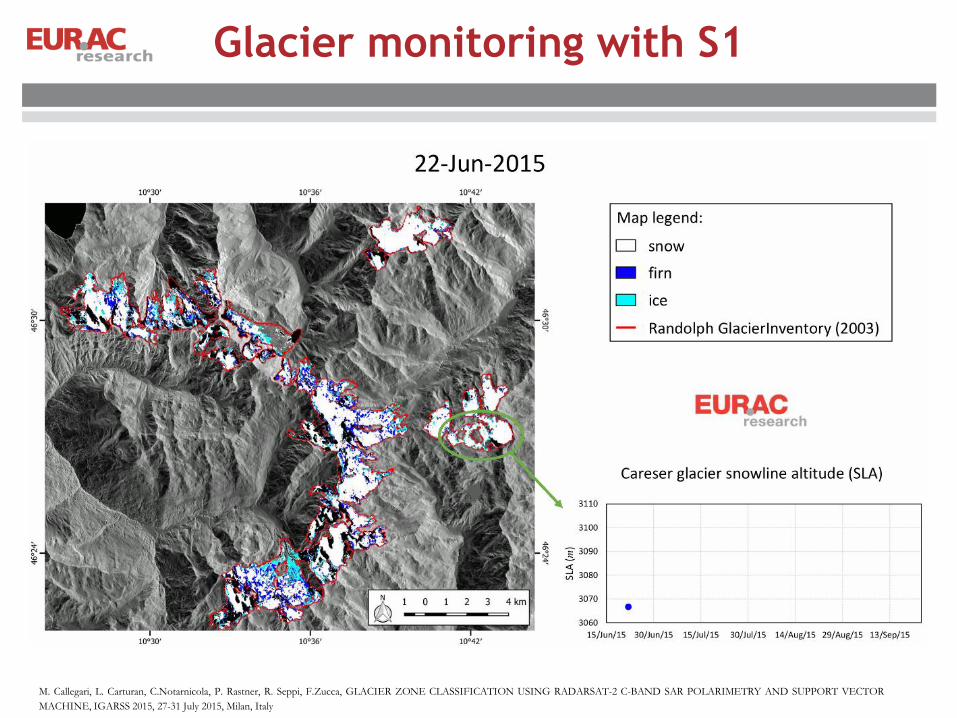
Glacier monitoring with S1
M. Callegari, L. Carturan, C.Notarnicola, P. Rastner, R. Seppi, F.Zucca, GLACIER ZONE CLASSIFICATION USING RADARSAT-2 C-BAND SAR POLARIMETRY AND SUPPORT VECTOR
MACHINE, IGARSS 2015, 27-31 July 2015, Milan, Italy

Rock glacier movements
17
Amola RG
A
C
B0 30 cm/year
Geocoded velocity map
obtained with the SBAS algorithm
-2
0
2
4
6
8
10
12
14
16
18
20
-2 0 2 4 6 8 10 12 14 16 18 20
SBA
S (
cm
/y)
total station (cm/y)
Total station – SBAS comparison
Displacement time
series obtained
with SBASRMSE = 3.5 cm
(M.Callegari , PhD thesis 2015)

Parameters not observable from EO data
18
Several key parameters are not directly observable by remote sensing
data.
River discharge, snow water equivalent are fundamental but needs to be
estimated through models, ground data et al.
In developed countries, users have already tools and data to support the
monitoring of the cryosphere.
Co-production is needed to result in developments and applications to
satisfy user needs.

River discharge with ML approach
Statistical approach
present
time
discharge
Prediction lag ∆𝑡
Target to be
predicted
Machine learning approach:
Support Vector Machine (SVM), which is used for time series prediction in many application
domains (e.g. economic).
Main advantages of SVM:
• can estimate highly non linear function
• can easily handle inputs of different kind (not only discharge time series)
Meteorological and
climatological variables
Discharge time series
Remote sensing
products

Results
10 years average
discharge
(benchmark)
AR = Autoregressive model (standard statistical method)
0
5
10
15
20
25
30
35
40
RM
SE%
1 month lag 3 months lag 6 months lag

River discharge forecast
0
20
40
60
80
100
120
Jan Apr Jul Oct Jan Apr Jul Oct Jan Apr Jul Oct Jan
cum
ula
tive
vo
lum
e er
ror
(m3
x 1
07) 10 years average
AR
SVR noSCA
SVR
watershed 7, mean annual water volume = 160 x 107 m3
prediction lag = 1 month
Test year 1 Test year 2 Test year 3
M.Callegari, P.Mazzoli, L.De Gregorio, C.Notarnicola, L. Pasolli, M.Petitta, A.Pistocchi, Seasonal river discharge forecast using machine learning techniques: a case
study in the Italian Alps“, Water 2015, 7(5), 2494-2515; doi:10.3390/w7052494.

Potential
Spatially explicit times series of hydrological relevant data where other
observations are rare
Strong in Energy Balance related approaches of hydrology
Limitation
Data gaps and availability in the past (> 20 years)
Accuracy of indirect parameters (compared to measurements)
Key parameters not directly observable by remote sensing imagery
Solution
Clever integration with other data sources and / through models
How Remote Sensing can contribute …
22

Regional Users – Future trends
23
In the last years, regional users have shown high interest in:
- Tools/Indicators for support the adaptation to climate changes in the touristic
areas
- Tools/Indicators for supporting the response phase in case of events
- Tools/Indicators for supporting management of water resources (availability
for agriculture and tourism)

Thank you for the attention!
Questions/comments?
24


