Download - Getting Started with Microsoft Power BI

Getting Started with
Microsoft Power BI
A practical primer for public-sector clients that
want to get started with Microsoft Power BI
1
PLAYBOOK

Leverage data, gain
insights, make
better decisions.
Kiefer Consulting has successfully helped clients do
more with their data. In 2018, Kiefer made the decision
to establish four practice groups to better serve our
customers. The Data Analytics and Visualization
practice area focuses primarily on helping customers
leverage data, gain insights, and make better
decisions.
Our practice is built on years of experience with Excel,
SSRS, SQL, Power Query, and Power Pivot.
When Power BI became more widely distributed and
business intelligence was offered as a self-service tool,
we began to get more calls about business
intelligence services. Kiefer clients began expressing
interest in Power BI dashboards so they could uncover
relevant information in complex datasets.
Organizations that were new to Power BI wanted us to
help with a proof of concept so they could better
understand what is possible with Power BI.
This eBook offers practical guidance on how to get
started with Microsoft Power BI and offers tips that will
help you in fostering a culture that leverages data to
drive better decisions. 2

Assess Your
Maturity
Before you get started with Power BI, you should determine where your organization
may sit on the Kiefer Digital Maturity Model for Data Analytics and Visualization. We
use the maturity roadmaps to assist clients in making a long-term plan for digital
transformation. The maturity model helps identify the characteristics of an
organization that has reached a specific level, and the anticipated challenges that may
prevent them from advancing to a higher level. We also consider appetite for change
and evaluate appetite against an organization’s ability to change. Our team often
works with clients to understand their current position on the maturity model and offer
strategies and best practices to produce a plan and a roadmap.
3
See the Kiefer Digital Maturity Roadmap on the next page.

4

Start with a Proof
of ConceptAs organizations explore possible applications for
Microsoft Power BI, we often recommend a proof
of concept (PoC). A PoC offers organizations the
opportunity to see their data on a dashboard and
data visualizations that have relevance to them.
Demonstrations of dashboards that we have built
for other clients do not resonate as well as a
dashboard that presents visualizations that are
relatable and utilize a client’s own data.
We have discovered that PoCs that are built to
answer three or four questions about a client’s
data will frequently result in the client asking to
see the dashboard answer three or four more
questions that they hadn’t considered. This
demonstrates the value of using actual data as
opposed to using pre-built demos to show the
capabilities of Microsoft Power BI.
5
IT Spend Sample
Procurement Analysis Sample
Human Resources Sample
Typical Power BI PoCs have included• IT Spend Analysis
• Human Resources
• Opportunity Analysis
• Procurement Analysis
6
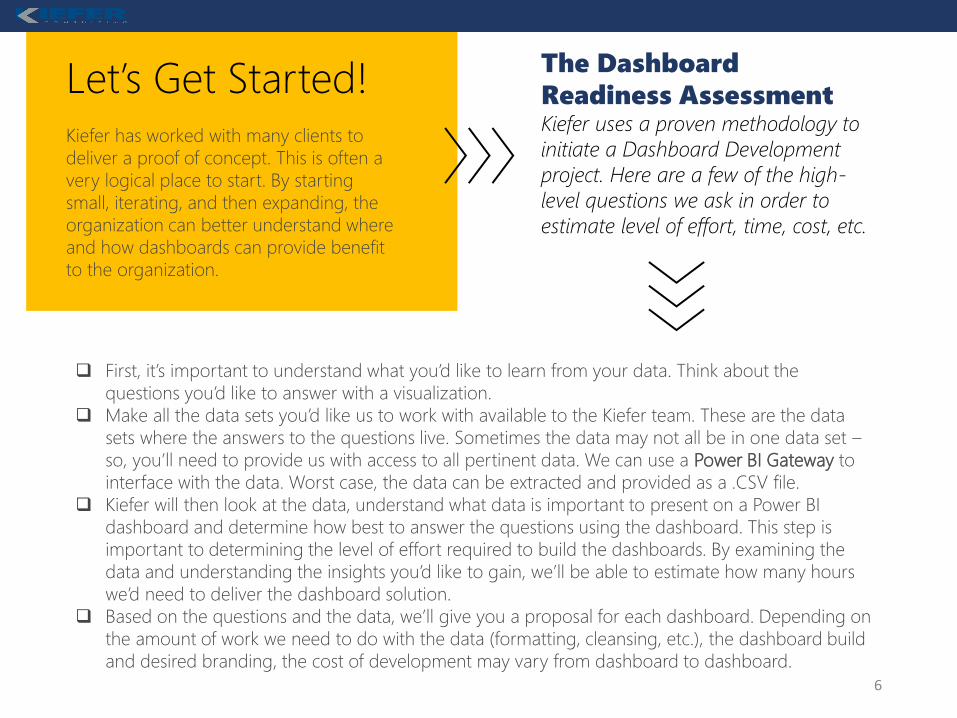
The Dashboard
Readiness AssessmentKiefer uses a proven methodology to
initiate a Dashboard Development
project. Here are a few of the high-
level questions we ask in order to
estimate level of effort, time, cost, etc.
❑ First, it’s important to understand what you’d like to learn from your data. Think about the
questions you’d like to answer with a visualization.
❑ Make all the data sets you’d like us to work with available to the Kiefer team. These are the data
sets where the answers to the questions live. Sometimes the data may not all be in one data set –
so, you’ll need to provide us with access to all pertinent data. We can use a Power BI Gateway to
interface with the data. Worst case, the data can be extracted and provided as a .CSV file.
❑ Kiefer will then look at the data, understand what data is important to present on a Power BI
dashboard and determine how best to answer the questions using the dashboard. This step is
important to determining the level of effort required to build the dashboards. By examining the
data and understanding the insights you’d like to gain, we’ll be able to estimate how many hours
we’d need to deliver the dashboard solution.
❑ Based on the questions and the data, we’ll give you a proposal for each dashboard. Depending on
the amount of work we need to do with the data (formatting, cleansing, etc.), the dashboard build
and desired branding, the cost of development may vary from dashboard to dashboard.
Let’s Get Started!Kiefer has worked with many clients to
deliver a proof of concept. This is often a
very logical place to start. By starting
small, iterating, and then expanding, the
organization can better understand where
and how dashboards can provide benefit
to the organization.

Connecting to
Data SourcesData can come from just about any system. Kiefer
has a proven approach to extracting,
transforming, and loading (ETL) data and
blending data from multiple sources to build a
data warehouse. This warehouse will feed
dashboards that pull data from one or more
sources. Instead of having to inspect lines of
tabular data or having to uncover trends on a
spreadsheet, dashboards can help organizations
better consume complex sets of data and make
better decisions more quickly.
Our team can help you better understand how to
get data from systems. We have helped
organizations extract data from ERP systems,
financial systems, public data sources, and much
more.
7
Data sources for Power BI - Power BI | Microsoft Docs
Read this Microsoft Doc to better
understand how Power BI connects
to various data sources.
2020 is behind us but numerous challenges remain as the
State of California looks ahead to 2023.
It’s been just over a year since many of us began
sheltering in place and, as a result, working remotely.
While many smaller, private sector companies had – or
quickly obtained – the agility to make such a drastic
pivot, large organizations like, say, the government of
California, weren’t as well-equipped. Yet they like all of us
made valiant efforts to keep the things up and
running. We’ve all learned several lessons over the past
year, which hopefully will inform decisions and actions in
the future.
To that end, the California Department of Technology
recently unveiled its latest strategic plan, titled Vision
2023. This plan outlines the technology priorities for the
State of California. Business intelligence solutions will
help solve challenges that have been identified by the
State of California.
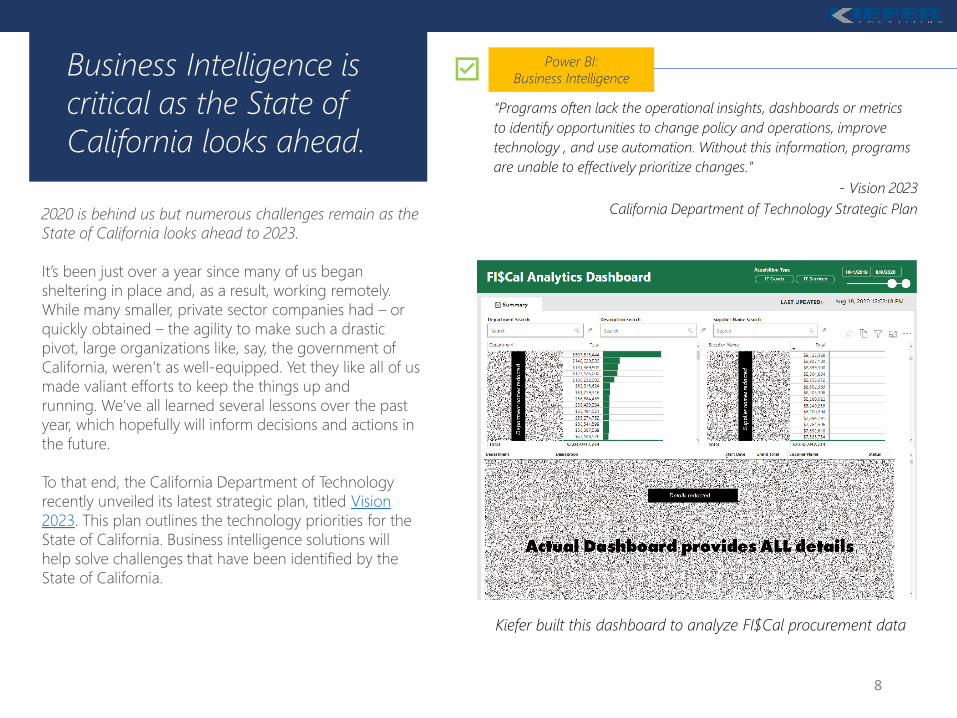
Business Intelligence is
critical as the State of
California looks ahead.
Power BI:
Business Intelligence
“Programs often lack the operational insights, dashboards or metrics
to identify opportunities to change policy and operations, improve
technology , and use automation. Without this information, programs
are unable to effectively prioritize changes.”
- Vision 2023
California Department of Technology Strategic Plan
8
Kiefer built this dashboard to analyze FI$Cal procurement data

Why Power BI?
9
Get this free infographic:
Business Intelligence Maturity Model
1. You Don’t Have to Move Data
With Power BI you don’t have to deal with the hassles of moving data around in order to make sense
of it. Instead, Power BI connects directly to hundreds of data sources from any location – in the cloud,
on-premise, within spreadsheets. Power BI doesn’t care where data is or what type of data it is.
Whatever and wherever it is, Power BI connects to it and helps you make sense of it.
2. Visualization
The awesome visualization capabilities of Power BI are, for obvious reasons, its most attention-
grabbing feature. Power BI allows users to create immersive, visually compelling reports that can be
explored interactively and collaboratively. This is the case for historical data sets and real-time data.
Power BI dashboards are sandboxes – users can create, customize and visualize practically anything.
3. Works Anywhere Across Devices
Today more than any other time, the capability of working remotely is critical. Power BI, like everything
in the Microsoft 365 ecosystem, enables people and organizations to work wherever and whenever
they need to. With native apps for iOS, Android and Windows devices, the organizational insights
afforded by Power BI can be accessed on any device. Plus, it seamlessly integrates with Microsoft
business apps like Dynamics 365 and Excel.
4. Data Analytics
If you are a data analyst delivering reporting and analytics to your organization, Power BI lets you be
productive and creative with what you build. Power BI Desktop is a feature-rich data mashup and
report authoring tool. You can combine data from disparate databases, files, and web services with
visual tools that help you understand and fix data quality and formatting issues automatically.
5. Bring Data to Life
Power BI can unify all an organization’s data, whether in the cloud or on-premises. Using the Power BI
gateways, users can connect SQL Server databases, analysis services models, and many other data
sources to the same dashboards in Power BI. If users already have reporting portals or applications,
embedding Power BI reports and dashboards results in a truly unified experience.

10
13405 Folsom Blvd. Suite 501
Folsom, CA 95630
(916) 932-7220
www.kieferconsulting.com
Updated: April 27, 2021
While we have made every attempt to ensure that the information
contained in this eBook has been obtained from reliable sources, Kiefer
is not responsible for any errors or omissions, or for the results obtained
from the use of this information.


