Geotechnical Engineering ReportIron Mountain Sanitary Sewer
and Pedestrian BridgeLake Oswego, Oregon
March 30, 2015

Geotechnical Engineering ReportIron Mountain Sanitary Sewer
and Pedestrian BridgeLake Oswego, Oregon
March 30, 2015
Submitted To:Ian Machan, PE
Otak, Inc.808 SW Third Ave., Suite 300
Portland, Oregon 97204
By:Shannon & Wilson, Inc.
3990 Collins Way, Suite 100Lake Oswego, Oregon 97035
(503) 210-4750www.shannonwilson.com
24-1-03734-002
Excellence. Innovation. Service. ValueSince 1954
TABLE OF CONTENTS 1.0 INTRODUCTION ..................................................................................................................1
2.0 PROJECT UNDERSTANDING ............................................................................................1 2.1 Scope of Services .......................................................................................................1 2.2 Site Description ..........................................................................................................2 2.3 Project Description .....................................................................................................2
3.0 GEOLOGY .............................................................................................................................2 3.1 Regional Geology .......................................................................................................2
4.0 FIELD EXPLORATIONS AND LABORATORY TESTING ..............................................4 4.1 Field Explorations ......................................................................................................4 4.2 Laboratory Test Results .............................................................................................5 4.3 Previous Explorations ................................................................................................5
5.0 SUBSURFACE CONDITIONS .............................................................................................5
6.0 SITE-SPECIFIC SEISMIC HAZARD EVALUATION ........................................................7 6.1 Seismic Acceleration and Soil Profile ........................................................................7 6.2 Site Seismic Hazards ..................................................................................................8
6.2.1 Liquefaction Potential Analysis ...................................................................8 6.2.2 Lateral Spreading and Post-Liquefaction Slope Stability ............................9
7.0 DESIGN CONCLUSIONS AND RECOMMENDATIONS .................................................9 7.1 Bridge Foundation Alternatives .................................................................................9
7.1.1 Driven Pin Piles .........................................................................................10 7.1.2 Drilled-In Pin Piles ....................................................................................10
7.2 Bridge Abutment Wall Design Recommendations ..................................................13 7.3 Slope Stability Analyses ...........................................................................................14
8.0 GEOTECHNICAL CONSTRUCTION CONSIDERATIONS ...........................................15 8.1 General .....................................................................................................................15 8.2 Site Preparation/Earthwork ......................................................................................15
8.2.1 Site Preparation and Excavation ................................................................15 8.2.2 Cut-and-Fill Slopes ....................................................................................15
9.0 LIMITATIONS ....................................................................................................................16
10.0 REFERENCES .....................................................................................................................18
24-1-03734-002_Geotech Report 24-1-03734-002 i
TABLES
1 Quaternary Faults Within a 15-Mile Radius of Project Site 2 Recommended Seismic Design Criteria 3 LPile Plus 5.0 Geotechnical Input Parameters, East Abutment 4 LPile Plus 5.0 Geotechnical Input Parameters, West Abutment 5 Post-Seismic LPile Plus 5.0 Geotechnical Input Parameters, East Abutment 6 Post-Seismic LPile Plus 5.0 Geotechnical Input Parameters, West Abutment
FIGURES
1 Vicinity Map 2 Site and Exploration Plan 3 Lateral Earth Pressure Distribution on Walls
APPENDICES
A Field Explorations B Laboratory Testing C Previous Field Explorations D Important Information About Your Geotechnical/Environmental Report
24-1-03734-002_Geotech Report 24-1-03734-002 ii

GEOTECHNICAL ENGINEERING REPORT IRON MOUNTAIN SANITARY SEWER AND PEDESTRIAN BRIDGE
LAKE OSWEGO, OREGON
1.0 INTRODUCTION
The City of Lake Oswego and Oregon State Parks and Recreation Department and their consulting team, led by Otak, Inc., are planning to replace the existing Iron Mountain Sanitary Sewer and Pedestrian Bridge in Lake Oswego, Oregon. The bridge crosses Tryon Creek approximately 0.4 miles west of Terwilliger Boulevard. Shannon & Wilson, Inc., performed an evaluation under a subconsultant agreement (project No. 16388A) with Otak, Inc., who in turn is under contract to the City of Lake Oswego as the lead consultant on the project. This report presents the results of our geotechnical design evaluations and recommendations to support the proposed bridge replacement. The approximate project location is shown on Figure 1, Vicinity Map. Shannon & Wilson previously provided a preliminary memorandum dated November 2, 2012, based on the limited subsurface information available from an exploration program consisting of shallow hand auger explorations. This report summarizes our work for this project, including additional geotechnical explorations, engineering conclusions, and recommendations.
2.0 PROJECT UNDERSTANDING
2.1 Scope of Services
We completed the following task items from the scope of services for the proposed bridge replacement:
Completed a site exploration program, including advancing two borings to depths of 23.5and 33.5 feet;
Provided recommendations for earthwork, including site preparation, excavation, cut-and-fill slopes, structural fill material, fill placement, compaction, and wet weatherconstruction; and an evaluation of onsite materials for use as structural fill onsite and inthe trail embankment;
Performed a site-specific seismic hazard evaluation, including the peak horizontalacceleration on rock for 475-year and 975-year return period ground motions, potentialliquefaction, liquefaction induced settlement, and seismic slope stability;
Developed recommendations for bridge foundation design;
Developed recommendations for fills and approach embankments, including globalstability and settlement.
24-1-03734-002_Geotech Report 24-1-03734-002 1
The scope of services was performed in general accordance with the following manuals and specifications:
ODOT Geotechnical Design Manual (GDM), September 2013; ODOT Oregon Standard Specifications for Construction (OSSC), 2008; ODOT Soil and Rock Classification Manual, 1987; and Applicable FHWA geotechnical design guidelines.
2.2 Site Description
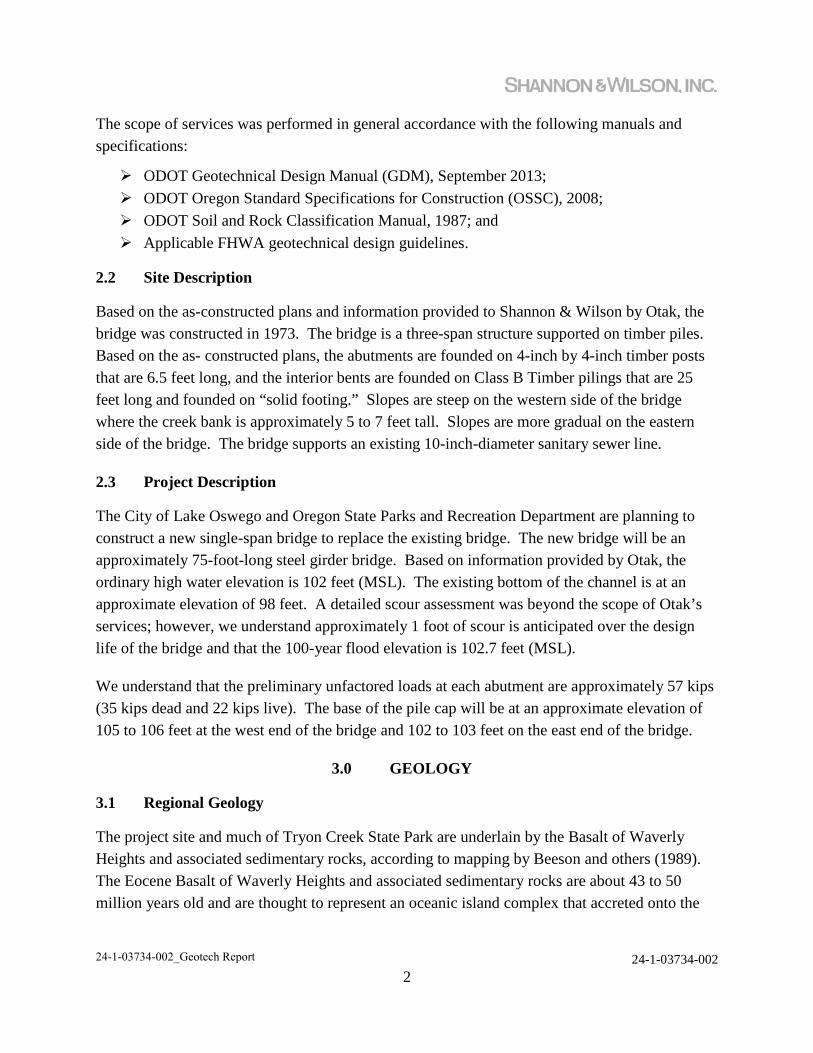
Based on the as-constructed plans and information provided to Shannon & Wilson by Otak, the bridge was constructed in 1973. The bridge is a three-span structure supported on timber piles. Based on the as- constructed plans, the abutments are founded on 4-inch by 4-inch timber posts that are 6.5 feet long, and the interior bents are founded on Class B Timber pilings that are 25 feet long and founded on “solid footing.” Slopes are steep on the western side of the bridge where the creek bank is approximately 5 to 7 feet tall. Slopes are more gradual on the eastern side of the bridge. The bridge supports an existing 10-inch-diameter sanitary sewer line.
2.3 Project Description
The City of Lake Oswego and Oregon State Parks and Recreation Department are planning to construct a new single-span bridge to replace the existing bridge. The new bridge will be an approximately 75-foot-long steel girder bridge. Based on information provided by Otak, the ordinary high water elevation is 102 feet (MSL). The existing bottom of the channel is at an approximate elevation of 98 feet. A detailed scour assessment was beyond the scope of Otak’s services; however, we understand approximately 1 foot of scour is anticipated over the design life of the bridge and that the 100-year flood elevation is 102.7 feet (MSL).
We understand that the preliminary unfactored loads at each abutment are approximately 57 kips (35 kips dead and 22 kips live). The base of the pile cap will be at an approximate elevation of 105 to 106 feet at the west end of the bridge and 102 to 103 feet on the east end of the bridge.
3.0 GEOLOGY
3.1 Regional Geology
The project site and much of Tryon Creek State Park are underlain by the Basalt of Waverly Heights and associated sedimentary rocks, according to mapping by Beeson and others (1989). The Eocene Basalt of Waverly Heights and associated sedimentary rocks are about 43 to 50 million years old and are thought to represent an oceanic island complex that accreted onto the
24-1-03734-002_Geotech Report 24-1-03734-002 2

western edge of the North American crustal plate during subduction of adjacent oceanic crust. The sedimentary portion of the unit is generally not well exposed, but borehole data suggests that it, rather than basalt, underlies much of the Tryon Creek area. Thickness of the overall unit is not known, but it is assumed to extend to considerable depth. The Statewide Landslide Information Database for Oregon, release 2 (SLIDO-2) shows numerous landslides in the Tryon Creek watershed, and many of these are likely associated with sedimentary layers and deeply weathered basalts in the Basalt of Waverly Heights unit.
During the late stages of the last great ice age, between about 18,000 and 15,000 years ago, repeated catastrophic floods, caused by the rupture of glacial ice dams in western Montana, deposited a tremendous load of sediment in the Portland area (Allen and others, 2009). The floods are known as the Missoula Floods, and locally pooled to elevations of about 400 feet. In the vicinity of the project site, micaceous sand and silt associated with the Missoula Floods blanketed portions of the Basalt of Waverly Heights unit. Tryon Creek and its tributaries have since locally deposited varying thicknesses of alluvium derived from the Basalt of Waverly Heights, reworked Missoula Flood deposits, and other local geologic units.
3.2 Regional Geology
Oregon’s position at the western margin of the North American Plate, relative to the Pacific and Juan de Fuca plates, has had a major impact on the geologic development of the state. Earthquakes in the western part of Oregon occur as a result of the collision of these plates and related volcanic activity. These plates meet along a mega thrust fault called the Cascadia Subduction Zone (CSZ). The CSZ runs approximately parallel to the coastline from northernmost California to southern British Columbia. The compression forces that exist between these colliding plates cause the oceanic plate to descend, or subduct, beneath the continental plate at a rate of about 1.5 inches per year. This process leads to contortion and faulting of both crustal plates throughout much of the western regions of Washington, Oregon, northern California, and southern British Columbia. Stress built up between the colliding plates is periodically relieved through great earthquakes at the plate interface (CSZ).
Within the present understanding of the regional tectonic framework and historical seismicity, three broad earthquake sources have been identified. These three types of earthquakes and their maximum plausible earthquakes, as determined by Wells and others (2000), are as follows.
Subduction Zone Interface Earthquakes originate along the CSZ, which is located 25miles beneath the coastline. Paleoseismic evidence and historic tsunami studies indicate
24-1-03734-002_Geotech Report 24-1-03734-002 3

that the most recent subduction zone thrust fault event occurred in the year 1700, probably ruptured the full length of the CSZ, and may have reached a Magnitude 9.
Deep-focus, Intraplate Earthquakes originate from within the subducting Juan de Fucaoceanic plate as a result of the downward bending and contortion of the plate. Theseearthquakes typically occur 28 to 38 miles beneath the surface. Such events could be aslarge as Moment Magnitude 7.5. Examples of this type of earthquake include the 1949Magnitude 7.1 Olympia earthquake, the 1965 Magnitude 6.5 earthquake between Tacomaand Seattle, and the 2001 Nisqually (slightly north of Olympia) earthquake at Magnitude6.8. Intraslab events have occurred frequently in Puget Sound but historically are rare inOregon.
Shallow-focus Crustal Earthquake are typically located within the upper 12 miles ofthe continental crust and could be generated by contortion of the overriding NorthAmerican plate beneath the project area. The largest known crustal earthquake in thePacific Northwest is the 1872 North Cascades quake at Magnitude 7.4. Other examplesinclude the 1993 Magnitude 5.6 Scotts Mill earthquake and Magnitude 6 Klamath Fallsearthquake.
The U.S. Geological Survey’s Earthquake Hazards Program, Quaternary Fault and Fold Database (Personius, 2002; McCrory, 2003) lists three Quaternary age faults northeast and northwest of the site, as shown in Table 1. The nearest Quaternary age fault is the Oatfield Fault located 0.4 miles northeast of the site.
TABLE 1: QUATERNARY FAULTS WITHIN A 15-MILE RADIUS OF PROJECT SITE
Fault Name Distance and Direction from Site
Most Recent Deformation Slip rate
Oatfield Fault 0.4 miles northeast <1,600,000 years <0.2 mm/year
Portland Hills Fault 2.5 miles northeast <1,600,000 years <0.2 mm/year
Helvetia Fault 14 miles northwest <1,600,000 years <0.2 mm/year
4.0 FIELD EXPLORATIONS AND LABORATORY TESTING
4.1 Field Explorations
Shannon & Wilson explored the subsurface conditions at the site with two geotechnical borings, designated B-1 and B-2. The borings were drilled between March 24 and March 25, 2014, by PLi Systems of Hillsboro, Oregon. A Shannon & Wilson geologist located the borings, collected soil samples, and logged the materials encountered during drilling. Approximate exploration locations are shown on the Site and Exploration Plan, Figure 2. Details of the exploration
24-1-03734-002_Geotech Report 24-1-03734-002 4

program, including boring logs and descriptions of the techniques used to advance and sample the borings, are presented in Appendix A.
4.2 Laboratory Test Results
Laboratory tests were performed on selected samples from the borings to determine basic index and engineering properties of the soils encountered. The laboratory testing program included moisture content analyses, Atterberg limits tests, and particle-size analyses. Laboratory testing was performed by Northwest Testing, Inc. (NTI), of Wilsonville, Oregon. All tests were performed in accordance with applicable ASTM International (ASTM) standard test procedures. Results of the laboratory tests and a brief description of the testing procedures are presented in Appendix B.
4.3 Previous Explorations
Under a previous scope of work, Shannon & Wilson performed a geologic hazard reconnaissance and drilled six hand auger borings at the site. Data and observations from this work were summarized in our Preliminary Geotechnical Evaluation Letter, dated November 2, 2012. For reference, logs of the hand auger borings are included in Appendix C of this report.
5.0 SUBSURFACE CONDITIONS
We grouped the materials encountered in our field explorations into four geotechnical units, as described below. Our interpretation of the subsurface conditions is based on the borings and regional geologic information from published sources. The geotechnical units are as follows:
Fill: very loose / soft Silt (ML) with some roots and concrete debris;
Fine-Grained Alluvium: very loose to medium dense / soft to medium stiff Silt toSandy Silt (ML), nonplastic to low plasticity, contains some wood debris;
Sand and Gravel Alluvium: loose to medium dense Silty Sand with Gravel (SM),contains some wood debris and logs;
Weathered Mudstone: stiff to hard Elastic Silt (MH) and Fat Clay (CH), some withsand and trace gravel, high plasticity, blocky.
These generalized geotechnical units have been defined by their geology, engineering properties, and distribution in the subsurface. Contacts between the units may be more gradational than shown in the boring logs in Appendix A, and variations in subsurface conditions may exist between the locations of the borings.
24-1-03734-002_Geotech Report 24-1-03734-002 5
5.1 Fill
Fill was encountered in boring B-1 from the ground surface to a depth of about 1 foot. There, it consisted of very loose / soft, gray-brown Silt (ML) with about 10 percent fine sand and some roots and concrete debris. The soil was moist and nonplastic to low plasticity. Additional Fill should be anticipated near the existing bridge abutments and buried sanitary sewer. Fill in those locations may include gravel and/or other variable material.
5.2 Fine-Grained Alluvium
Fine-Grained Alluvium was encountered in both borings. In boring B-1, a 6-foot-thick layer was encountered both below the Fill, and a 5-foot-thick layer was encountered between the Sand and Gravel Alluvium and Weathered Mudstone. In boring B-2, it was encountered from the ground surface to a depth of about 9 feet. In general, the Fine-Grained Alluvium consists of very loose to medium dense / soft to medium stiff, gray to yellow-brown Silt (ML) with varying amounts of fine sand. The soil is typically moist and nonplastic to low plasticity. However, the lower layer in boring B-1 was wet, nonplastic, and exhibited rapid dilatency. Few 2-inch-thick interbeds of Lean Clay (CL) were observed in the unit in boring B-2, along with a few wood fragments. Standard Penetration Test (SPT) N-values in the unit ranged from 2 to 11 blows per foot (bpf) and averaged 5 bpf. The results of two natural moisture content analyses were 33 and 29 percent. Atterberg limits tests found one specimen to be nonplastic and another to have a plasticity index of 5 percent.
5.3 Sand and Gravel Alluvium
Sand and Gravel Alluvium was encountered in both borings, below or within the Fine-Grained Alluvium. The encountered thickness of the unit in both borings was approximately 3 feet. In general, the Sand and Gravel Alluvium consists of loose to medium dense, gray to dark gray Silty Sand with Gravel (SM). The gravel is generally wet, subrounded, and fine to coarse. The sand is typically fine to coarse, and the fines have low plasticity. In boring B-2, wood was encountered from a depth of about 9 to 12 feet. In sample B-2, S-5, the wood appeared to be continuous, as though it was part of a solid log. Excluding the SPT taken in the wood, two SPT N-values in the unit were 5 and 17 bpf. The results of two natural moisture content analyses were 30 and 40 percent. Sieve analyses of two specimens indicated fines contents of 14 and 22 percent by dry weight.
24-1-03734-002_Geotech Report 24-1-03734-002 6

5.4 Weathered Mudstone
The Weathered Mudstone is interpreted to represent weathered marine sedimentary rock associated with the Basalt of Waverly Heights unit, mapped by Beeson and others (1989). It was encountered at a depth of about 15 feet in both borings, and both borings were terminated in the unit. The maximum penetration into the unit was about 18.5 feet, made in boring B-1. In general, the unit consists of stiff to hard, light gray, red, and yellow-brown to brown Elastic Silt (MH) and Fat Clay (CH), with trace to little fine to coarse sand and trace gravel. The material is often blocky, where the majority of it easily remolds to Elastic Silt or Fat Clay, but with few gravel and sand-sized fragments resisting further breakdown. Trace non-mudstone sand and gravel particles, usually more rounded, were also observed. SPT N-values in the unit ranged from 16 to 81 bpf and averaged 36 bpf. Natural moisture content analyses ranged from 27 to 48 percent, and averaged 39 percent. An Atterberg limits test on one specimen indicated a plasticity index of 29.
5.5 Groundwater
During drilling, static groundwater was encountered at depths of approximately 7 feet in boring B-1 (El 98 feet) and 10 feet in boring B-2 (El 100 feet). The groundwater depths were generally consistent with the water surface elevation of Tryon Creek at the time of the explorations. Based on information from Otak, we understand that the ordinary high water level is at EL 102 feet. Possible perched water was observed during drilling in boring B-2 at a depth of about 7 feet (El 103). Groundwater levels should be expected to fluctuate seasonally and with changes in precipitation, land use, and other factors. In general, we expect groundwater levels in this area to be at a seasonal high during the winter and late spring and at a seasonal low during the late summer and early fall.
6.0 SITE-SPECIFIC SEISMIC HAZARD EVALUATION
6.1 Seismic Acceleration and Soil Profile
The ODOT BDDM recommends that the peak ground acceleration (PGA) and other seismic ground motions be obtained from the 2002 U.S. Geological Survey (USGS) Seismic Hazard Maps for the Pacific Northwest Region. The Seismic Site Class was developed based on the recommended procedure, using SPT N-values, in the 2012 AASHTO BDS. The site is classified as Site Class E based on our calculation of the weighted average SPT N-value. The recommended lower- and upper-level ground motion parameters, 500-year and 1,000-year return periods respectively, are in Table 2.
24-1-03734-002_Geotech Report 24-1-03734-002 7

TABLE 2: RECOMMENDED SEISMIC DESIGN CRITERIA
Seismic Parameter Lower Level (500-year return period)
Upper Level (1,000-year return period)
Site Class E E Site Factor, Fpga 1.78 1.35 Peak Ground (Bedrock) Acceleration, PGA 0.19 g 0.27 g Site Factor, Fa 1.90 1.44 Peak Ground Surface Acceleration, As 0.34 0.36 Short Period Acceleration, Ss 0.44 g 0.63 g Site Factor, Fν 3.35 3.26 Long Period Acceleration, S1 0.15 g 0.22 g
Note: g = gravity acceleration
6.2 Site Seismic Hazards
The expected seismic hazards at the project site include ground shaking, liquefaction and liquefaction-induced settlement, lateral spreading, and global instability of the eastern abutment. Based on our evaluation, other seismic hazards such as fault rupture, tsunami, and seiche are unlikely in the immediate vicinity of the proposed structure.
6.2.1 Liquefaction Potential Analysis
Liquefaction of loose, saturated, cohesionless soils due to seismic loading has been studied over the past 35 years, resulting in methods based on both laboratory and field procedures to evaluate liquefaction potential. In this project, we used Youd et al. (2001) and Boulanger and Idriss (2006) methods to evaluate liquefaction potential of the soils.
Soil behavior under seismic loading is the primary factor in determining the susceptibility of a soil to liquefaction. An important factor in evaluating soil behavior is the fines content (percent of soil by weight smaller than 0.075 millimeter), and the plasticity characteristics of the soil deposit. We performed grain size analyses and Atterberg limits analyses on soil samples from the field explorations to evaluate the index parameters of the soils at the site. Those parameters were considered as part of the liquefaction potential evaluation.
We performed a liquefaction analysis for cohesionless soils using an earthquake of magnitude 9.0 obtained from the probabilistic ground motion studies conducted by the USGS and Frankel, et al. (2002). The liquefaction potential analysis indicated that the loose to medium dense alluvial sand and nonplastic to low plasticity silt on the eastern and western abutments overlying the mudstone will likely experience liquefaction for both 500-year and 1,000-year
24-1-03734-002_Geotech Report 24-1-03734-002 8

events. Liquefaction is anticipated at elevations between 102 and 95 feet at the west abutment, and between elevations of 102 and 90 feet at the east abutment.
We performed liquefaction potential assessment for fine-grained soils using the Boulanger and Idriss (2006) method. Boulanger and Idriss (2006) provide recommendations that the fine-grained soils with plasticity index greater than 7 would not be liquefiable. Laboratory tests, including visual-manual identification and Atterberg limits, indicated that the plasticity index of the alluvial soils is typically 5 or less; therefore, in our opinion, these soils are liquefiable.
One of the potential consequences of liquefaction is ground settlement. The liquefaction-induced settlement on the west side of the bridge is estimated to be the range of 2 to 3 inches for both 500- and 1,000-year events. The liquefaction-induced settlement on the east side of the bridge is estimated to be the range of 3 to 4 inches for both 500- and 1,000-year events. Consequently, deformation of the bridge approach embankments may occur, and downdrag loads may be induced on foundations as a result of this magnitude of settlement.
6.2.2 Lateral Spreading and Post-Liquefaction Slope Stability
Lateral spreading and post-liquefaction slope stability were evaluated for both bridge abutments. A detailed discussion of our global stability analyses is presented in Section 7. Our slope stability analysis indicates that the factor of safety at the east and west abutments is greater than 1.1 and the slope will not fail during the design seismic event. Some sloughing and shallow failures may occur along the stream bank during the design seismic event; however, our analysis indicates that the slope failure will not extend to the proposed abutment locations.
7.0 DESIGN CONCLUSIONS AND RECOMMENDATIONS
7.1 Bridge Foundation Alternatives
Based on the presence of soft, compressible, and potentially liquefiable soils and the potential for stream bank erosion, we anticipate that the bridge will be supported on intermediate foundations such as pin piles advanced into the very stiff silt (mudstone). The type of intermediate foundations used will be a function of the design requirements, as well as site access constraints. Equipment used to install the foundation system will need to be mobilized to the site from the trailhead while minimizing the disturbance to vegetated areas off the trail. Because of site access constraints, our recommendations focus on systems that can be installed and mobilized to the site on track-mounted equipment with a track width of 4 feet or less. Specifically, we have provided recommendations for 4-inch-diameter driven pin piles, and 8-inch-diameter drilled-in piles.
24-1-03734-002_Geotech Report 24-1-03734-002 9

Piles should be installed no closer together than three pile diameters, measured from center-to-center, and within 6 inches of locations shown on the plans. No pile should be closer than 4 inches to any edge of the pile cap. Piles should be installed with a maximum deviation from vertical of not more than 4 inches in 10 feet. In addition, as a project-specific provision, we recommend that the steel piles be installed full-length without splicing.
7.1.1 Driven Pin Piles
Pin piles with diameters of up to 4 inches can be driven at the site using hand-held pneumatic hammers. Design axial capacities of up to 10 kips can be achieved using 4-inch diameter pin piles driven to the stiff to hard silt and clay (weathered Mudstone). The design axial capacity includes a factor of safety of 3. The pin piles should be installed to a minimum tip elevation that corresponds to the top of the mudstone. The anticipated top of mudstone elevation is at approximately El 95 feet at the West Abutment and approximately El 90 feet at the East Abutment. If refusal (e.g., on wood debris) is encountered above the weathered mudstone, predrilling will be required.
To achieve the required design capacity of 10 kips, the piles should be installed to practical refusal in the mudstone formation. For the purposes of confirming the 10 kip pile capacity, refusal should be defined as ¾” or less of penetration during 1 minute of sustained driving with a 300 pound pneumatic Collins hammer or equivalent. Based on estimated tip penetrations 5 feet into the weathered rock and pile cap elevations of 105 and 103 feet, the pile lengths will be approximately 15 and 18 feet at the western and eastern abutments, respectively (not including pile embedment into the pile cap).
7.1.2 Drilled-In Pin Piles
Drilled-in pin piles are constructed by making a cylindrical bore to the prescribed bearing stratum with an auger drilling technique. A pin pile is placed in the borehole and concrete is placed, using tremie methods, to complete the drilled-in pin pile. Boreholes up to 8 inches in diameter can be advance using drilling equipment mounted on 4-foot-wide, rubber-tracked machines, such as a Baretta T46 drill rig. Pin piles with nominal diameters of up to 6 inches can be placed in an 8-inch hole.
We recommend the drilled-in piles be socketed into the weathered mudstone formation at least 5 feet in order to develop the required resistance and account for potential variability in material quality and strength. We recommend that the pile tips should be at, or lower than, an elevation of 90 feet for the western abutment and 85 feet for the eastern abutment in order to
24-1-03734-002_Geotech Report 24-1-03734-002 10

achieve design loads of 15 kips per pile. Based on these tip elevations, and pile cap elevations of 105 and 103 feet, the pile lengths will be approximately 15 and 18 feet at the western and eastern abutments, respectively (not including pile embedment into the pile cap).
7.1.3 Lateral Pile Load Capacity
The pile foundations will be subjected to lateral loads resulting from live loads, wind, and earthquake loading. We understand that the laterally loaded pile analyses will be performed with the aid of the “LPILE” computer program. Due to different subsurface conditions at each bent, separate soil models are required for each one. We developed four sets of LPile parameters: one for static and pseudo-static conditions at each abutment, and one for post-seismic (liquefied) conditions at the each abutment. The static/pseudo-static case input parameters are provided in Tables 3 and 4 for the east and west abutments, respectively. The post-seismic case input parameters for the east and west abutments are provided in Tables 5 and 6. Groundwater should be assumed at an elevation of 102 feet.
TABLE 3: LPILE PLUS 5.0 GEOTECHNICAL INPUT PARAMETERS, EAST ABUTMENT
Soil Layer Top of Layer El. (ft)
Top of Layer Depth
(in)
p-y Model
Soil Unit Weight
(pci)
Friction Angle (deg)
Undrained Shear
Strength (psi) E50
p-y Modulus,
k (pci) Fill and Alluvium
(above GWT) 106 0 Soft clay 0.064 -- 2.8 0.019 40
Alluvium (below GWT) 102 48 Soft clay 0.028 -- 2.8 0.019 40
Alluvium (below GWT) 98 96 Reese
Sand 0.028 32 -- -- 50
Alluvium (below GWT) 95 132 Reese
Sand 0.028 26 -- -- 25
Weathered Mudstone 90 192 Stiff Clay
w/o water 0.036 -- 16.0 0.006 100
24-1-03734-002_Geotech Report 24-1-03734-002 11
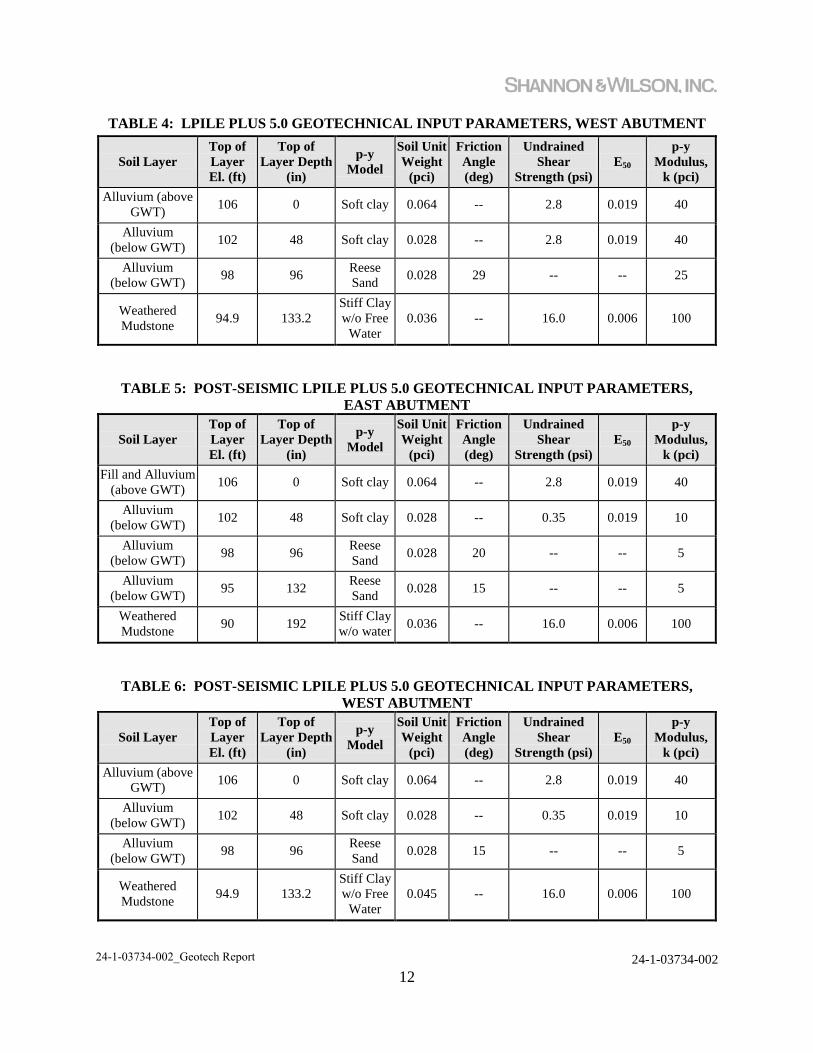
TABLE 4: LPILE PLUS 5.0 GEOTECHNICAL INPUT PARAMETERS, WEST ABUTMENT
Soil Layer Top of Layer El. (ft)
Top of Layer Depth
(in)
p-y Model
Soil Unit Weight
(pci)
Friction Angle (deg)
Undrained Shear
Strength (psi) E50
p-y Modulus,
k (pci) Alluvium (above
GWT) 106 0 Soft clay 0.064 -- 2.8 0.019 40
Alluvium (below GWT) 102 48 Soft clay 0.028 -- 2.8 0.019 40
Alluvium (below GWT) 98 96 Reese
Sand 0.028 29 -- -- 25
Weathered Mudstone 94.9 133.2
Stiff Clay w/o Free
Water 0.036 -- 16.0 0.006 100
TABLE 5: POST-SEISMIC LPILE PLUS 5.0 GEOTECHNICAL INPUT PARAMETERS, EAST ABUTMENT
Soil Layer Top of Layer El. (ft)
Top of Layer Depth
(in)
p-y Model
Soil Unit Weight
(pci)
Friction Angle (deg)
Undrained Shear
Strength (psi) E50
p-y Modulus,
k (pci) Fill and Alluvium
(above GWT) 106 0 Soft clay 0.064 -- 2.8 0.019 40
Alluvium (below GWT) 102 48 Soft clay 0.028 -- 0.35 0.019 10
Alluvium (below GWT) 98 96 Reese
Sand 0.028 20 -- -- 5
Alluvium (below GWT) 95 132 Reese
Sand 0.028 15 -- -- 5
Weathered Mudstone 90 192 Stiff Clay
w/o water 0.036 -- 16.0 0.006 100
TABLE 6: POST-SEISMIC LPILE PLUS 5.0 GEOTECHNICAL INPUT PARAMETERS, WEST ABUTMENT
Soil Layer Top of Layer El. (ft)
Top of Layer Depth
(in)
p-y Model
Soil Unit Weight
(pci)
Friction Angle (deg)
Undrained Shear
Strength (psi) E50
p-y Modulus,
k (pci) Alluvium (above
GWT) 106 0 Soft clay 0.064 -- 2.8 0.019 40
Alluvium (below GWT) 102 48 Soft clay 0.028 -- 0.35 0.019 10
Alluvium (below GWT) 98 96 Reese
Sand 0.028 15 -- -- 5
Weathered Mudstone 94.9 133.2
Stiff Clay w/o Free
Water 0.045 -- 16.0 0.006 100
24-1-03734-002_Geotech Report 24-1-03734-002 12

If the pile horizontal spacing is less than five times the pile diameter, a pile group reduction factor should be applied, based on the ODOT BDDM.
7.2 Bridge Abutment Wall Design Recommendations
7.2.1 General
We understand that the abutments will be up to approximately 5 feet in height, and that the east and west bent may have integral abutments. The lateral earth pressures on the abutment and wing walls depend on the type of wall (i.e., yielding or non-yielding), the type and method of placement of backfill against the wall, the drainage behind the wall, and the magnitude of surcharge weight on the ground surface adjacent to the wall, the slope of the backfill, and the design criteria. Integral abutment walls are typically designed as non-yielding walls under both static and seismic loading conditions. For design purposes, we assumed that the backfill behind the walls is flat within approximately 5 feet of the wall. Also, we have assumed that subdrainage systems will be installed to prevent hydrostatic pressure from developing behind the abutment walls.
7.2.2 Lateral Earth Pressures
Based upon the structural design information and the above assumptions, the lateral earth pressures on the walls were developed according to the ODOT Geotechnical Design Manual and AASHTO LRFD Bridge Design Manual. The static lateral earth pressure acting on walls consists of two components: static earth pressure and static surcharge pressure. The seismic lateral earth pressure on walls consists of three components: static earth pressure, static surcharge pressure, and seismic earth pressure. A horizontal acceleration coefficient, kh, equal to the site peak ground acceleration (Fpga x PGA), As, was used to determine the seismic earth pressure for non-yielding walls. A kh equal to ½ of As was used to determine the seismic earth pressure for yielding walls. These lateral pressures are shown in Figure 3.
7.2.3 Subdrainage
Suitable drainage for excavated walls can be provided by granular backfill material and a wall base subdrain system consisting of a 6-inch-diameter perforated or slotted drain pipe wrapped in an envelope of filter material at least 12 inches thick and confined by a separation geotextile. The filter material is specified in Section 02610.10(a) of the OSSC. The subdrain should be above the ordinary high groundwater level, convey any collected seepage to the end of the wall, and daylight at low spots below the exposed wall elevation.
24-1-03734-002_Geotech Report 24-1-03734-002 13

7.2.4 Wall Backfill Material and Compaction
The wall backfill material should use the standard ODOT granular wall backfill (OSSC, Section 00510.12). Heavy compaction equipment should not be allowed closer than 3 feet to the abutment or wing walls to prevent high lateral earth pressures and wall yielding and/or damage. Backfill compaction within 3 feet of the wall should be accomplished with a low-weight compactor such as a hand-operated vibratory plate compactor.
7.3 Slope Stability Analyses
We evaluated the slope stability of the proposed abutments as part of our analysis. Slope stability is influenced by various factors including: (1) the geometry of the soil mass and subsurface materials; (2) the weight of soil materials overlying the failure surface; (3) the shear strength of soils and/or rock along the failure surface; and (4) the hydrostatic pressure (groundwater levels) present within the landslide mass and along the failure surface.
The stability of a slope is expressed in terms of factor of safety, FS, which is defined as the ratio of resisting forces to driving forces. At equilibrium, the FS is equal to 1.0, and the driving forces are balanced by the resisting forces. Failure occurs when the driving forces exceed the resisting forces, i.e., FS less than 1.0. An increase in the factor of safety above 1.0, whether by increasing the resisting forces or decreasing the driving forces, reflects a corresponding increase in the stability of the mass. The actual factor of safety may differ from the calculated factor of safety due to variations in soil strengths, subsurface geometry, failure surface location and orientation, groundwater levels, and other factors that are not completely known or understood.
In this regard, we have used information developed from the field explorations, laboratory testing, and our experience with similar materials to develop the slope stability analysis model. Our engineering analyses and conclusions are based upon the assumption that subsurface conditions everywhere within the potential slide mass are not significantly different from those encountered by the field explorations.
The stability analysis was performed using the Morgenstern and Price method with the aid of the computer program SLOPE/W (GEO-SLOPE, Alberta, Canada). The analyses included calculations of factors of safety for various assumed conditions at each abutment. In our analysis, we assumed that soil was removed to the pile cap elevation. Based on information from Otak, we assumed the base of the pile cap elevation was at El 105 feet at west abutment and El 102 feet at the east abutment. The FS for the proposed western embankment slope during static conditions is 1.5. The western abutment has an FS of 1.1 during seismic conditions and
24-1-03734-002_Geotech Report 24-1-03734-002 14
1.2 during the post-seismic condition. The FS for the proposed eastern embankment slope during static conditions is 2.6. The eastern abutment has an FS of 1.2 during seismic conditions and 2.3 during the post-seismic condition. The ODOT GDM recommends that slopes at bridge abutments have a minimum factor of safety of 1.5 during static conditions and a minimum factor of safety of 1.1 during seismic and post-seismic conditions. Therefore, all of the evaluations indicate that the proposed geometry meets the criteria in the ODOT GDM.
8.0 GEOTECHNICAL CONSTRUCTION CONSIDERATIONS
8.1 General
The key construction considerations directly affecting the proposed bridge design conclusions and recommendations were discussed in Section 9.0 of this report. The construction considerations discussed herein are primarily related to site earthwork.
8.2 Site Preparation/Earthwork
8.2.1 Site Preparation and Excavation
Site preparation will include: (1) clearing, and grubbing (2) removal of existing structures and underground utilities, and (3) subgrade preparation and excavation. These construction activities should generally be accomplished in accordance with OSSC Section 00300.
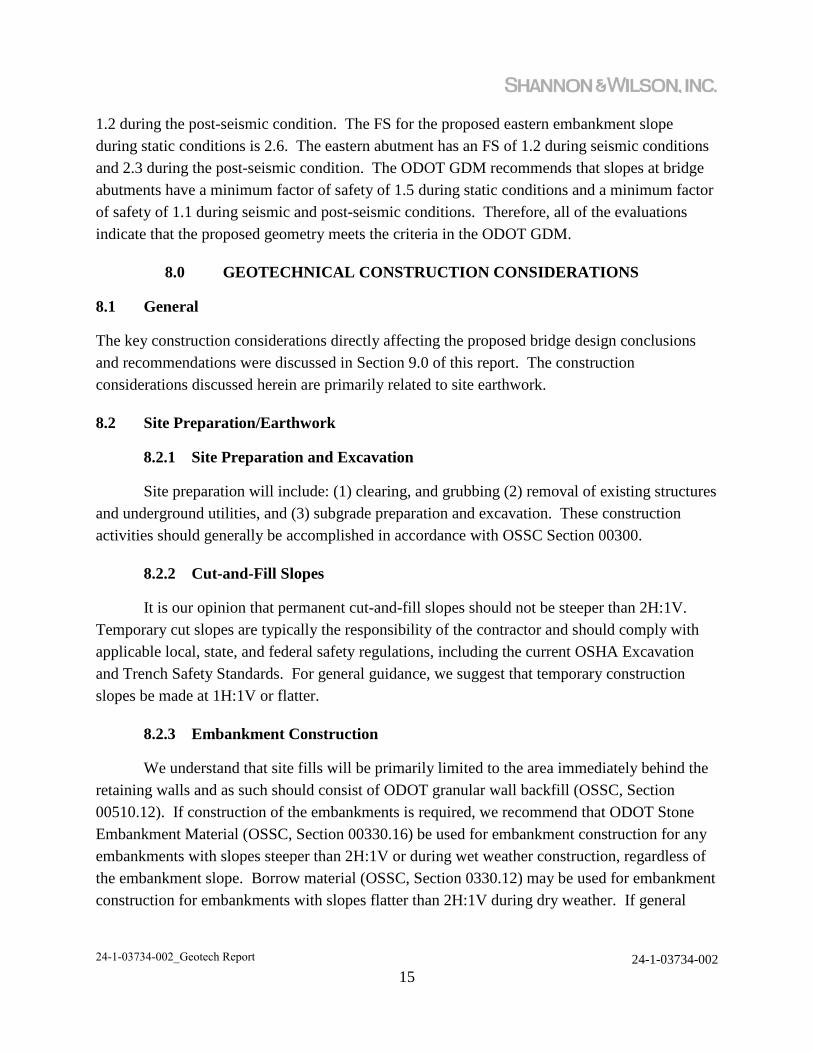
8.2.2 Cut-and-Fill Slopes
It is our opinion that permanent cut-and-fill slopes should not be steeper than 2H:1V. Temporary cut slopes are typically the responsibility of the contractor and should comply with applicable local, state, and federal safety regulations, including the current OSHA Excavation and Trench Safety Standards. For general guidance, we suggest that temporary construction slopes be made at 1H:1V or flatter.
8.2.3 Embankment Construction
We understand that site fills will be primarily limited to the area immediately behind the retaining walls and as such should consist of ODOT granular wall backfill (OSSC, Section 00510.12). If construction of the embankments is required, we recommend that ODOT Stone Embankment Material (OSSC, Section 00330.16) be used for embankment construction for any embankments with slopes steeper than 2H:1V or during wet weather construction, regardless of the embankment slope. Borrow material (OSSC, Section 0330.12) may be used for embankment construction for embankments with slopes flatter than 2H:1V during dry weather. If general
24-1-03734-002_Geotech Report 24-1-03734-002 15
borrow material is used to construct the embankments, significant moisture conditioning of the material may be required that can typically only be performed during the dry summer months.
Careful observation and quality control during construction is required to reduce the potential for settlements if an embankment is constructed with borrow material. Important aspects of embankment construction include: maintaining proper lift thicknesses, controlling soil moisture within the optimum range, and providing the appropriate type and method of compactive effort. Our experience suggests that inappropriate compaction and fill placement of cohesive borrow material often results in additional settlement after the first one or two wet seasons. Placement of the fill material and compaction should follow the OSSC requirements.
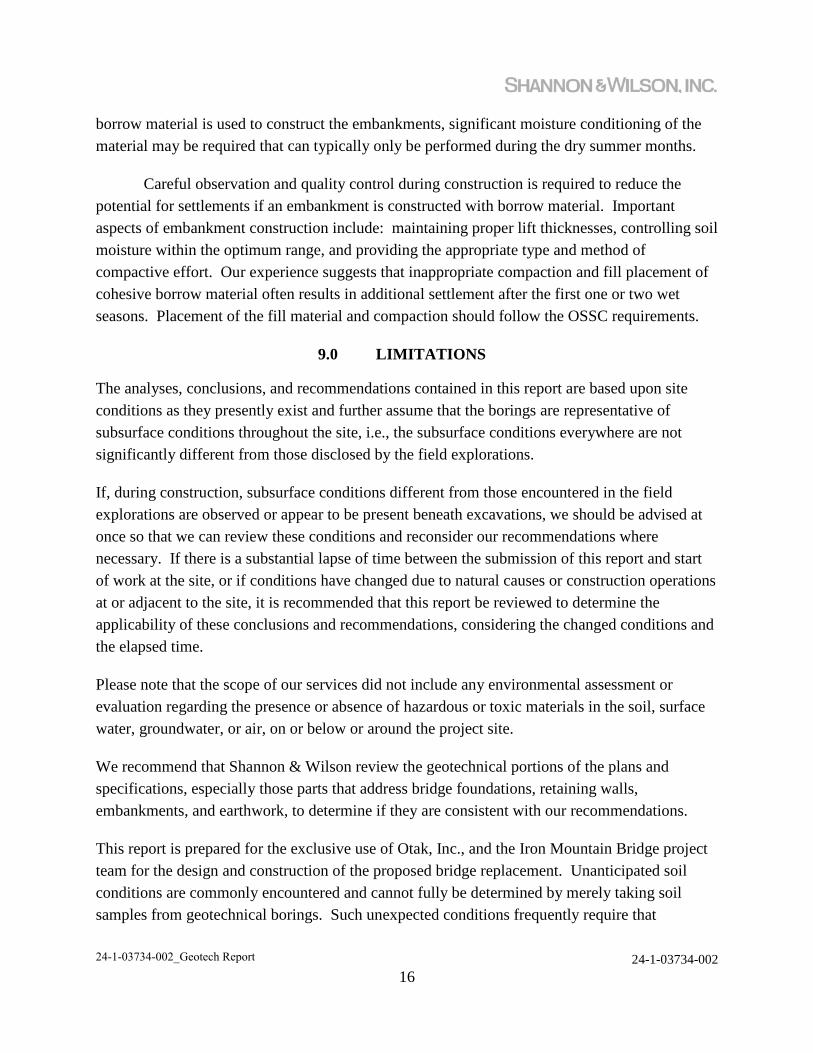
9.0 LIMITATIONS
The analyses, conclusions, and recommendations contained in this report are based upon site conditions as they presently exist and further assume that the borings are representative of subsurface conditions throughout the site, i.e., the subsurface conditions everywhere are not significantly different from those disclosed by the field explorations.
If, during construction, subsurface conditions different from those encountered in the field explorations are observed or appear to be present beneath excavations, we should be advised at once so that we can review these conditions and reconsider our recommendations where necessary. If there is a substantial lapse of time between the submission of this report and start of work at the site, or if conditions have changed due to natural causes or construction operations at or adjacent to the site, it is recommended that this report be reviewed to determine the applicability of these conclusions and recommendations, considering the changed conditions and the elapsed time.
Please note that the scope of our services did not include any environmental assessment or evaluation regarding the presence or absence of hazardous or toxic materials in the soil, surface water, groundwater, or air, on or below or around the project site.
We recommend that Shannon & Wilson review the geotechnical portions of the plans and specifications, especially those parts that address bridge foundations, retaining walls, embankments, and earthwork, to determine if they are consistent with our recommendations.
This report is prepared for the exclusive use of Otak, Inc., and the Iron Mountain Bridge project team for the design and construction of the proposed bridge replacement. Unanticipated soil conditions are commonly encountered and cannot fully be determined by merely taking soil samples from geotechnical borings. Such unexpected conditions frequently require that
24-1-03734-002_Geotech Report 24-1-03734-002 16

10.0 REFERENCES
American Association of State Highway and Transportation Officials (AASHTO), 2012, AASHTO LRFD Bridge Design Specifications: Customary U.S. Units (6th ed.): Washington, D.C., AASHTO, 2 v.
Bela, J.L., 1979, Geologic hazards of eastern Benton County, Oregon: Oregon Department of Geology and Mineral Industries Bulletin B-98, 122 p., 58 figs., 14 tables, 5 geology and geologic hazard maps [1:24,000].
Boulanger, R. W. and Idriss, I. M., 2006, Liquefaction susceptibility criteria for silts and clays: Journal of Geotechnical and Geoenvironmental Engineering, v. 132, no. 11, p. 1413-1426.
GEO-SLOPE International, 2012, GeoStudio 2012 SLOPE/W, version 8.12.3.7901: Calgary, Alberta.GEO-SLOPE International, GeoStudio 2012, version 8.11.7283 limit equilibrium slope stability software, 2012.
Idriss, I. M. and Boulanger, R. W., 2006, Semi-empirical procedures for evaluating liquefaction potential during earthquakes: Soil Dynamics and Earthquake Engineering, v. 26, no. 2-4, p. 115-130.
Idriss, I. M. and Boulanger, R. W., 2007, Residual shear strength of liquefied soils, in Modernization and optimization of existing dams and reservoirs, 27th Annual USSD Conference, Philadelphia, Penn., 2007, Proceedings: Denver, Colo., U. S. Society on Dams, p. 621-634.
LPILE plus version 5.0.12, 2004, Ensoft Inc., Austin, Texas.
Olson, S. M. and Stark, T. D., 2002, Liquefied strength ratio from liquefaction flow failure case histories: Canadian Geotechnical Journal, v. 39, no. 3, p. 629-647.
Olson, S. M. and Stark, T. D., 2003, Yield strength ratio and liquefaction analysis of slopes and embankments: Journal of Geotechnical and Geoenvironmental Engineering, v. 129, no. 8, p. 727-737.
Oregon Department of Transportation, 1987, Soil and Rock Classification Manual, Salem, Oreg.
Oregon Department of Transportation, 2004 (updated 2013) Bridge Design and Drafting Manual, Salem, Oreg., 2 v., available: http://www.oregon.gov/ODOT/HWY/BRIDGE/Pages/standards_manuals.aspx.
Oregon Department of Transportation, 2008, Oregon Standard Specifications for Construction, Salem, Oreg., 2.v., available: http://www.oregon.gov/ODOT/HWY/SPECS/Pages/standard_specifications.aspx.
24-1-03734-002 Geotech Report 24-1-03734-002 18

Oregon Department of Transportation, September 2013, Geotechnical Design Manual: Salem, Oreg., 3 v., available: http://www.oregon.gov/ODOT/HWY/GEOENVIRONMENTAL/geotechnical_design_manual.shtml.
Personius, S.F., compiler, 2002, Quaternary fault and fold database of the United States: U.S. Geological Survey website, http://earthquakes.usgs.gov/regional/qfaults, accessed
Seed, R. B.; Cetin, K. O.; Moss, R. E. S.; and others, 2003, Recent advances in soil liquefaction engineering: a unified and consistent framework, in 26th Annual ASCE Los Angeles Geotechnical Spring Seminar, April 30, 2003, Long Beach, Calif., Proceedings: Long Beach, Calif., American Society of Civil Engineers, 71 p.
Seed, R. B. and Harder, L. F., 1990, SPT-based analysis of cyclic pore pressure generation and undrained residual strength, in Duncan, J. M., ed., H. Bolton Seed, memorial symposium proceedings, May 1990: Vancouver, Canada, BiTech Publishers, Inc., v. 2, p. 351-376.
Youd, T. L.; Idriss, I. M.; Andrus, R. D.; and others, 2001, Liquefaction resistance of soils: summary report from the 1996 NCEER and 1998 NCEER/NSF workshops on evaluation of liquefaction resistance of soils: Journal of Geotechnical and Geoenvironmental Engineering, v. 127, no. 10, p. 817-833.
24-1-03734-002 Geotech Report 24-1-03734-002 19

Project Area
Copyright:© 2013 National Geographic Society, i-cubed
Iron Mountain Sewer and Pedestrian BridgeLake Oswego, Oregon
VICINITY MAP
FIG. 1May 2014 24-1-03734-002
µ
Project Area
§̈¦5
§̈¦84
Path:
T:\Pr
ojects
\24-1\
3734
_Iron
Mou
ntain
Sewe
r\AVm
xd\Vi
cinity.
mxd
5/7/20
14 m
as
0 3,000 6,0001,500
Feet
Note:Basemap from ArcGIS online server.

HA-1
HA-6
HA-2
HA-3
HA-5
HA-4
B-2
B-1
24-1-03734-002
SITE AND EXPLORATION PLAN
FIG. 2
Iron Mountain Sewer and Pedestrian Bridge
Lake Oswego, Oregon
May 2014
010 20
Scale in Feet
SHANNON & WILSON, INC.
File: I:\W
IP
\P
rojects\24-1 P
ortland\3700\3734 Iron M
ountain S
anitary S
ew
er and P
edestrian B
ridge\G
raphics\C
AD
\24-1-03734-S
iteP
lan.dw
g D
ate: 05-07-2014 A
uthor: m
as
Approximate Location and Designation
of Boring (2014)
Approximate Location and Designation
of Hand Auger Boring (2012)
Stream Centerline
Stream Edge
Sanitary Sewer Line
Sanitary Sewer Manhole
Bridge Pile
EXPLANATION
HA-1
Reference: Base drawing provided by Otak, Inc., titled,
"S16388X190_for MB&G.dwg," dated April 8, 2014.
B-1

LATERAL EARTH PRESSURE
DISTRIBUTION ON WALLS
FIG. 3
SHANNON & WILSON, INC.
File: I:\W
IP
\P
rojects\24-1 P
ortland\3700\3734 Iron M
ountain S
anitary S
ew
er and P
edestrian B
ridge\G
raphics\C
AD
\24-1-03734-001 Lateral E
arth P
ressures.dw
g D
ate: 05-07-2014 A
uthor: m
as
24-1-03734-002May 2014
SOIL BACKFILL
COMPONENT
H
Drained granular
backfill material
37H
YIELDING WALL SOIL COMPONENT
RESULTANT FORCE (P )
P
= [PRESSURE VALUE] x
H
2
1
3
H
R
R
YIELDING WALL SURCHARGE COMPONENT
0.28q
RESULTANT FORCE (P )
P
= [PRESSURE VALUE] x
H
2
1
2
H
R
R
TOTAL LATERAL EQUIVALENT FLUID PRESSURES
SURCHARGE, q
SURCHARGE
COMPONENT
+
NOTES:
1. Backfill unit weight of 130 pcf.
2. Backfill friction angle is 34 deg.
3. Wall backfill is assumed to be drained imported granular material.
4. Seismic pressures provided for peak ground acceleration associated
with the 500-year and the 1,000-year earthquakes (see table for
values).
5. Typical traffic surcharge of 250 psf should be applied.
SEISMIC BACKFILL COMPONENT
RESULTANT FORCE (P )
P
= [PRESSURE VALUE] x
H
2
EQrH
0.6H
R
SEISMIC BACKFILL
COMPONENT
+
57H
NON-YIELDING WALL SOIL COMPONENT
RESULTANT FORCE (P )
P
= [PRESSURE VALUE] x
H
2
1
3
H
R
R
NON-YIELDING WALL SURCHARGE COMPONENT
0.44q
RESULTANT FORCE (P )
P
= [PRESSURE VALUE] x
H
2
1
2
H
R
R
AT-REST SEISMIC BACKFILL COMPONENT
RESULTANT FORCE (P )
P
= [PRESSURE VALUE] x
H
2
0.6H
R
EQrH
Iron Mountain Sewer and Pedestrian Bridge
Lake Oswego, Oregon

24-1-03734-002
APPENDIX A
FIELD EXPLORATIONS

24-1-03734-002 A-i
TABLE OF CONTENTS
A.1 GENERAL ...................................................................................................................... A-1 A.1.1 Drilling ............................................................................................................. A-1 A.1.1 Disturbed Sampling .......................................................................................... A-1 A.1.2 Undisturbed Sampling ...................................................................................... A-2 A.1.3 Borehole Abandonment .................................................................................... A-2 A.1.4 Material Descriptions ....................................................................................... A-2 A.1.5 Logs of Borings ................................................................................................ A-3
FIGURES A1 Soil Description and Log Key A2 Log of Boring B-1 A3 Log of Boring B-2

24-1-03734-002 A-1
APPENDIX A
FIELD EXPLORATIONS A.1 GENERAL
Shannon & Wilson, Inc., explored subsurface conditions at the project site with two geotechnical borings. The borings were designated B-1 and B-2 and were drilled to depths of 33.5 and 23.5 feet below the ground surface, respectively. The locations of the completed borings were measured in the field relative to the existing bridge. Approximate locations are shown on the Site and Exploration Plan, Figure 2. This appendix describes the techniques used to advance and sample the borings and presents logs of the materials encountered during drilling.
A.1.1 Drilling
Borings B-1 and B-2 were drilled between March 24 and March 25, 2014. The borings were drilled using a “Big Beaver” cart-mounted rotary drill rig provided and operated by PLI Systems of Hillsboro, Oregon. Boring B-1 was drilled using solid-stem auger drilling techniques. Boring B-2 was started with hollow stem auger drilling techniques, and solid-stem auger techniques were used to complete the hole after wood was encountered at a depth of 9 feet. A Shannon & Wilson representative was present during drilling to locate the borings, observe the drilling, collect soil samples, and log the materials encountered.
A.1.1 Disturbed Sampling
Disturbed samples were collected in the borings, typically at 2- to 4-foot depth intervals, using a standard 2-inch outside diameter (O.D.) split spoon sampler in conjunction with Standard Penetration Testing. In a Standard Penetration Test (SPT), ASTM D1586, the sampler is driven 18 inches into the soil using a 140-pound hammer dropped 30 inches. The number of blows required to drive the sampler the last 12 inches is defined as the standard penetration resistance, or N-value. The SPT N-value provides a measure of in-situ relative density of cohesionless soils (silt, sand, and gravel), and the consistency of cohesive soils (silt and clay). All disturbed samples were visually identified and described in the field, sealed to retain moisture, and returned to our laboratory for additional examination and testing.
SPT N-values can be significantly affected by several factors, including the efficiency of the hammer used. A manual (cathead) hammer was used for all standard penetration tests in borings B-1 and B-2. Cathead hammers are generally assumed to have an energy efficiency of
24-1-03734-002 A-2
60 percent. All N-values presented in this report are in blows per foot, as counted in the field. No corrections of any kind have been applied.
An SPT was considered to have met refusal where more than 50 blows were required to drive the sampler 6 inches. If refusal was encountered in the first 6-inch interval (for example, 50 for 1.5”), the count is reported as 50/1st 1.5”. If refusal was encountered in the second 6-inch interval (for example, 48, 50 for 1.5”), the count is reported as 50/1.5”. If refusal was encountered in the last 6-inch interval (for example, 39, 48, 50 for 1.5”), the count is reported as 98/7.5”.
A.1.2 Undisturbed Sampling
Undisturbed samples were collected in 3-inch O.D. thin-wall Shelby tubes, which were pushed into the undisturbed soil at the bottoms of boreholes hydraulically. The soils exposed at the ends of the tubes were examined and described in the field. After examination, the ends of the tubes were sealed to preserve the natural moisture of the samples. The sealed tubes were stored in the upright position, and care was taken to avoid shock and vibration during their transport and storage in our laboratory.
A.1.3 Borehole Abandonment
After drilling, the boreholes were backfilled with bentonite chips in accordance with Oregon Water Resource Department regulations. No wells or other instruments were installed in the boreholes.
A.1.4 Material Descriptions
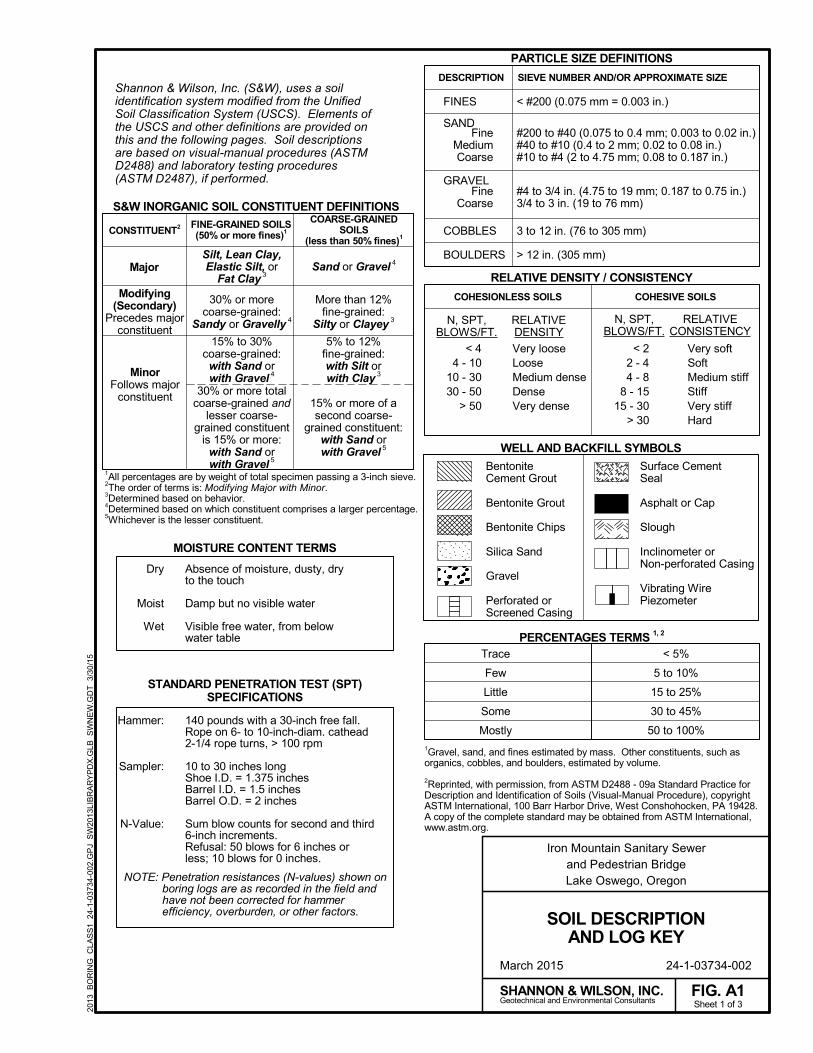
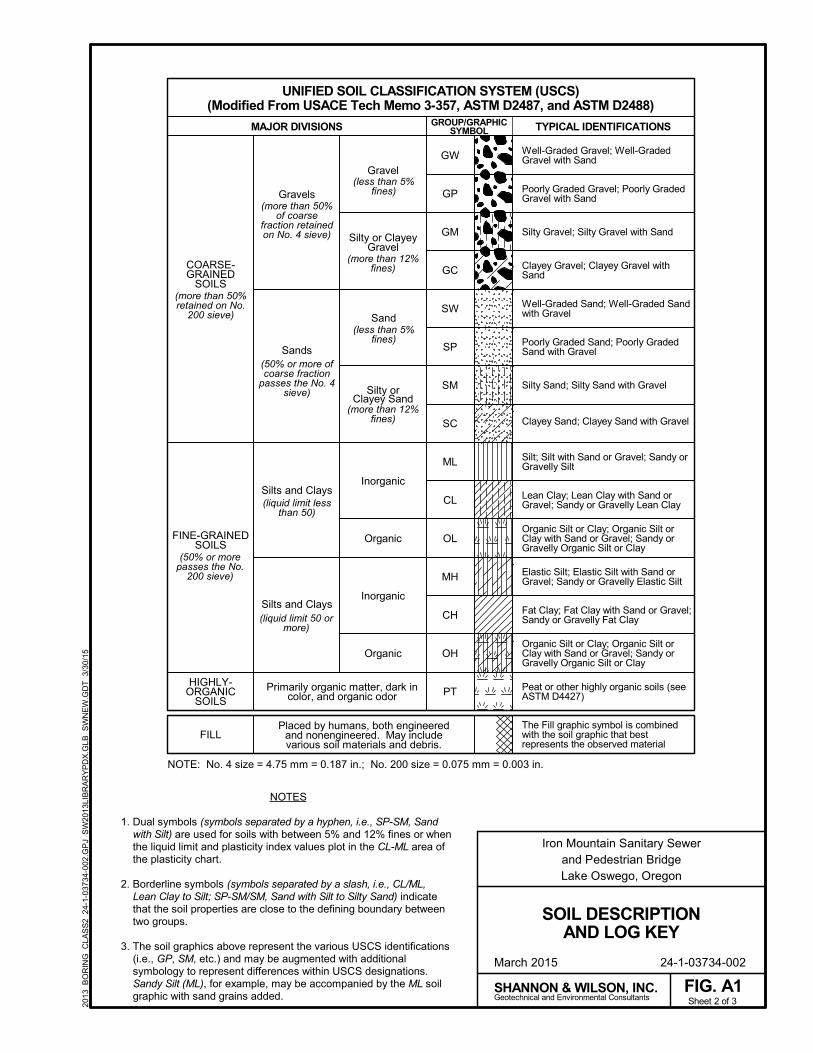
Soil samples were described and identified visually in the field in general accordance with ASTM D2488, Standard Practice for Description and Identification of Soils (Visual-Manual Procedure). The specific terminology used is defined in the Soil Description and Log Key, Figure A1. Consistency, color, relative moisture, degree of plasticity, peculiar odors, and other distinguishing characteristics of the samples were noted. Once transported to our laboratory, the samples were re-examined, various classification tests were performed, and the field descriptions and identifications were modified where necessary. We refined our visual-manual soil descriptions and identifications based on the results of the laboratory tests, using elements of the Standard Practice for Classification of Soils for Engineering Purposes (Unified Soil Classification System), ASTM D2487. However, ASTM D2487 was not followed in full because it requires that a suite of tests be performed to fully classify a single sample.

24-1-03734-002 A-3
A.1.5 Logs of Borings
Summary logs of borings are presented in Figures A2 and A3. Soil descriptions and interfaces on the logs are interpretive, and actual changes may be gradual. The left-hand portion of the boring logs gives our description, identification, and geotechnical unit designation for the soils encountered in the boring. The right-hand portion of the boring logs shows a graphic log, sample locations and designations, groundwater information, and a graphical representation of N-values, natural water contents, sample recovery, Atterberg limits, and fines content.
March 2015 24-1-03734-002
Iron Mountain Sanitary Sewerand Pedestrian BridgeLake Oswego, Oregon
SHANNON & WILSON, INC.Geotechnical and Environmental Consultants
Absence of moisture, dusty, dryto the touch
Damp but no visible water
Visible free water, from belowwater table
FIG. A1
Shannon & Wilson, Inc. (S&W), uses a soilidentification system modified from the UnifiedSoil Classification System (USCS). Elements ofthe USCS and other definitions are provided onthis and the following pages. Soil descriptionsare based on visual-manual procedures (ASTMD2488) and laboratory testing procedures(ASTM D2487), if performed.
STANDARD PENETRATION TEST (SPT)SPECIFICATIONS
Dry
Moist
Wet
MOISTURE CONTENT TERMS
Modifying(Secondary)
Precedes majorconstituent
Major
MinorFollows major
constituent
1All percentages are by weight of total specimen passing a 3-inch sieve.2The order of terms is: Modifying Major with Minor.3Determined based on behavior.4Determined based on which constituent comprises a larger percentage.5Whichever is the lesser constituent.
COARSE-GRAINEDSOILS
(less than 50% fines)1
PARTICLE SIZE DEFINITIONS
RELATIVE DENSITY / CONSISTENCYSand or Gravel 4
30% or morecoarse-grained:
Sandy or Gravelly 4
More than 12%fine-grained:
Silty or Clayey 3
15% to 30%coarse-grained:with Sand orwith Gravel 4
Hammer:
Sampler:
N-Value:
30% or more totalcoarse-grained and
lesser coarse-grained constituent
is 15% or more:with Sand orwith Gravel 5
Very softSoftMedium stiffStiffVery stiffHard
Very looseLooseMedium denseDenseVery dense
RELATIVEDENSITY
FINE-GRAINED SOILS(50% or more fines)1
COHESIVE SOILS
< 22 - 44 - 8
8 - 1515 - 30
> 30
RELATIVECONSISTENCY
N, SPT,BLOWS/FT.
5% to 12%fine-grained:with Silt orwith Clay 3
15% or more of asecond coarse-
grained constituent:with Sand orwith Gravel 5
Surface CementSeal
Asphalt or Cap
Slough
Inclinometer orNon-perforated Casing
Vibrating WirePiezometer
N, SPT,BLOWS/FT.
< 44 - 10
10 - 3030 - 50
> 50
DESCRIPTION
< #200 (0.075 mm = 0.003 in.)
NOTE: Penetration resistances (N-values) shown on boring logs are as recorded in the field and have not been corrected for hammer efficiency, overburden, or other factors.
#200 to #40 (0.075 to 0.4 mm; 0.003 to 0.02 in.)#40 to #10 (0.4 to 2 mm; 0.02 to 0.08 in.)#10 to #4 (2 to 4.75 mm; 0.08 to 0.187 in.)
SIEVE NUMBER AND/OR APPROXIMATE SIZE
#4 to 3/4 in. (4.75 to 19 mm; 0.187 to 0.75 in.)3/4 to 3 in. (19 to 76 mm)
3 to 12 in. (76 to 305 mm)
> 12 in. (305 mm)
1Gravel, sand, and fines estimated by mass. Other constituents, such asorganics, cobbles, and boulders, estimated by volume.
2Reprinted, with permission, from ASTM D2488 - 09a Standard Practice forDescription and Identification of Soils (Visual-Manual Procedure), copyrightASTM International, 100 Barr Harbor Drive, West Conshohocken, PA 19428.A copy of the complete standard may be obtained from ASTM International,www.astm.org.
FineCoarse
FineMediumCoarse
BOULDERS
COBBLES
GRAVEL
FINES
SAND
Sheet 1 of 3
S&W INORGANIC SOIL CONSTITUENT DEFINITIONS
CONSTITUENT2
SOIL DESCRIPTIONAND LOG KEY
COHESIONLESS SOILS
Silt, Lean Clay,Elastic Silt, or
Fat Clay 3
WELL AND BACKFILL SYMBOLS
140 pounds with a 30-inch free fall.Rope on 6- to 10-inch-diam. cathead2-1/4 rope turns, > 100 rpm
10 to 30 inches longShoe I.D. = 1.375 inchesBarrel I.D. = 1.5 inchesBarrel O.D. = 2 inches
Sum blow counts for second and third6-inch increments.Refusal: 50 blows for 6 inches orless; 10 blows for 0 inches.
BentoniteCement Grout
Bentonite Grout
Bentonite Chips
Silica Sand
Gravel
Perforated orScreened Casing
< 5%
5 to 10%
15 to 25%
30 to 45%
50 to 100%
Trace
Few
Little
Some
Mostly
PERCENTAGES TERMS 1, 2
2013
_BO
RIN
G_C
LAS
S1
24-
1-03
734-
002.
GP
J S
W20
13LI
BR
AR
YP
DX
.GLB
SW
NE
W.G
DT
3/3
0/1
5
Iron Mountain Sanitary Sewerand Pedestrian BridgeLake Oswego, Oregon
March 2015 24-1-03734-002
GC
SC
Inorganic
Organic
(more than 50%of coarse
fraction retainedon No. 4 sieve)
MAJOR DIVISIONS GROUP/GRAPHICSYMBOL
CH
OH
ML
CL
TYPICAL IDENTIFICATIONS
Gravel
Sand
Silty Sand; Silty Sand with Gravel
Clayey Sand; Clayey Sand with Gravel
Clayey Gravel; Clayey Gravel withSand
Sheet 2 of 3
Gravels
Primarily organic matter, dark incolor, and organic odor
COARSE-GRAINED
SOILS
OL
(less than 5%fines)
GW
Geotechnical and Environmental ConsultantsSHANNON & WILSON, INC.
(less than 5%fines)
PT
(more than 12%fines)
MH
SP
GP
GM
Silty orClayey Sand
Silty Gravel; Silty Gravel with Sand
(50% or morepasses the No.
200 sieve)
SOIL DESCRIPTIONAND LOG KEY
Elastic Silt; Elastic Silt with Sand orGravel; Sandy or Gravelly Elastic Silt
Fat Clay; Fat Clay with Sand or Gravel;Sandy or Gravelly Fat Clay
Organic Silt or Clay; Organic Silt orClay with Sand or Gravel; Sandy orGravelly Organic Silt or Clay
Poorly Graded Sand; Poorly GradedSand with Gravel
Well-Graded Sand; Well-Graded Sandwith Gravel
Well-Graded Gravel; Well-GradedGravel with Sand
Poorly Graded Gravel; Poorly GradedGravel with Sand
Lean Clay; Lean Clay with Sand orGravel; Sandy or Gravelly Lean Clay
Peat or other highly organic soils (seeASTM D4427)
The Fill graphic symbol is combinedwith the soil graphic that bestrepresents the observed material
FILLPlaced by humans, both engineered
and nonengineered. May includevarious soil materials and debris.
FIG. A1
SW
(more than 12%fines)
Silts and Clays
Silts and Clays
(more than 50%retained on No.
200 sieve)
(50% or more ofcoarse fraction
passes the No. 4sieve)
(liquid limit lessthan 50)
(liquid limit 50 ormore)
Organic
Inorganic
FINE-GRAINEDSOILS
SM
Sands
Silty or ClayeyGravel
Silt; Silt with Sand or Gravel; Sandy orGravelly Silt
Organic Silt or Clay; Organic Silt orClay with Sand or Gravel; Sandy orGravelly Organic Silt or Clay
HIGHLY-ORGANIC
SOILS
NOTES
1. Dual symbols (symbols separated by a hyphen, i.e., SP-SM, Sandwith Silt) are used for soils with between 5% and 12% fines or whenthe liquid limit and plasticity index values plot in the CL-ML area ofthe plasticity chart.
2. Borderline symbols (symbols separated by a slash, i.e., CL/ML,Lean Clay to Silt; SP-SM/SM, Sand with Silt to Silty Sand) indicatethat the soil properties are close to the defining boundary betweentwo groups.
3. The soil graphics above represent the various USCS identifications(i.e., GP, SM, etc.) and may be augmented with additionalsymbology to represent differences within USCS designations.Sandy Silt (ML), for example, may be accompanied by the ML soilgraphic with sand grains added.
2013
_BO
RIN
G_C
LAS
S2
24-
1-03
734-
002.
GP
J S
W20
13LI
BR
AR
YP
DX
.GLB
SW
NE
W.G
DT
3/3
0/1
5UNIFIED SOIL CLASSIFICATION SYSTEM (USCS)
(Modified From USACE Tech Memo 3-357, ASTM D2487, and ASTM D2488)
NOTE: No. 4 size = 4.75 mm = 0.187 in.; No. 200 size = 0.075 mm = 0.003 in.

March 2015 24-1-03734-002
Iron Mountain Sanitary Sewerand Pedestrian BridgeLake Oswego, Oregon
SHANNON & WILSON, INC.Geotechnical and Environmental Consultants
FIG. A1Sheet 3 of 3
SOIL DESCRIPTIONAND LOG KEY
1Reprinted, with permission, from ASTM D2488 - 09a Standard Practice forDescription and Identification of Soils (Visual-Manual Procedure), copyright ASTMInternational, 100 Barr Harbor Drive, West Conshohocken, PA 19428. A copy ofthe complete standard may be obtained from ASTM International, www.astm.org.2Adapted, with permission, from ASTM D2488 - 09a Standard Practice forDescription and Identification of Soils (Visual-Manual Procedure), copyright ASTMInternational, 100 Barr Harbor Drive, West Conshohocken, PA 19428. A copy ofthe complete standard may be obtained from ASTM International, www.astm.org.
ACRONYMS AND ABBREVIATIONSPoorly Graded
Well-Graded
Irregular patches of different colors.
Soil disturbance or mixing by plants oranimals.
Nonsorted sediment; sand and gravelin silt and/or clay matrix.
Material brought to surface by drilling.
Material that caved from sides ofborehole.
Disturbed texture, mix of strengths.
Mottled
Bioturbated
Diamict
Cuttings
Slough
Sheared
DESCRIPTIONNonplastic
Low
Medium
High
ADDITIONAL TERMS
PLASTICITY2
CEMENTATION TERMS1
GRADATION TERMS
PARTICLE ANGULARITY AND SHAPE TERMS1
Angular
Subangular
Subrounded
Rounded
Flat
Elongated
Sharp edges and unpolished planarsurfaces.
Similar to angular, but with roundededges.
Nearly planar sides with well-roundededges.
Smoothly curved sides with no edges.
Width/thickness ratio > 3.
Length/width ratio > 3.
Narrow range of grain sizes presentor, within the range of grain sizespresent, one or more sizes aremissing (Gap Graded). Meets criteriain ASTM D2487, if tested.Full range and even distribution ofgrain sizes present. Meets criteria inASTM D2487, if tested.
Crumbles or breaks with handling orslight finger pressureCrumbles or breaks with considerablefinger pressureWill not crumble or break with fingerpressure
Weak
Moderate
Strong
VISUAL-MANUAL CRITERIAA 1/8-in. thread cannot be rolledat any water content.A thread can barely be rolled anda lump cannot be formed whendrier than the plastic limit.A thread is easy to roll and notmuch time is required to reach theplastic limit. The thread cannot bererolled after reaching the plasticlimit. A lump crumbles when drierthan the plastic limit.It take considerable time rollingand kneading to reach the plasticlimit. A thread can be rerolledseveral times after reaching theplastic limit. A lump can beformed without crumbling whendrier than the plastic limit.
APPROX.PLASITICTY
INDEXRANGE
< 4%
4 to 10%
10 to20%
> 20%
STRUCTURE TERMS1
Alternating layers of varying material or colorwith layers at least 1/4-inch thick; singular: bed.Alternating layers of varying material or colorwith layers less than 1/4-inch thick; singular:lamination.Breaks along definite planes or fractures withlittle resistance.Fracture planes appear polished or glossy;sometimes striated.Cohesive soil that can be broken down intosmall angular lumps that resist furtherbreakdown.Inclusion of small pockets of different soils,such as small lenses of sand scattered througha mass of clay.Same color and appearance throughout.
Interbedded
Laminated
Fissured
Slickensided
Blocky
Lensed
Homogeneous
ATDapprox.
Diam.Elev.
ft.FeOgal.
Horiz.HSAI.D.in.
lbs.MgOmm
MnONANP
O.D.OWpcf
PIDPMTppm
psiPVCrpmSPT
USCSqu
VWPVert.
WOHWOR
Wt.
At Time of DrillingApproximate/ApproximatelyDiameterElevationFeetIron OxideGallonsHorizontalHollow Stem AugerInside DiameterInchesPoundsMagnesium OxideMillimeterManganese OxideNot Applicable or Not AvailableNonplasticOutside DiameterObservation WellPounds per Cubic FootPhoto-Ionization DetectorPressuremeter TestParts per MillionPounds per Square InchPolyvinyl ChlorideRotations per MinuteStandard Penetration TestUnified Soil Classification SystemUnconfined Compressive StrengthVibrating Wire PiezometerVerticalWeight of HammerWeight of RodsWeight
2013
_BO
RIN
G_C
LAS
S3
24-
1-03
734-
002.
GP
J S
W20
13LI
BR
AR
YP
DX
.GLB
SW
NE
W.G
DT
3/3
0/1
5

Gray-brown, Silt (ML); moist; approx. 10% finesand; nonplastic to low plasticity; some rootsand concrete debris.
FILL
Soft, yellow-brown and red-yellow to gray, Silt(ML); moist; approx. 10% fine sand; nonplasticto low plasticity; micaceous.
FINE-GRAINED ALLUVIUM
Medium dense, gray, Silty Sand with Gravel(SM); wet; fine to coarse, subrounded gravel;fine to coarse sand; nonplastic fines.
SAND AND GRAVEL ALLUVIUM
Loose to medium dense, gray, Silt interbeddedwith Sandy Silt (ML); wet; fine sand; rapiddilatency, nonplastic; micaceous.
FINE-GRAINED ALLUVIUM
Very stiff, light gray to blue-gray, Elastic Silt(MH) to Fat Clay (CH); moist; trace fine,subrounded to angular gravel; trace fine tocoarse sand; high plasticity; some blockyzones.
WEATHERED MUDSTONE
Very stiff, light gray, red and yellow-brown, FatClay (CH); moist; trace fine, subrounded toangular gravel; trace fine to coarse sand; highplasticity; some blocky zones.
Grades to light gray at 28.0 ft.
Dur
ing
Dril
ling
S-1
S-2
S-3
S-4
S-5
S-6
S-7
S-8
S-9
S-10
104.01.0
98.07.0
95.010.0
90.015.0
81.024.0
~~~~
Log:
AA
H
33.5 ft.~ 105 ft.
Sam
ples
Refer to the report text for a proper understanding of thesubsurface materials and drilling methods. The stratificationlines indicated below represent the approximate boundaries
between soil types, and the transitions may be gradual.
Hammer Wt. & Drop:
4.5 in.AWJ
CatheadR
ev: A
AH
SHANNON & WILSON, INC.
PENETRATION RESISTANCE, N
5
10
15
20
25
REV 3
Solid Stem AugerPLi SystemsBig Beaver
0
20 40 60 80
100
March 2015 24-1-03734-002
Gro
und
Wat
er Hammer Wt. & Drop:
Geotechnical and Environmental Consultants
Hole Diam.:Rod Type:Hammer Type:
FIG. A2
Typ
: M
AS
/AA
H
CONTINUED NEXT SHEET
Dep
th, f
t.
Drilling Method:Drilling Company:Drill Rig Equipment:Other Comments:
Northing:Easting:Station:Offset:
Sym
bol
Total Depth:Top Elevation:Vert. Datum:Horiz. Datum:
(blows/ft.)
0 100
Sheet 1 of 2
140 lbs / 30 inches
20 40 60 80
LOG OF BORING B-1
SOIL DESCRIPTION
Iron Mountain Sanitary Sewerand Pedestrian BridgeLake Oswego, Oregon
Elev.Depth
(ft.)
NOTES
1. Refer to KEY for explanation of symbols, codes, abbreviations and definitions.
2. Groundwater level, if indicated above, is for the date specified and may vary.
3. Group symbol is based on visual-manual identification and selected lab testing.
4. The hole location and elevation should be considered approximate.
MA
ST
ER
_LO
G_E
24-
1-03
734
-00
2.G
PJ
SW
2013
LIB
RA
RY
PD
X.G
LB S
HA
NW
IL_P
DX
.GD
T
3/30
/15
LEGEND
Groundwater Level ATD3" O.D. Shelby Tube
Standard Penetration Test(<0.075mm)
Liquid LimitPlastic Limit
% Water Content
% Fines
Recovery (%)
3
17
6
11
20
16
25
25
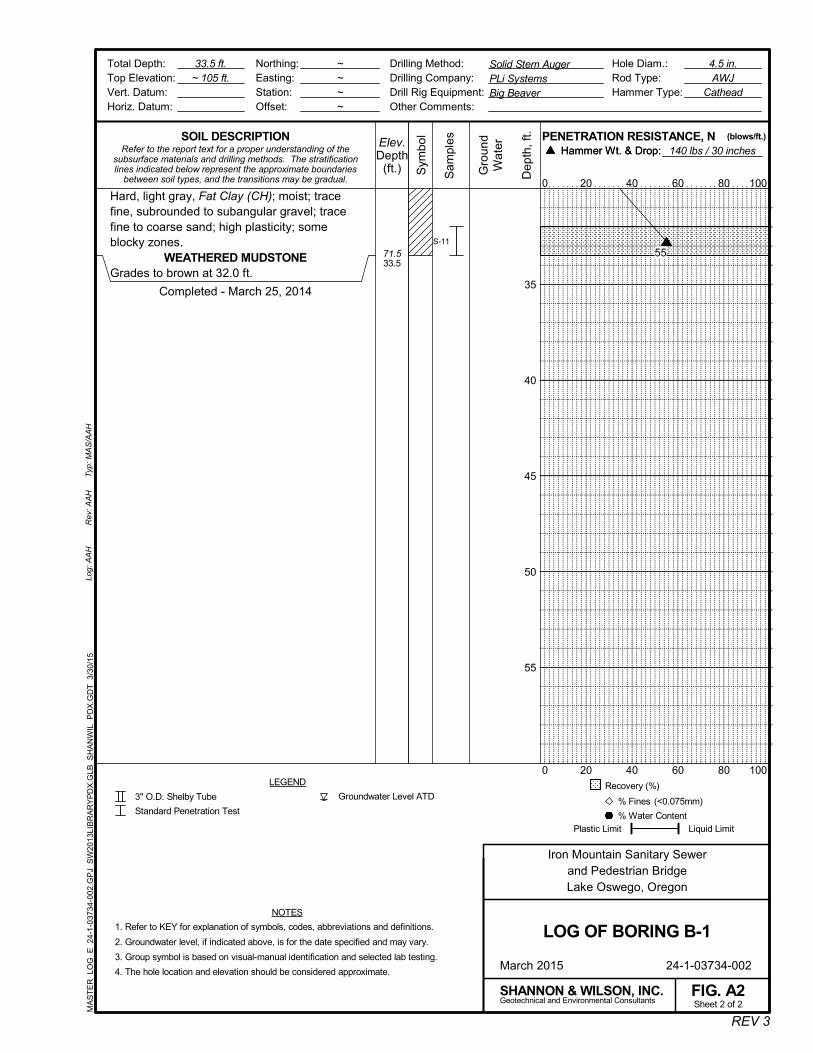
Hard, light gray, Fat Clay (CH); moist; tracefine, subrounded to subangular gravel; tracefine to coarse sand; high plasticity; someblocky zones.
WEATHERED MUDSTONEGrades to brown at 32.0 ft.
Completed - March 25, 2014
S-11
71.533.5
~~~~
Log:
AA
H
33.5 ft.~ 105 ft.
Sam
ples
Refer to the report text for a proper understanding of thesubsurface materials and drilling methods. The stratificationlines indicated below represent the approximate boundaries
between soil types, and the transitions may be gradual.
Hammer Wt. & Drop:
4.5 in.AWJ
CatheadR
ev: A
AH
SHANNON & WILSON, INC.
PENETRATION RESISTANCE, N
35
40
45
50
55
REV 3
Solid Stem AugerPLi SystemsBig Beaver
0
20 40 60 80
100
March 2015 24-1-03734-002
Gro
und
Wat
er Hammer Wt. & Drop:
Geotechnical and Environmental Consultants
Hole Diam.:Rod Type:Hammer Type:
FIG. A2
Typ
: M
AS
/AA
H
Dep
th, f
t.
Drilling Method:Drilling Company:Drill Rig Equipment:Other Comments:
Northing:Easting:Station:Offset:
Sym
bol
Total Depth:Top Elevation:Vert. Datum:Horiz. Datum:
(blows/ft.)
0 100
Sheet 2 of 2
140 lbs / 30 inches
20 40 60 80
LOG OF BORING B-1
SOIL DESCRIPTION
Iron Mountain Sanitary Sewerand Pedestrian BridgeLake Oswego, Oregon
Elev.Depth
(ft.)
NOTES
1. Refer to KEY for explanation of symbols, codes, abbreviations and definitions.
2. Groundwater level, if indicated above, is for the date specified and may vary.
3. Group symbol is based on visual-manual identification and selected lab testing.
4. The hole location and elevation should be considered approximate.
MA
ST
ER
_LO
G_E
24-
1-03
734
-00
2.G
PJ
SW
2013
LIB
RA
RY
PD
X.G
LB S
HA
NW
IL_P
DX
.GD
T
3/30
/15
LEGEND
Groundwater Level ATD3" O.D. Shelby Tube
Standard Penetration Test(<0.075mm)
Liquid LimitPlastic Limit
% Water Content
% Fines
Recovery (%)
55

Soft to medium stiff, gray, Silt to Silt with Sand(ML); moist; Interbedded with few 2-in.-thicklayers of Lean Clay (CL); fine sand; low tomedium plasticity; approx. 5-10% woodfragments; micaceous.
FINE-GRAINED ALLUVIUM
Solid wood, strong odor.
Loose, dark gray, Silty Sand with Gravel (SM);fine to coarse, subrounded gravel; fine tocoarse sand; low plasticity fines.
SAND AND GRAVEL ALLUVIUM
Stiff to very stiff, yellow-brown, red, and lightgray, Elastic Silt with Sand (MH); moist; tracefine, rounded to angular gravel; fine to coarsesand; high plasticity; blocky.
WEATHERED MUDSTONE
Hard, yellow-brown, red, and light gray, ElasticSilt with Sand (MH) to Fat Clay with Sand(CH); moist; trace fine, rounded to angulargravel; fine to coarse sand; high plasticity;blocky.
Abandoned due to practical refusal- March 24, 2014
Dur
ing
Dril
ling
S-1
S-2
S-3
S-4a
S-4b
S-5
S-6
S-7a
S-7b
S-8
S-9
S-10
100.99.1
98.012.0
94.915.1
90.020.0
86.523.5
~~~~
Log:
AA
H
23.5 ft.~ 110 ft.
Sam
ples
Refer to the report text for a proper understanding of thesubsurface materials and drilling methods. The stratificationlines indicated below represent the approximate boundaries
between soil types, and the transitions may be gradual.
Hammer Wt. & Drop:
6.5 in., 4.5 in.AWJ
CatheadR
ev: A
AH
SHANNON & WILSON, INC.
PENETRATION RESISTANCE, N
5
10
15
20
25
REV 3
HSA / Solid Stem AugerPLi SystemsBig Beaver
0
20 40 60 80
100
March 2015 24-1-03734-002
Gro
und
Wat
er Hammer Wt. & Drop:
Geotechnical and Environmental Consultants
Hole Diam.:Rod Type:Hammer Type:
FIG. A3
Typ
: M
AS
/AA
H
Dep
th, f
t.
Drilling Method:Drilling Company:Drill Rig Equipment:Other Comments:
Northing:Easting:Station:Offset:
Sym
bol
Total Depth:Top Elevation:Vert. Datum:Horiz. Datum:
(blows/ft.)
0 100
140 lbs / 30 inches
20 40 60 80
LOG OF BORING B-2
SOIL DESCRIPTION
Iron Mountain Sanitary Sewerand Pedestrian BridgeLake Oswego, Oregon
Elev.Depth
(ft.)
NOTES
1. Refer to KEY for explanation of symbols, codes, abbreviations and definitions.
2. Groundwater level, if indicated above, is for the date specified and may vary.
3. Group symbol is based on visual-manual identification and selected lab testing.
4. The hole location and elevation should be considered approximate.
MA
ST
ER
_LO
G_E
24-
1-03
734
-00
2.G
PJ
SW
2013
LIB
RA
RY
PD
X.G
LB S
HA
NW
IL_P
DX
.GD
T
3/30
/15
LEGEND
Groundwater Level ATDStandard Penetration Test
3" O.D. Shelby Tube(<0.075mm)
Liquid LimitPlastic Limit
% Water Content
% Fines
Recovery (%)
5
2
10
81
5
12
17
46
81

24-1-03734-002
APPENDIX B
LABORATORY TEST RESULTS

24-1-03734-002 B-i
TABLE OF CONTENTS
B.1 GENERAL .......................................................................................................................B-1
B.2 SOIL TESTING ...............................................................................................................B-1 B.2.1 Moisture (Natural Water) Content .....................................................................B-1 B.2.2 Atterberg Limits ................................................................................................B-2 B.2.3 Particle-Size Analyses .......................................................................................B-2
FIGURES B1 Atterberg Limits Results B2 Grain Size Distribution
ATTACHMENTS Northwest Testing Technical Report (dated April 2, 2014)
24-1-03734-002 B-1
APPENDIX B
LABORATORY TEST RESULTS B.1 GENERAL
The soil samples obtained during the field explorations were described and identified in the field in general accordance with the Standard Practice for Description and Identification of Soils (Visual-Manual Procedure), ASTM D2488. The specific terminology used is presented in Appendix A, Figure A1. The samples were then reviewed in the laboratory. The physical characteristics of the samples were noted, and the field descriptions and identifications were modified where necessary in accordance with terminology presented in Appendix A, Figure A1. Representative samples were selected for various laboratory tests. We refined our visual-manual soil descriptions and identifications based on the results of the laboratory tests, using elements of the Standard Practice for Classification of Soils for Engineering Purposes (Unified Soil Classification System), ASTM D2487. The refined descriptions and identifications were then incorporated into the Logs of Borings, presented in Appendix A. Note that ASTM D2487 was not followed in full because it requires that a suite of tests be performed to fully classify a single sample.
The soil testing program included moisture content analyses, Atterberg limits tests, and particle-size analyses. All laboratory testing was performed by Northwest Testing, Inc., (NTI) of Wilsonville, Oregon, in accordance with applicable ASTM International (ASTM) standards. Testing procedures are summarized in the following paragraphs.
B.2 SOIL TESTING
B.2.1 Moisture (Natural Water) Content
Natural moisture content determinations were performed in accordance with ASTM D2216 on selected soil samples. The natural moisture content is a measure of the amount of moisture in the soil at the time the explorations are performed and is defined as the ratio of the weight of water to the dry weight of the soil, expressed as a percentage. The results of the moisture content determinations are presented in a report, prepared by NTI, which is included at the end of this appendix. The moisture content results are also shown graphically on the Logs of Borings in Appendix A.

24-1-03734-002 B-2
B.2.2 Atterberg Limits
Atterberg limits were determined on selected samples in accordance with ASTM D4318. This analysis yields index parameters of the soil that are useful in soil identification, as well as in a number of analyses, including liquefaction analysis. An Atterberg limits test determines a soil’s liquid limit (LL) and plastic limit (PL). These are the maximum and minimum moisture contents at which the soil exhibits plastic behavior. A soil’s plasticity index (PI) can be determined by subtracting PL from LL. The results of the Atterberg limits tests are presented in a report, prepared by NTI, which is included at the end of this appendix. The LL, PL, and PI of tested samples are also presented on the Atterberg Limits Results, Figure B1. The results are shown graphically on the Logs of Borings in Appendix A. For the purposes of soil description, we use the term nonplastic to refer to soils with a PI range of 0 to 4, low plasticity for soils with a PI range of >4 to 10, medium plasticity for soils with a PI range of >10 to 20, high plasticity for soils with a PI range of >20 to 40, and very high plasticity for soils with a PI greater than 40.
B.2.3 Particle-Size Analyses
A wet sieve analysis was performed on select samples in accordance with ASTM D1140, to determine a percentage (by weight) of each sample passing the No. 200 (0.075 mm) sieve. The results of the particle-size analyses are presented in a report, prepared by NTI, which is included at the end of this appendix. Results of the particle-size analyses are also presented on Figure B2, Grain Size Distribution. For all particle-size analyses, the percentage of material passing the No. 200 sieve is shown graphically on the Logs of Borings in Appendix A.

0
10
20
30
40
50
60
70
0 10 20 30 40 50 60 70 80 90 100 110
12.0
8.0
16.0
BORING ANDSAMPLE NO.
24-1-03734-002
FINES%
LL%
NP
36
70 ATTERBERG LIMITS RESULTS
LIQUID LIMIT - LL (%)
AT
T_M
AIN
24-1-03734-002.G
PJ S
HA
N_W
IL.GD
T 3
/30/15
March 2015
SHANNON & WILSON, INC.
NP
5
29
Geotechnical and Environmental Consultants
GROUPSYMBOL2
PI%3
Silt with Sand to Sandy Silt
Silt to Silt with Sand
Elastic Silt with Sand
ML
ML
MH
FIG. B1
DEPTH(feet)
NP
31
41
NAT.W.C. %
PLA
ST
ICIT
Y I
ND
EX
- P
I (%
)
FIG
. B1
PL%
B-1, S-6
B-2, S-4a
B-2, S-8
Iron Mountain Sanitary Sewerand Pedestrian BridgeLake Oswego, Oregon
NOTES
GROUPNAME2
1) Atterberg limits tests wereperformed in general accordancewith ASTM D4318 unlessotherwise noted in the report.
2) Group Name and GroupSymbol are in accordance withASTM D2488 and are refined inaccordance with ASTM D2487where appropriate laboratorytests are performed.
3) Plasticity adjectives used insample descriptions correspondto plasticity index as follows: - Nonplastic (NP) (< 4%) - Low Plasticity (4 to 10%) - Medium Plasticity (10 to 20%) - High Plasticity (> 20%)
MH or OH
CH
CL
CL-ML ML or OL

0
10
20
30
40
50
60
70
80
90
100
SIZE OF MESH OPENING IN INCHES
.04
.03
.003
20
SIEVE ANALYSIS
200
1/2
.1
.00660
.003
COBBLES
200
GRAVEL
.3
102 1
.001
.2
.02
60
GRAIN SIZE IN MILLIMETERS
100
.002
.0230
FINES: SILT OR CLAY
NO. OF MESH OPENINGS PER INCH, U.S. STANDARD
80 10
.004
.08
4
.002
8
FINE
GRAIN SIZE IN MILLIMETERS
300
.006
SM
SM
Iron Mountain Sanitary Sewer
and Pedestrian Bridge
Lake Oswego, Oregon
NO
TE
S:
1) Sieve analyses w
ere performed in general accordance w
ith AS
TM
D6913 and sieve w
ith hydrometer
analyses were perform
ed in general accordance with A
ST
M D
422 unless otherwise noted in the report.
2) Group N
ame and G
roup Sym
bol are in accordance with A
ST
M D
2488 and are refined in accordance with
AS
TM
D2487 w
here appropriate laboratory tests are performed.
GRAIN SIZE DISTRIBUTION
FIG. B2
22
14
40
30
8.0
14.0
DEPTH(feet)
-
-
24-1-03734-002
-
-
GRAVEL%
FINES%
DRYDENSITY
PCF
Geotechnical and Environmental ConsultantsSHANNON & WILSON, INC.
B-1, S-4
B-2, S-7a
BORING ANDSAMPLE NO.
SAND%
NAT.W.C. %
Silty Sand with Gravel
Silty Sand with Gravel
GROUPNAME2
GROUPSYMBOL2
FIG
. B2
GS
A_M
AIN
24-1-03
734-002.GP
J SH
AN
_WIL.G
DT
3/30/15
March 2015
COARSE FINE
12 20
.001
PE
RC
EN
T C
OA
RS
ER
BY
WE
IGH
T
.01
1/4
4
.004
SAND
100
90
80
70
60
50
40
30
20
10
0
5/8
HYDROMETER ANALYSIS
3/8
3 .6
2 .03
40
40 .01
.008
.008
6 100
.4
1 1/
2
.04
.06.8
.06
1
6 4
PE
RC
EN
T F
INE
R B
Y W
EIG
HT
3/4
COARSE MEDIUM
3

Report
Project
This repoSHEET 1 TECHNICAL\\NGI-FS2\Lab
Report
SampleNTI comtesting accordatables.
B-1 SB-2 SB-2 S
BB-2
Copies
To: MS3L
t: LP
rt shall not beof 1
L REPORT boratory\Lab Repo
of: Mosiev
e Identificatiompleted moiston samples
ance with the
S
B-1 SB-1 S-B-1 S-B-2 S
B-2 S-1
Sample ID S-6 @ 12 – 13S-4 @ 8.0 – 9S-8 @ 16 – 17
Am
Sample I
B-1 S-4 @ 8 –2 S-7a @ 14 –
s: AddElli
Ms. Aimee HoShannon & W3990 S.W. CoLake Oswego
Laboratory TePedestrian Bri
e reproduced
rts\2014 Lab Repo
oisture contenve
on ture content, of soil delive
e standards in
Mo
Sample ID
S-2 @ 4 – 5.57 @ 16 – 17.9 @ 24 – 25.
S-1 @ 2.5 – 410 @ 22 – 23
3.5 ft. 9.5 ft. 7.5 ft.
mount of Ma
D
– 9.5 ft. – 15.1 ft.
dressee ott Mecham,
olmes, P.E., CWilson, Inc. ollins Way, Su, Oregon 970
esting – Iron Midge
except in full
rts\1984.1.1 Shann
nt, Atterberg
Atterberg limered to our landicated. Ou
Labor
oisture Cont
ft. 5 ft. 5 ft. ft. .5 ft.
Atterberg LLiquid Lim
NP 36 70
aterial Finer t
Moist
P.E., Shanno
C.E.G.
uite 203 035
Mountain San
, without writt
non and Wilson\14-
limits, and a
mits, and amouaboratory on ur laboratory
ratory Testin
ent of Soil (A
Limits (ASTMmit
than the No.
ture Content
39.6 29.6
on & Wilson, I
TE
nitary Sewer
ten approval oREVIEWED
-102 Moistures, Att
amount of ma
unt of materiaMarch 27, 20test results a
ng
ASTM D 2216Mo
M D 4318) Plastic Lim
NP 31 41
200 Sieve (A
t (%)
Inc.
ECHNICADate:
Lab No.
& Project N
of Northwest BY: Bridge
terberg, & P200.do
aterial passin
al passing the014. Testingare summariz
6) oisture Cont
(Percent) 32.9 27.0 48.1 28.8 41.6
mit
ASTM D1140Percent Pas
AL REPO
: 1
No.: 19
Testing, Inc.tt Adame
ocx
ng the numbe
e number 200g was performzed on the fol
ent
Plasticity IndNP 5 29
0) ssing the NoSieve 22.0 13.8
ORT 4/2/14
14-102
984.1.1
er 200
0 sieve med in llowing
dex
o. 200

24-1-03734-002
APPENDIX C
PREVIOUS FIELD EXPLORATIONS

24-1-03734-002
APPENDIX
PREVIOUS FIELD EXPLORATIONS
Shannon & Wilson, Inc., previously explored subsurface conditions at the project site with six geotechnical hand auger explorations. The hand auger explorations were advanced in October 2012 and were originally included in our preliminary letter dated November 2, 2012. The explorations were designated HA-1 through HA-6 and were advanced to depths of 4.2 to 18.6 feet below the ground surface. The locations of the completed borings were measured in the field relative to the existing bridge. Approximate locations are shown on the Site and Exploration Plan, Figure 2.
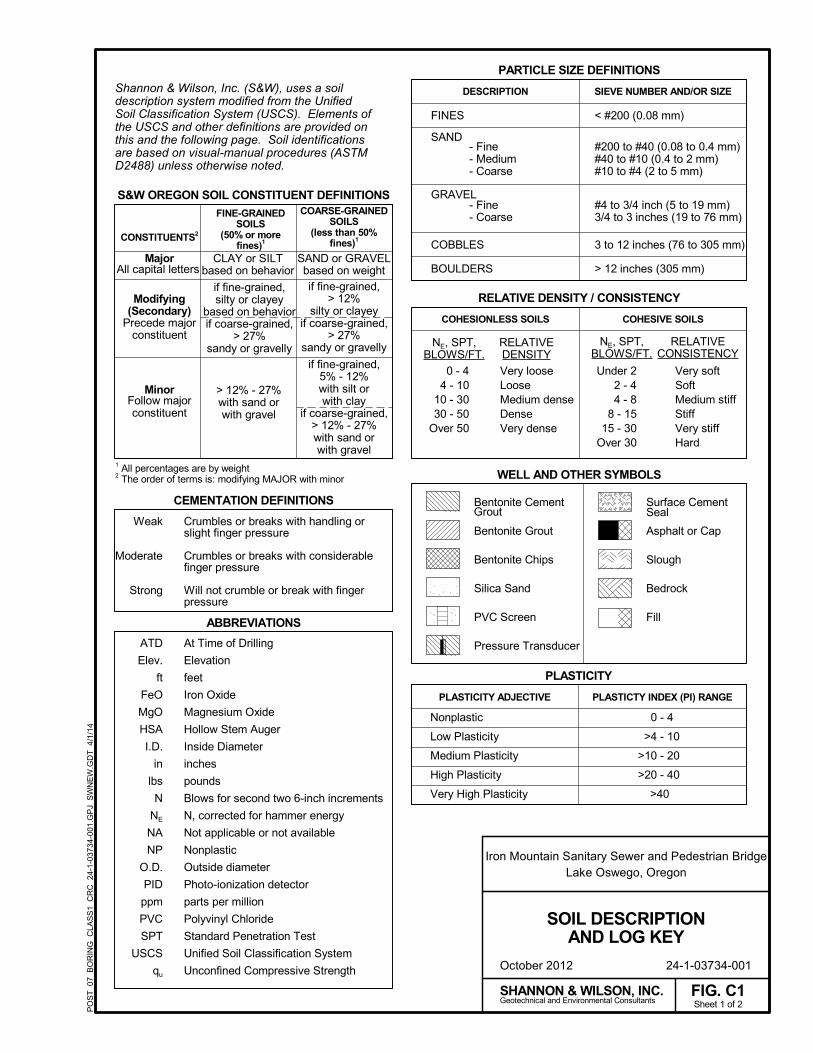
Iron Mountain Sanitary Sewer and Pedestrian BridgeLake Oswego, Oregon
October 2012 24-1-03734-001
Geotechnical and Environmental Consultants
DESCRIPTION SIEVE NUMBER AND/OR SIZE
SAND
PLASTICTY INDEX (PI) RANGEPLASTICITY ADJECTIVE
S&W OREGON SOIL CONSTITUENT DEFINITIONS
SHANNON & WILSON, INC.Sheet 1 of 2FIG. C1
PARTICLE SIZE DEFINITIONS
#4 to 3/4 inch (5 to 19 mm)3/4 to 3 inches (19 to 76 mm)
3 to 12 inches (76 to 305 mm)
> 12 inches (305 mm)
- Fine- Medium- Coarse
FINES
#200 to #40 (0.08 to 0.4 mm)#40 to #10 (0.4 to 2 mm)#10 to #4 (2 to 5 mm)
BOULDERS
- Fine- Coarse
COBBLES
< #200 (0.08 mm)
SOIL DESCRIPTIONAND LOG KEY
GRAVEL
>40
PLASTICITY
WELL AND OTHER SYMBOLS
Very softSoftMedium stiffStiffVery stiffHard
0 - 44 - 10
10 - 3030 - 50
Over 50
Under 22 - 44 - 8
8 - 1515 - 30
Over 30
Very looseLooseMedium denseDenseVery dense
RELATIVEDENSITY
RELATIVECONSISTENCY
RELATIVE DENSITY / CONSISTENCY
Low Plasticity
COHESIVE SOILS
NE, SPT,BLOWS/FT.
NE, SPT,BLOWS/FT.
Bentonite Cement
Bentonite Grout
Bentonite Chips
Silica Sand
PVC Screen
Pressure Transducer
Surface Cement
Asphalt or Cap
Slough
Bedrock
Fill
if fine-grained,silty or clayey
based on behaviorif coarse-grained,
> 27%sandy or gravelly
> 12% - 27%with sand orwith gravel
Nonplastic
Medium Plasticity
High Plasticity
Very High Plasticity
>20 - 40
>10 - 20
>4 - 10
0 - 4
Grout
FINE-GRAINEDSOILS
(50% or morefines)1
MinorFollow majorconstituent
All capital letters
COHESIONLESS SOILS
CONSTITUENTS2
Major SAND or GRAVELbased on weight
COARSE-GRAINEDSOILS
(less than 50%fines)1
CLAY or SILTbased on behavior
Modifying(Secondary)
Precede majorconstituent
1 All percentages are by weight2 The order of terms is: modifying MAJOR with minor
ATD
Elev.
ft
FeO
MgO
HSA
I.D.
in
lbs
N
NE
NA
NP
O.D.
PID
ppm
PVC
SPT
USCS
qu
ABBREVIATIONS
At Time of Drilling
Elevation
feet
Iron Oxide
Magnesium Oxide
Hollow Stem Auger
Inside Diameter
inches
pounds
Blows for second two 6-inch increments
N, corrected for hammer energy
Not applicable or not available
Nonplastic
Outside diameter
Photo-ionization detector
parts per million
Polyvinyl Chloride
Standard Penetration Test
Unified Soil Classification System
Unconfined Compressive Strength
CEMENTATION DEFINITIONS
Weak
Moderate
Strong
Seal
if fine-grained,> 12%
silty or clayeyif coarse-grained,
> 27%sandy or gravelly
if fine-grained,5% - 12%with silt orwith clay
if coarse-grained,> 12% - 27%with sand orwith gravel
Shannon & Wilson, Inc. (S&W), uses a soildescription system modified from the UnifiedSoil Classification System (USCS). Elements ofthe USCS and other definitions are provided onthis and the following page. Soil identificationsare based on visual-manual procedures (ASTMD2488) unless otherwise noted.
Crumbles or breaks with handling orslight finger pressure
Crumbles or breaks with considerablefinger pressure
Will not crumble or break with fingerpressure
PO
ST
_07_
BO
RIN
G_C
LAS
S1_
CR
C 2
4-1
-03
734-
001.
GP
J S
WN
EW
.GD
T 4
/1/1
4
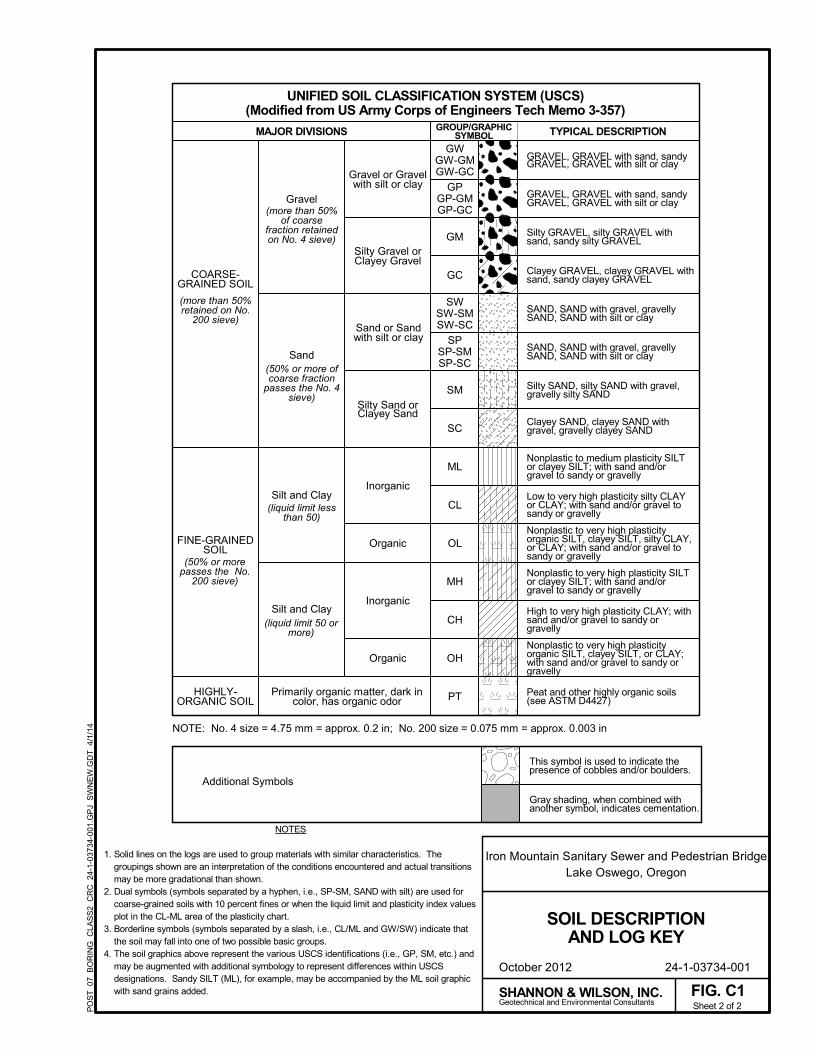
Iron Mountain Sanitary Sewer and Pedestrian BridgeLake Oswego, Oregon
October 2012 24-1-03734-001
PT
(more than 50%retained on No.
200 sieve)
Sand
Silt and Clay
FINE-GRAINEDSOIL
HIGHLY-ORGANIC SOIL
(50% or more ofcoarse fraction
passes the No. 4sieve)
(liquid limit lessthan 50)
SC
Organic
Inorganic
SM
OL
Silty Gravel orClayey Gravel
Sand or Sandwith silt or clay
Silty Sand orClayey Sand
This symbol is used to indicate thepresence of cobbles and/or boulders.
SAND, SAND with gravel, gravellySAND, SAND with silt or clay
Clayey GRAVEL, clayey GRAVEL withsand, sandy clayey GRAVEL
Sheet 2 of 2
TYPICAL DESCRIPTION
CH
OH
ML
CL
Gray shading, when combined withanother symbol, indicates cementation.
Additional Symbols
Geotechnical and Environmental Consultants
COARSE-GRAINED SOIL
Gravel or Gravelwith silt or clay
GWGW-GMGW-GC
GPGP-GMGP-GC
SWSW-SMSW-SC
SPSP-SMSP-SC
SHANNON & WILSON, INC.
Nonplastic to very high plasticityorganic SILT, clayey SILT, or CLAY;with sand and/or gravel to sandy orgravelly
High to very high plasticity CLAY; withsand and/or gravel to sandy orgravelly
Nonplastic to very high plasticity SILTor clayey SILT; with sand and/orgravel to sandy or gravelly
Nonplastic to very high plasticityorganic SILT, clayey SILT, silty CLAY,or CLAY; with sand and/or gravel tosandy or gravelly
Low to very high plasticity silty CLAYor CLAY; with sand and/or gravel tosandy or gravelly
Nonplastic to medium plasticity SILTor clayey SILT; with sand and/orgravel to sandy or gravelly
Clayey SAND, clayey SAND withgravel, gravelly clayey SAND
Silty SAND, silty SAND with gravel,gravelly silty SAND
SAND, SAND with gravel, gravellySAND, SAND with silt or clay
Inorganic
Organic
(more than 50%of coarse
fraction retainedon No. 4 sieve)
MAJOR DIVISIONS GROUP/GRAPHICSYMBOL
(liquid limit 50 ormore)
(50% or morepasses the No.
200 sieve) MH
GM
GC
Gravel
Silt and Clay
Primarily organic matter, dark incolor, has organic odor
Silty GRAVEL, silty GRAVEL withsand, sandy silty GRAVEL
GRAVEL, GRAVEL with sand, sandyGRAVEL, GRAVEL with silt or clay
GRAVEL, GRAVEL with sand, sandyGRAVEL, GRAVEL with silt or clay
FIG. C1
SOIL DESCRIPTIONAND LOG KEY
Peat and other highly organic soils(see ASTM D4427)
NOTES
1. Solid lines on the logs are used to group materials with similar characteristics. Thegroupings shown are an interpretation of the conditions encountered and actual transitionsmay be more gradational than shown.
2. Dual symbols (symbols separated by a hyphen, i.e., SP-SM, SAND with silt) are used forcoarse-grained soils with 10 percent fines or when the liquid limit and plasticity index valuesplot in the CL-ML area of the plasticity chart.
3. Borderline symbols (symbols separated by a slash, i.e., CL/ML and GW/SW) indicate thatthe soil may fall into one of two possible basic groups.
4. The soil graphics above represent the various USCS identifications (i.e., GP, SM, etc.) andmay be augmented with additional symbology to represent differences within USCSdesignations. Sandy SILT (ML), for example, may be accompanied by the ML soil graphicwith sand grains added.
PO
ST
_07_
BO
RIN
G_C
LAS
S2_
CR
C 2
4-1
-03
734-
001.
GP
J S
WN
EW
.GD
T 4
/1/1
4 NOTE: No. 4 size = 4.75 mm = approx. 0.2 in; No. 200 size = 0.075 mm = approx. 0.003 in
UNIFIED SOIL CLASSIFICATION SYSTEM (USCS)(Modified from US Army Corps of Engineers Tech Memo 3-357)

Dur
ing
Dril
ling
Red-brown SILT with sand to sandy SILT,trace gravel; moist; nonplastic to low plasticity;fine to medium sand; rounded gravel;micaceous; slight to moderate iron-oxidestaining; occasional roots. (ML)
ALLUVIUM
Gray sandy SILT; moist; nonplastic to lowplasticity; fine to medium sand; micaceous;occasional to scattered organics. (ML)
Gray silty SAND; moist; nonplastic fines; fineto coarse sand; micaceous. (SM)Grades to wet below 6.2 feet.
Completed due to refusal on hard layer -September 13, 2012
S-1
S-2
S-3
100.53.5
98.55.5
96.87.2
Sam
ples
Refer to the report text for a proper understanding of thesubsurface materials and drilling methods. The stratificationlines indicated below represent the approximate boundaries
between soil types, and the transitions may be gradual.
Hammer Wt. & Drop:
2 3/4 in.n/an/a
Rev
: CK
SLo
g: C
KS
SHANNON & WILSON, INC.
PENETRATION RESISTANCE, N
5
10
15
REV 2
Hand BoringShannon & Wilson, Inc.Hand Auger
0
20 40 60 80
100
October 2012 24-1-03734-001
Gro
und
Wat
er Hammer Wt. & Drop:
Geotechnical and Environmental Consultants
Hole Diam.:Rod Type:Hammer Type:
FIG. C2
Typ
: M
AS
LEGEND
Sym
bol
NOTES
Total Depth:Top Elevation:Vert. Datum:Horiz. Datum:
(blows/ft.)
0 100
140 lbs / 30 inches
Dep
th, f
t.
Drilling Method:Drilling Company:Drill Rig Equipment:Other Comments:
Northing:Easting:Station:Offset:
Groundwater LevelSample Not Recovered*
20 40 60 80
LOG OF BORING HA-1
SOIL DESCRIPTION
Iron Mountain Sanitary Sewer and Pedestrian BridgeLake Oswego, Oregon
Elev.Depth
(ft.)
1. Refer to KEY for explanation of symbols, codes, abbreviations and definitions.
2. Groundwater level, if indicated above, is for the date specified and may vary.
3. Group symbol is based on visual-manual identification and selected lab testing.
4. The hole location and elevation should be considered approximate.
7.2 ft.104.0 ft.
project specificproject specific
5,006.4 ft.5,061.4 ft.
n/an/a
Jar Sample
MA
ST
ER
_LO
G_E
24-
1-03
734
-00
1.G
PJ
SH
AN
_WIL
.GD
T 4
/1/1
4
Liquid LimitNatural Water Content
Plastic Limit

Dur
ing
Dril
ling
Brown with red-brown mottling SILT with sandto sandy SILT; moist; nonplastic; fine tomedium sand; micaceous; occasional roots.(ML)
ALLUVIUM
Gray sandy SILT; moist; nonplastic; fine tomedium sand; micaceous. (ML)
Gray silty SAND; wet; nonplastic fines; fine tomedium sand; micaceous. (SM)
Completed due to refusal on hard layer -September 13, 2012
S-1
S-2
S-3
102.42.6
98.36.7
96.38.7
Sam
ples
Refer to the report text for a proper understanding of thesubsurface materials and drilling methods. The stratificationlines indicated below represent the approximate boundaries
between soil types, and the transitions may be gradual.
Hammer Wt. & Drop:
2 3/4 in.n/an/a
Rev
: CK
SLo
g: C
KS
SHANNON & WILSON, INC.
PENETRATION RESISTANCE, N
5
10
15
REV 2
Hand BoringShannon & Wilson, Inc.Hand Auger
0
20 40 60 80
100
October 2012 24-1-03734-001
Gro
und
Wat
er Hammer Wt. & Drop:
Geotechnical and Environmental Consultants
Hole Diam.:Rod Type:Hammer Type:
FIG. C3
Typ
: M
AS
LEGEND
Sym
bol
NOTES
Total Depth:Top Elevation:Vert. Datum:Horiz. Datum:
(blows/ft.)
0 100
140 lbs / 30 inches
Dep
th, f
t.
Drilling Method:Drilling Company:Drill Rig Equipment:Other Comments:
Northing:Easting:Station:Offset:
Groundwater LevelSample Not Recovered*
20 40 60 80
LOG OF BORING HA-2
SOIL DESCRIPTION
Iron Mountain Sanitary Sewer and Pedestrian BridgeLake Oswego, Oregon
Elev.Depth
(ft.)
1. Refer to KEY for explanation of symbols, codes, abbreviations and definitions.
2. Groundwater level, if indicated above, is for the date specified and may vary.
3. Group symbol is based on visual-manual identification and selected lab testing.
4. The hole location and elevation should be considered approximate.
8.7 ft.105.0 ft.
project specificproject specific
4,987.0 ft.5,071.3 ft.
n/an/a
Jar Sample
MA
ST
ER
_LO
G_E
24-
1-03
734
-00
1.G
PJ
SH
AN
_WIL
.GD
T 4
/1/1
4
Liquid LimitNatural Water Content
Plastic Limit
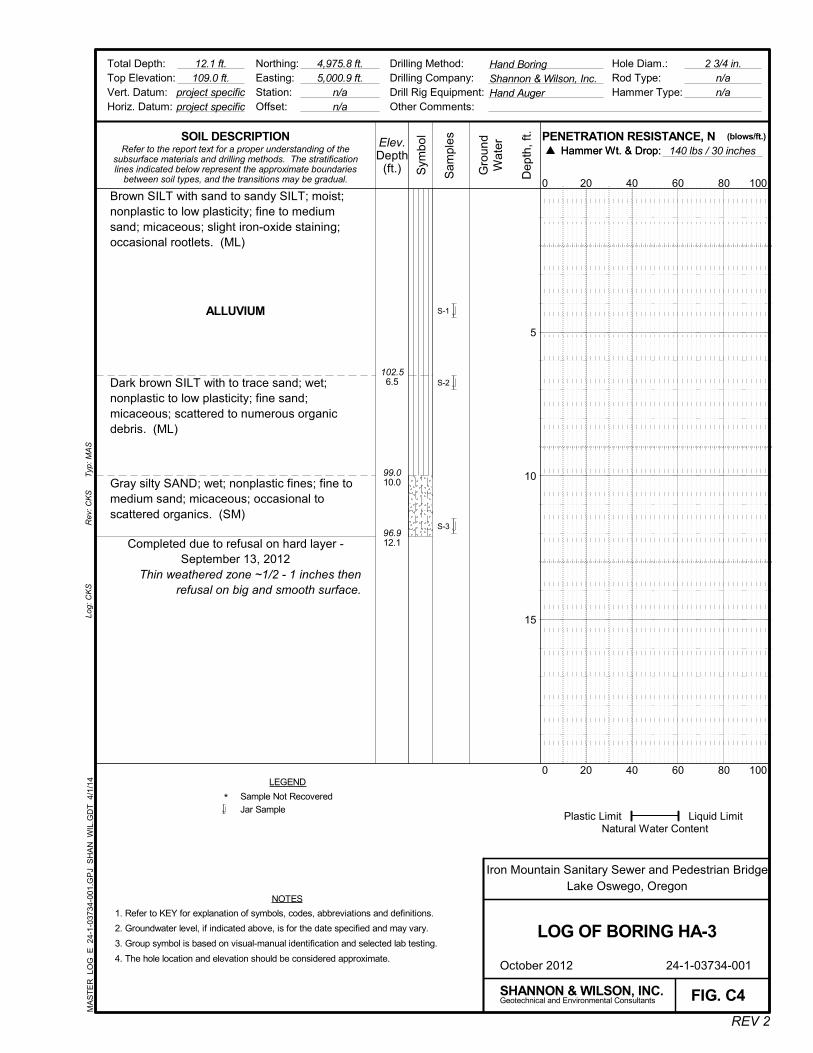
Brown SILT with sand to sandy SILT; moist;nonplastic to low plasticity; fine to mediumsand; micaceous; slight iron-oxide staining;occasional rootlets. (ML)
ALLUVIUM
Dark brown SILT with to trace sand; wet;nonplastic to low plasticity; fine sand;micaceous; scattered to numerous organicdebris. (ML)
Gray silty SAND; wet; nonplastic fines; fine tomedium sand; micaceous; occasional toscattered organics. (SM)
Completed due to refusal on hard layer -September 13, 2012
Thin weathered zone ~1/2 - 1 inches thenrefusal on big and smooth surface.
S-1
S-2
S-3
102.56.5
99.010.0
96.912.1
Sam
ples
Refer to the report text for a proper understanding of thesubsurface materials and drilling methods. The stratificationlines indicated below represent the approximate boundaries
between soil types, and the transitions may be gradual.
Hammer Wt. & Drop:
2 3/4 in.n/an/a
Rev
: CK
SLo
g: C
KS
SHANNON & WILSON, INC.
PENETRATION RESISTANCE, N
5
10
15
REV 2
Hand BoringShannon & Wilson, Inc.Hand Auger
0
20 40 60 80
100
October 2012 24-1-03734-001
Gro
und
Wat
er Hammer Wt. & Drop:
Geotechnical and Environmental Consultants
Hole Diam.:Rod Type:Hammer Type:
FIG. C4
Typ
: M
AS
LEGEND
Sym
bol
NOTES
Total Depth:Top Elevation:Vert. Datum:Horiz. Datum:
(blows/ft.)
0 100
140 lbs / 30 inches
Dep
th, f
t.
Drilling Method:Drilling Company:Drill Rig Equipment:Other Comments:
Northing:Easting:Station:Offset:
Sample Not Recovered*
20 40 60 80
LOG OF BORING HA-3
SOIL DESCRIPTION
Iron Mountain Sanitary Sewer and Pedestrian BridgeLake Oswego, Oregon
Elev.Depth
(ft.)
1. Refer to KEY for explanation of symbols, codes, abbreviations and definitions.
2. Groundwater level, if indicated above, is for the date specified and may vary.
3. Group symbol is based on visual-manual identification and selected lab testing.
4. The hole location and elevation should be considered approximate.
12.1 ft.109.0 ft.
project specificproject specific
4,975.8 ft.5,000.9 ft.
n/an/a
Jar Sample
MA
ST
ER
_LO
G_E
24-
1-03
734
-00
1.G
PJ
SH
AN
_WIL
.GD
T 4
/1/1
4
Liquid LimitNatural Water Content
Plastic Limit
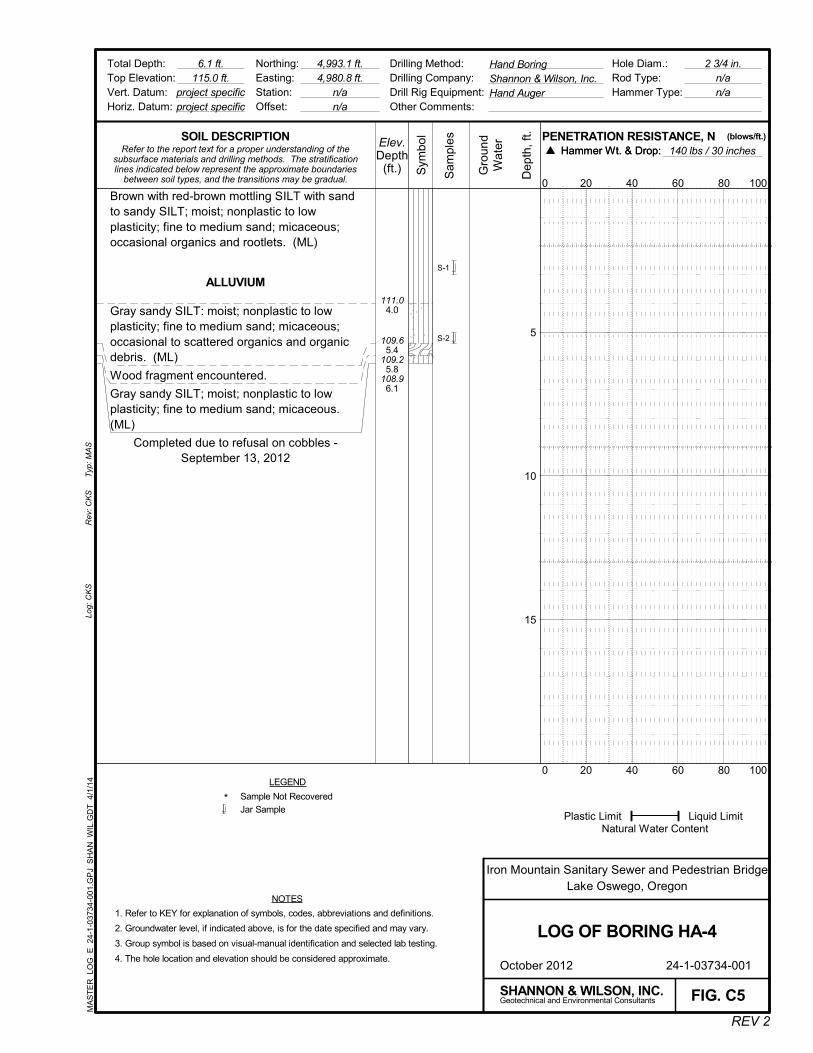
Brown with red-brown mottling SILT with sandto sandy SILT; moist; nonplastic to lowplasticity; fine to medium sand; micaceous;occasional organics and rootlets. (ML)
ALLUVIUM
Gray sandy SILT: moist; nonplastic to lowplasticity; fine to medium sand; micaceous;occasional to scattered organics and organicdebris. (ML)
Wood fragment encountered.
Gray sandy SILT; moist; nonplastic to lowplasticity; fine to medium sand; micaceous.(ML)
Completed due to refusal on cobbles -September 13, 2012
S-1
S-2
111.04.0
109.65.4
109.25.8
108.96.1
Sam
ples
Refer to the report text for a proper understanding of thesubsurface materials and drilling methods. The stratificationlines indicated below represent the approximate boundaries
between soil types, and the transitions may be gradual.
Hammer Wt. & Drop:
2 3/4 in.n/an/a
Rev
: CK
SLo
g: C
KS
SHANNON & WILSON, INC.
PENETRATION RESISTANCE, N
5
10
15
REV 2
Hand BoringShannon & Wilson, Inc.Hand Auger
0
20 40 60 80
100
October 2012 24-1-03734-001
Gro
und
Wat
er Hammer Wt. & Drop:
Geotechnical and Environmental Consultants
Hole Diam.:Rod Type:Hammer Type:
FIG. C5
Typ
: M
AS
LEGEND
Sym
bol
NOTES
Total Depth:Top Elevation:Vert. Datum:Horiz. Datum:
(blows/ft.)
0 100
140 lbs / 30 inches
Dep
th, f
t.
Drilling Method:Drilling Company:Drill Rig Equipment:Other Comments:
Northing:Easting:Station:Offset:
Sample Not Recovered*
20 40 60 80
LOG OF BORING HA-4
SOIL DESCRIPTION
Iron Mountain Sanitary Sewer and Pedestrian BridgeLake Oswego, Oregon
Elev.Depth
(ft.)
1. Refer to KEY for explanation of symbols, codes, abbreviations and definitions.
2. Groundwater level, if indicated above, is for the date specified and may vary.
3. Group symbol is based on visual-manual identification and selected lab testing.
4. The hole location and elevation should be considered approximate.
6.1 ft.115.0 ft.
project specificproject specific
4,993.1 ft.4,980.8 ft.
n/an/a
Jar Sample
MA
ST
ER
_LO
G_E
24-
1-03
734
-00
1.G
PJ
SH
AN
_WIL
.GD
T 4
/1/1
4
Liquid LimitNatural Water Content
Plastic Limit
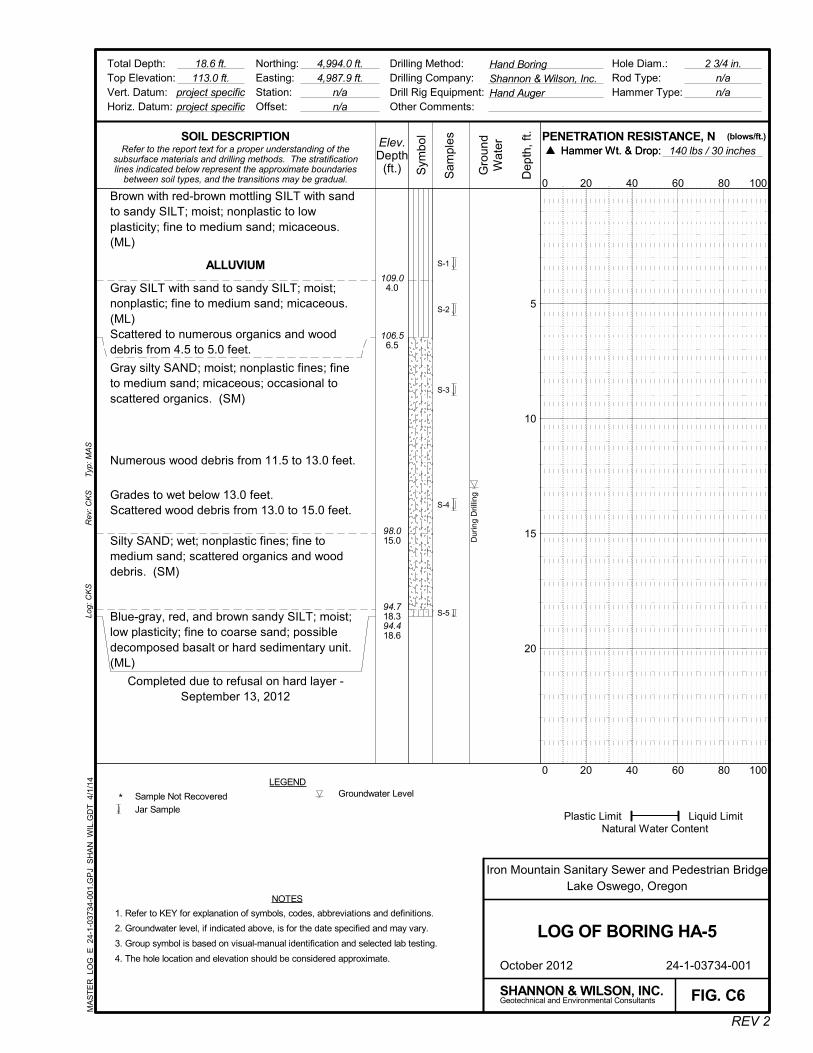
Dur
ing
Dril
ling
Brown with red-brown mottling SILT with sandto sandy SILT; moist; nonplastic to lowplasticity; fine to medium sand; micaceous.(ML)
ALLUVIUM
Gray SILT with sand to sandy SILT; moist;nonplastic; fine to medium sand; micaceous.(ML)Scattered to numerous organics and wooddebris from 4.5 to 5.0 feet.
Gray silty SAND; moist; nonplastic fines; fineto medium sand; micaceous; occasional toscattered organics. (SM)
Numerous wood debris from 11.5 to 13.0 feet.
Grades to wet below 13.0 feet.Scattered wood debris from 13.0 to 15.0 feet.
Silty SAND; wet; nonplastic fines; fine tomedium sand; scattered organics and wooddebris. (SM)
Blue-gray, red, and brown sandy SILT; moist;low plasticity; fine to coarse sand; possibledecomposed basalt or hard sedimentary unit.(ML)
Completed due to refusal on hard layer -September 13, 2012
S-1
S-2
S-3
S-4
S-5
109.04.0
106.56.5
98.015.0
94.718.394.418.6
Sam
ples
Refer to the report text for a proper understanding of thesubsurface materials and drilling methods. The stratificationlines indicated below represent the approximate boundaries
between soil types, and the transitions may be gradual.
Hammer Wt. & Drop:
2 3/4 in.n/an/a
Rev
: CK
SLo
g: C
KS
SHANNON & WILSON, INC.
PENETRATION RESISTANCE, N
5
10
15
20
REV 2
Hand BoringShannon & Wilson, Inc.Hand Auger
0
20 40 60 80
100
October 2012 24-1-03734-001
Gro
und
Wat
er Hammer Wt. & Drop:
Geotechnical and Environmental Consultants
Hole Diam.:Rod Type:Hammer Type:
FIG. C6
Typ
: M
AS
LEGEND
Sym
bol
NOTES
Total Depth:Top Elevation:Vert. Datum:Horiz. Datum:
(blows/ft.)
0 100
140 lbs / 30 inches
Dep
th, f
t.
Drilling Method:Drilling Company:Drill Rig Equipment:Other Comments:
Northing:Easting:Station:Offset:
Groundwater LevelSample Not Recovered*
20 40 60 80
LOG OF BORING HA-5
SOIL DESCRIPTION
Iron Mountain Sanitary Sewer and Pedestrian BridgeLake Oswego, Oregon
Elev.Depth
(ft.)
1. Refer to KEY for explanation of symbols, codes, abbreviations and definitions.
2. Groundwater level, if indicated above, is for the date specified and may vary.
3. Group symbol is based on visual-manual identification and selected lab testing.
4. The hole location and elevation should be considered approximate.
18.6 ft.113.0 ft.
project specificproject specific
4,994.0 ft.4,987.9 ft.
n/an/a
Jar Sample
MA
ST
ER
_LO
G_E
24-
1-03
734
-00
1.G
PJ
SH
AN
_WIL
.GD
T 4
/1/1
4
Liquid LimitNatural Water Content
Plastic Limit
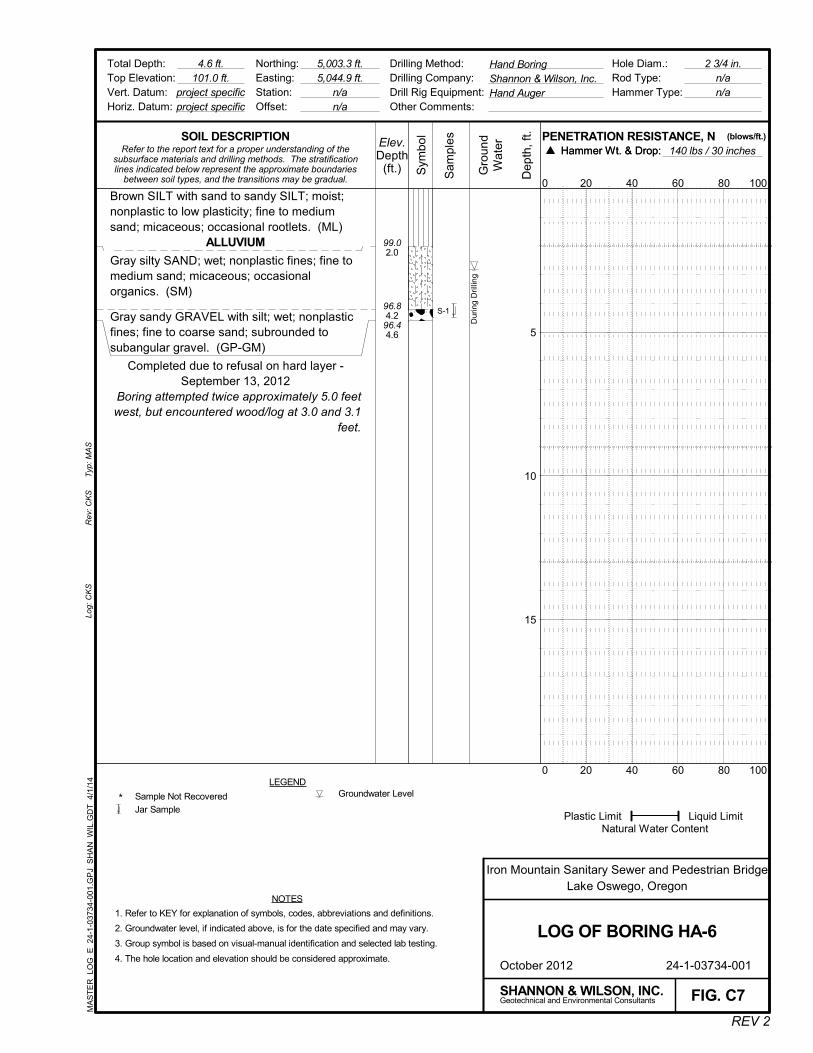
Dur
ing
Dril
ling
Brown SILT with sand to sandy SILT; moist;nonplastic to low plasticity; fine to mediumsand; micaceous; occasional rootlets. (ML)
ALLUVIUM
Gray silty SAND; wet; nonplastic fines; fine tomedium sand; micaceous; occasionalorganics. (SM)
Gray sandy GRAVEL with silt; wet; nonplasticfines; fine to coarse sand; subrounded tosubangular gravel. (GP-GM)
Completed due to refusal on hard layer -September 13, 2012
Boring attempted twice approximately 5.0 feetwest, but encountered wood/log at 3.0 and 3.1
feet.
S-1
99.02.0
96.84.2
96.44.6
Sam
ples
Refer to the report text for a proper understanding of thesubsurface materials and drilling methods. The stratificationlines indicated below represent the approximate boundaries
between soil types, and the transitions may be gradual.
Hammer Wt. & Drop:
2 3/4 in.n/an/a
Rev
: CK
SLo
g: C
KS
SHANNON & WILSON, INC.
PENETRATION RESISTANCE, N
5
10
15
REV 2
Hand BoringShannon & Wilson, Inc.Hand Auger
0
20 40 60 80
100
October 2012 24-1-03734-001
Gro
und
Wat
er Hammer Wt. & Drop:
Geotechnical and Environmental Consultants
Hole Diam.:Rod Type:Hammer Type:
FIG. C7
Typ
: M
AS
LEGEND
Sym
bol
NOTES
Total Depth:Top Elevation:Vert. Datum:Horiz. Datum:
(blows/ft.)
0 100
140 lbs / 30 inches
Dep
th, f
t.
Drilling Method:Drilling Company:Drill Rig Equipment:Other Comments:
Northing:Easting:Station:Offset:
Groundwater LevelSample Not Recovered*
20 40 60 80
LOG OF BORING HA-6
SOIL DESCRIPTION
Iron Mountain Sanitary Sewer and Pedestrian BridgeLake Oswego, Oregon
Elev.Depth
(ft.)
1. Refer to KEY for explanation of symbols, codes, abbreviations and definitions.
2. Groundwater level, if indicated above, is for the date specified and may vary.
3. Group symbol is based on visual-manual identification and selected lab testing.
4. The hole location and elevation should be considered approximate.
4.6 ft.101.0 ft.
project specificproject specific
5,003.3 ft.5,044.9 ft.
n/an/a
Jar Sample
MA
ST
ER
_LO
G_E
24-
1-03
734
-00
1.G
PJ
SH
AN
_WIL
.GD
T 4
/1/1
4
Liquid LimitNatural Water Content
Plastic Limit

24-1-03734-002
APPENDIX D
IMPORTANT INFORMATION ABOUT YOUR GEOTECHNICAL/ENVIRONMENTAL REPORT
SHANNON & WILSON, INC.Geotechnical and Environmental Consultants
Attachment to and part of Report 24-1-03734-002 Geotechnical Engineering Report: Iron Mountain Sanitary Sewer and Pedestrian Bridge
Date: March 2015 To: Otak, Inc. Attn: Ian Machan, PE
IMPORTANT INFORMATION ABOUT YOUR GEOTECHNICAL/ENVIRONMENTAL REPORT
CONSULTING SERVICES ARE PERFORMED FOR SPECIFIC PURPOSES AND FOR SPECIFIC CLIENTS.
Consultants prepare reports to meet the specific needs of specific individuals. A report prepared for a civil engineer may not be adequate for a construction contractor or even another civil engineer. Unless indicated otherwise, your consultant prepared your report expressly for you and expressly for the purposes you indicated. No one other than you should apply this report for its intended purpose without first conferring with the consultant. No party should apply this report for any purpose other than that originally contemplated without first conferring with the consultant.
THE CONSULTANT'S REPORT IS BASED ON PROJECT-SPECIFIC FACTORS.
A geotechnical/environmental report is based on a subsurface exploration plan designed to consider a unique set of project-specific factors. Depending on the project, these may include: the general nature of the structure and property involved; its size and configuration; its historical use and practice; the location of the structure on the site and its orientation; other improvements such as access roads, parking lots, and underground utilities; and the additional risk created by scope-of-service limitations imposed by the client. To help avoid costly problems, ask the consultant to evaluate how any factors that change subsequent to the date of the report may affect the recommendations. Unless your consultant indicates otherwise, your report should not be used: (1) when the nature of the proposed project is changed (for example, if an office building will be erected instead of a parking garage, or if a refrigerated warehouse will be built instead of an unrefrigerated one, or chemicals are discovered on or near the site); (2) when the size, elevation, or configuration of the proposed project is altered; (3) when the location or orientation of the proposed project is modified; (4) when there is a change of ownership; or (5) for application to an adjacent site. Consultants cannot accept responsibility for problems that may occur if they are not consulted after factors which were considered in the development of the report have changed.
SUBSURFACE CONDITIONS CAN CHANGE.
Subsurface conditions may be affected as a result of natural processes or human activity. Because a geotechnical/environmental report is based on conditions that existed at the time of subsurface exploration, construction decisions should not be based on a report whose adequacy may have been affected by time. Ask the consultant to advise if additional tests are desirable before construction starts; for example, groundwater conditions commonly vary seasonally.
Construction operations at or adjacent to the site and natural events such as floods, earthquakes, or groundwater fluctuations may also affect subsurface conditions and, thus, the continuing adequacy of a geotechnical/environmental report. The consultant should be kept apprised of any such events, and should be consulted to determine if additional tests are necessary.
MOST RECOMMENDATIONS ARE PROFESSIONAL JUDGMENTS.
Site exploration and testing identifies actual surface and subsurface conditions only at those points where samples are taken. The data were extrapolated by your consultant, who then applied judgment to render an opinion about overall subsurface conditions. The actual interface between materials may be far more gradual or abrupt than your report indicates. Actual conditions in areas not sampled may differ from those predicted in your report. While nothing can be done to prevent such situations, you and your consultant can work together to help reduce their impacts. Retaining your consultant to observe subsurface construction operations can be particularly beneficial in this respect.
Page 1 of 2 1/2014

Page 2 of 2 1/2014
A REPORT'S CONCLUSIONS ARE PRELIMINARY.
The conclusions contained in your consultant's report are preliminary because they must be based on the assumption that conditions revealed through selective exploratory sampling are indicative of actual conditions throughout a site. Actual subsurface conditions can be discerned only during earthwork; therefore, you should retain your consultant to observe actual conditions and to provide conclusions. Only the consultant who prepared the report is fully familiar with the background information needed to determine whether or not the report's recommendations based on those conclusions are valid and whether or not the contractor is abiding by applicable recommendations. The consultant who developed your report cannot assume responsibility or liability for the adequacy of the report's recommendations if another party is retained to observe construction.
THE CONSULTANT'S REPORT IS SUBJECT TO MISINTERPRETATION.
Costly problems can occur when other design professionals develop their plans based on misinterpretation of a geotechnical/environmental report. To help avoid these problems, the consultant should be retained to work with other project design professionals to explain relevant geotechnical, geological, hydrogeological, and environmental findings, and to review the adequacy of their plans and specifications relative to these issues.
BORING LOGS AND/OR MONITORING WELL DATA SHOULD NOT BE SEPARATED FROM THE REPORT.
Final boring logs developed by the consultant are based upon interpretation of field logs (assembled by site personnel), field test results, and laboratory and/or office evaluation of field samples and data. Only final boring logs and data are customarily included in geotechnical/environmental reports. These final logs should not, under any circumstances, be redrawn for inclusion in architectural or other design drawings, because drafters may commit errors or omissions in the transfer process. To reduce the likelihood of boring log or monitoring well misinterpretation, contractors should be given ready access to the complete geotechnical engineering/environmental report prepared or authorized for their use. If access is provided only to the report prepared for you, you should advise contractors of the report's limitations, assuming that a contractor was not one of the specific persons for whom the report was prepared, and that developing construction cost estimates was not one of the specific purposes for which it was prepared. While a contractor may gain important knowledge from a report prepared for another party, the contractor should discuss the report with your consultant and perform the additional or alternative work believed necessary to obtain the data specifically appropriate for construction cost estimating purposes. Some clients hold the mistaken impression that simply disclaiming responsibility for the accuracy of subsurface information always insulates them from attendant liability. Providing the best available information to contractors helps prevent costly construction problems and the adversarial attitudes that aggravate them to a disproportionate scale.
READ RESPONSIBILITY CLAUSES CLOSELY.
Because geotechnical/environmental engineering is based extensively on judgment and opinion, it is far less exact than other design disciplines. This situation has resulted in wholly unwarranted claims being lodged against consultants. To help prevent this problem, consultants have developed a number of clauses for use in their contracts, reports and other documents. These responsibility clauses are not exculpatory clauses designed to transfer the consultant's liabilities to other parties; rather, they are definitive clauses that identify where the consultant's responsibilities begin and end. Their use helps all parties involved recognize their individual responsibilities and take appropriate action. Some of these definitive clauses are likely to appear in your report, and you are encouraged to read them closely. Your consultant will be pleased to give full and frank answers to your questions. The preceding paragraphs are based on information provided by the ASFE/Association of Engineering Firms Practicing in the Geosciences, Silver Spring, Maryland


