
Surendran, P. et al. (2016) Trans-ancestry meta-analyses identify rare and common variants associated with blood pressure and hypertension. Nature
Genetics, 48(10), pp. 1151-1161. (doi:10.1038/ng.3654) This is the author’s final accepted version. There may be differences between this version and the published version. You are advised to consult the publisher’s version if you wish to cite from
it.
http://eprints.gla.ac.uk/121726/
Deposited on: 4 August 2016
Enlighten – Research publications by members of the University of Glasgow http://eprints.gla.ac.uk

Large scale trans-ethnic meta-analyses identify novel rare and common variants
associated with blood pressure and hypertension
Praveen Surendran 1*, Fotios Drenos 2,3*, Robin Young 1*, Helen Warren 4,5*, James P Cook 6,7*, Alisa K Manning 8,9,10*, Niels Grarup 11*, Xueling Sim 12,13*, Daniel R Barnes 1, Kate Witkowska 4,5, James R Staley 1, Vinicius Tragante 14, Taru Tukiainen 8,9,15, Hanieh Yaghootkar 16, Nicholas Masca 17,18, Daniel Freitag 1, Teresa Ferreira 19, Olga Giannakopoulou 20, Andrew Tinker 20,5, Magdalena Harakalova 14, Evelin Mihailov 21, Chunyu Liu 22, Aldi T Kraja 23, Sune Fallgaard Nielsen 24, Asif Rasheed 25, Maria Samuel 25, Wei Zhao 26, Lori L Bonnycastle 27, Anne U Jackson 12, Narisu Narisu 27, Amy J Swift 27, Lorraine Southam 28,19, Jonathan Marten 29, Jeroen R Huyghe 12, Alena Stancáková 30, Cristiano Fava 31,32, Therese Ohlsson 31, Angela Matchan 28, Kathleen E Stirrups 33,34, Jette Bork-Jensen 11, Anette P Gjesing 11, Jukka Kontto 35, Markus Perola 35,36, Susan Shaw-Hawkins 4, Aki S Havulinna 35, He Zhang 37, Louise A Donnelly 38, Christopher Groves 39, N William Rayner 39, Matt J Neville 39,40, Neil R Robertson 19,39, Andrianos M Yiorkas 41, Karl-Heinz Herzig 42,43, Eero Kajantie 44,45,46, Weihua Zhang 47,48, Sara M Willems 49, Lars Lannfelt 50, Giovanni Malerba 51, Nicole Soranzo 28, Elisabetta Trabetti 51, Niek Verweij 52, Evangelos Evangelou 47,53, Alireza Moayyeri 47,54, Anne-Claire Vergnaud 47, Christopher P Nelson 17,18, Alaitz Poveda 55,56, Tibor V Varga 55, Muriel Caslake 57, Anton JM de’Craen 58, Stella Trompet 58,59, Jian’an Luan 49, Robert A Scott 49, Sarah E Harris 60,61, David CM Liewald 60,62, Riccardo Marioni 60,61,63, Cristina Menni 64, Aliki-Eleni Farmaki 65, Göran Hallmans 66, Frida Renström 55,66, Jennifer E Huffman 29,22, Maija Hassinen 67, Stephen Burgess 1, Ramachandran S Vasan 68,69, Janine F Felix 70, CHARGE-Heart Failure Consortium , Maria Uria-Nickelsen 71, Anders Malarstig 72, Dermot F Reily 73, Maarten Hoek 74, Thomas Vogt 74, Honghuang Lin 68,75, Wolfgang Lieb 76, EchoGen Consortium , Matthew Traylor 77, Hugh Markus 77, METASTROKE Consortium , Heather M Highland 78, Anne E Justice 78, Eirini Marouli 79, GIANT Consortium , Jaana Lindström 80, Matti Uusitupa 81,82, Pirjo Komulainen 67, Timo A Lakka 67,83, Rainer Rauramaa 67,84, Ozren Polasek 85,86, Igor Rudan 85, Olov Rolandsson 87, Paul W Franks 55,87,88, George Dedoussis 65, Timothy D Spector 64, EPIC-InterAct Consortium , Pekka Jousilahti 35, Satu Männistö 35, Ian J Deary 60,62, John M Starr 60,89, Claudia Langenberg 49, Nick J Wareham 49, Morris J Brown 90, Anna F Dominiczak 91, John M Connell 38, J Wouter Jukema 59,92, Naveed Sattar 57, Ian Ford 57, Chris J Packard 57, Tõnu Esko 21,93,8,9, Reedik Mägi 21, Andres Metspalu 21,94, Rudolf A de Boer 95, Peter van der Meer 95, Pim van der Harst 95,96,97, Lifelines Cohort Study 98, Giovanni Gambaro 99, Erik Ingelsson 100,101, Lars Lind 100, Paul IW de Bakker 102,103, Mattijs E Numan 104,103, Ivan Brandslund 105,106, Cramer Christensen 107, Eva RB Petersen 108, Eeva Korpi-Hyövälti 109, Heikki Oksa 110, John C Chambers 47,48,111, Jaspal S Kooner 48,112,111, Alexandra IF Blakemore 41,113, Steve Franks 114, Marjo-Riitta Jarvelin 115,116,117,118, Lise L Husemoen 119, Allan Linneberg 119,120,121, Tea Skaaby 119, Betina Thuesen 119, Fredrik Karpe 39,40, Jaakko Tuomilehto 35,122,123,124, Alex SF Doney 38, Andrew D Morris 125, Colin NA Palmer 38, Oddgeir Lingaas Holmen 126,127, Kristian Hveem 126,128, Cristen J Willer 37,129,130, Tiinamaija Tuomi 131, Leif Groop 132, AnneMari Käräjämäki 133, Aarno Palotie 15,9,134,135, Samuli Ripatti 134,136,28, Veikko Salomaa 35, Dewan S Alam 137, Abdulla al Shafi Majumder 138, Emanuele Di Angelantonio 1, Rajiv Chowdhury 1, Mark I McCarthy 39,40,19, Neil Poulter 139, Alice V Stanton 140, Peter Sever 139, Philippe Amouyel 141, Dominique Arveiler 142, Stefan Blankenberg 143,144, Jean Ferrières 145, Frank Kee 146, Kari Kuulasmaa 35, Martina Müller-Nurasyid 147,148,149, Giovanni Veronesi 150, Jarmo Virtamo 35, Panos Deloukas 33,151, WTCCC , Paul Elliott 115, Understanding Society Scientific Group , Eleftheria Zeggini 28, Sekar Kathiresan 152,153,154,9, Olle Melander 31, Johanna Kuusisto 30, Markku Laakso 30, Sandosh Padmanabhan 91, David Porteous 61, Caroline Hayward 29, Generation Scotland 155, Francis S Collins 27, Karen L Mohlke 156, Torben Hansen 11, Oluf Pedersen 11, Michael Boehnke 12, Heather M
1
Stringham 12, EPIC-CVD Consortium , Philippe Frossard 25, Christopher Newton-Cheh 152,153, CHARGE+ Consortium , Martin D Tobin 6, Børge Grønne Nordestgaard 24, T2D-GENES Consortium , GoT2DGenes Consortium , ExomeBP Consortium , CHD Exome+ Consortium , Mark J Caulfield 4,5, Anubha Mahajan 19, Andrew P Morris 19,7, Maciej Tomaszewski 17,18, Nilesh J Samani 17,18, Danish Saleheen 26,25,1*, Folkert W Asselbergs 14,97,157*, Cecilia M Lindgren 158,9,19*, John Danesh 1,28,159*, Louise V Wain 6*, Adam S Butterworth 1,159*, Joanna MM Howson 1*§, Patricia B Munroe 4,5*§
Corresponding authors: Joanna M M Howson, Patricia B Munroe. *contributed equally to this work. § jointly supervised the work
1. Cardiovascular Epidemiology Unit, Department of Public Health and Primary Care, University of Cambridge, Cambridge, UK 2. MRC Integrative Epidemiology Unit, School of Social and Community Medicine, University of Bristol, Oakfield House, Oakfield Grove, Bristol, BS8 2BN, UK 3. Centre for Cardiovascular Genetics, Institute of Cardiovascular Science, Rayne Building University College London, London WC1E 6JF, UK 4. Clinical Pharmacology, William Harvey Research Institute, Queen Mary University of London, London EC1M 6BQ, UK 5. NIHR Barts Cardiovascular Biomedical Research Unit, Queen Mary University of London, London EC1M 6BQ, UK 6. Department of Health Sciences, University of Leicester, Leicester LE1 7RH, UK 7. Department of Biostatistics, University of Liverpool, Liverpool L69 3GA, UK 8. Department of Genetics, Harvard Medical School, Boston, MA 02138, USA 9. Program in Medical and Population Genetics, Broad Institute, 7 Cambridge Center, Cambridge, MA, 02142, USA 10. Department of Molecular Biology, Massachusetts General Hospital, Boston, MA 02114, USA 11. The Novo Nordisk Foundation Center for Basic Metabolic Research, Faculty of Health and Medical Sciences, University of Copenhagen, Copenhagen, Denmark 12. Department of Biostatistics and Center for Statistical Genetics, University of Michigan, Ann Arbor, MI 48109, USA 13. Saw Swee Hock School of Public Health, National University of Singapore, Singapore 117597, Singapore 14. Department of Cardiology, University Medical Center Utrecht, Utrecht, The Netherlands 15. Analytic and Translational Genetics Unit, Department of Medicine, Massachusetts General Hospital, Boston, Massachusetts, USA 16. Genetics of Complex Traits, University of Exeter Medical School, University of Exeter, Exeter, UK 17. Department of Cardiovascular Sciences, University of Leicester, Leicester LE3 9QP, UK 18. NIHR Leicester Biomedical Research Unit in Cardiovascular Disease, Leicester LE3 9QP, UK 19. Wellcome Trust Centre for Human Genetics, Nuffield Department of Medicine, University of Oxford, Oxford OX3 7BN, UK
2
20. Heart Centre, William Harvey Research Institute, Barts and The London School of Medicine and Dentistry, Queen Mary University of London, London EC1M 6BQ, UK 21. Estonian Genome Center, University of Tartu, Tartu, 51010, Estonia 22. The Framingham Heart Study, NHLBI, Framingham, MA, USA 23. Division of Statistical Genomics, Department of Genetics & Center for Genome Sciences and Systems Biology, Washington University School of Medicine, St. Louis, MO, USA 24. Department of Clinical Biochemistry Herlev Hospital, Copenhagen University Hospital, Herlev Ringvej 74, DK-2730 Herlev, Denmark 25. Centre for Non-Communicable Diseases, Karachi, Pakistan 26. Department of Biostatistics and Epidemiology, Perelman School of Medicine, University of Pennsylvania, USA 27. Medical Genomics and Metabolic Genetics Branch, National Human Genome Research Institute, NIH, Bethesda, MD 20892, USA 28. Wellcome Trust Sanger Institute, Genome Campus, Hinxton CB10 1HH, UK 29. MRC Human Genetics Unit, MRC Institute of Genetics and Molecular Medicine, University of Edinburgh, Edinburgh EH4 2XU, UK 30. Department of Medicine, University of Eastern Finland and Kuopio University Hospital, 70210 Kuopio, Finland 31. University of Lund, Department of Clinical Sciences, Malmö, S-205 02, Sweden 32. University of Verona, Department of Medicine, Verona, 37134, Italy 33. William Harvey Research Institute, Barts and The London School of Medicine and Dentistry, Queen Mary University of London, London, UK 34. Department Haematology, University of Cambridge, Cambridge, UK 35. Department of Health, National Institute for Health and Welfare, FI-00271, Helsinki, Finland 36. Institute of Molecular Medicine FIMM, University of Helsinki, Finland 37. Department of Internal Medicine, Division of Cardiovascular Medicine, University of Michigan, Ann Arbor, Michigan, USA 38. Medical Research Institute, University of Dundee, Ninewells Hospital and Medical School, Dundee, DD1 9SY, UK 39. Oxford Centre for Diabetes, Endocrinology, and Metabolism, Radcliffe Department of Medicine, University of Oxford, Oxford OX3 7LE, UK 40. NIHR Oxford Biomedical Research Centre, Oxford University Hospital Trusts, Oxford OX3 7LE, UK 41. Section of Investigative Medicine, Imperial College London, London W12 0NN, UK 42. Institute of Biomedicine, Aapistie 7, Biocenter Oulu, P.O.Box 5000 FI-90014 University of Oulu, Finland 43. Department of Gastroenterology and Metabolism, Poznan University of Medical Sciences, Poznan, Poland 44. Division of Welfare and Health Promotion, Department of Chronic Disease Prevention, Diabetes Prevention Unit, National Institute for Health and Welfare, Helsinki, Finland 45. Hospital for Children and Adolescents, Helsinki University Central Hospital and University of Helsinki, Helsinki, Finland 46. Department of Obstetrics and Gynaecology, Oulu University Hospital and University of
3

Oulu, Oulu, Finland 47. Department of Epidemiology and Biostatistics, School of Public Health, Imperial College London, Norfolk Place, London W2 1PG, UK 48. Department of Cardiology, Ealing Hospital NHS Trust, Uxbridge Road, Southall, Middlesex, UB1 3EU, UK 49. MRC Epidemiology Unit, University of Cambridge School of Clinical Medicine, Box 285 Institute of Metabolic Science, Cambridge Biomedical Campus, Cambridge CB2 0QQ, UK 50. Department of Public Health and Caring Sciences, Uppsala University, Uppsala, Sweden 51. Section of Biology and Genetics, Department of Life and Reproduction Sciences, University of Verona, 37135 Verona, Italy 52. University Medical Center Groningen, University of Groningen, Department of Cardiology, The Netherlands 53. Department of Hygiene and Epidemiology, University of Ioannina Medical School, Ioannina, Greece 54. Farr Institute of Health Informatics Research, Institute of Health Informatics, University College London, London, UK 55. Department of Clinical Sciences, Genetic and Molecular Epidemiology Unit, Lund University, SE-20502, Malmö, Sweden 56. Department of Genetics, Physical Anthropology and Animal Physiology, Faculty of Science and Technology, University of the Basque Country (UPV/EHU), 48940, Bilbao, Spain 57. University of Glasgow, Glasgow, UK 58. Department of Gerontology and Geriatrics, Leiden University Medical Center, Leiden, The Netherlands 59. Department of Cardiology, Leiden University Medical Center, Leiden, The Netherlands 60. Centre for Cognitive Ageing and Cognitive Epidemiology, University of Edinburgh, Edinburgh, EH8 9JZ, UK 61. Centre for Genomic and Experimental Medicine, MRC Institute of Genetics and Molecular Medicine, University of Edinburgh, Edinburgh EH4 2XU, UK 62. Department of Psychology, University of Edinburgh, Edinburgh, EH8 9JZ, UK 63. Queensland Brain Institute, The University of Queensland, Brisbane, 4072, QLD, Australia 64. Department of Twin Research and Genetic Epidemiology, King’s College London, UK 65. Department of Nutrition and Dietetics, School of Health Science and Education, Harokopio, University, Athens, 17671, Greece 66. Department of Biobank Research, Umeå University, SE-90187, Umeå, Sweden 67. Kuopio Research Institute of Exercise Medicine, Kuopio, Finland 68. National Heart, Lung, and Blood Institute’s and Boston University’s Framingham Heart Study, Framingham, MA, USA 69. Sections of Cardiology, Preventive Medicine and Epidemiology, Department of Medicine, Boston University Schools of Medicine and Public Health, Boston, MA, USA 70. Department of Epidemiology, Erasmus MC, University Medical Center Rotterdam, Rotterdam, The Netherlands
4

71. Development Management and Planning, Pfizer Worldwide Research and Development, Boston, MA, USA. 72. Pfizer Worldwide Research and Development, Stockholm, Sweden 73. Genetics and Pharmacogenomics, Merck Research Laboratories, Boston, MA, USA. 74. Merck Research Laboratories, 2015 Galloping Hills Rd, Kenilworth, NJ 07033 75. Section of Computational Biomedicine, Department of Medicine, Boston University School of Medicine, Boston, MA, USA 76. Institute of Epidemiology and Biobank Popgen, Kiel University, Kiel, Germany 77. Neurology Unit, University of Cambridge, R3, Box 83, Cambridge Biomedical Campus, Cambridge, CB2 0QQ 78. University of North Carolina at Chapel Hill, Department of Epidemiololgy, Chapel Hill, NC 27599, US 79. William Harvey Research Institute, Barts and The London School of Medicine and Dentistry, Queen Mary University of London, EC1M 6BQ UK 80. National Institute for Health and Welfare, Diabetes Prevention Unit, Helsinki, Finland 81. Department of Public Health and Clinical Nutrition, University of Eastern Finland Finland 82. Research Unit, Kuopio University Hospital, Kuopio, Finland 83. Institute of Biomedicine/Physiology, University of Eastern Finland Kuopio Campus, Finland 84. Department of Clinical Physiology and Nuclear Medicine, Kuopio University Hospital, Kuopio, Finland 85. Centre for Population Health Sciences, University of Edinburgh, Teviot Place, Edinburgh, EH8 9AG, UK 86. Faculty of Medicine, University of Split, Croatia 87. Department of Public Health & Clinical Medicine, Umeå University, SE-90185, Umeå, Sweden 88. Department of Nutrition, Harvard School of Public Health, Boston, MA 02115, USA 89. Alzheimer Scotland Research Centre, University of Edinburgh, Edinburgh, EH8 9JZ, UK 90. Clinical Pharmacology Unit, University of Cambridge, Addenbrookes Hospital, Hills Road, Cambridge CB2 2QQ, UK 91. Institute of Cardiovascular and Medical Sciences, College of Medical, Veterinary and Life Sciences, University of Glasgow, Glasgow G12 8TA, UK 92. The Interuniversity Cardiology Institute of the Netherlands, Utrecht, The Netherlands 93. Division of Endocrinology, Boston Children’s Hospital, Boston, MA 02115, USA 94. Institute of Molecular and Cell Biology, Tartu, 51010, Estonia 95. University Medical Center Groningen, University of Groningen, Department of Cardiology, P.O. Box 30.001, 9700 RB Groningen, The Netherlands 96. University of Groningen, University Medical Center Groningen, Department of Genetics, Groningen, The Netherlands 97. Durrer Center for Cardiogenetic Research, ICIN-Netherlands Heart Institute, Utrecht, The Netherlands 98. Lifelines Cohort Study and Biobank, The Netherlands 99. Division of Nephrology, Department of Internal Medicine and Medical Specialties,
5
Columbus - Gemelli University Hospital, Catholic University, Via Moscati 31/33, 00176 Rome, Italy 100. Department of Medical Sciences, Molecular Epidemiology and Science for Life Laboratory, Uppsala University, Uppsala, Sweden 101. Department of Medicine, Division of Cardiovascular Medicine, Stanford University School of Medicine, Stanford, CA 94305, USA 102. Department of Medical Genetics, Center of Molecular Medicine, University Medical Center Utrecht, Utrecht, The Netherlands 103. Department of Epidemiology, Julius Center for Health Sciences and Primary Care, University Medical Center Utrecht, Utrecht, The Netherlands 104. Department of Public Health and Primary Care, Leiden University Medical Center, Leiden, The Netherlands 105. Department of Clinical Biochemistry, Lillebaelt Hospital, Vejle, Denmark 106. Institute of Regional Health Research, University of Southern Denmark, Odense, Denmark 107. Medical Department, Lillebaelt Hospital, Vejle, Denmark 108. Department of Clinical Immunology and Biochemistry, Lillebaelt Hospital, Vejle, Denmark 109. South Ostrobothnia Central Hospital, Seinäjoki, Finland 110. Tampere University Hospital, Tampere, Finland 111. Imperial College Healthcare NHS Trust, London, UK 112. National Heart and Lung Institute, Imperial College London, Hammersmith Hospital Campus, Ducane Road, London W12 0NN, UK 113. Department of Life Sciences, Brunel University, London, UK 114. Institute of Reproductive and Developmental Biology, Imperial College London, London W12 0NN, UK 115. Department of Epidemiology and Biostatistics, MRC PHE Centre for Environment & Health, School of Public Health, Faculty of Medicine, Imperial College London, St. Mary’s Campus, Norfolk Place, London, W2 1PG, UK 116. Centre for Life Course Epidemiology, Faculty of Medicine, P.O.Box 5000, FI-90014 University of Oulu, Finland 117. Biocenter Oulu, P.O.Box 5000, Aapistie 5A, FI-90014 University of Oulu, Finland 118. Unit of Primary Care, Oulu University Hospital, Kajaanintie 50, P.O.Box 20, FI-90220 Oulu, 90029 OYS, Finland 119. Research Centre for Prevention and Health, Capital Region of Denmark, Copenhagen, Denmark 120. Department of Clinical Experimental Research, Glostrup University Hospital, Glostrup, Denmark 121. Department of Clinical Medicine, Faculty of Health and Medical Sciences, University of Copenhagen, Copenhagen, Denmark 122. South Ostrobothnia Central Hospital, 60220 Seinäjoki, Finland 123. Red RECAVA Grupo RD06/0014/0015, Hospital Universitario La Paz, 28046 Madrid, Spain 124. Centre for Vascular Prevention, Danube-University Krems, 3500 Krems, Austria
6
125. School of Molecular, Genetic and Population Health Sciences, University of Edinburgh, Medical School, Teviot Place, Edinburgh, EH8 9AG, UK 126. HUNT Research Centre, Department of Public Health and General Practice, Norwegian University of Science and Technology, Levanger, Norway 127. St. Olav Hospital, Trondheim University Hospital, Trondheim, Norway 128. Department of Medicine, Levanger Hospital, Nord- Trøndelag Health Trust, Levanger, Norway 129. Department of Computational Medicine and Bioinformatics, University of Michigan, Ann Arbor, Michigan, USA 130. Department of Human Genetics, University of Michigan, Ann Arbor, Michigan, USA 131. Folkhälsan Research Centre, Helsinki, Finland; Department of Endocrinology, Helsinki University Central Hospital, Helsinki, Finland 132. Department of Clinical Sciences, Diabetes and Endocrinology, Lund University Diabetes Centre, Malmö, Sweden. 133. Department of Primary Health Care, Vaasa Central Hospital, Hietalahdenkatu 2-4, 65 130 Vaasa, Finland; Diabetes Center, Vaasa Health Care Center, Sepänkyläntie 14-16, 65 100 Vaasa, Finland 134. Institute for Molecular Medicine Finland University of Helsinki, Helsinki, Finland 135. Psychiatric & Neurodevelopmental Genetics Unit, Department of Psychiatry, Massachusetts General Hospital, Boston, Massachusetts, USA 136. Department of Public Health, University of Helsinki, Finland 137. ICDDR, B; Mohakhali, Dhaka 1212, Bangladesh 138. National Institute of Cardiovascular Diseases, Sher-e-Bangla Nagar, Dhaka, Bangladesh 139. International Centre for Circulatory Health, Imperial College London, W2 1PG, UK 140. Molecular and Cellular Therapeutics, Royal College of Surgeons in Ireland, Dublin 2, Ireland 141. Department of Epidemiology and Public Health, Institut Pasteur de Lille, Lille, France 142. Department of Epidemiology and Public Health, EA 3430, University of Strasbourg, Strasbourg, F- 67085, France 143. Department of General and Interventional Cardiology, University Heart Center Hamburg, Germany 144. University Medical Center Hamburg-Eppendorf, Hamburg, Germany 145. Department of Epidemiology, UMR 1027- INSERM, Toulouse University-CHU Toulouse, Toulouse, France 146. Director, UKCRC Centre of Excellence for Public Health, Queens University, Belfast, Northern Ireland 147. Institute of Genetic Epidemiology, Helmholtz Zentrum München - German Research Center for Environmental Health, Neuherberg, Germany 148. Department of Medicine I, Ludwig-Maximilians-University Munich, Munich, Germany 149. DZHK (German Centre for Cardiovascular Research), partner site Munich Heart Alliance, Munich, Germany 150. Research Center in Epidemiology and Preventive Medicine, Dept. of Clinical and Experimental Medicine, University of Insubria, Via Rossi, 9 21100 Varese - Italy 151. Princess Al-Jawhara Al-Brahim Centre of Excellence in Research of Hereditary
7
Disorders (PACER-HD), King Abdulaziz University, Jeddah 21589, Saudi Arabia 152. Center for Human Genetic Research, Massachusetts General Hospital, Boston, Massachusetts, 02114, USA 153. Cardiovascular Research Center, Massachusetts General Hospital, Boston, Massachusetts, 02114, USA 154. Department of Medicine, Harvard Medical School, Boston, Massachusetts, 02115, USA 155. A Collaboration between the University Medical Schools and NHS, Aberdeen, Dundee, Edinburgh and Glasgow, UK 156. Department of Genetics, University of North Carolina, Chapel Hill, NC 27599, USA 157. Faculty of Population Health Sciences, Institute of Cardiovascular Science, University College London, London, UK 158. The Big Data Institute at the Li Ka Shing Centre for Health Information and Discovery, University of Oxford, Oxford OX3 7BN, UK 159. The National Institute for Health Research Blood and Transplant Research
8

Abstract
High blood pressure is a major risk factor for cardiovascular disease and premature death.
However, there is limited knowledge on specific causal genes and pathways. To better
understand the genetics of blood pressure we genotyped 242,296 rare, low-frequency and
common genetic variants in up to ~192,000 individuals, and used ~155,063 samples for
independent replication. We identified 31 novel blood pressure or hypertension associated
genetic regions in the general population, including three rare missense variants in RBM47,
COL21A1 and RRAS with larger effects (>1.5mmHg/allele) than common variants. Multiple
rare, nonsense and missense variant associations were found in A2ML1 and a low-frequency
nonsense variant in ENPEP was identified. Our data extend the spectrum of allelic variation
underlying blood pressure traits and hypertension, provide new insights into the
pathophysiology of hypertension, and indicate new targets for clinical intervention.
9
High blood pressure (BP) or hypertension is a highly prevalent chronic disorder. It is
estimated to be responsible for a larger proportion of global disease burden and premature
mortality than any other disease risk factor1. Elevated systolic and/or diastolic BP increases
the risk of several cardiovascular disorders including stroke, coronary heart disease (CHD),
heart failure, peripheral arterial disease and abdominal aortic aneurysms2. BP is a complex,
heritable, polygenic phenotype for which genome-wide association studies (GWAS) have
identified over 67 genetic regions associated with BP and/or hypertension to date3-11. These
variants are common (minor allele frequency, MAF > 0.05), mostly map to intronic or
intergenic regions, with the causal alleles and genes not readily identified due to linkage
disequilibrium (LD) 4,5, and explain only ~2% of trait variance . Low-frequency (0.01 <
MAF < 0.05) and rare (MAF ≤ 0.01) single nucleotide variants (SNVs), predominantly
unexplored by GWAS may have larger phenotypic effects than common SNVs13, and may
help to explain the missing heritability, and identify causative genes as demonstrated
previously .
To identify novel coding variants and loci influencing BP traits and hypertension we
performed the largest meta-analysis to date that included a total of ~350,000 individuals,
directly genotyped with the Exome chip. The Exome chip contains ~240,000 mostly rare and
low-frequency variants (Methods). A single-variant discovery analysis was performed, and
candidate SNVs were taken forward for validation using independent replication samples.
Gene-based tests were used to identify BP associated genes harboring multiple rare variant
associations. We next assessed whether the newly identified BP associated SNVs were
associated with expression levels of nearby genes, and tested these variants in aggregate for a
causal association of BP with other cardiovascular traits and risk factors. Our findings
highlight the contribution of rare variants in the aetiology of blood pressure in the general
population, and provide new insights into the pathophysiology of hypertension.
10

Results
Discovery of single variant BP associations
We genotyped 192,763 individuals from 51 studies, and assessed association of 242,296
SNVs with diastolic BP (DBP), systolic BP (SBP), pulse pressure (PP) and hypertension
(HTN; Supplementary Tables 1, 2 and 3; Methods; Supplementary Information). An
overview of the SNV discovery study design is given in Figure 1. A fixed effects meta-
analysis for each trait was performed using study-level association summary statistics from i)
samples of European (EUR) ancestry (up to 165,276 individuals), and ii) a trans-ethnic meta-
analysis of the EUR and additional South Asian (SAS) ancestry samples (EUR_SAS; up to
192,763 individuals). Two analyses of DBP, SBP and PP were performed, one in which the
trait was inverse normal transformed and a second in which the raw phenotype was analysed.
Both sets of results were consistent (Methods), therefore to minimise sensitivity to deviations
from normality in the analysis of rare variants, the results from the analyses of the
transformed traits were used for discovery. Strong correlations between the BP traits were
observed across studies (Methods), hence no adjustment of significance thresholds for
independent trait testing was applied.
The discovery meta-analyses identified 50 genomic regions with genome-wide significant
(GWS) evidence of association with at least one of the four BP traits tested (P<5x10⁻⁸;
Supplementary Table 4). There were 45 regions associated in the EUR_SAS samples, of
which 13 were novel (Figure 2). An additional five regions were GWS in the EUR only meta-
analyses of which two were novel (Supplementary Figure 1). In total, 16 genomic regions
were identified that were GWS for at least one BP trait that have not been previously
reported.
11

Replication of single variant BP associations
Next we sought support for our findings, in an independent replication dataset comprising of
18 studies, 16 of which were from the Cohorts for Heart and Aging Research in Genomic
Epidemiology+ (CHARGE+) consortium (Figure 1; Supplementary Information; Liu et al.
Nature Genetics, submitted). Variants were selected for replication first using the larger
(transformed) EUR_SAS data, with additional variants from the (transformed) EUR data also
selected. SNVs were selected if they mapped outside of known BP genomic regions and had
MAF ≥ 0.05 and P < 1x10⁻⁵ or MAF < 0.05 and P < 1x10⁻⁴ with at least one BP trait, i.e.
choosing a lower significance threshold for the selection of rare variants (full details of the
selection criteria are provided in the Methods). In total 81 candidate SNVs were selected for
replication (Supplementary Table 5). Eighty variants were selected from EUR_SAS
(transformed) results and one SNV at the ZNF101 locus from the EUR (transformed)
analyses. The results for EUR_SAS and EUR were consistent (association statistics were
correlated, ρ=0.9 across ancestries for each of the traits). Of the 81 variants, 30 SNVs were
selected for association with DBP as the primary trait, 26 for SBP, 19 for PP and 6 for HTN,
with the primary trait defined as the BP trait with the smallest association P-value in the
EUR-SAS discovery analyses.
Meta-analyses were performed on results from analyses of untransformed DBP, SBP, PP and
HTN (as only results of untransformed traits were available from CHARGE+) in (i) up to
125,713 individuals of EUR descent, and (ii) up to 155,063 individuals of multiple ethnicities
(4,632 of Hispanic descent, 22,077 of African American descent, 2,641 SAS samples with the
remainder EUR; Figure 1; Supplementary Information). Given that a large proportion of the
ancestries in the trans-ethnic meta-analyses were not included in our discovery samples, we
12

used the EUR meta-analyses as the main data set for replication, but we also report any
additional associations identified within the larger trans-ethnic dataset.
Novel BP-SNV associations were identified based on two criteria (Figure 1; Methods).
Firstly, replication of the primary BP trait-SNV association was sought at a Bonferroni
adjusted P-value threshold in the replication data (P≤6.17x10⁻⁴, assuming α=0.05 for 81
SNVs tested and same direction of effect; Methods) without the need for GWS. Secondly,
meta-analyses of discovery and replication results across all four (untransformed) BP traits
were performed to assess the overall level of support across all samples for the 81 candidate
SNVs; those BP-SNV associations that were GWS (with statistical support in the replication
studies; P<0.05 and the same direction of effect) were also declared as novel.
Seventeen SNV-BP associations formally replicated with concordant direction of effect at a
Bonferroni adjusted significance level for the primary trait. Fourteen were in the EUR meta-
analyses, and amongst these was a rare non-synonymous (ns) SNV mapping to COL21A1
(Table 1a, Supplementary Table 6). Three associations were in the trans-ethnic meta-
analyses, these included two rare nsSNVs in RBM47 and RRAS (Table 1a, Supplementary
Table 7; Methods).
In addition to the 17 SNV-BP trait associations that formally replicated, we identified 13
further SNV-associations that were GWS in the combined (discovery and replication) meta-
analyses. Ten of these were GWS in the combined EUR analyses, (Table 1b; Supplementary
Tables 6 and 8a), and three were GWS in the combined trans-ethnic meta-analyses (Table 1b;
Supplementary Tables 7 and 8b).
13

This gives a total of 30 novel SNV-BP associations (15 SNV-DBP, 9 SNV-SBP and 6 SNV-
PP; Tables 1a and 1b; Supplementary Figures 2 and 3). Five of the SNVs were GWS with
more than one BP trait (Figure 3: Tables 1a and 1b; Supplementary Table 8). Four loci
(CERS5, TBX2, RGL3 and OBFC1) had GWS associations with HTN in addition to GWS
associations with DBP and SBP. The PRKAG1 locus had GWS associations with both SBP
and PP.
Conditional analyses were performed to identify secondary signals of association within the
novel BP loci. The RAREMETALWORKER (RMW) package (Methods) allows
conditional analyses to be performed using summary level data. Hence, analyses of the
transformed primary traits and HTN were re-run in RMW across the discovery studies
(Figure 4). The results of the RMW single variant tests were consistent with the initial
discovery analyses (Methods). Given that the RMW analyses are based on our discovery
samples, the larger EUR-SAS data was used as the main analysis to increase power, but we
also report any additional associations with evidence in EUR.
We identified secondary independent signals of association in four loci, PREX1, PRKAG1
and RRP1B within the EUR_SAS analyses and COL21A1 in the EUR analyses
(Pconditional<1x10⁻⁴; Methods; Supplementary Tables 9 and 10). Three independent association
signals were identified in the MYH6 locus in the EUR_SAS analyses (Supplementary Table
11).
Gene-based BP associations
To improve statistical power to detect associations in genes harbouring rare variants,
analytical methods that combine effects of variants across a gene into a single test have been
devised and are implemented in the RMW package 15. We applied the gene-based sequence
14

kernel association test (SKAT) 16 and Burden tests to the RMW dataset (MAF < 0.05 or
MAF < 0.01; Figure 4; Methods). One previously unidentified BP gene (A2ML1) was
associated with HTN (P= 7.73x10⁻⁷) in the EUR_SAS studies and also in EUR studies (Table
2; Bonferroni-corrected threshold of significance P <2.8x10⁻⁶, after adjusting for 17,996
genes tested, Methods). The gene showed residual association with the primary BP trait after
conditioning on the most associated SNV in the gene (Pconditional =5.00x10⁻⁴; Table 2),
suggesting that the association is due to multiple rare variants in the gene. One nonsense
variant (rs199651558, R893X, MAF=3.5x10⁻⁴) was observed, and there were multiple
missense variants (Figure 5). A2ML1 encodes alpha-2-macroglobulin-like 1 protein, and is a
member of the alpha macroglobulin superfamily, which comprises protease inhibitors
targeting a wide range of substrates. Mutations in this gene are associated with a disorder
clinically related to Noonan syndrome, a developmental disorder which involves cardiac
abnormalities18. We sought replication in the CHARGE+ studies for this gene, however there
was no evidence of association with HTN (P= 0.45). Given the very low frequencies of the
variants involved, however, studies in which the variants are polymorphic will be required to
replicate the association with HTN. The DBH gene was found to be associated with DBP
using the SKAT test (P=2.88x10⁻⁶). However, this was not due to multiple rare variants as the
association was driven by rs77273740 (Supplementary Table 5) and the SNV was not
validated in the replication samples.
Rare and common variant associations in established BP loci
Of the 67 established BP loci, 35 loci were on the Exome chip (N=43 SNVs or close proxies
r2>0.7). All 43 SNVs had at least nominal evidence of association with BP in our discovery
samples (P< 0.01; Supplementary Table 13). We also assessed if any of the established BP
loci contained coding variants that are associated with BP traits and in LD (r2>0.2) with the
15

known BP variants on the Exome chip (Supplementary Table 13), using the 1000G phase 3
release for LD annotation. Focusing on SNVs that were GWS for any BP trait from our
transformed discovery data for either ancestry, there were 25 coding variants, of which 6
were predicted to be damaging at loci labelled CDC25A, SLC39A8, HFE, ULK4, ST7L-
CAPZA1-MOV10 and CYP1A1-ULK3. Three of these are published variants at loci labelled
SLC39A8, HFE and ST7-CAPZA1-MOV10. At CYP1A1-ULK3, the coding variant was in
moderate LD with the reported variant, but was less significantly associated with DBP in our
EUR_SAS dataset (P=2.24x10⁻⁸ compared to P=1.68x10⁻¹⁵ for the published variant). At the
ULK4 locus the predicted damaging coding variant had similar association as the published
coding variant (predicted to be benign), and prior work has already indicated several
associated nsSNVs in strong LD in ULK4 . The nsSNV within the CDC25A locus
(rs11718350 in SPINK8) had similar association with DBP as the intergenic published SNV
in our EUR_SAS dataset (P=2.00x10⁻⁸ compared to P=2.27x10⁻⁸ for the published variant).
Overall at least 5 of the known loci are consistent with having a coding causal variant.
Gene-based SKAT tests of all genes that map within 1 Mb of a previously reported SNV
association (Supplementary Table 14), indicated no genes with multiple rare or low-
frequency variant associations. Single variant conditional analyses showed that rs33966350, a
rare nonsense variant in ENPEP (MAF=0.01) was associated with SBP (Pconditional = 1.61x10-
5) in the EUR_SAS samples (Supplementary Tables 14 and 15; Methods) independently of
the known SNV (rs6825911). ENPEP encodes aminopeptidase A (APA) an enzyme of the
renin-angiotensin-aldosterone system (RAAS) that converts angiotensin II (AngII) to AngIII.
There were no other established loci with convincing low-frequency or rare SNV associations
in the EUR_SAS samples. However, HOXC4, had evidence of a second independent signal
with a rare missense SNV in EUR samples (rs78731604; MAF = 0.005, Pconditional= 5.76x10⁻⁵;
Supplementary Table 15). The secondary signal in the HOXC4 region, mapped to
16

CALCOCO1, ~300kb from the known SNV. The gene association (MAF≤0.01, P=2.37x10⁻⁵)
was below the required significance threshold and attributable to rs78731604, which is not
predicted to have detrimental effects on protein structure. Therefore replication of this
association is required. Three loci (ST7L-CAPZA1-MOV10, FIGN-GRB14, and TBX5-TBX3)
had evidence of a second independent signal in the region in EUR_SAS samples with a
common variant (Pconditional<1x10⁻⁴; Supplementary Table 15) that has not been previously
reported.
Having identified 30 novel loci associated with BP traits, as well as additional new
independent SNVs at four novel loci and five known loci, we calculated the percent of the
trait variance explained (Methods). This was 2.08%/2.11%/1.15% for SBP/DBP/PP for the
43 previously reported BP-SNVs covered in our dataset, increasing to 3.38%/3.41%/2.08%
respectively with the inclusion of the 30 lead SNVs from novel loci, plus new independent
SNV-BP associations identified from novel and known loci.
Effect of BP SNVs on cardiovascular traits & risk factors
Amongst our novel BP-SNV associations, some have previously been reported to be
associated with other cardiovascular traits and risk factors (Supplementary Table 16); these
include coronary heart disease (CHD: PHACTR1, ABO) , QT interval (RNF207) , heart
rate (MYH6) , and cholesterol levels (2q36.3, ABO, ZNF101) .
To test the impact of BP variants on cardiovascular endpoints and risk factors we created
three weighted genetic risk scores (GRS) according to DBP/SBP/PP based on the newly
identified and previously published BP variants (up to N=125; Methods). The GRS models
were used to test the causal effect of BP on the following traits: ischemic stroke (including
17

the subtypes, cardiometabolic, large and small vessel ), CHD, heart failure, left ventricular
mass , left ventricular wall thickness , high-density lipoprotein cholesterol (HDL-c), low-
density lipoprotein (LDL-c), triglycerides, total cholesterol, body mass index (BMI), waist-
hip ratio adjusted BMI, height and estimated glomerular filtration rate (eGFR) (Methods). As
expected, BP was positively associated with increased CHD risk (OR [95% CI]=1.62 [1.28-
2.05] per 10mmHg increase in DBP, P=5.99x10⁻⁵; 1.39 [1.22-1.59] per 10mmHg increase in
SBP, P=6.07×10⁻⁷; 1.70 [1.34-2.16], per 10mmHg increase in PP, P=1.20x10⁻⁵; Table 3), and
increased risk of ischemic stroke (OR [95% CI]=1.93 [1.47-2.55] per 10mmHg increase in
DBP, P=2.81×10⁻⁶; 1.57 [1.35-1.84] per 10mmHg increase in SBP, P=1.16×10⁻⁸; 2.12 [1.58-
2.84], per 10mmHg increase in PP, P=5.35x10⁻⁷). The positive association with ischemic
stroke was primarily due to large vessel stroke (Table 3). DBP and SBP were also positively
associated with left ventricular mass (9.57 [3.98-15.17] gram increase per 10mmHg increase
in DBP, P=8.02x10⁻⁴ and 5.13 [1.77-8.48] gram increase per 10mmHg increase in SBP,
P=0.0027) and left ventricular wall thickness (0.10cm [0.06-0.13] increase per 10mmHg
increase in DBP, P=1.88x10⁻⁸ and 0.05cm [0.03-0.07] increase per 10mmHg increase in SBP,
P=5.52x10⁻⁶, Table 3). There was no convincing evidence to support the BP associated
variants having an effect on lipid levels (P>0.1), BMI (P>0.005), waist hip ratio adjusted
BMI (P>0.1), height (P>0.06), eGFR (P>0.02) or heart failure (P>0.04). The causal
associations with CHD, stroke, and left ventricular measures augment the results from a
previous association analysis using 29 BP variants . Our data strongly support the previous
observations of no causal relationship between BP and eGFR. Lack of evidence of a BP
effect with heart failure may only be due to lack of power, as the association was in the
expected direction.
Potential functional variants at BP loci and candidate genes
18

Twenty-six of our newly discovered BP associated SNVs had MAF > 0.05 and therefore due
to extensive LD with other SNVs not genotyped on the Exome array, identifying the causal
genes requires additional information. If a SNV is associated with increased or decreased
expression of a particular gene, i.e. it is an expression quantitative trait locus (eQTL) this
suggests the gene on which the SNV acts could be in the causal pathway. To help identify
potential candidate causal genes in the novel BP loci (Supplementary Table 9), expression
quantitative trait loci (eQTL) information from publicly available databases were investigated
across a range of tissues and cells (MuTHER for LCL, adipose and skin and GTEx for nine
tissues including the heart and tibial artery; Methods).
The DBP increasing allele of the nsSNV, rs7302981-A, was associated with increased
expression of CERS5 in four tissues: LCLs (PMuTHER=3.13x10-72) skin (PMuTHER=2.40x10-58)
adipose (PMuTHER=2.87x10-54) and nerve (PGTEx=4.5x10⁻¹²) (Supplementary Figure 4).
Additional testing (Methods) provided no evidence against colocalisation of the eQTL and
DBP association signals, implicating CERS5 as a candidate causal gene for this DBP locus.
CERS5 (LAG1 homolog, ceramide synthase 5) is involved in the synthesis of ceramide, a
lipid molecule that is involved in a several cellular signaling pathways. CERS5 knockdown
has been shown to reduce cardiomyocyte hypertrophy in mouse models . However, it is
unclear whether the blood pressure raising effects at this locus are the cause or result of any
potential effects on cardiac hypertrophy. Future studies investigating this locus in relation to
parameters of cardiac hypertrophy and function (e.g. ventricular wall thickness) should help
address this question.
The DBP raising allele of the nsSNV (rs867186-A) was associated with increased expression
of PROCR in adipose tissue (PMuTHER=3.24x10⁻¹⁵) and skin (PMuTHER=1.01x10⁻¹¹)
(Supplementary Figure 4). There was no evidence against colocalisation of the eQTL and
DBP association thus supporting PROCR as a candidate causal gene. PROCR encodes the
19

Endothelial Protein C receptor, a serine protease involved in the blood coagulation pathway,
and rs867186 has previously been associated with coagulation and haematological factors.
The PP decreasing allele of the nsSNV, rs10407022-T, which is predicted to have detrimental
effects on protein structure (Methods) was associated with increased expression of AMH in
muscle (PGTEx=9.95x10⁻¹⁵), thyroid (PGTEx=8.54x10⁻⁷), nerve (PGTEx=7.15x10⁻⁸), tibial artery
(PGTEx=6.46x10⁻⁹), adipose (PGTEx=4.69x10⁻⁷), and skin (PGTEx=5.88x10⁻⁸) (Supplementary
Figure 4). There was no evidence against colocalisation of the eQTL and PP association,
which supports AMH as a candidate causal gene for PP. Low AMH protein levels have been
previously associated with hypertensive status in women with the protein acting as a marker
of ovarian reserve . The intergenic SBP raising allele of rs4728142-A was associated with
reduced expression of IRF5 in skin (PMuTHER=5.24x10⁻³¹) and LCLs (PMuTHER=1.39x10⁻³⁴),
whole blood (PGTEx=3.12x10⁻⁷) and tibial artery (PGTEx=1.71x10⁻⁷).
Three novel rare nsSNVs were identified that map to RBM47, RRAS (both associated with
SBP) and COL21A1 (associated with PP). They had larger effect sizes than common variant
associations (>1.5mmHg per allele; Supplementary Figure 5) and were predicted to have
detrimental effects on protein structure (Supplementary Table 16; Methods). In RBM47,
rs35529250 (G538R) is located in a highly conserved region of the gene and was most
strongly associated with SBP (MAF=0.008; +1.59 mmHg per T allele; P=5.90x10⁻⁹). RBM47
encodes the RNA binding motif protein 47 and is responsible for post-transcriptional
regulation of RNA, through its direct and selective binding with the molecule.33 In RRAS,
rs61760904 (D133N) was most strongly associated with SBP (MAF=0.007; +1.51 mmHg per
T allele; P=8.45x10⁻⁸). RRAS encodes a small GTPase belonging to the Ras subfamily of
proteins H-RAS, N-RAS, and K-RAS and has been implicated in actin cytoskeleton
remodelling, and controlling cell proliferation, migration and cycle processes 34. The nsSNV
20

in COL21A1 (rs200999181, G655A) was most strongly associated with PP (MAF=0.001;
+3.14 mmHg per A allele; P=1.93x10⁻⁹). COL21A1 encodes the collagen alpha-1 chain
precursor of type XXI collagen, a member of the FACIT (fibril-associated collagens with an
interrupted triple helix) family of proteins 35. The gene is detected in many tissues, including
the heart and aorta. Based on our results, these three genes represent good candidates for
functional follow-up. However, due to the incomplete coverage of all SNVs across the region
on the Exome chip, it is possible that other non-genotyped SNVs may better explain some of
these associations. We therefore checked for variants in LD (r2>0.3) with these three rare
nsSNVs in the UK10K + 1000G dataset to ascertain if there are other candidate SNVs at
these loci (Supplementary Table 17). There were no SNVs within 1Mb of the RBM47 locus
in LD with the BP associated SNV. At the COL21A1 locus there were only SNVs in
moderate LD, and these were annotated as intronic, intergenic or in the 5’UTR. At the RRAS
locus, there were two SNVs in strong LD with the BP associated SNV, which both mapped to
introns of the SCAF1 gene and are not predicted to be damaging. All SNVs in LD at both loci
were rare as expected (Supplementary Table 17) supporting a role for rare variants. Hence,
the rare BP associated nsSNVs at RBM47, COL21A1 and RRAS remain the best causal
candidates.
Pathway and network analyses
To identify connected gene sets and pathways implicated by the BP associated genes we used
Meta-Analysis Gene-set Enrichment of variant Associations (MAGENTA)37 and GeneGo
MetaCore (Thomson Reuters, UK). MAGENTA tests for over-representation of BP
associated genes in pre-annotated pathways (gene sets) (Methods and Supplementary Table
18a). GeneGo Metacore identifies potential gene networks. The MAGENTA analysis was
21
used for hypothesis generation and results were compared with the GeneGo Metacore outputs
to cross-validate findings.
Using MAGENTA there was an enrichment (P<0.01 and FDR<5% in either the EUR_SAS
or the EUR participants) of six gene sets with DBP, three gene sets with HTN and two gene
sets for SBP (Supplementary Table 18b). The RNA polymerase I promoter clearance
(chromatin modification) pathway showed the most evidence of enrichment with genes
associated with DBP (PReactome=8.4x10⁻⁵, FDR=2.48%). NOTCH signalling was the most
associated pathway with SBP (PReactome = 3.00x10⁻⁴, FDR = 5%) driven by associations at the
FURIN gene. The inorganic cation anion solute carrier (SLC) transporter pathway had the
most evidence of enrichment by HTN associated genes (PReactome=8.00x10⁻⁶, FDR=2.13%).
Using GeneGo MetaCore, five network processes were enriched (FDR<5%; Methods;
Supplementary Tables 19 and 20). These included several networks with genes known to
influence vascular tone and BP (inflammation signalling, P=1.14x10⁻⁴) and (blood vessel
development P=2.34x10⁻⁴). The transcription and chromatin modification network
(P=2.85x10⁻⁴) was also enriched, a pathway that was also highlighted in the MAGENTA
analysis, with overlap of the same histone genes (HIST1H4C, HIST12AC, HIST12BC,
HISTH1T) and has also been recently reported in an integrative network analysis of published
BP loci and whole blood expression profiling 38. Two cardiac development pathways were
enriched: the oxidative stress-driven (ROS/NADPH) (P=4.12x10⁻⁴) and the Wnt/β-
catenin/integrin-driven (P=0.0010). Both these cardiac development pathways include the
MYH6, MYH7, and TBX2 genes, revealing a potential overlap with cardiomyopathies and
hypertension, and suggesting some similarity in the underlying biological mechanisms.
Discussion
22

By conducting the largest ever genetic study of BP, we identified further novel common
variants with small effects on BP traits, similar to what has been observed for obesity and
height . More importantly, our study identified some of the first rare coding variants of
strong effect (>1.5mmHg) that are robustly associated with BP traits in the general
population, complementing and extending the previous discovery and characterisation of
variants underlying rare Mendelian disorders of blood pressure regulation Using SNV
associations in 17 genes reported to be associated with monogenic disorders of blood
pressure (Methods) we found no convincing evidence of enrichment (Penrichment = 0.044). This
suggests that BP control in the general population may occur through different pathways to
monogenic disorders of BP re-enforcing the importance of our study findings. The
identification of 30 novel BP loci plus further new independent secondary signals within four
novel and five known loci (Methods) has augmented the trait variance explained by 1.3%,
1.2% and 0.93% for SBP, DBP and PP respectively within our data-set. This suggests that
with substantially larger sample sizes, for example through UK BioBank we expect to
identify 1000s more loci associated with BP traits, and replicate more of our discovery SNV
associations that are not yet validated in the current report.
The discovery of rare missense variants has implicated several interesting candidate genes,
which are often difficult to identify from common variant GWAS, and should therefore lead
to more rapidly actionable biology. A2ML1, COL21A1, RRAS and RBM47 all warrant further
follow-up studies to define the role of these genes in regulation of BP traits, as well as
functional studies to understand their mechanisms of action. COL21A1 and RRAS warrant
particular interest since both are involved in blood vessel remodelling, a pathway of known
aetiological relevance to hypertension.
We observed a rare nonsense SBP associated variant in ENPEP (rs33966350; W317): this
overlaps a highly conserved region of both the gene and protein and is predicted to result in
23
either a truncated protein with reduced catalytic function or is subject to nonsense mediated
RNA decay. ENPEP converts angiotensin II (AngII) to Ang-III. AngII activates the
angiotensin 1 (AT1) receptor resulting in vasoconstriction, while AngIII activates the
angiotensin 2 (AT2) receptor that promotes vasodilation and protects against hypertension.43
The predicted truncated protein may lead to predominant AngII signaling in the body, and
increases in BP. This new observation could potentially inform therapeutic strategies. Of
note, angiotensin-converting-enzyme (ACE) inhibitors are commonly used in the treatment of
hypertension. However, patients who suffer from adverse reactions to ACE inhibitors, such
as dry cough and skin rash, would benefit from alternative drugs that target RAAS. Murine
studies have shown that in the brain, AngIII is the preferred AT1 agonist that promotes
vasoconstriction and increases blood pressure, as opposed to AngII in the peripheral system.
These results have motivated the development of brain specific APA inhibitors to treat
hypertension44. Our results confirm APAs, such as ENPEP, as a valid target to modify blood
pressure, but suggest that long-term systemic reduction in APA activity may lead to an
increase in blood pressure. Future studies are needed to examine the effects of the W317X
variant on the RAAS system, specifically in the brain and peripheral vasculature, in order to
test the benefits of the proposed therapeutic strategy in humans.
In addition to highlighting new genes in pathways of established relevance to BP and
hypertension, and identifying new pathways, we have also identified multiple signals at new
loci. For example there are three distinct signals at the locus containing the MYH6/MYH7
genes, and we note that TBX2 maps to one of the novel regions. These genes are related to
cardiac development and/or cardiomyopathies, and provide an insight into the shared
inheritance of multiple complex traits. Unravelling the causal networks within these
polygenic pathways may provide opportunities for novel therapies to treat or prevent both
hypertension and cardiomyopathies.
24

References
1. Lim, S.S. et al. A comparative risk assessment of burden of disease and injury attributable to 67 risk factors and risk factor clusters in 21 regions, 1990-2010: a systematic analysis for the Global Burden of Disease Study 2010. Lancet 380, 2224-60 (2012).
2. Rapsomaniki, E. et al. Blood pressure and incidence of twelve cardiovascular diseases: lifetime risks, healthy life-years lost, and age-specific associations in 1.25 million people. Lancet 383, 1899-911 (2014).
3. Munroe, P.B., Barnes, M.R. & Caulfield, M.J. Advances in blood pressure genomics. Circ Res 112, 1365-79 (2013).
4. Ehret, G.B. et al. Genetic variants in novel pathways influence blood pressure and cardiovascular disease risk. Nature 478, 103-109 (2011).
5. Wain, L.V. et al. Genome-wide association study identifies six new loci influencing pulse pressure and mean arterial pressure. Nature Genetics (2011).
6. Johnson, T. et al. Blood pressure loci identified with a gene-centric array. Am J Hum Genet 89, 688-700 (2011).
7. Tomaszewski, M. et al. Genetic architecture of ambulatory blood pressure in the general population: insights from cardiovascular gene-centric array. Hypertension 56, 1069-76 (2010).
8. Tragante, V. et al. Gene-centric meta-analysis in 87,736 individuals of European ancestry identifies multiple blood-pressure-related loci. Am J Hum Genet 94, 349-60 (2014).
9. Ganesh, S.K. et al. Loci influencing blood pressure identified using a cardiovascular gene-centric array. Hum Mol Genet (2013).
10. Simino, J. et al. Gene-age interactions in blood pressure regulation: a large-scale investigation with the CHARGE, Global BPgen, and ICBP Consortia. Am J Hum Genet 95, 24-38 (2014).
11. Zhu, X. et al. Meta-analysis of Correlated Traits via Summary Statistics from GWASs with an Application in Hypertension. Am J Hum Genet 96, 21-36 (2015).
12. Salfati, E., Morrison, A.C., Boerwinkle, E. & Chakravarti, A. Direct Estimates of the Genomic Contributions to Blood Pressure Heritability within a Population-Based Cohort (ARIC). PLoS One 10, e0133031 (2015).
13. Schork, N.J., Murray, S.S., Frazer, K.A. & Topol, E.J. Common vs. rare allele hypotheses for complex diseases. Curr Opin Genet Dev 19, 212-9 (2009).
14. Nejentsev, S., Walker, N., Riches, D., Egholm, M. & Todd, J.A. Rare variants of IFIH1, a gene implicated in antiviral responses, protect against type 1 diabetes. Science 324, 387-9 (2009).
15. Liu, D.J. et al. Meta-analysis of gene-level tests for rare variant association. Nat Genet 46, 200-4 (2014).
16. Wu, M.C. et al. Rare-variant association testing for sequencing data with the sequence kernel association test. Am J Hum Genet 89, 82-93 (2011).
17. Li, B. & Leal, S.M. Methods for detecting associations with rare variants for common diseases: application to analysis of sequence data. Am J Hum Genet 83, 311-21 (2008).
18. Vissers, L.E. et al. Heterozygous germline mutations in A2ML1 are associated with a disorder clinically related to Noonan syndrome. Eur J Hum Genet 23, 317-24 (2015).
19. International Consortium for Blood Pressure Genome-Wide Association, S. et al. Genetic variants in novel pathways influence blood pressure and cardiovascular disease risk. Nature 478, 103-9 (2011).
20. Coronary Artery Disease Genetics Consortium C4D. A genome-wide association study in Europeans and South Asians identifies five new loci for coronary artery disease. Nat Genet 43, 339-44 (2011).
21. Schunkert, H. et al. Large-scale association analysis identifies 13 new susceptibility loci for coronary artery disease. Nat Genet 43, 333-8 (2011).
22. Arking, D.E. et al. Genetic association study of QT interval highlights role for calcium signaling pathways in myocardial repolarization. Nat Genet 46, 826-36 (2014).
23. den Hoed, M. et al. Identification of heart rate-associated loci and their effects on cardiac conduction and rhythm disorders. Nat Genet 45, 621-31 (2013).
25

24. Global Lipids Genetics Consortium et al. Discovery and refinement of loci associated with lipid levels. Nat Genet 45, 1274-83 (2013).
25. Traylor, M. et al. Genetic risk factors for ischaemic stroke and its subtypes (the METASTROKE collaboration): a meta-analysis of genome-wide association studies. Lancet Neurol 11, 951-62 (2012).
26. Smith, N.L. et al. Association of genome-wide variation with the risk of incident heart failure in adults of European and African ancestry: a prospective meta-analysis from the cohorts for heart and aging research in genomic epidemiology (CHARGE) consortium. Circ Cardiovasc Genet 3, 256-66 (2010).
27. Vasan, R.S. et al. Genetic variants associated with cardiac structure and function: a meta-analysis and replication of genome-wide association data. JAMA 302, 168-78 (2009).
28. Ehret, G.B. et al. Genetic variants in novel pathways influence blood pressure and cardiovascular disease risk. Nature 478, 103-109 (2011).
29. Russo, S.B. et al. Ceramide synthase 5 mediates lipid-induced autophagy and hypertrophy in cardiomyocytes. J Clin Invest 122, 3919-30 (2012).
30. Oudot-Mellakh, T. et al. Genome wide association study for plasma levels of natural anticoagulant inhibitors and protein C anticoagulant pathway: the MARTHA project. Br J Haematol 157, 230-9 (2012).
31. Smith, N.L. et al. Novel associations of multiple genetic loci with plasma levels of factor VII, factor VIII, and von Willebrand factor: The CHARGE (Cohorts for Heart and Aging Research in Genome Epidemiology) Consortium. Circulation 121, 1382-92 (2010).
32. Bleil, M.E., Gregorich, S.E., McConnell, D., Rosen, M.P. & Cedars, M.I. Does accelerated reproductive aging underlie premenopausal risk for cardiovascular disease? Menopause 20, 1139-46 (2013).
33. Guan, R. et al. rbm47, a novel RNA binding protein, regulates zebrafish head development. Dev Dyn 242, 1395-404 (2013).
34. Wozniak, M.A., Kwong, L., Chodniewicz, D., Klemke, R.L. & Keely, P.J. R-Ras controls membrane protrusion and cell migration through the spatial regulation of Rac and Rho. Mol Biol Cell 16, 84-96 (2005).
35. Tuckwell, D. Identification and analysis of collagen alpha 1(XXI), a novel member of the FACIT collagen family. Matrix Biol 21, 63-6 (2002).
36. Huang, J. et al. Improved imputation of low-frequency and rare variants using the UK10K haplotype reference panel. Nat Commun 6, 8111 (2015).
37. Segre, A.V. et al. Common inherited variation in mitochondrial genes is not enriched for associations with type 2 diabetes or related glycemic traits. PLoS Genet 6(2010).
38. Huan, T. et al. Integrative network analysis reveals molecular mechanisms of blood pressure regulation. Mol Syst Biol 11, 799 (2015).
39. Locke, A.E. et al. Genetic studies of body mass index yield new insights for obesity biology. Nature 518, 197-206 (2015).
40. Wood, A.R. et al. Defining the role of common variation in the genomic and biological architecture of adult human height. Nat Genet 46, 1173-86 (2014).
41. Park, H.W. et al. Serine-threonine kinase with-no-lysine 4 (WNK4) controls blood pressure via transient receptor potential canonical 3 (TRPC3) in the vasculature. Proc Natl Acad Sci U S A 108, 10750-5 (2011).
42. Sudlow, C. et al. UK biobank: an open access resource for identifying the causes of a wide range of complex diseases of middle and old age. PLoS Med 12, e1001779 (2015).
43. Te Riet, L., van Esch, J.H., Roks, A.J., van den Meiracker, A.H. & Danser, A.H. Hypertension: Renin-Angiotensin-aldosterone system alterations. Circ Res 116, 960-75 (2015).
44. Gao, J. et al. A new strategy for treating hypertension by blocking the activity of the brain renin-angiotensin system with aminopeptidase A inhibitors. Clin Sci (Lond) 127, 135-48 (2014).
Methods
26

Overview of discovery studies
The cohorts contributing to the discovery meta-analyses comprise studies from three
consortia (CHD Exome+, ExomeBP, and GoT2D/T2D-GENES). The total number of unique
samples was 192,763. All participants provided written informed consent and the studies
were approved by their local Research Ethics Committees and/or Institutional Review
Boards.
The CHD Exome+ consortium included ten different collections (77,385 samples): eight
studies (49,898 samples) are of European (EUR) ancestry (EPIC-CVD, EPIC-InterAct,
CCHS, CGPS, CIHDS, PROSPER, MORGAM, WOSCOPS) and two studies (27,487
samples) of South Asian ancestry (BRAVE, PROMIS). The ExomeBP consortium included
25 studies (75,620 samples) of EUR ancestry (Airwave, ASCOT, 1958BC, BRIGHT,
CROATIA_Korcula, DIABNORD, EGCUT, FENLAND, FINRISK97/02, GS:SFHS,
GLACIER, GoDARTS, GRAPHIC, HELIC-MANOLIS, HUNT, LBC1921, LBC1936,
LIFELINES, MDC, NFBC1986, OBB, PIVUS, TwinsUK, ULSAM, UKHLS). The GoT2D
consortium comprised 14 studies (39,758 samples) of Northern EUR ancestry from Denmark
(ADDITION, HEALTH2006/2008, INTER99, SDC and Vejle Biobank), Finland (DPS, DR’s
EXTRA, FIN-D2D 2007, FINRISK 2007, FUSION, METSIM and PPP-Botania), and
Sweden (ANDIS and SDR). The participating studies and their characteristics, including
study design, BP ascertainment, measurement and exclusion criteria are detailed in
Supplementary Tables 1 and 2. Note, any studies contributing to multiple consortia were only
included once in all meta-analyses.
Phenotypes
27

Four blood pressure (BP) traits were analysed, these included three quantitative traits:
systolic blood pressure (SBP), diastolic blood pressure (DBP), pulse pressure (PP); and one
binary outcome: hypertension (HTN). For individuals known to be taking BP lowering
medication, 15 / 10 mmHg was added to the raw SBP / DBP values, respectively, to obtain
medication-adjusted SBP / DBP values 45. PP was defined as the difference between SBP
and DBP, post-adjustment. For the HTN phenotype, individuals were classified as
hypertensive cases if they satisfied at least one of the following criteria: (i) SBP ≥ 140
mmHg, (ii) DBP ≥ 90 mmHg, (iii) taking anti-hypertensive or BP lowering medication. All
other individuals were included within the hypertension analysis as controls. The four BP
traits are correlated (SBP:DBP correlations were between 0.6 and 0.8, and SBP:PP
correlations were approximately 0.8). However, they measure partly distinct physiological
features including, cardiac output, vascular resistance, and arterial stiffness, all measures for
determining a cardiovascular risk profile. Therefore the genetic architecture of the individual
phenotypes are of interest and a multi-phenotype mapping approach was not adopted. Details
of the BP phenotypes for each participating study are provided in Supplementary Table 1.
Genotyping
All samples were genotyped using one of the Illumina HumanExome Beadchip arrays
(http://genome.sph.umich.edu/wiki/Exome_Chip_Design; Supplementary Table 3).
Genotyping was performed across the different studies using different arrays that contained
Exome chip SNVs and across several different sites (Supplementary Table 3). Most studies
followed comparable protocols for genotyping and quality control of resultant data. Full
details are given in Supplementary Information. All genotypes were aligned to the plus strand
of the human genome reference build 37 prior to any analyses and any unresolved mappings
28

were removed. As an additional check, genotype cluster plots were reviewed for all the novel
rare variants (both lead and secondary signals) and for rare variants that contributed to the
gene-based testing to ensure good quality genotype calls.
Discovery SNV analyses
Two analyses of the continuous traits SBP, DBP, PP, were conducted within each
contributing study: inverse normal transformed and untransformed. The analyses of the
transformed traits were performed in order to minimise sensitivity to deviations from
normality in the analysis of rare variants, and hence were used for discovery of new SNV-BP
associations. The residuals from the null model obtained after regression of the medication-
adjusted trait on the covariates (age, age2, sex, BMI, and disease status for CHD) within a
linear regression model, were ranked and inverse normalised. These normalised residuals
were used to test trait-SNV associations. All SNVs that passed QC were analysed for
association, without any further filtering by MAF, assuming an additive allelic effects model.
Full details of the analyses conducted within each study contributing to each of the consortia
are given in the Supplementary Information.
Two meta-analyses were performed for each trait, one with EUR only, and one with SAS and
EUR ancestries combined (EUR_SAS). We performed inverse variance weighted fixed effect
meta-analysis for continuous traits (SBP, DBP and PP) and sample size weighted meta-
analysis for the binary trait (HTN) as implemented in METAL 46. Contributing studies used
PCs to adjust for population stratification, consequently minimal inflation in the association
test statistics, , was observed ( =1.07 for SBP, 1.10 for DBP, 1.04 for PP and <1 for HTN
in the transformed discovery meta-analysis in EUR_SAS; = 1.06 for SBP, 1.09 for DBP,
1.05 for PP and <1 for HTN in the transformed discovery meta-analysis in EUR;
29

Supplementary Figure 6). We used I2 to calculate heterogeneity across studies
(Supplementary Figure 2). The meta-analyses were performed independently in two different
centres and concordance of results between the two centres was achieved following thorough
quality control checks. Given the studies contributing to the discovery analyses include
studies ascertained on CHD or T2D, we explored potential systematic bias in calculated
effect estimates amongst these studies. No evidence of bias in the overall effect estimates was
obtained.
The results for the transformed traits were taken forward and used to select candidate SNVs
for replication. Comparison of the results from the transformed and untransformed analyses
were made, and the correlations of association P-values across all SNVs on the Exome-chip
between the results were strong (r2> 0.9).
Replication SNV analyses
We extracted SNVs associated with any of the transformed traits (SBP, DBP, PP) or HTN
and annotated them using the Illumina SNV annotation file - ‘humanexome-
12v1_a_gene_annotation.txt’ independently across two sites. Given the difference in power
to detect common versus low frequency and rare variants, two different significance
thresholds were chosen for SNV selection. For SNVs with MAF ≥ 0.05, P ≤ 1x10⁻⁵, while, P
≤ 1x10⁻⁴ was used for SNVs with MAF < 0.05. By choosing a significance threshold of
P<1x10⁻⁴ we maximized the opportunity to follow-up rare variants (making the assumption
that any true signals at this threshold could replicate at Bonferroni adjusted significance,
P≤6.17x10⁻⁴, assuming α=0.05 for 81 SNVs). All previously published BP associated SNVs
and any variants in LD with them (r2 > 0.2), were removed from the list of associated SNVs
as we aimed to replicate new findings only. SNVs for which only one study contributed to the
association result or showed evidence of heterogeneity (Phet < 0.0001) were removed from
30

the list as they were likely to be an artefact. Where SNVs were associated with multiple traits,
to minimise the number of tests performed, only the trait with the smallest P-value was
selected as the primary trait in which replication was sought. Where multiple SNVs fitted
these selection criteria for a single region, only the SNV with the smallest P-value was
selected. In total, 81 SNVs were selected for validation in independent samples. These 81
SNVs had concordant association results for both transformed and non-transformed traits.
Eighty SNVs were selected from EUR_SAS and had consistent support in the EUR results,
and one variant in ZNF101 was selected based on support in EUR samples only. In the next
step, we looked up the 81 SNV-BP associations using data from a separate consortium, the
CHARGE+ consortium (who had analysed untransformed DBP, SBP, PP and HTN) and two
studies (UHP and Lolipop) from the ExomeBP consortium (Supplementary Information,
Supplementary Tables 2 and 3). The analysed residuals from CHARGE+ were approximately
normally distributed in their largest studies and plots of the untransformed distributions are
provided in Supplementary Figure 7
Two meta-analyses of the replication datasets were performed: one in the EUR samples only,
and a second with EUR, African American, Hispanics and SAS ancestries (“ALL”). Both
used inverse variance weighted fixed effects meta-analysis (SBP/DBP/PP) and sample size
weighted meta-analysis (HTN) as implemented in METAL. Evidence of replication was only
confirmed if P (1-tailed) < 0.05/81=6.17x10-4 and the effect (beta) was in the direction
observed in our meta-analyses for the selected trait. A combined meta-analysis in METAL
was performed of discovery (untransformed results as only untransformed data was available
within the CHARGE+ consortium) and replication datasets across the four traits to assess the
overall support for each locus. For the combined meta-analyses, a GWS threshold of,
P≤5x10⁻⁸, was used to declare a SNV as novel rather than a less stringent experiment wide
threshold, as GWS is used to declare significance in GWAS and we wish to minimise the
31

possibility of false positive associations. (Note that the GWS threshold of P ≤ 5x10⁻⁸ is also
equivalent to an exome-wide threshold of P≤2x10⁻⁷ adjusted for four traits).
Note: all final BP-associated variants that validated were associated at P<10-5 in the
discovery dataset (for the primary trait). Hence, we could have used the same inclusion
criteria for both common and rare SNVs. Therefore the optimal threshold to choose for future
experiments may need further consideration.
Conditional analyses and gene-based tests
The RAREMETALWORKER (RMW) tool does not require individual level data to
perform conditional analyses and gene-based tests
(http://genome.sph.umich.edu/wiki/RAREMETALWORKER) and therefore was selected for
these analyses. All studies that contributed to the SNV discovery analyses were re-contacted
and asked to run the RMW tool. Within Exome BP consortium, only FENLAND,
GoDARTS, HELIC-MANOLIS, and UKHLS were unable to run RMW, while two new
studies were included, INCIPE and NFBC1966 (Supplementary Table 1 and 2). Only EPIC-
InterAct did not contribute to the RMW analyses from the CHD Exome+ consortium. All
studies were included from GoT2D. In total, 43 studies (147,402 samples) were included in
the EUR analyses and 45 studies (173,329 samples) in the EUR_SAS analyses. Further
details are provided in the Supplementary Information and Supplementary Tables 2 and 3.
Comparison of the single variant discovery results with the new single variant results from
RMW, revealed very good correlation across the continuous BP traits (>0.77 in the
EUR_SAS and > 0.74 in the EUR only analyses). The differences were attributable to having
fewer samples and slightly different studies in the RMW dataset compared with the discovery
samples.
32
For each novel locus, the genomic coordinates and size of the region were defined according
to recombination rates (Supplementary Table 9) around the lead variant. For known loci, a 1
Mb window was used (Supplementary Table 14). Conditional analysis was performed across
each region, in both the EUR and EUR_SAS samples, for the transformed phenotype
corresponding to the validated BP trait for novel loci and the published BP trait for known
loci.
Gene based tests were performed with both the EUR and EUR_SAS datasets using the
Sequence Kernel Association Test (SKAT) within RMW as it allows for the SNVs to have
different directions and magnitudes of effect. Burden tests were also performed but are not
presented as only SKAT provided significant results. The variants in the gene-based tests
using SKAT were weighted using the default settings. Briefly, this used a beta distribution
density function to give more weight to rare variants, Beta(MAFj, 1, 25) where MAFj
represents the pooled MAF for variant j across all studies. Annotation of all variants with
information on genes and exon positions were derived from the UCSC reference file
"refFlat.txt.gz" (http://hgdownload.soe.ucsc.edu/goldenPath/hg19/database/) and analyses
restricted to coding SNVs with MAF < 5% and MAF <1%. Association of genes with the
transformed DBP, SBP, PP traits and HTN were deemed to be associated if P <2.8x10⁻⁶
(Bonferroni correction for 17,996 genes). To confirm the gene associations were not
attributable to a solitary SNV within the gene, a gene-based test conditional on the most
associated SNV was performed (Pconditional < 0.001). The QC of all SNVs contributing to the
gene based tests including the number of samples and studies contributing to the associations
were checked prior to claiming association. We also sought replication in the CHARGE+
studies for any significant gene associations in the discovery analyses.
33

Pathway analyses
(1) Magenta
We tested seven databases in MAGENTA37 (BioCarta47, Kyoto Encyclopedia of Genes and
Genomes (KEGG)48, Ingenuity49, Panther50, Panther Biological Processes50, Panther
Molecular Functions 50 and Reactome ) for overrepresentation of the SNV discovery
results from both EUR and EUR_SAS ancestries. Each of the four BP phenotypes, HTN and
transformed DBP, SBP, and PP were tested. MAGENTA maps SNVs to a gene based on
their chromosome and position. For SNVs not situated in a gene a ±20kb flanking region is
used to capture variants that potentially regulate that gene and the SNV with the smallest P-
value is subsequently used to represent the gene. To adjust gene associations for potential
confounding, the model takes into account six possible predictors: (i) gene size (kb); (ii)
number of genotyped variants per kb; (iii) the number of independent variants per kb; (iv) the
number of recombination hotspots per kb; (v) the genetic distance (cM) per kb; and (vi) the
LD units per kb. The proportion of genes that have an adjusted P-value less than the 95th
percentile of the gene P-value meta-analysis distribution is the “leading edge fraction”. The
enrichment P-value for a pathway is the proportion of random pathways of identical size, in
10,000 permutations, whose leading edge fraction is greater than or equal to the observed
leading edge fraction. Pathways exhibiting P<0.01 and FDR<5% were considered
statistically significant.
(2) GeneGo MetaCore Network analyses
A set of BP genes based on previously published studies and our current Exome chip results
(locus defined as r2 > 0.4 and 500kb on either side of tag SNV; Supplementary Table 19) was
tested for enrichment using the THOMSON REUTERS MetaCoreTM Single Experiment
Analysis workflow tool. The manually uploaded data set was mapped onto selected
34

MetaCore ontology databases such as: pathway maps, process networks, GO processes and
diseases / biomarkers, for which functional information is derived from experimental
literature. Outputs were sorted based on the P- and FDR-values. Stringent thresholds were
adopted for determining whether the given gene set was enriched for a particular process
(P<0.05, FDR<5%).
Genetic Risk Score
To assess the effect of BP on CHD, ischemic stroke (and three of its subtypes: large vessel,
small vessel and cardioembolic stroke) left ventricular mass, left ventricular wall thickness,
heart failure, HDL-c, LDL-c, total cholesterol, triglycerides and eGFR, we performed a
weighted generalized linear regression of the genetic associations with each outcome variable
on the genetic associations with BP accounting for the correlations between genetic variants.
When genetic variants are uncorrelated, the estimates from such a weighted linear regression
analysis using summarized data, and a genetic risk score analysis using individual-level data,
are equal 53. We refer to the analysis as a genetic risk score (also known as a polygenic risk
score) analysis as this is likely to be more familiar to applied readers. As some of the genetic
variants in our analysis are correlated, a generalized weighted linear regression model is fitted
that accounts for the correlations between variants. This is undertaken as follows:
If are the genetic associations (beta-coefficients) with the risk factor (here, BP) and are
the genetic associations with the outcome, then the causal estimate from a weighted
generalized linear regression is , and the standard error is
, where T is a matrix transpose, is the estimate of the residual standard
error from the regression model, and the weighting matrix has terms ,
where is the standard error of the genetic association with the outcome for the jth SNV,
35

and is the correlation between the j1th and j2th SNPs. The presence of the estimated
residual standard error allows for heterogeneity between the causal estimates from the
individual SNVs as overdispersion in the regression model (in the case of underdispersion,
the residual standard error estimate is set to unity). This is equivalent to combining the causal
estimates from each SNV using a multiplicative random-effects model
For each of DBP, SBP and PP, the score was created using both the novel and known BP
SNVs or a close proxy (r2>0.8). Both the sentinel SNV association and any secondary SNV
associations that remained after adjusting for the sentinel SNV were included in the genetic
risk score. For the 30 validated novel SNV-BP associations, βs were taken from the
independent replication analyses (Table 1a and 1b) to weight the SNV in the genetic risk
score. For the secondary SNVs from the novel loci (N=7) and known loci (N=5), βs were
taken from the discovery analyses (Supplementary Tables 10 and 15). For the 82 published
known SNVs, 43 SNVs were either genotyped or had proxies on the Exome chip and the βs
were taken from discovery results (Supplementary Table 13), the remaining βs were taken
from published effect estimates. This strategy for selecting betas for use in the GRS was
taken to minimize the influence of winners curse. The associations between the BP variants
with CHD, HDL-c, LDL-c, total cholesterol, log(triglycerides) and log(eGFR) were obtained
using the CHD Exome+ Consortium studies (N=82,056, N=80,395, N=77,021, N=80,455,
N= 77,779 and N=51,039 respectively) the associations with BMI, waist-hip ratio adjusted
BMI and height were obtained from the GIANT consortium (unpublished Exome chip
results, N=526,508, 344,369 and 458,927 respectively) and for ischemic stroke, left
ventricular mass, left ventricular wall thickness and heart failure (N= 25,799, N= 11,273,
N=11,311, and N= 23,821) from METASTROKE , EchoGen and CHARGE-HF . A
causal interpretation of the association of GRS with the outcome as the effect of BP on the
36

outcome assumes that the effects of genetic variants on the outcome are mediated via blood
pressure and not via alternate causal pathways, for example via LV thickness. There are also
limitations of the Mendelian randomization approach in distinguishing between the causal
effects of different measures of blood pressure, due to the paucity of genetic variants
associated with only one measure of blood pressure (for example, SBP, DBP or PP).
eQTL analyses
The MuTHER dataset contains gene expression data from 850 UK twins for 23,596 probes
and 2,029,988 (HapMap 2 imputed) SNVs. All cis–associated SNVs with FDR<1%, within
each of the 30 novel regions (IMPUTE info score >0.8) were extracted from the MuTHER
project dataset for each of the tissues, LCL (n=777), adipose (n=776) and skin (n=667) .
The pilot phase of the GTEx Project (dbGaP Accession phs000424.v3.p1) provides
expression data from up to 156 individuals for 52,576 genes annotated in Gencode v12
(including pseudo genes) and 6,820,472 genotyped SNVs (using the Human Omni5-Quad
array) and imputed SNVS (to the 1000 Genomes project reference post-QC, info > 0.4, MAF
> 5%) . The eQTL analysis was focused on nine tissues having more than 80 samples and
genes expressed at least 0.1 RPKM in 10 or more individuals in a given tissue. All transcripts
with a transcription start site (TSS) within one of the 30 new BP loci and for which there was
a cis-associated SNV (IMPUTE info score > 0.4) within 1Mb of the TSS at FDR<5%, were
identified. Data were extracted for: subcutaneous adipose tissue (n=94), tibial artery (n=112),
heart (left ventricle) (n=83), lung (n=119), skeletal muscle (n=138), tibial nerve (n=88), skin
(sun exposed, lower leg) (n=96), thyroid (n=105) and whole blood (n=156). We were not able
to evaluate presence of expression signals in kidney tissue, since the currently available
sample size in GTEx (n=8) is too small to enable calculation of eQTLs. Only data for SNVs
37

with MAF > 0.05 were considered. From each resource, we report eQTL signals, which reach
the resource-specific thresholds for significance described above, for SNVs that are in LD
(r2>0.8) with our sentinel SNV.
For identified eQTLs, we tested whether they colocalised with the BP associated SNV using
a Bayesian approach based on summary statistics . Colocalisation analyses were considered
to be significant if the posterior probability of colocalisation was greater than 0.95.
Annotation of variants and literature review
In silico prediction of the functional effect of detected variants was based on the annotation
from the dbSNP database (http://www.ncbi.nlm.nih.gov/SNP/), the Ensembl Variant Effect
Predictor (VEP) tool (http://www.ensembl.org/info/docs/tools/index.html) and from the
Exome Variant Server, NHLBI GO Exome Sequencing Project (ESP), Seattle, WA
(http://evs.gs.washington.edu/EVS/) on March 2015 and February 2016. Annotation was
performed for each known Ensembl transcript or regulatory feature regardless of the biotype.
Information about the effect on transcript and protein level, including various effect
prediction scores (PolyPhen, SIFT, Grantham), evolutionary conservations scores
(phastCons, GERP) and variant frequency in various populations (AFR, AMR, ASN, EAS,
EUR, SAS), was collected. Details of the literature review are provided in the Supplementary
Information.
Trait variance explained
The percentage trait variance explained for SBP, DBP, PP was assessed with 5,861
individuals from a population-based cohort (1958BC) with complete information for all
phenotypes and covariates.
38

Two different genetic models were investigated: one containing the 43 previously known BP
associated SNVs covered on the Exome chip, as a baseline reference; and a second model
additionally including the 30 novel lead SNVs and 9 of the new independent additional SNVs
from both novel and known loci with multiple signals, giving a total of 82 known and novel
SNV predictors. These 9 additional new independent SNVs were taken as the secondary
signals identified within the novel and known loci from the conditional analyses of the EUR
dataset, as 1958BC contains European subjects only. Hence the 9 independent variants
included: 4 secondary variants from novel loci for EUR (PREX1, COL21A1, PRKAG1 and
MYH6 (there was only 1 in EUR) loci; Supplementary Table 10) and 5 secondary variants
from known loci for EUR (ST7L-CAPZA1-MOV10, FIGN-GRB14, ENPEP, TBX5-TBX3 and
HOXC4; Supplementary Table 15).
The residual trait was obtained by adjusting each of the medication-adjusted BP traits with
sex and BMI variables, the same covariates used within the discovery SNV analyses (not age
or age2 as all 1958BC individuals were aged 44 years). A linear regression was fitted for the
residual trait regressed on all SNVs within the corresponding model and adjusted for the first
ten principal components (PCs). The r2 calculated from this regression model was used as the
percentage trait variance explained. The comparison of r2 measures between the 43-SNV
model and the 82-SNV model was used to indicate the incremental increase in percentage
trait variance explained due to all the novel SNVs identified.
Monogenic Enrichment analyses
To determine if sub-significant signals of association were present in a set of genes associated
with monogenic forms of disease, we performed an enrichment analysis of the discovery
39

single variant meta-analysis association results for all four traits for both for individuals of
EUR ancestry and EUR_SAS ancestry datasets.
The monogenic gene set included: WNK1, WNK4, KLHL3, CUL3, PPARG, NR3C2,
CYP11B1, CYP11B2, CYP17A1, HSD11B2, SCNN1A, SCNN1B, SCNN1G, CLCNKB,
KCNJ1, SLC12A1, SLC12A3 . The association results of coding SNVs in these genes were
extracted and the number of tests with P<0.001 observed. In order to determine how often
such an observation would be observed by chance, we constructed 1,000 matched gene sets.
The matching criteria for each monogenic gene was the intersection of all genes in the same
exon length quintile and all genes in the same coding variant count decile. Within the
matched sets, the number of variants with P<0.001 was observed. The empirical P-value was
calculated as the fraction of matched sets with an equal or larger number of variants less than
0.001.
40
References
45. Tobin, M.D., Sheehan, N.A., Scurrah, K.J. & Burton, P.R. Adjusting for treatment effects in studies of quantitative traits: antihypertensive therapy and systolic blood pressure. Stat Med 24, 2911-35 (2005).
46. Willer, C.J., Li, Y. & Abecasis, G.R. METAL: fast and efficient meta-analysis of genomewide association scans. Bioinformatics 26, 2190-1 (2010).
47. BioCarta. BioCarta. http://www.biocarta.com/genes/indexasp. (2013). 48. KEGG. Kyoto encyclopedia of genes and genomes. (2103). 49. Ingenuity. (2013). 50. PANTHER. Protein analysis through evolutionary relationships. 2013. . (2013). 51. Croft, D. et al. The Reactome pathway knowledgebase. Nucleic Acids Res 42, D472-7
(2014). 52. Milacic, M. et al. Annotating cancer variants and anti-cancer therapeutics in
reactome. Cancers (Basel) 4, 1180-211 (2012). 53. Burgess, S. & Thompson, S.G. Multivariable Mendelian randomization: the use of
pleiotropic genetic variants to estimate causal effects. Am J Epidemiol 181, 251-60 (2015).
54. Thompson, S.G. & Sharp, S.J. Explaining heterogeneity in meta-analysis: a comparison of methods. Stat Med 18, 2693-708 (1999).
55. Nica, A.C. et al. The architecture of gene regulatory variation across multiple human tissues: the MuTHER study. PLoS Genet 7, e1002003 (2011).
56. GTEx, Consortium,. Human genomics. The Genotype-Tissue Expression (GTEx) pilot analysis: multitissue gene regulation in humans. Science 348, 648-60 (2015).
57. Giambartolomei, C. et al. Bayesian test for colocalisation between pairs of genetic association studies using summary statistics. PLoS Genet 10, e1004383 (2014).
41

Acknowledgements
Given in Supplementary Information
Author contributions
Given in Supplementary Information
Author information
N. P. has received financial support from several pharmaceutical companies that manufacture
either blood pressure lowering or lipid lowering agents, or both, and consultancy fees.
S. K. has received Research Grant-Merck, Bayer, Aegerion; SAB-Catabasis, Regeneron
Genetics Center, Merck, Celera; Equity-San Therapeutics, Catabasis; Consulting-Novartis,
Aegerion, Bristol Myers-Squibb, Sanofi, AstraZeneca, Alnylam.
P. Sever has received research awards from Pfizer Inc.
A. Malarstig and M. Uria-Nickelsen are full time employees of Pfizer.
D. Reily and M. Hoek are full time employees of Merck and co Inc.
M.J. Caulfield is Chief Scientist for Genomics England a UK Government company.
The authors declare no competing financial interest.
42

Table 1a. Novel blood pressure trait associated loci. Variants with formal replication
Variant information Discovery Replication Combined
Locus rsID Chr:Pos (EA:EAF) Trait Pt PU N β P N β P
EUR RNF207 rs709209 1:6.28 (A:0.655) PP 4.57x10⁻⁶ 1.60x10⁻⁶ 122780 0.17 5.83x10⁻⁴ 284683 0.20 9.62x10⁻⁹ c5orf56 rs12521868 5:131.78 (T:0.373) DBP 1.59x10⁻⁶ 3.03x10⁻⁷ 122795 -0.18 2.29x10⁻⁵ 282023 -0.19 6.12x10⁻¹¹
PHACTR1 rs9349379 6:12.90 (A:0.566) SBP 2.11x10⁻⁸ 1.78x10⁻⁷ 122809 0.24 4.06x10⁻⁴ 284673 0.29 8.84x10⁻¹⁰ COL21A1 rs200999181† 6:55.94 (A:0.002) PP 3.08x10⁻⁸ 2.46x10⁻⁷ 121487 2.70 1.90x10⁻⁴ 242486 3.25 6.27x10⁻¹⁰
ABO rs687621 9:136.14 (A:0.615) DBP 8.80x10⁻⁸ 2.55x10⁻⁷ 122798 0.16 1.96x10⁻⁴ 276014 0.19 5.45x10⁻¹⁰ ADO rs10995311 10:64.56 (C:0.567) DBP 1.86x10⁻⁶ 1.14x10⁻⁶ 122798 0.23 8.47x10⁻⁸ 266456 0.21 1.12x10⁻¹²
LMO1 rs110419 11:8.25 (A:0.48) DBP 9.41x10⁻⁶ 2.22x10⁻⁵ 122798 0.16 1.81x10⁻⁴ 279935 0.16 3.04x10⁻⁸ OR5B12 rs11229457 11:58.21 (T:0.236) SBP 1.58x10⁻⁶ 4.62x10⁻⁵ 122809 -0.32 7.53x10⁻⁵ 284680 -0.31 2.70x10⁻⁸ CERS5 rs7302981 12:50.54 (A:0.361) DBP 1.35x10⁻¹³ 4.60x10⁻¹¹ 122798 0.24 2.64x10⁻⁸ 284718 0.25 1.38x10⁻¹⁷ MYH6 rs452036 14:23.87 (A:0.327) PP 4.59x10⁻¹¹ 2.80x10⁻¹³ 122780 -0.21 1.81x10⁻⁵ 284672 -0.28 2.96x10⁻¹⁶ DPEP1 rs1126464 16:89.70 (C:0.256) DBP 1.19x10⁻⁹ 4.35x10⁻¹¹ 118677 0.24 1.68x10⁻⁶ 261564 0.28 1.02x10-15 TBX2 rs8068318† 17:59.48 (T:0.698) DBP 7.46x10⁻¹³ 5.71x10⁻¹⁰ 122798 0.26 3.23x10⁻⁸ 281978 0.26 1.95x10⁻¹⁶ RGL3 rs167479 19:11.53 (T:0.486) DBP 2.22x10⁻²³ 1.97x10⁻²² 122797 -0.29 3.01x10⁻¹¹ 283332 -0.33 1.99x10-31
PREX1 rs6095241 20:47.31 (A:0.452) DBP 5.65x10⁻⁶ 2.29x10⁻⁵ 122798 -0.18 2.56x10⁻⁵ 281322 -0.17 4.75x10⁻⁹ ALL ancestry
RBM47 rs35529250† 4:40.43 (T:0.01) SBP 6.56x10⁻⁷ 6.15x10⁻⁶ 148878 -1.43 5.02x10⁻⁴ 306352 -1.55 2.42x10⁻⁸ OBFC1 rs4387287 10:105.68 (A:0.157) SBP 2.23x10⁻⁸ 1.32x10⁻⁷ 147791 0.28 3.37x10⁻⁴ 320494 0.36 9.12x10⁻¹⁰ RRAS rs61760904† 19:50.14 (T:0.008) SBP 1.96x10⁻⁶ 1.90x10⁻⁵ 148878 1.38 5.70x10⁻⁴ 322664 1.50 8.45x10⁻⁸
SNV-BP associations are reported for the newly identified BP loci that replicated at P<6.2x10⁻⁴ (Bonferroni correction for the 81 variants selected for replication for a primary blood pressure trait; Methods). Loci are categorised into EUR and ALL ancestry based on the meta-analysis used to replicate the variants for the primary BP trait shown in column labelled ‘Trait’. In the columns that contains the discovery meta-analyses results, Pt represents the P-value for association of the variant with the transformed primary BP trait in the EUR_SAS discovery meta-analyses (which was also used to select the variant for replication) and Pu represents the P-value for association with the untransformed primary BP trait in the ancestry in which the variant replicated. N, β and P, denotes the number of samples, estimated allelic effect and P-value for association with the primary BP trait, are provided for the untransformed primary BP trait in the replication data and also from the combined (discovery and replication) meta-analyses. NB: ALL ancestry corresponds to all ancestries in the combined (discovery + replication) meta-analyses Locus – Gene or region containing the SNV, rsID - dbSNP rsID. Chr:Pos (EA:EAF) – Chromosome:NCBI Build 37 position in Mb (effect allele:effect allele frequency), Trait – primary blood pressure trait for which the variant was and also replicated, β - effect estimate, N:sample size, EUR - European. † indicates it is a non-synonymous SNV (nsSNV) or is linkage disequilibrium with a nsSNV (r2>0.8) that is predicted to be damaging
43

Table 1b. Novel blood pressure trait associated loci. Variants with GWS evidence of association in combined meta-analyses
Variant information Discovery Replication Combined Locus rsID Chr:Pos (EA:EAF) Trait Pt PU N β P N β P
EUR 2q36.3 rs2972146 2:227.10 (T:0.652) DBP§
(HTN) 1.51x10⁻⁹ 2.47x10⁻⁷ 122798 0.13 2.20x10⁻³ 275610 0.17 8.40x10⁻⁹
ZBTB38 rs16851397 3:141.13 (A:0.953) DBP§ (SBP)
6.87x10⁻⁶ 3.20x10⁻⁵ 122798 -0.38 1.20x10⁻⁴ 284717 -0.38 3.01x10⁻⁸
PRDM6 rs1008058 5:122.44 (A:0.135) SBP 5.09X10⁻⁷ 1.01x10⁻⁸ 43109 0.46 3.61x10⁻³ 176362 0.55 2.99x10⁻¹⁰
GPR20 rs34591516 8:142.37 (T:0.055) SBP§ (DBP)
1.54x10⁻⁶ 1.01x10⁻⁷ 122807 0.51 4.20x10⁻⁴ 282009 0.64 6.10x10⁻¹⁰
HOXB7 rs7406910 17:46.69 (T:0.118) SBP 6.07X10⁻¹⁰ 2.74x10⁻⁹ 122809 -0.20 4.89x10⁻² 284690 -0.46 3.80x10⁻⁸
AMH rs10407022† 19:2.25 (T:0.82) PP 1.63X10⁻⁷ 1.73x10⁻⁷ 118656 -0.19 1.62x10⁻³ 252525 -0.26 5.94x10⁻⁹
ZNF101 rs2304130 19:19.79 (A:0.914) DBP 1.66X10⁻⁸ 1.92x10⁻⁸ 122798 -0.17 1.71x10⁻² 284705 -0.29 1.53x10⁻⁸
PROCR rs867186 20:33.76 (A:0.873) DBP 1.44X10⁻⁶ 4.15x10⁻⁷ 122798 0.21 2.48x10⁻³ 284722 0.26 1.19x10⁻⁸ RRP1B rs9306160 21:45.11 (T:0.374) DBP§
(SBP) 1.04x10⁻⁸ 1.90x10⁻⁶ 100489 -0.16 4.30x10⁻⁴ 249817 -0.18 6.80x10⁻⁹
TNRC6B rs470113 22:40.73 (A:0.804) PP 1.48X10⁻¹⁰ 1.31x10⁻⁹ 122780 -0.14 1.37x10⁻² 284683 -0.25 1.67x10⁻⁹ ALL ancestry
7q32.1 rs4728142 7:128.57 (A:0.433) SBP 8.10x10⁻⁶ 4.21x10⁻⁶ 150542 -0.21 8.62x10⁻⁴ 338338 -0.24 3.45x10⁻⁸
PRKAG1 rs1126930† 12:49.40 (C:0.036) PP 2.12x10⁻⁶ 4.62x10⁻⁷ 151481 0.36 3.74x10⁻³ 314894 0.50 3.34x10⁻⁸
SBNO1 rs1060105 12:123.81 (T:0.209) DBP 6.66x10⁻⁷ 1.09x10⁻⁶ 150532 -0.15 2.67x10⁻³ 336413 -0.18 3.07x10⁻⁸ SNV-BP associations are reported for the newly identified BP loci that showed genome-wide significant association (P<5x10⁻⁸) in the combined discovery and replication meta-analyses. In the columns that contain results from the discovery meta-analyses, Pt represents the P-value for association of the variant with the transformed primary BP trait in the EUR_SAS discovery meta-analyses (used to select the variant for replication) and Pu represents the P-value for association with the untransformed BP trait in the ancestry in which the variant was validated. For four loci (2q36.3, ZBTB38, GPR20 and RRP1B) Pt denotes the association P-value with the primary trait, which is given in parentheses, however, the locus was validated for a secondary trait, which is listed. Loci are categorised into EUR and ALL ancestry based on the ancestry in which the variant showed association with a blood pressure trait at P<5x10⁻⁸. N, β and P, denotes the number of samples, estimated allelic effect and P-value for association with the validated BP trait, are provided for the untransformed BP trait in the replication data and also from the combined (discovery and replication) meta-analyses. NB: ALL ancestry corresponds to all ancestries in the combined (discovery + replication) meta-analyses. Locus – Gene or region containing the SNV, rsID - dbSNP rsID. Chr:Pos (EA:EAF) – Chromosome:NCBI Build 37 position in Mb (effect allele:effect allele frequency), Trait - blood pressure trait for which association is reported, EUR - European. § indicates the trait with which the variant showed the strongest association in the combined meta-analyses. For variants where this trait is different from the primary phenotype, the primary BP trait used to select the variants is shown in the parantheses † indicates it is a non-synonymous SNV (nsSNV) or is linkage disequilibrium with a nsSNV (r2>0.8) that is predicted to be damaging
44

Table 2 Gene-based associations with BP traits from the SKAT model
Gene
Chr:Start-End
n_var
Trait MAFc MAFmin MAFmax P Pcond
EUR (Novel)
A2ML1 12:8.975-9.03 51 HTN 0.01 3.43x10⁻⁶ 0.0077 2.36x10⁻⁶ 9.17x10⁻⁴
EUR_SAS (Novel)
A2ML1 12:8.975-9.03 54 HTN 0.01 2.91x10⁻⁶ 0.0067 6.83x10⁻⁷ 5.00x10⁻⁴
Novel blood pressure associated gene with P<2.8x10⁻⁶ (Bonferroni corrected P-value for the 17,996 genes tested) from the RareMetalWorker (RMW) SKAT test are given. Results are shown from both the EUR and EUR_SAS ancestry datasets. There was no evidence of association of this gene with HTN in the CHARGE+ studies used for replication (P= 0.45). Chr:Start-End – Chromosome: GRCh37 start and end bp coordinates of the Gene in Mb, n_var - number of exonic variants tested., Trait – HTN (Hypertension) or transformed primary quantitative blood pressure trait, MAFc - minor allele frequency filter applied to select variants for the test, MAFmin - minimum MAF of variants tested, MAFmax - maximum MAF of variants tested, P - P-value for association of the gene with the trait, Pcond - P-value for association of gene with the phenotype conditioned on the exonic variant that had the smallest association P-value with the phenotype in the single variant association RMW meta-analysis.
45

Table 3 Results of the genetic risk score analyses across CVD traits and risk factors.
Outcome Units N DBP (per 10mmHg increase) SBP (per 10mmHg increase) PP (per 10mmHg increase)
Effect [95% CI] P Effect [95% CI] P Effect [95% CI] P
CHD OR 82,056 1.62 [ 1.28, 2.05] 5.99x10⁻⁵ 1.39 [ 1.22, 1.59] 6.07x10⁻⁷ 1.70 [ 1.34, 2.16] 1.20x10⁻⁵
Ischemic stroke OR 25,799 1.93 [ 1.47, 2.55] 2.81x10⁻⁶ 1.57 [ 1.35, 1.84] 1.16x10⁻⁸ 2.12 [ 1.58, 2.84] 5.35x10⁻⁷
Cardioembolic stroke OR 16,113 1.43 [ 0.86, 2.39] 0.1683 1.33 [ 0.99, 1.80] 0.0584 1.73 [ 1.00, 3.02] 0.0518 Large vessel stroke OR 13,903 2.26 [ 1.25, 4.08] 0.0068 1.85 [ 1.32, 2.59] 3.61x10⁻⁴ 3.05 [ 1.64, 5.68] 4.37x10⁻⁴
Small vessel stroke OR 15,617 1.96 [ 1.13, 3.41] 0.0168 1.56 [ 1.13, 2.16] 0.0064 1.98 [ 1.09, 3.61] 0.0248
Heart failure OR 13,282 1.48 [ 1.02, 2.17] 0.0409 1.25 [ 1.00, 1.57] 0.0512 1.33 [ 0.88, 2.02] 0.1757
Left ventricular mass g 11,273 9.57 [ 3.98,15.17] 8.02x10⁻⁴ 5.13 [ 1.77, 8.48] 0.0027 5.97 [-0.38,12.31] 0.0653 Left ventricular wall thickness cm 11,311 0.10 [ 0.06, 0.13] 1.88x10⁻⁸ 0.05 [ 0.03, 0.07] 5.52x10⁻⁶ 0.05 [ 0.01, 0.09] 0.0187
HDL mg/dl 80,395 0.25 [-1.00, 1.51] 0.6930 0.21 [-0.50, 0.92] 0.5622 0.47 [-0.79, 1.73] 0.4668
LDL mg/dl 77,021 -1.57 [-5.20, 2.06] 0.3972 0.07 [-2.03, 2.16] 0.9498 1.87 [-1.86, 5.59] 0.3255 Total cholesterol mg/dl 80,455 -1.34 [-5.90, 3.22] 0.5639 0.70 [-1.93, 3.32] 0.6029 3.68 [-0.97, 8.33] 0.1209
Triglycerides mg/dl 77,779 0.02 [-0.03, 0.08] 0.3859 0.02 [-0.01, 0.05] 0.2697 0.03 [-0.03, 0.08] 0.3025
BMI INVT 526,508 -0.10 [-0.18,-0.01] 0.0342 -0.07 [-0.13,-0.02] 0.0058 -0.12 [-0.23,-0.02] 0.0165
WHRadjBMI INVT 344,369 0.03 [-0.04, 0.11] 0.4025 0.03 [-0.02, 0.08] 0.2170 0.06 [-0.03, 0.15] 0.1885
Height INVT 458,927 0.02 [-0.15, 0.18] 0.8592 -0.04 [-0.15, 0.06] 0.4170 -0.18 [-0.37, 0.01] 0.0683 eGFR INVT 51,039 -0.02 [-0.15, 0.11] 0.7810 -0.03 [-0.10, 0.04] 0.4080 -0.07 [-0.20, 0.06] 0.2741 CHD, coronary heart disease; HDL, high density lipoprotein; LDL, low density lipoprotein; eGFR, estimated glomerular filtration rate; DBP, diastolic blood pressure; SBP systolic blood pressure; PP, pulse pressure; OR, odds ratio; g, grams; INVT, inverse normatransformed (hence no units); N, sample size; P, P-value of association of BP with the trait listed; CI, confidence interval. Results are considered significant if P < 0.0038, which corresponds to a Bonferroni correction for 13 phenotypes tested.
464646

Figure 1 Study design and work flow diagram of single variant discovery analyses.
EUR=European, SAS=South Asian, HIS=Hispanic, AA=African American, HTN=hypertension, BP=blood pressure, SBP=systolic blood pressure, DBP= diastolic blood pressure, PP=pulse pressure, N=sample size, MAF=minor allele frequency, P=P-value significance threshold, SNV=single-nucleotide variant, GWS=genome-wide significance *Further details of the selection criteria are provided in the methods.
47

Figure 2 Discovery SNV-BP associations. Results are provided for (a) transformed SBP (b) transformed DBP (c)
transformed PP and (d) HTN in the European and South Asian (EUR_SAS) discovery samples. The y-axis represents –
log10P for association. Red triangles represent variants that map to one of the 81 regions selected for replication, blue
triangles represent SNVs that map to previously published BP regions, and grey triangles represent all remaining SNVs.
SNVs are ordered according to chromosome (black lines on the outside of the plot) and physical position. Genes that
SNVs map to are given in the outer lilac blocks.
48

49

50

51

Figure 3 Overlap of the 30 novel loci associations across SBP, DBP, PP and HTN.
The Venn diagram shows which of the 30 newly identified BP loci are associated with multiple BP traits. Only SNV-BP trait associations that were genome-wide significant (P < 5x10⁻⁸) in the combined discovery and replication meta-analyses are listed for any given BP trait, within the corresponding ancestry dataset that the given locus was validated for (see Tables 1a and 1b). The association of RRAS variant with SBP was replicated in the independent samples, but did not achieve GWS in the combined discovery and replication meta-analysis and is therefore only included for SBP. HTN=hypertension, SBP=systolic blood pressure, DBP= diastolic blood pressure, PP=pulse pressure.
52

53

Figure 4 Study design for conditional analyses and rare variant gene-based discovery analyses.
RMW=RareMetalWorker, EUR=European, SAS = South Asian, HTN=hypertension, BP=blood pressure, SBP=systolic blood pressure, DBP= diastolic blood pressure, PP=pulse pressure. N=sample size, MAF=minor allele frequency, P=P-value significance threshold, Pcond=conditional P-value significance threshold
545454
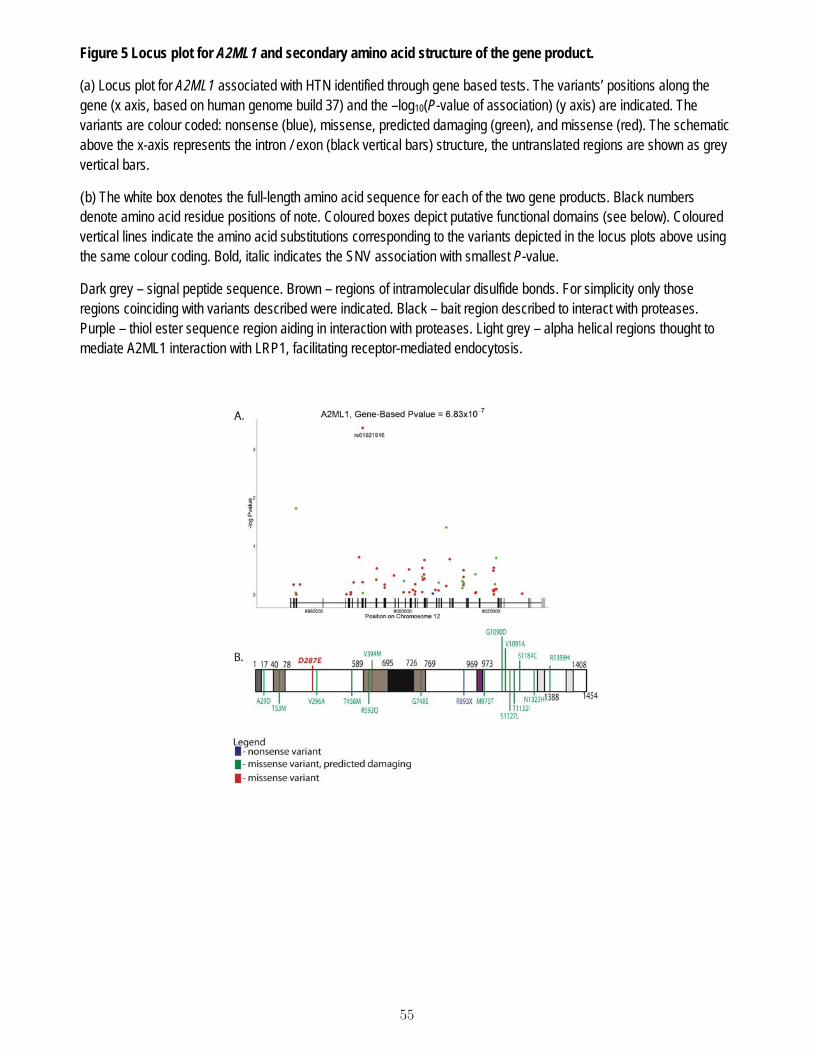
Figure 5 Locus plot for A2ML1 and secondary amino acid structure of the gene product.
(a) Locus plot for A2ML1 associated with HTN identified through gene based tests. The variants’ positions along the gene (x axis, based on human genome build 37) and the –log10(P-value of association) (y axis) are indicated. The variants are colour coded: nonsense (blue), missense, predicted damaging (green), and missense (red). The schematic above the x-axis represents the intron / exon (black vertical bars) structure, the untranslated regions are shown as grey vertical bars.
b) The white box denotes the full-length amino acid sequence for each of the two gene products. Black numbers denote amino acid residue positions of note. Coloured boxes depict putative functional domains (see below). Coloured vertical lines indicate the amino acid substitutions corresponding to the variants depicted in the locus plots above using the same colour coding. Bold, italic indicates the SNV association with smallest P-value.
Dark grey – signal peptide sequence. Brown – regions of intramolecular disulfide bonds. For simplicity only those regions coinciding with variants described were indicated. Black – bait region described to interact with proteases. Purple – thiol ester sequence region aiding in interaction with proteases. Light grey – alpha helical regions thought to mediate A2ML1 interaction with LRP1, facilitating receptor-mediated endocytosis.
55


