
MURDOCH RESEARCH REPOSITORY
This is the author’s final version of the work, as accepted for publication following peer review but without the publisher’s layout or pagination.
The definitive version is available at http://dx.doi.org/10.1111/mec.13622
Allen, S.J., Bryant, K.A., Kraus, R.H.S., Loneragan, N.R., Kopps, A.M., Brown, A.M., Gerber, L. and Krützen, M.(2016) Genetic
isolation between coastal and fishery-impacted, offshore bottlenose dolphin (Tursiopsspp.) populations. Molecular
Ecology, 25 (12). pp. 2735-2753.
http://researchrepository.murdoch.edu.au/31534/
Copyright: © 2016 John Wiley & Sons Ltd
It is posted here for your personal use. No further distribution is permitted.

Acc
epte
d A
rtic
leA
ccep
ted
Art
icle
This article has been accepted for publication and undergone full peer review but has not been through the copyediting, typesetting, pagination and proofreading process, which may lead to differences between this version and the Version of Record. Please cite this article as doi: 10.1111/mec.13622 This article is protected by copyright. All rights reserved.
Received Date: 18-Dec-2014
Revised Date: 17-Feb-2016
Accepted Date: 11-Mar-2016
Article Type: Original Article
Genetic isolation between coastal and fishery-impacted, offshore bottlenose dolphin
(Tursiops spp.) populations
Simon J. Allen1,2*, Kate A. Bryant3, Robert H. S. Kraus4,5, Neil R. Loneragan3, Anna M.
Kopps6,7, Alexander M. Brown1, Livia Gerber6, and Michael Krützen6*
1 Murdoch University Cetacean Research Unit, School of Veterinary and Life Sciences,
Murdoch University, Murdoch, Western Australia 6150, Australia 2 Centre for Marine Futures, School of Animal Biology and Oceans Institute, University of
Western Australia, Crawley, Western Australia 6009, Australia 3 School of Veterinary and Life Sciences, Murdoch University, Murdoch, Western Australia
6150, Australia 4 University of Konstanz, Department of Biology, 78457 Konstanz, Germany 5 Max Planck Institute for Ornithology, Department of Migration and Immuno-Ecology, Am
Obstberg 1, 78315 Radolfzell, Germany 6 Evolutionary Genetics Group, Department of Anthropology, University of Zurich,
Winterthurerstrasse 190, 8057 Zurich, Switzerland 7 Marine Evolution and Conservation, Groningen Institute for Evolutionary Life Sciences,
University of Groningen, 9747 AG Groningen, The Netherlands
*Corresponding authors:
Email: [email protected] [email protected]
Phone: +61 8 416 083 653 +41 44 63 55412

Acc
epte
d A
rtic
leA
ccep
ted
Art
icle
This article is protected by copyright. All rights reserved.
Abstract
The identification of species and population boundaries are important in both evolutionary
biology and conservation. In recent years, new population genetic and computational
methods for estimating population parameters and testing hypotheses in a quantitative
manner have emerged. Using a Bayesian framework and a quantitative model-testing
approach, we evaluated the species affiliations and genetic connectivity of bottlenose dolphin
(Tursiops spp.) populations off remote north-western Australia, with a focus on pelagic
‘offshore’ dolphins subject to incidental capture in a trawl fishery. We analysed 71 dolphin
samples from three sites beyond the 50 m depth contour (the inshore boundary of the fishery)
and up to 170 km offshore, including incidentally caught and free-ranging individuals
associating with trawl vessels; and 273 dolphins sampled at 12 coastal sites within 10 km of
the coast. Results from 19 nuclear microsatellite markers showed significant population
structure between dolphins from within the fishery and coastal sites, but also among dolphins
from coastal sites, identifying three coastal populations. Moreover, we found no current or
historic gene flow into the offshore population in the region of the fishery, indicating a
complete lack of recruitment from coastal sites. Mitochondrial DNA corroborated our
findings of reproductive isolation between dolphins from the offshore population and coastal
sites. Most offshore individuals formed a monophyletic clade with common bottlenose
dolphins (T. truncatus), while all 273 individuals sampled coastally formed a well-supported
clade of Indo-Pacific bottlenose dolphins (T. aduncus). By including a quantitative modelling
approach, our study explicitly took evolutionary processes into account for informing the
conservation and management of protected species. As such, it may serve as a template for
other, similarly inaccessible study populations.
Key words: bycatch; delphinids; gene flow; migration; population structure.
Introduction
Estimating population parameters such as effective population size, migration rate and its
directionality, as well as the degree of admixture, are important in evolutionary biology.
Whether individuals form part of a single, randomly mating population or are members of
different populations with varying levels of genetic isolation also has important bearings on
conservation and management (Frankham et al. 2010; Waples and Gaggiotti 2006). Genetic
data are frequently employed to determine if, and to what extent, samples from different
locations are part of the same population or whether they are genetically differentiated,

Acc
epte
d A
rtic
leA
ccep
ted
Art
icle
This article is protected by copyright. All rights reserved.
because information on geographic separation is not usually sufficient to determine the
degree of isolation (Beerli and Palczewski 2010).
Genetic differentiation among populations may be observed in cases where there has
been long-term separation with low recurrent gene flow, or recent divergence with no
ongoing gene flow (Nielsen and Wakeley 2001; Palsbøll et al. 2004). Discriminating between
these two scenarios has important ramifications for conservation, as isolated populations
impacted by anthropogenic stressors may require different management strategies from those
that may experience homogenizing effects due to gene flow (Hoelzel et al. 1998b; Bilgmann
et al. 2014).
Currently, there is no general framework outlining the levels at which populations are
demographically independent (Waples and Gaggiotti 2006). In migration-drift equilibrium
situations, assuming selective neutrality, genetic differentiation between populations is
negatively correlated with the number of migrants/generations between them. Previous
approaches inferred the number of migrants between populations based on the degree of
genetic divergence between populations, such as Wright’s FST (Wright 1931), based on a
symmetric island model. However, it has been shown that these approaches are problematic;
particularly as the mathematical model underlying the transformation of FST into the number
of migrants/generation makes numerous assumptions, which are biologically unrealistic (e.g.,
Whitlock and McCauley 1999). More recently, individual-based methods have been
developed that allow individuals to be assigned to populations using matching probabilities
(e.g., Pritchard et al. 2000; Corander et al. 2008). Yet, these approaches are not able to
estimate important population parameters, such as the directionality and extent of migration,
mutation, or population size, which may account for the present population structure
(Palsbøll et al. 2007). Such information is important for assessing the impact of human
activity on wildlife, but also difficult to obtain in the marine environment.
Most cetacean species are impacted by human activities in at least some parts of their
geographical range (Whitehead et al. 2000; Read et al. 2006). The incidental capture, or
bycatch, of cetaceans in fisheries is a persistent threat to many populations (Halpern et al.
2007; Reeves et al. 2013), although knowledge of population structure and connectedness is
currently lacking for many species. Gill netting, purse seining and trawling operations result
in the greatest proportions of fisheries-related mortalities (Read et al. 2006; Slooten 2013). In

Acc
epte
d A
rtic
leA
ccep
ted
Art
icle
This article is protected by copyright. All rights reserved.
Australian waters, dolphins interact with prawn- and fish-trawling operations wherever they
occur (e.g., Chilvers and Corkeron 2001; Svane 2005). Off the remote north-western
Australian coastline, dolphins regularly interact with the Pilbara Fish Trawl Interim Managed
Fishery (Pilbara Trawl Fishery or ‘PTF’ hereafter, Jaiteh et al. 2013). Bycatch of a range of
protected species (including dolphins, sawfish and turtles) was first highlighted in the PTF in
2002; with dolphin bycatch initially estimated at ca. 50 individuals per annum (Stephenson
and Chidlow 2003). An estimated minimum of 500 dolphins was caught in the ten years from
2003 until 2012 (Allen et al. 2014).
The variable nature of cetacean-fisheries interactions requires species- and fishery-
specific approaches to bycatch mitigation (Cox et al. 2004, 2007). Without any prior cetacean
research having been conducted in the Pilbara region, the dolphin species interacting with the
PTF was previously undetermined, but assumed to be the common bottlenose dolphin
(Tursiops truncatus) based on a limited number of length measurements and photographs.
Very little is known about common bottlenose dolphins in Australian waters (Ross 2006;
Allen et al. 2012). Bottlenose dolphins are globally widespread in tropical and temperate
waters, occurring in both coastal and pelagic populations (Rice 1998; Reeves et al. 2002).
There are three putative Tursiops species in Australian waters; common bottlenose and Indo-
Pacific bottlenose dolphins (T. truncatus and T. aduncus, respectively) have wide
distributions (Woinarski et al. 2014), and the Burrunan dolphin (T. australis; Möller et al.
2008; Charlton-Robb et al. 2011; but see Committee on Taxonomy 2014), a ‘species’ that is
restricted to a few south-eastern Australian embayments. Common bottlenose dolphins are
thought to occur further offshore and generally in deeper waters than Indo-Pacific bottlenose
dolphins, which inhabit near-shore areas of much of the Australian coastline, including
continental islands and reefs (Woinarski et al. 2014). Indo-Pacific bottlenose dolphins may
mix with and/or be replaced by common bottlenose dolphins in some areas, and many
communities of both these species interact with trawling operations around Australia (Allen
et al. 2014; Woinarski et al. 2014). Although spinner dolphins (Stenella longirostris sp.) also
occur in north-western Australian waters and have been subject to bycatch in commercial
fisheries (Ross 2006), they are morphologically and behaviourally distinguishable from the
Tursiops Genus, and only the bottlenose dolphin phenotype has been reported (by skippers,
crew and fisheries observers) as bycatch in the PTF (Stephenson and Chidlow 2003; Allen et
al. 2014).
Acc
epte
d A
rtic
leA
ccep
ted
Art
icle
This article is protected by copyright. All rights reserved.
While common bottlenose dolphins tend to occur in deeper waters, further offshore
than Indo-Pacific bottlenose dolphins around Australia, the ‘offshore’ dolphins interacting
with the PTF do so between depths of ~ 50 and 100 m (Jaiteh et al. 2013; Allen et al. 2014).
This is not deep by oceanic standards, and coastal T. aduncus can be found in similar depths,
especially when close to islands or where there is a steep gradient adjacent to the coast
(Woinarski et al. 2014). Thus, one cannot assume a priori the absence of gene flow between
the two groups of dolphins (‘coastal’ and ‘offshore’), particularly given the high levels of
hybridization among delphinids (e.g. Bérubé 2009; Schaurich et al. 2012; Brown et al. 2014).
Correct species identification is critical in wildlife management, since even closely
related and morphologically similar species may possess variable behavioural and life history
characteristics (Wade and Angliss 1997; Boness et al. 2002). Here, we used an extended
population genetics toolbox to investigate the species status and population genetic structure
of a number of bottlenose dolphin populations off north-western Australia (Fig. 1), the first
such study in this region. We collected small tissue biopsies from incidentally captured and
free-ranging dolphins interacting with the PTF, dolphins at multiple ‘shallow’ coastal sites
inshore of the fishery and across north-western Australia, and dolphins in deeper waters off
the North West Cape (Fig. 1). We aimed to determine whether dolphins interacting with the
PTF showed greater genetic affinities to the common bottlenose dolphin (T. truncatus), the
Indo-Pacific bottlenose dolphin (T. aduncus), or other closely related delphinid taxa.
Furthermore, in addition to the traditionally used combination of basic genetic summary
statistics and population structure analysis, we included explicitly model-based, coalescent
analyses of genetic connectedness among dolphin populations across the region. In particular,
we aimed to elucidate whether there was recruitment into the PTF-associated population/s
from nearby coastal sampling sites.
Materials and Methods
Sample collection and fishery characteristics
Biopsy sampling efforts were focussed at 15 sites around north-western Australia (Fig. 1).
The Pilbara Trawl Fishery is bound by longitudes of 116ºE to the west and 120ºE to the east,
and by an approximation of the 50 m depth contour inshore and the 100 m depth contour
offshore (Fig. 1). Four management areas are open to trawl fishing, representing an area of
ca. 23,000 km2. Three vessels operated in the PTF at the time of the study and they

Acc
epte
d A
rtic
leA
ccep
ted
Art
icle
This article is protected by copyright. All rights reserved.
completed between ca. 7,300 and 10,300 h of trawling per annum from 2010 to 2012
(Fletcher and Santoro 2013).
FIGURE 1
All dolphin biopsy samples from within the fishery were collected between ~ 50 and
170 km offshore, in water > 50 m deep, and over an east-west distance of ~ 300 km. An
eastern (Site 15) and a western (Site 14) cluster of samples were collected in the PTF (Fig. 1).
Another three samples were collected in water ~ 300 km to the south-west of the PTF: in
deep (101 m) water offshore of the North West Cape (Site 13, ‘NW Cape offshore’, 114°E,
Fig. 1). These three samples were included in this study to provide potential insight, albeit
limited by the small sample size, into genetic connectedness of the PTF-associated dolphins
to other ‘offshore’ populations.
Coastal biopsy sampling of bottlenose dolphins occurred at 12 sites in waters < 50 m
deep and within about 10 km of the coastline, extending from Useless Inlet (Site 1, 26.1°S,
113.3°E) in Shark Bay in the south-west to Cygnet Bay (Site 12, 16.5°S, 123.0°E) in King
Sound in the north-east, spanning ~ 2,000 km of coastline (Fig. 1).
A total of 344 dolphin samples were collected between 2008 and 2013 (except those
from Shark Bay, Sites 1-4, which were obtained between 1998 and 2013) and used for
genetic analyses in this study. The subset of 68 samples of PTF-associated dolphins included
three incidentally caught individuals and 65 free-ranging animals obtained during
commercial fish trawling operations, on four trips to sea between 2008 and 2011. Biopsies
from free-ranging dolphins were obtained using the PAXARMS remote biopsy system
(Krützen et al. 2002) from a small (4.5 m) tender, and a biopsy pole (Bilgmann et al. 2007)
for sampling individual dolphins close to the bow or stern of trawl vessels (and a large
research vessel for the three samples obtained in deeper waters offshore of the North West
Cape). All 273 bottlenose dolphins sampled from the 12 coastal sites were collected from
free-ranging dolphins using the PAXARMS remote biopsy system from small (5.5 m)
research vessels.

Acc
epte
d A
rtic
leA
ccep
ted
Art
icle
This article is protected by copyright. All rights reserved.
Generation of genetic data
DNA was extracted from biopsy samples using the Qiagen Gentra tissue kit following the
manufacturer’s instructions. The extracted genomic DNA was resuspended in TE buffer
(10mM Tris, 1mM EDTA, pH 8) and the concentration adjusted to 20ng/µl. Sex
determination was carried out by amplification of the sex specific ZFX and SRY loci using a
multiplex PCR (Gilson et al. 1998).
A 430 base-pair part of the hyper-variable region I of the mitochondrial control region
(HVR-I) was amplified using primers dlp1.5 and dlp5 (Baker et al. 1993). PCR products were
cleaned up using silica membrane spin columns (GeneEluteTM by Sigma-Aldrich) and
sequenced using the Cycle Sequencing Ready Reaction kit (BigDye Terminator v3.1 -
Applied Biosystems), based on the protocol described in Bacher et al. (2010), using
sequencing primer dlp 1.5. SEQUENCING ANALYSIS v5.2 and BIOEDIT v7.0.5.3 were used to
visually quality control, edit and align the sequences.
Nineteen microsatellite loci were amplified using two different multiplex PCR regimes:
multiplex 1 - Tur4_98, Tur4_117, MK6, E12, Tur4_105, Tur4_108, Tur4_66, Tur4_111,
Tur4_128; multiplex 2 - KWM12, MK3, MK5, MK8, MK9, Tur4_142, Tur4_153, Tur4_162,
Tur4_80, Tur4_132 (Krützen et al. 2001; Hoelzel et al. 1998a; Nater et al. 2009). PCRs
contained 20 ng template DNA, 5 μl 2× Multiplex PCR Master Mix (Qiagen, containing
HotStarTaq DNA Polymerase, dNTPs and 3 mM MgCl2 final concentration), between 0.05
and 0.5μM of each primer and ddH2O to a final volume of 10μl. Diluted PCR products were
denatured in 10µl HiDi formamide containing 0.07µl of GeneScanTM500LIZ size standard
(Applied Biosystems). The length of the DNA fragments was determined by running the PCR
products on an ABI 3730 DNA Sequencer (Applied Biosystems) and analysing the output
files using GENEMAPPER v4.0. We independently amplified and scored 20 randomly selected
individuals to estimate error rate for the microsatellite scoring. Our error rate was determined
to be 0.0039 (three scoring differences in 760 alleles).
Population structure and gene flow
Population structure and genetic connectedness among sampling localities were inferred
using both summary statistics and individual-based approaches based on microsatellite data.
Genetic variation within sampling sites was estimated by calculating the number of alleles
and effective alleles, observed (HO), expected (HE) and unbiased expected heterozygosity

Acc
epte
d A
rtic
leA
ccep
ted
Art
icle
This article is protected by copyright. All rights reserved.
(UHE) in GENALEX v6.5 (Peakall and Smouse 2012). Tests for departure from Hardy-
Weinberg equilibrium (HWE) and the occurrence of linkage disequilibrium and null alleles
were carried out for each sampling site in GENEPOP v4.2.1 (Rousset 2008), with Bonferroni-
corrected significance levels (Rice 1989). Estimates of FST (Weir and Cockerham 1984) and
Jost’s D (Jost 2008) were calculated in GENEPOP and GENODIVE (Meirmans and van
Tienderen 2004), respectively.
The software package STRUCTURE v2.3.3 (Pritchard et al. 2000) was used to determine
the genetic structure and number of genetic clusters in our dataset. In particular, we were
interested in the levels of genetic connectedness among the PTF-associated population/s and
the 12 coastal dolphin sampling localities. The STRUCTURE algorithm divides sampled
individuals into a number of clusters (K) independent of locality information by minimizing
deviations from Hardy-Weinberg and linkage equilibrium in each cluster. The program uses a
Markov Chain Monte Carlo (MCMC) procedure to estimate P(X|K), the posterior probability
that the data fit the hypothesis of K clusters.
Three different STRUCTURE analyses were conducted. For all analyses, we used no prior
information. The length of the burn-in period was set to 105, followed by 106 MCMC steps.
For each K (the maximum number of K for each analysis was the number of sampling
locations for the respective analysis), the analysis was run ten times. The first, global analysis
involved all samples and used an admixture model with correlated allele frequencies and no
prior information. For the two subsequent analyses, we chose the ‘Locprior’ model, which
improves clustering when the signal is weak without spuriously inferring structure, if absent
(Hubisz et al. 2009). The second analysis was carried out on PTF individuals only, while the
third analysis incorporated only the 12 coastal populations. Since the P(X|K) estimator has
been shown to overestimate K, as it frequently plateaus at higher values than biologically
meaningful estimates of K, we also calculated the ΔK statistic (Evanno et al. 2005). This
provides a very conservative estimate of K only at the highest biological level and was
performed using the software STRUCTUREHARVESTER (Earl and vonHoldt 2012).
In addition, a factorial correspondence analysis projecting all genotypes on the factor
space, which is defined by the similarity of their allelic states, as implemented in GENETIX
v4.05.2 (Belkhir et al. 2004), was used to visualize the degree of dissimilarity among
sampling sites.

Acc
epte
d A
rtic
leA
ccep
ted
Art
icle
This article is protected by copyright. All rights reserved.
Migration patterns and gene flow among the PTF population and selected coastal
populations were inferred based on two coalescence modelling approaches. The first
approach was implemented in MIGRATE-N v3.6.4 (Beerli and Felsenstein 2001; Beerli 2006),
which is based on an equilibrium island model to estimate genetic diversity of each defined
population and all pairwise migration rates between these. This analysis was based solely on
microsatellite data as the software does not implement a correction for differing inheritance
modes, i.e. mtDNA vs nuclear DNA. In order to reduce the number of parameters in our
models to arrive at a computationally and statistically tractable analysis, some relevant
sampling sites were pooled into three populations (as identified in our STRUCTURE analysis,
see Results): Pilbara Trawl Fishery (Sites 14-15), Shark Bay (Sites 1-4), and ‘Other Coastal’
populations (Sites 5-11; Cygnet Bay was excluded because our STRUCTURE and factorial
correspondence analyses revealed at least some Cygnet Bay individuals to be genetically
different). Four different models (Table 2) constraining the presence, directionality, and
amount of gene flow among the three pooled sampling sites were defined. Model 1 allowed
full migration between all population pairs (full model). One cannot define a model that sets
migration among PTF and all other populations to nought because, under such circumstances,
coalescence trees could not be calculated and general assumptions of the MIGRATE-N
approach were violated. Therefore, model 2 allowed only very limited gene flow from and to
PTF (≈ nought migration, but sufficient to match MIGRATE-N’s needs with regard to
coalescence trees). This effectively rendered the PTF population isolated from both Shark
Bay and Other Coastal populations, while it allowed full migration between Shark Bay and
Other Coastal populations (low migration PTF model). In model 3, gene flow from the PTF
population into the Shark Bay and Other Coastal was allowed, but not vice versa. In model 4,
gene flow from Shark Bay and Other Coastal populations to the PTF was allowed, but not
vice versa. Convergence was achieved by running each model for more than 80,000 CPU
hours, parallelized over 240 CPUs. We used 50 independent, replicate runs, each with its own
burn-in and heating scheme (see below), to later join the results (c.f., Hartmann et al. 2013).
We regard the emergence of clear, unimodal posterior distributions across all these replicates
as a strong indicator of convergence.
The run parameters for MIGRATE-N were as follows: for Θ (population size parameter,
scaled to mutation rate) and M (migration rate parameter), a uniform prior was used. The
prior range for Θ was set to 0-10 (mean 5; Δ 1; 20,000 bins) and for M 0-100 (mean 50; Δ 10;
20,000 bins). Mutation rates of loci were allowed to vary. Five hundred coalescent samples

Acc
epte
d A
rtic
leA
ccep
ted
Art
icle
This article is protected by copyright. All rights reserved.
were recorded per replicate, one every 100 iterations, thus sampling 25,000 (50 x 500)
parameter values from chains comprising a total of 2,500,000 iterations. A static heating
scheme (4 chains with temperatures 1,000,000; 3; 1.5; 1) and a burn-in of 200,000 steps was
applied to each replicate. Model comparisons were carried out using marginal likelihoods
calculated using the thermodynamic integration (’Bezier’) in MIGRATE-N (Beerli and
Palczewski 2010). The estimated mutation scaled migration parameter M was translated into
the effective number of immigrants per generation (Nm), as detailed elsewhere (Kraus et al.
2013, Jonker et al. 2013).
The second coalescence approach to assess migration patterns and gene flow between
the PTF population and selected coastal populations was implemented in IMA2 (Nielsen and
Wakeley 2001; Hey and Nielsen 2007; Hey 2010). This approach is based on an isolation-
with-migration (IM) model (allows for lack of gene flow, as opposed to MIGRATE-N) and
uses Metropolis-coupled Markov chains to approximate posterior distributions of population
size, gene flow, and divergence time. Similar to our MIGRATE-N analysis, relevant sampling
sites were pooled into three populations (as identified in our STRUCTURE analysis, see
Results): Pilbara Trawl Fishery (PTF, Sites 14-15), Shark Bay (Sites 1-4), and Other Coastal
(Sites 5-11, i.e. Cygnet Bay excluded). In contrast to the MIGRATE-N analysis, however, we
also included mtDNA data, because the software has a built-in ability to weigh across
different inheritance modes. As IMA2 is slow for large multi-locus data sets, we randomly
selected 30 individuals from each of the three populations.
For the IMA2 analysis, we used uniform priors for divergence times and population
sizes. For migration rates, exponential priors may be more informative when actual rates of
gene flow are very low or nought (Runemark et al. 2011). However, among our three
populations, gene flow might be substantial among the Other Coastal and Shark Bay
populations. Thus, we also used uniform priors for migration rates. Mutation rates were set to
4.8 x 10⁻⁸ (range 3.1 x 10⁻⁸ to 6.9 x 10⁻⁸; Oremus et al. 2007) mutations/year for mtDNA, and
1.5 x 10⁻⁵ (Brohede and Ellegren 1999) for all microsatellite loci. Upper limits for divergence
time were set to t = 30, population size Θ = 150, and migration rate M = 50. The latter value
appears high, but several initial runs (burn-in period of 20,000 and run length of 100,000) had
shown that the parameter estimate of M between the Other Coastal and Shark Bay
populations was very high. We carried out several independent runs. In each run, to ensure
adequate mixing of the Markov chain, we used Metropolis-coupling of 60 independent heated

Acc
epte
d A
rtic
leA
ccep
ted
Art
icle
This article is protected by copyright. All rights reserved.
chains (Geyer 1992). Burn-in took place until stationarity was reached by assessing burn-
trend plots for each run. The most heated chain had a heating factor of 0.9, with other chains
having heating values between 1 and 0.9. As suggested by Hey (2010), stationarity for each
run was evaluated by assessing autocorrelations of splitting time terms, the absence of trends
in splitting time trend plots, and by the degree of similarity between parameter estimates from
genealogies generated during the first and the second half of the run.
To obtain estimates of magnitude and direction of contemporary gene flow between
pairs of pooled populations, we used the software BAYESASS, v3.0.3 (Wilson and Rannala
2003). This approach uses an MCMC algorithm to estimate the posterior probability
distribution of the proportion of migrants between pairs of populations without assuming
genetic equilibrium. We used the same three population classifications as for the MIGRATE-N
and IMA2 analyses, plus a fourth (Cygnet Bay, as BAYESASS accommodates for a larger
number of populations with a moderate number of markers), and conducted five independent
runs for 10,000,000 generations, while discarding the first 1,000,000 generations as burn-in.
Mixing parameters for the five runs were m = 0.3, a = 0.5, and f = 0.5.
Finally, to learn more about coastal dolphin population structure, we conducted an
isolation-by-distance analysis (Wright 1943) for all coastal populations, i.e. Shark Bay (sites
1-4) and Other Coastal populations (sites 5-12, i.e. including Cygnet Bay), based on our
microsatellite data. Geographic distances between each sampling site were measured in the
most direct line through the water using ARCGIS, v. 9.2 (ESRI), where the centroids for each
population were estimated by including each sample taken at a particular site. We tested for a
decrease in genetic similarity (based on FST) with increasing geographic distance, using a
Mantel test implemented in IBDWS, v.3.23 (Jensen et al. 2005). Significance was evaluated
by 10,000 randomizations.
Phylogenetic analyses
The mitochondrial DNA (mtDNA) sequence alignment was trimmed to the shortest
sequence, and part of the 5’ tRNA sequence was removed, resulting in a 399bp fragment.
Identical haplotypes were collapsed using DAMBE v5.0.72 (Xia and Xie 2001). We used a
General Time Reversible Model with gamma-distributed rate variation across sites and a
proportion of invariable sites, as implemented in MRBAYES v3.2, thereby sampling across the
substitution model space in the Bayesian MCMC analysis itself (Huelsenbeck et al. 2004).

Acc
epte
d A
rtic
leA
ccep
ted
Art
icle
This article is protected by copyright. All rights reserved.
Parameters for the MRBAYES run were four chains running for 10,000,000 generations, with a
sampling frequency of 1,000 and a burn in of 2,500 data points. Consensus trees were
displayed and printed using FIGTREE v1.1.2 (http://tree.bio.ed.ac.uk/).
To assess phylogenetic affiliations of the PTF-associated bottlenose dolphins with other
delphinids, previously published HVR-I sequences from the following species and regions
were included in the analysis: common (T. truncatus) and Indo-Pacific (T. aduncus)
bottlenose dolphins, principally from Chinese and Indonesian waters (Wang et al. 1999), as
well as the recently delineated Burrunan dolphin from Victoria, Australia (T. australis;
Charlton-Robb et al. 2011) and Fraser’s dolphins (Lagenodelphis hosei; Caballero et al.
2008) (Supplementary Information Table 1). We also included T. aduncus samples from
coastal south-eastern Australia (Möller and Beheregaray 2001; Möller et al. 2008;
Wiszniewski et al. 2010). The tree was rooted with an Atlantic white-sided dolphin
(Lagenorhynchus acutus; Cipriano 1997) sequence as an outgroup (Supplementary
Information Table 1).
Results
All 19 microsatellite loci were in Hardy-Weinberg equilibrium. No significant linkage
disequilibrium or consistent occurrence of null alleles in markers across all populations was
observed. Allelic diversity and heterozygosity values were generally higher for the PTF
samples compared to coastal sampling sites (Supplementary Information Table 2). The
pairwise FST values obtained from microsatellite data were small (generally < 0.06), but
significant among almost all sampling sites (Table 1). The highest values (generally > 0.20)
were observed for all pairwise comparisons between offshore and coastal sampling sites
(Table 1). This suggests a longer period of isolation between offshore and coastal populations
than among different coastal sampling sites. Pairwise values for Jost’s D were generally
larger than FST values. In particular, pairwise comparisons between PTF and coastal
populations were on average two to three times larger for Jost’s D than for FST, suggesting
that FST underestimates divergence (Whitlock 2011).
TABLE 1
For the global dataset containing all samples, the Evanno method identified that K = 2
clusters was the most likely scenario. The Structure analysis illustrated a clear pattern of
genetic differentiation between the offshore (both the PTF and NW Cape offshore) and all
Acc
epte
d A
rtic
leA
ccep
ted
Art
icle
This article is protected by copyright. All rights reserved.
coastal sampling sites (Fig. 2A). For higher K values for the global data set, visual inspection
revealed four clusters: (i) the four Shark Bay coastal sites; (ii) all coastal sites from Coral Bay
to Beagle Bay; (iii) coastal Cygnet Bay; and (iv) the NW Cape offshore and PTF (Fig. 2A).
When only PTF samples were considered, K = 1 had the highest probability, suggesting
no genetic sub-structuring within the PTF. There was also no indication of any admixed
individuals within the PTF, which could have been conceivable given the occurrence of
Fraser’s dolphin haplotypes in the PTF dataset (see below). When only coastal samples were
considered (Fig. 2B), Shark Bay sites formed a distinct cluster from all other coastal sites,
which was also supported by the Evanno method (Δ K = 2). At K = 3 and higher, samples
from Cygnet Bay became distinct, but the remaining coastal populations formed one cluster.
FIGURE 2
The factorial correspondence analysis based on 19 microsatellite loci (Fig. 3) strongly
supported the STRUCTURE results. Samples from the PTF formed a single distinct cluster
compared to all other samples, including NW Cape offshore. Among the coastal sites, the
four Shark Bay sites in the south-west were clearly distinct from other sites across the north-
west, while Cygnet Bay was distinct in the north-east. All other coastal sites could not be
distinguished from each other (Fig. 3). An isolation-by-distance analysis on coastal samples
only revealed a highly significant correlation (r = 0.48, P < 0.01) among all individual coastal
sites (Fig. 4).
FIGURE 3, FIGURE 4
Based on the STRUCTURE results, we pooled most sampling localities into three
‘populations’ to analyse migration patterns among the combination of: (i) all four Shark Bay
coastal sites (‘Shark Bay’), (ii) all other coastal sites, other than Cygnet Bay (‘Other
Coastal’), and (iii) PTF West and East into a single population (‘PTF’).
Our model comparisons showed a clear lack of migration into the PTF population from
any of the coastal populations (Table 2). The model with the lowest support was that which
allowed free migration among all populations (Table 2). Thus, our results suggest strongly
that the PTF population is reproductively isolated from coastal populations, with no
recruitment of dolphins into the PTF population from nearby coastal areas.
Acc
epte
d A
rtic
leA
ccep
ted
Art
icle
This article is protected by copyright. All rights reserved.
TABLE 2
We based our parameter estimates of Θ (a mutation-scaled measure for population size)
and Nm (the head-count of effective migrants per generation) on the model that allowed
estimation of Θ for all populations. As expected, Θ was highest for the pelagic PTF
population (Θ = 6.37, 95% CI = 5.60-7.26). The coastal populations had smaller Θ values
(Shark Bay Θ = 0.78, 95% CI 0.53-1.00; Other Coastal Θ = 2.90, 95% CI = 2.48-5.29). Since
there was no gene flow from the PTF to any of the coastal populations, we only report Nm
estimates between the latter. The Nm estimate differed significantly from nought in both
cases, with Nm values from Shark Bay to Other Coastal populations being higher (SBOC:
Nm = 4.31, 95% CI = 3.70-7.89; OCSB: Nm = 0.21, 95% CI = 0.14-0.26). Importantly, in
all models, regardless of their level of support, the Nm parameter estimates concerning
migration into the PTF population were always small and confidence intervals included 0,
providing further evidence of the lack of recruitment of dolphins into the PTF population
from nearby coastal areas. Result files for each model are available online as supplementary
material.
Our IMA2 analyses corroborated those obtained by MIGRATE-N. Effective population
size was largest for the PTF population (Fig. 5, Θ = 2.46, 95% CI = 1.57-3.5) and smaller in
the coastal populations (Shark Bay Θ = 0.44, 95% CI 0.04-1.09; Other Coastal Θ = 1.65, 95%
CI = 0.56-4.56). Migration rate parameters were only significant between Shark Bay and
Other Coastal populations (Log-likelihood ratio (LLR) = 5.45, P < 0.01) and vice versa (LLR
= 2.87, P < 0.05, Fig. 5). The 95% confidence intervals of all migration parameters between
the PTF and the two coastal populations included 0 and were not significant (Fig. 5),
providing further evidence for the lack of gene flow between the PTF and all coastal
populations.
FIGURE 5
The results from the MIGRATE-N and IMA2 analyses were corroborated by our findings
based on BAYESASS (Table 3). We could not detect any significant migration from the coastal
populations into the PTF population and vice versa. In general, the proportion of detected
migrants within each population (other than Cygnet Bay, which received about 28% of
migrants from the Other Coastal population) was small, and the 95% confidence interval
included 0 in almost every comparison. These findings suggest strongly that there is no, or at
Acc
epte
d A
rtic
leA
ccep
ted
Art
icle
This article is protected by copyright. All rights reserved.
most only extremely low, migration between the PTF, and the Shark Bay and Other Coastal
populations.
TABLE 3
The phylogenetic analyses based on mtDNA revealed some unexpected patterns. We
identified 17 unique haplotypes among all individuals collected from within the two sampling
sites in the PTF (Sites 14 and 15, Fig. 1), as well as those collected in deep water offshore of
the North West Cape (Site 13). These haplotypes formed a well-supported, monophyletic
clade with the common bottlenose dolphin. Within this clade, however, clear resolution was
lacking (Fig. 6). The haplotype of six individuals sampled within the fishery formed a well-
supported monophyletic clade (posterior probability of 0.97) with Fraser’s dolphin
haplotypes (Fig. 6), an unexpected result that is discussed below. While at-sea differentiation
among delphinids can be difficult, all observations and photographs taken during offshore
field trips were of the common bottlenose dolphin phenotype. All of the bottlenose dolphins
sampled in the coastal regions of north-western Australia formed a highly supported
monophyletic clade (posterior probability of 1.00) with other Indo-Pacific bottlenose
dolphins (T. aduncus; Figs. 1, 6).
FIGURE 6
Discussion
Lack of contemporary and historic gene flow between fishery-impacted and coastal dolphins
All our analyses based on nuclear microsatellite data suggest strongly that the bottlenose
dolphins sampled in the offshore, pelagic environment (Tursiops truncatus) are genetically
isolated from those sampled coastally (T. aduncus). Both the STRUCTURE and factorial
correspondence analyses revealed four clusters of individuals that were geographically
separated (one offshore and three coastal ‘populations’). Similarly strong patterns of
segregation have been reported in other small cetaceans. For example, Perrin et al. (2011)
used cranial osteological differentiation to support previous assertions, based on molecular
data, for the existence of coastal and offshore forms of common bottlenose dolphins (T.
truncatus) in Californian waters. Also, false killer whale (Pseudorca crassidens) populations
sampled offshore in the central and eastern Pacific were recently differentiated from those
that are resident and island-associated around the Hawai’ian Archipelago (Martien et al.
2014).
Acc
epte
d A
rtic
leA
ccep
ted
Art
icle
This article is protected by copyright. All rights reserved.
Our STRUCTURE and factorial correspondence analyses, however, did not reveal
whether the genetic isolation between the PTF and coastal populations is due to historic
cessation of gene flow (i.e. reproductive isolation followed by speciation), or recent
divergence. All analyses pertaining to migration rates revealed an absence of gene flow from
any coastal population into the PTF population and vice versa, strongly suggesting that the
bottlenose dolphin population that is subject to incidental capture in the PTF is genetically
isolated from all the adjacent, coastal dolphins, and does not recruit from these coastal
dolphin populations. Furthermore, we found no evidence of hybridisation between the pelagic
common bottlenose dolphins (T. truncatus) and the coastal Indo-Pacific bottlenose dolphins
(T. aduncus). This finding is consistent with that for these two species in Chinese waters,
which, despite some areas of overlap in distribution, were found to be reproductively isolated
and did not share haplotypes (Wang et al. 1999; Yang et al. 2005).
In our study, the pelagic common bottlenose dolphins showed less genetic sub-
structuring than the coastal Indo-Pacific bottlenose dolphins sampled across a similar
geographic distance. Furthermore, the mutation-scaled, effective population sizes (Θ) of
common bottlenose dolphins were much larger than those of the Indo-Pacific bottlenose
dolphin population in Shark Bay and the combined coastal populations. These results were to
be expected, given the more complex coastal habitat, environmental and social barriers to
gene flow, and limited dispersal (Krützen et al. 2004; Frère et al. 2010), as well as the
propensity for coastal Tursiops of both species to adapt rapidly to local habitats (e.g., Hoelzel
et al. 1998b; Sellas et al. 2005; Wiszniewski et al. 2010). Common bottlenose dolphins of
open, pelagic environments are capable of long-distance movements: for example, Wells et
al. (1999) documented travel distances of ca. 2,000 and > 4,000 km in < 50 days by two
satellite-tracked individuals off the east coast of the United States. Furthermore, Quérouil et
al. (2007) found no genetic differentiation among common bottlenose dolphins from the
Azores, Madeira and other offshore areas of the north-east Atlantic, suggesting that they form
a large, pelagic population. The lack of baseline data on Australian common bottlenose
dolphins means it is not possible to assess whether the population in the PTF region is an
isolated unit or forms part of a large, pelagic population (Ross 2006). The relatively large Θ
supports the latter view, but our factorial correspondence analysis revealed some segregation
between common bottlenose dolphins in the PTF and those of the North West Cape (Fig. 3),
and photographic evidence shows that at least a proportion of the PTF-associated population
display long-term fidelity to foraging around the trawlers (Allen 2015).

Acc
epte
d A
rtic
leA
ccep
ted
Art
icle
This article is protected by copyright. All rights reserved.
Pelagic, common bottlenose dolphins of north-western Australia
Most dolphins associated with the PTF, as well as those sampled in deeper waters off the
North West Cape, exhibited haplotypes that form a monophyletic clade with those previously
published for common bottlenose dolphins (T. truncatus) from Chinese and Indonesian
waters. Until the current study, the Chinese and Indonesian haplotypes were the only
available reference samples for T. truncatus in this region, despite the fact that they are
globally widespread in both coastal and pelagic populations (Rice 1998; Reeves et al. 2002).
Bottlenose dolphins are polytypic, with two species recognized based on both genetics
and morphology; T. truncatus and T. aduncus (Rice 1998; Wang et al. 1999; Wang et al.
2000a, b), and a third species proposed recently; T. australis (Möller et al. 2008; Charlton-
Robb et al. 2011). The number of species/subspecies in the complex, however, remains to be
resolved (e.g., Natoli et al. 2004), with the Society for Marine Mammalogy currently
recognizing only T. truncatus and T. aduncus (Committee on Taxonomy 2014). All three
putative species are present in Australian waters, with T. truncatus generally thought to occur
further offshore and in deeper waters than T. aduncus (Ross 2006), a pattern confirmed for
north-western Australia in this study.
The use of the mitochondrial control region for phylogenetic species identification has
also proven effective in a range of other studies for closely related delphinids (e.g., Rosel et
al. 1994; Möller and Beheregaray 2001; Ross et al. 2003; Beasley et al. 2005). This marker
system also has limitations, however, and its usefulness for species identification depends on
the evolutionary distinctiveness of the taxa in question. In studies attempting to elucidate the
evolutionary relationships amongst the Delphininae, the use of a single mitochondrial gene
has provided limited resolution, due to high levels of intraspecific variation and low
interspecific differences (Kingston et al. 2009; Viricel & Rosel 2012). Kingston et al. (2009)
found that data from amplified fragment length polymorphisms (AFLPs), representing many
nuclear genes, gave better resolution. However, even the use of genome-wide multi-locus
datasets such as this, and others (Xiong et al. 2009; McGowen 2011; Zhou et al. 2011), have
not been able to resolve relationships unambiguously within the Delphininae, which is
thought to have undergone a recent and rapid radiation (Kingston et al. 2009; Vilstrup et al.
2011; Hassanin et al. 2012).

Acc
epte
d A
rtic
leA
ccep
ted
Art
icle
This article is protected by copyright. All rights reserved.
In our study, both T. truncatus and T. aduncus formed well-supported monophyletic
clades, as has been documented elsewhere (e.g., Möller & Beheregaray, 2001; Moura et al.
2013). Most individuals from within the PTF, and elsewhere offshore, fell within the T.
truncatus clade, providing strong evidence that it is predominantly common bottlenose
dolphins associating with the fishery. These results were corroborated by the lack of both
historic and contemporary gene flow between the PTF-associated common and coastal Indo-
Pacific bottlenose dolphins, identified from our microsatellite data and two independent
approaches to estimate gene flow.
Unexpectedly, some offshore individuals exhibited a haplotype that shares a close
affinity to Fraser’s dolphin haplotypes. Fraser’s dolphins occur primarily in waters deeper
than 1,000 m (Reeves et al. 2002). They are rarely found in shallow waters or near-shore
environs, and field guides and texts report Fraser’s dolphins in mixed-species assemblages
only with false killer, melon-headed (Peponocephala electra) and sperm (Physeter
macrocephalus) whales, as well as Risso’s (Grampus griseus), pan-tropical spotted (Stenella
attenuata) and striped (S. coeruleoalba) dolphins (Carwardine 1995; Reeves et al. 2002;
Dixon 2008; Jefferson et al. 2008). Fraser’s dolphins have not been observed in mixed
assemblages with bottlenose dolphins, nor would they be expected in the relatively shallow
waters (50 to 100 m deep) in which the PTF operates.
There are three plausible explanations for the occurrence of the Fraser’s dolphin
haplotypes among the PTF-associated dolphins. First, both T. truncatus and L. hosei may
have been present in the groups of dolphins that were sampled. However, a careful re-
examination of all photographs taken in the field revealed only the bottlenose dolphin
phenotype, and the STRUCTURE analysis did not reveal any admixed individuals within the
PTF. Second, incomplete lineage sorting may have led to the observed pattern. Under a
neutral model of evolution, the stochastic lineage sorting leading to reciprocal monophyly
proceeds more slowly in large or rapidly diverging populations. In many groups of species
with large population size, such as the Delphinidae (Rice 1998; McGowen 2011), genomes
will have mixed support for monophyly unless historical bottlenecks have accelerated
coalescence. For instance, Kingston et al. (2009) used anonymous nuclear and mtDNA
markers to elucidate the phylogenetic relationships among the Delphininae. In their analysis,
L. hosei showed high affinity to T. aduncus for both marker systems, suggesting recent
shared ancestry between Tursiops and Lagenodelphis. A third explanation for the occurrence
Acc
epte
d A
rtic
leA
ccep
ted
Art
icle
This article is protected by copyright. All rights reserved.
of Fraser’s dolphin haplotypes among the PTF-associated bottlenose dolphins is that
introgression events have taken place, in which Fraser’s dolphin mtDNA entered the
population through hybridisation.
Coastal, Indo-Pacific bottlenose dolphins of north-western Australia
Indo-Pacific bottlenose dolphins (T. aduncus) inhabit near-shore areas of much of the
Australian coastline (Ross 2006; Woinarski et al. 2014; this study). Occurring in the shallow,
coastal waters of the western Pacific and Indian Oceans, Indo-Pacific bottlenose dolphins
thereby occupy a niche otherwise filled by coastal ecotypes of common bottlenose dolphins
in various other regions (e.g., the coastlines of New Zealand, the central and eastern Pacific
Ocean, the western and eastern Atlantic Oceans, and the Mediterranean Sea – Natoli et al.
2005; Tezanos-Pinto et al. 2009; Moura et al. 2013; Fruet et al. 2014).
Our study also revealed a strong isolation-by-distance pattern among coastal Indo-
Pacific bottlenose dolphin (sub-) populations across north-western Australia. Fine-scale
genetic structuring over scales of just tens to hundreds of kilometres should be viewed as the
rule rather than the exception in coastal Australian Indo-Pacific bottlenose dolphins (e.g.,
Wiszniewski et al. 2009; Ansmann et al. 2012; Kopps et al. 2014), as it should be in coastal
common bottlenose dolphins globally (Fernández et al. 2011; Mirimin et al. 2011; Moura et
al. 2013; Browning et al. 2014; Fruet et al. 2014; Louis et al. 2014). Here, however, we
document the existence of a genetic cline among coastal locations over some hundreds of
kilometres (Beagle Bay to Coral Bay, Fig. 1).
An exception to this was the marked genetic differentiation between the dolphins
sampled at the two extreme north-east coastal sites (Cygnet Bay and Beagle Bay), located in
close proximity to each other (< 150 km apart). The dolphins from Beagle Bay, however,
clustered closely with the rest of the coastal populations, distinct from Cygnet Bay. Similar
differentiation was detected between Australian snubfin dolphin populations of Cygnet Bay
and Roebuck Bay (to the south of Beagle Bay), ~ 300 km apart (Brown et al. 2014). The
reasons for this differentiation, which was detected at a smaller spatial scale than elsewhere
in the study area, are unknown. The relatively narrow, deep-water entrance to Cygnet Bay,
subject to immense tidal movements (~ 12 m on spring tides), may act as a natural barrier to
dispersal. Additional sample collection to the east of Cygnet Bay, the incorporation of
detailed habitat data (e.g., bathymetry, substrate type) and large-scale genomic data will

Acc
epte
d A
rtic
leA
ccep
ted
Art
icle
This article is protected by copyright. All rights reserved.
better elucidate the patterns and potential drivers of genetic connectedness among coastal
populations of bottlenose dolphins across north-western Australia.
Conclusions and recommendations
This study provides evidence that the common bottlenose dolphin (T. truncatus) is the
predominant species associating with the Pilbara Trawl Fishery and that haplotype sharing or
recruitment from adjacent, coastal populations (T. aduncus) does not occur. There appears to
be no genetic sub-structuring within the PTF-associated population. Data on population size
need to be acquired before the viability, or capacity to absorb and recover from, the
anthropogenic impact of on-going incidental catch, at an estimated minimum of ~ 50
dolphins per annum, can be assessed (Allen et al. 2014). A more complete biopsy sample
dataset, from offshore T. truncatus populations adjacent to the PTF, needs to be accumulated
to allow the quantification of the levels of gene flow with adjacent, pelagic populations. This
might also allow: the detection of any changes in population size due to fishery-caused
mortalities (c.f., Garza and Williamson 2001); the determination of whether closely related
individuals are subject to incidental capture (c.f., Mendez et al. 2010), which can exacerbate
the demographic impacts of bycatch in highly social species, such as delphinids (Wade et al.
2012); and the definition of appropriate management units for pelagic dolphins across
northern Australia (c.f., Bilgmann et al. 2014). Finally, underwater video footage collected
inside trawl nets (Jaiteh et al. 2014), as well as photo-identification data from around trawlers
(Allen 2015), suggests that a community of dolphins within the broader population may show
fidelity to foraging around trawlers. Estimating the number of individuals interacting with the
trawlers is also required to better assess the level of impact this putative community faces.
Acknowledgements
This research was funded primarily by the Australian Marine Mammal Centre (Project
2009/19), with additional contributions from the Fisheries Research and Development
Corporation (Tactical Research Fund Project 2008/048), the Western Australian Department
of Fisheries, the Nickol Bay Professional Fishers Association, the Sea World Research and
Rescue Foundation, and the WV Scott Foundation. We thank the commercial trawl operators,
Shark Bay Resources, Monkey Mia Wildsights, RAC Monkey Mia Dolphin Resort, Coral
Bay Research Station and Eco Beach Resort for in-kind support, and acknowledge the
logistical assistance provided by the skippers and crews of the Pilbara Fish Trawl Interim
Managed Fishery. Fisheries observer Gavin Kewan, Vanessa Jaiteh of Murdoch University
Acc
epte
d A
rtic
leA
ccep
ted
Art
icle
This article is protected by copyright. All rights reserved.
and the Centre for Whale Research provided assistance with sample collection. MIGRATE-N
calculations carried out in this manuscript were performed on the CSC HPC cluster FUCHS
of the J. W. Goethe University Frankfurt, Germany. We are grateful to Halina Kobryn and
Erik Willems for their deft work on figures 1 and 3, respectively. This manuscript represents
publication number 11 of the Shark Bay Dolphin Innovation Project. The research was
carried out under cetacean research permits from both the Western Australian State
Government (CE002566, SF006538, SF008015) and the Australian Commonwealth
Government (2008/003). Dolphin tissue samples were transferred to the University of Zurich
under CITES using institutional permits for scientific exchange (CH-019 and AU069) and the
research was conducted with animal ethics committee approval from Murdoch University
(W2342/10).
Data accessibility section
Data for this manuscript have been made available on DRYAD: doi:10.5061/dryad.908g4.
References Allen SJ (2015) Fishery-impacted bottlenose dolphins of north-western Australia: Bycatch patterns, genetic
status and abundance. Doctoral thesis submitted to the School of Veterinary and Life Sciences, Murdoch University, Australia. Pp. 144.
Allen SJ, Cagnazzi DDB, Hodgson AJ, Loneragan NR, Bejder L (2012) Tropical inshore dolphins of north-western Australia: Unknown populations in a rapidly changing region. Pac Conserv Biol 18:56–63
Allen SJ, Tyne J, Kobryn HT, Bejder L, Pollock KH, Loneragan NR (2014) Patterns of dolphin bycatch in a
north-western Australian trawl fishery. PLoS ONE 9(4):e93178. doi:10.1371/journal.pone.0093178 Ansmann IC, Parra GJ, Lanyon JM, Seddon JM (2012) Fine-scale genetic population structure in a mobile
marine mammal: inshore bottlenose dolphins in Moreton Bay, Australia. Mol Ecol 21:4472-4485. doi: 10.1111/j.1365-294X.2012.05722.x
Bacher K, Allen S, Lindholm AK, Bejder L, Krützen M (2010) Genes or Culture: Are Mitochondrial Genes
Associated with Tool Use in Bottlenose Dolphins (Tursiops sp.)? Behav Genet 40:706-714 Baker CS, Perry A, Bannister J, Weinrich MT, Abernethy RB, Calambokidis J, Lien J, Lambertsen RH,
Ramirez JU, Vasquez O (1993) Abundant mitochondrial DNA variation and worldwide population structure in humpback whales. Proc Natl Acad Sci USA 90:8239-8243
Beasley I, Robertson KM, Arnold P (2005) Description of a new dolphin, the Australian snubfin dolphin
Orcaella heinsohni sp. n. (Cetacean, Delphinidae). Mar Mamm Sci 21:365–400 Beerli P (2006) Comparison of Bayesian and maximum-likelihood inference of population genetic parameters.
Bioinformatics 22:341-345 Beerli P, Felsenstein J (2001) Maximum likelihood estimation of a migration matrix and effective population
sizes in n subpopulations by using a coalescent approach. Proc Natl Acad Sci USA 98:4563-4568 Beerli P, Palczewski M (2010) Unified framework to evaluate panmixia and migration direction among multiple
sampling locations. Genetics 185:313-326
Acc
epte
d A
rtic
leA
ccep
ted
Art
icle
This article is protected by copyright. All rights reserved.
Belkhir K, Borsa P, Chikhi L, Raufaste N, Bonhomme F (2004) GENETIX 4.05, logiciel sous Windows TM pour la génétique des populations. Université de Montpellier II, Montpellier.
Bérubé M (2009) Hybridism. In Perrin WF, Würsig B, Thewissen JGM (eds) Encyclopedia of Marine
Mammals, 2nd edn. Academic Press, San Diego, p 588–592. Bilgmann K, Griffiths O, Allen S, Möller L (2007) A biopsy pole system for bow-riding dolphins: sampling
success, behavioral responses and test for sampling bias. Mar Mamm Sci 23:218-225 Bilgmann K, Parra GJ, Zanardo N, Beheregaray LB, Möller LM (2014). Multiple management units of short-
beaked common dolphins subject to fisheries bycatch off southern and southeastern Australia. Mar Ecol Prog Ser 500:265-279
Boness DJ, Clapham PJ, Mesnick SL (2002) Life history and reproductive strategies. In Hoelzel AR (ed)
Marine Mammal Biology: An evolutionary approach. Blackwell Science Ltd, Oxford, UK. ISBN 0-632-05232-5
Brohede J, Ellegren H (1999) Microsatellite evolution: polarity of substitutions within repeats and neutrality of
flanking sequences. Proc R Soc Lond B 266:825-833 Brown A, Kopps AM, Allen SJ, Bejder L, Littleford-Colquhoun B, Parra GJ, Cagnazzi D, Thiele D, Palmer C,
Frère C (2014) Population differentiation and hybridisation of Australian snubfin (Orcaella heinsohni) and Indo-Pacific humpback dolphins (Sousa chinensis) in north-western Australia. PLoS ONE 9:e101427.
Browning NE, McCulloch SD, Bossart GD, Worthy GAJ (2014) Fine-scale population structure of estuarine
bottlenose dolphins (Tursiops truncatus) assessed using stable isotope ratios and fatty acid signature analyses. Mar Biol doi:10.1007/s00227-014-2420-z
Caballero S, Jackson J, Mignucci-Giannoni AA, Barrios-Garrido H, Beltran-Pedreros S, Montiel-Villalobos
MG, Robertson KM, Baker CS (2008) Molecular systematics of South American dolphins Sotalia: Sister taxa determination and phylogenetic relationships, with insights into a multi-locus phylogeny of the Delphinidae. Mol Phylogenet Evol 46:252-268
Carwardine M (1995) Whales, Dolphins and Porpoises. Dorling Kindersley, London Charlton-Robb K, Gershwin L-A, Thompson R, Austin J, Owen K, McKechnie S (2011) A New Dolphin
Species, the Burrunan Dolphin Tursiops australis sp. nov., Endemic to Southern Australian Coastal Waters. PLoS ONE 6:e24047. doi:10.1371/journal.pone.0024047
Chilvers BL, Corkeron PJ (2001) Trawling and bottlenose dolphins’ social structure. Proc R Soc Lond B
268:1901-1905 Cipriano F (1997) Antitropical distributions and speciation in dolphins of the genus Lagenorhynchus: a
preliminary analysis. In: Dizon AE, Chivers SJ, Perrin WF (eds) Molecular genetics of marine mammals. Soc Mar Mamm, Lawrence, pp 305-316
Committee on Taxonomy (2014) List of marine mammal species and subspecies. Society for Marine
Mammalogy. www.marinemammalscience.org. Accessed 1 November 2014 Corander JP, Marttinen J, Sirén J, Tang J (2008) Enhanced Bayesian modelling in BAPS software for learning
genetic structures of populations. BMC Bioinformatics 9: 539. Cox TM, Lewison RL, Zydelis R, Crowder LB, Safina C, Read AJ (2007) Comparing effectiveness of
experimental and implemented bycatch reduction measures: the ideal and the real. Conserv Biol 21:1155–1164
Cox TM, Read AJ, Swanner D, Urian K, Waples D (2004) Behavioral responses of bottlenose dolphins,
Tursiops truncatus, to gillnets and acoustic alarms. Biol Conserv 115:203-212

Acc
epte
d A
rtic
leA
ccep
ted
Art
icle
This article is protected by copyright. All rights reserved.
Dixon JM (2008) Fraser’s Dolphin. In: Van Dyck S, Strahan R (eds) The Mammals of Australia, 3rd edn. New Holland Publishers, Sydney, p 847
Earl DA, vonHoldt BM (2012) STRUCTURE HARVESTER: a website and program for visualizing
STRUCTURE output and implementing the Evanno method. Conserv Genet Resour 4:359-361. doi:10.1007/s12686-011-9548-7
Evanno G, Regnaut S, Goudet J (2005) Detecting the number of clusters of individuals using the software
STRUCTURE: a simulation study. Mol Ecol 14:2611–2620 Fernández R, Begoña Santos M, Pierce GJ, Llavona A, López A, Silva MA, Ferreira M, Carrillo M, Cermeño P,
Lens S, Piertney SB (2011) Fine-scale genetic structure of bottlenose dolphins, Tursiops truncatus, in Atlantic coastal waters of the Iberian Peninsula. Hydrobiologia 670:111–125. doi:10.1007/s10750-011-0669-5
Fletcher WJ, Santoro K (eds) (2013) State of the Fisheries and Aquatic Resources Report 2011/12. Department
of Fisheries, Perth. http://www.fish.wa.gov.au/Documents/sofar/status_reports_of_the_fisheries_and_aquatic_resources_2012-13.pdf
Frankham R, Ballou JD, Briscoe DA (2010) Introduction to conservation genetics, 2nd edn. Cambridge
University Press, Cambridge, UK Frère CH, Krützen M, Kopps AM, Ward P, Mann J, Sherwin WB (2010). Inbreeding tolerance and fitness costs
in wild bottlenose dolphins. Proc R Soc Lond B:2667-2673 Fruet PF, Secchi ER, Daura-Jorge F, Vermeulen E, Flores PAC, Simõs-Lopes PC, Genoves RC, Laporta P, Di
Tullio JC, Freitas TRO, Dalla Rosa L, Valiati VH, Beheregaray LB, Möller LM (2014) Remarkably low genetic diversity and strong population structure in common bottlenose dolphins (Tursiops truncatus) from coastal waters of the Southwestern Atlantic Ocean. Conserv Genet doi:10.1007/s10592-014-0586-z
Garza JC, Williamson EG (2001) Detection of reduction in population size using data from microsatellite loci.
Mol Ecol 10:305-318 Geyer CJ (1992) Practical Markov chain Monte Carlo (with discussion). Stat Sci 7:473-511 Gilson A, Syvanen M, Levine K, Banks J (1998) Deer gender determination by polymerase chain reaction:
validation study and application to tissues, bloodstains, and hair forensic samples from California. Calif Fish Game 84:159-169
Halpern BS, Selkoe KA, Micheli F, Kappel CV (2007). Evaluating and Ranking the Vulnerability of Global
Marine Ecosystems to Anthropogenic Threats. Conserv Biol 21:1301–1315 Hartmann SA, Steyer K, Kraus RHS, Segelbacher G, Nowak C (2013) Potential barriers to gene flow in the
endangered European wildcat (Felis silvestris). Conserv Genetics 14:413-426 Hassanin A, Delsuc F, Ropiquet A, Hammer C, van Vuuren BJ, Matthee C, Ruiz-Garcia M, Catzeflis F,
Areskoug V, Nguyen TT, Couloux A (2012) Pattern and timing of diversification of Cetartiodactyla (Mammalia, Laurasiatheria), as revealed by a comprehensive analysis of mitochondrial genomes. Comptes Rendus Biologies 335:32-50
Hey J (2010) Isolation with migration models for more than two populations. Mol Biol Evol 27:905-920 Hey J, Nielsen R (2007) Integration within the Felsenstein equation for improved Markov chain Monte Carlo
methods in population genetics. Proc Natl Acad Sci USA 104:2785-2790 Hoelzel AR, Dahlheim M, Stern SJ (1998a) Low genetic variation among killer whales (Orcinus orca) in the
Eastern North Pacific and genetic differentiation between foraging specialists. J Hered 89:121-128 Hoelzel AR, Potter CW, Best PB (1998b) Genetic differentiation between parapatric 'nearshore' and 'offshore'
Acc
epte
d A
rtic
leA
ccep
ted
Art
icle
This article is protected by copyright. All rights reserved.
populations of the bottlenose dolphin. Proc R Soc Lond B 265:1177-1183 Hubisz MJ, Falush D, Stephens M, Pritchard JK (2009) Inferring weak population structure with the assistance
of sample group information. Mol Ecol Resour 9:1322-1332 Huelsenbeck JP, Larget B, Alfaro ME (2004) Bayesian phylogenetic model selection using reversible jump
Markov chain Monte Carlo. Mol Biol Evol 21:1123-1133 Jaiteh VF, Allen SJ, Meeuwig JJ, Loneragan NR (2013) Sub-surface behaviour of bottlenose dolphins (Tursiops
truncatus) interacting with fish trawl nets in north-western Australia. Mar Mamm Sci e266. doi:10.1111/j.1748-7692.2012.00620.x
Jaiteh VF, Allen SJ, Meeuwig JJ, Loneragan NR (2014) Combining in-trawl video with observer coverage
improves understanding of protected and vulnerable species bycatch in trawl fisheries. Mar Freshw Res 65:1-8
Jefferson TA, Webber MA, Pitman RL (2008) Marine mammals of the world. Academic Press, London Jensen JL, Bohonak AJ, Kelley ST (2005) Isolation by distance, web service. BMC Genetics 6:13. v.3.23
http://ibdws.sdsu.edu/ Jonker RM, Kraus RHS, Zhang Q, van Hooft P, van der Jeugd HP, Kurvers RH, van Wieren SE, Loonen MJ,
Crooijmans RP, Ydenberg RC, Groenen MA, Prins HH (2013) Genetic consequences of breaking migratory traditions in barnacle geese Branta leucopsis. Mol Ecol 22:5835-5847
Jost, L. 2008. GST and its relatives do not measure differentiation. Mol Ecol 17:4015-4026 Kingston SE, Adams LD, Rosel PE (2009) Testing mitochondrial sequences and anonymous nuclear markers
for phylogeny reconstruction in a rapidly radiating group: molecular systematics of the Delphininae (Cetacea: Odontoceti: Delphinidae). BMC Evol Biol 9:245
Kopps AM, Ackermann C, Sherwin WB, Allen SJ, Bejder L and Krützen M 2014. Cultural transmission of tool
use combined with habitat specializations leads to fine-scale genetic structure in bottlenose dolphins. Proc R Soc Lond B 281: 20133245. http://dx.doi.org/10.1098/rspb.2013.3245.
Kraus RHS, Van Hooft P, Megens H-J, Tsvey A, Fokin SY, Ydenberg RC, Prins HH (2013) Global lack of
flyway structure in a cosmopolitan bird revealed by a genome wide survey of single nucleotide polymorphisms. Mol Ecol 22:41-55
Krützen M, Barre LM, Möller L, Heithaus MR, Sims C, Sherwin WB (2002) A biopsy system for small
cetaceans: darting success and wound healing in Tursiops spp. Mar Mamm Sci 18:863–878 Krützen M, Sherwin WB, Berggren P, Gales NJ (2004) Population structure in an inshore cetacean revealed by
microsatellite and mtDNA analysis: bottlenose dolphins (Tursiops sp.) in Shark Bay, Western Australia. Mar Mamm Sci 20:28-47
Krützen M, Valsecchi E, Connor RC, Sherwin WB (2001) Characterisation of microsatellites in Tursiops
aduncus. Mol Ecol Notes 1:170-172 Louis M, Viricel A, Lucas T, Peltier H, Alfonsi E, Berrow S, Bronlow A, Covelo P, Dabin W, Deaville R, De
Stephanis R, Gally F, Gauffier P, Penrose R, Silva MA, Guinet C, Simon-Bouhet B (2014) Habitat-driven population structure of bottlenose dolphins, Tursiops truncatus, in the North-East Atlantic. Mol Ecol 23:857–874. doi:10.1111/mec.12653
McGowen MR (2011) Toward the resolution of an explosive radiation - A multilocus phylogeny of oceanic
dolphins (Delphinidae). Mol Phylogenet Evol 60:345–357 Martien KK, Chivers SJ, Baird RW, Archer FI, Gorgone AM, Hancock-Hanser BL, Mattila D, McSweeney DJ,
Oleson EM, Palmer C, Pease VL, Robertson KM, Schorr GS, Schultz MB, Webster DL, Taylor BL (2014) Nuclear and Mitochondrial Patterns of Population Structure in North Pacific False Killer Whales

Acc
epte
d A
rtic
leA
ccep
ted
Art
icle
This article is protected by copyright. All rights reserved.
(Pseudorca crassidens). J Hered: doi:10.1093/jhered/esu029 Meirmans PG, Van Tienderen PH (2004) GENOTYPE and GENODIVE: two programs for the analysis of
genetic diversity of asexual organisms, Mol Ecol Notes 4:792-794 Mendez M, Rosenbaum HC, Wells RS, Stamper A, Bordino P (2010) Genetic evidence highlights potential
impacts of by-catch to cetaceans. PLoS ONE 5: e15550. doi:10.1371/journal.pone.0015550 Mirimin L, Miller R, Dillane E, Berrow SD, Ingram S, Cross TF, Rogan E (2011) Fine-scale population genetic
structuring of bottlenose dolphins in Irish coastal waters. Animal Conserv 14:342-353. doi:10.1111/j.1469-1795.2010.00432.x
Möller LM, Beheregaray LB (2001) Coastal bottlenose dolphins from South Eastern Australia are Tursiops
aduncus according to sequences of the mitochondrial DNA control region. Mar Mamm Sci 17:249-263 Möller LM, Bilgmann K, Charlton-Robb K, Beheregaray L (2008) Multi-gene evidence for a new bottlenose
dolphin species in Southern Australia. Mol Phylogenet Evol 49:674-681 Moura AE, Nielsen, SCA, Vilstrup JT, Moreno-Mayar JV, Gilbert MTP, Gray HWI, Natoli A, Möller L,
Hoelzel AR (2013) Recent diversification of a marine Genus (Tursiops spp.) tracks habitat preference and environmental change. Sys Biol 62:865-877
Nater A, Kopps AM, Krützen M (2009) New polymorphic tetranucleotide microsatellites improve scoring
accuracy in the bottlenose dolphin Tursiops aduncus. Mol Ecol Resour 9:531-534 Natoli A, Birkun A, Aguilar A, Lopez A, Hoelzel AR (2005) Habitat structure and the dispersal of male and
female bottlenose dolphins (Tursiops truncatus). Proc R Soc Lond B 272:1217-1226 Natoli A, Peddemors VM, Hoelzel AR (2004) Population structure and speciation in the genus Tursiops based
on microsatellite and mitochondrial DNA analyses. J Evol Biol 17:363–375 Nielsen R, Wakeley J (2001) Distinguishing Migration From Isolation: A Markov Chain Monte Carlo
Approach. Genetics 158:885–896 Oremus M, Poole MM, Steel D, Baker CS (2007) Isolation and interchange among insular spinner dolphin
communities in the South Pacific revealed by individual identification and genetic diversity. Mar Ecol Prog Ser 336:275-289
Palsbøll PJ, Bérubé M, Aguilar A, Notarbartolo-Di-Sciara G, Nielsen R (2004) Discerning between recurrent
gene flow and recent divergence under a finite-site mutation model applied to North Atlantic and Mediterranean Sea fin whale (Balaenoptera physalus) populations. Evolution 58:670-675
Palsbøll PJ, Bérubé M, Allendorf FW (2007) Identification of management units using population genetic data.
Trends Ecol Evol 22:11-16 Peakall R, Smouse PE (2012) GenAlEx 6.5: genetic analysis in Excel. Population genetic software for teaching
and research - an update. Bioinformatics 28:2537-2539 Perrin WF, Thieleking JL, Walker WA, Archer FI, Robertson KM (2011) Common bottlenose dolphins
(Tursiops truncatus) in California waters: Cranial differentiation of coastal and offshore ecotypes. Mar Mamm Sci 27:769-792
Pritchard JK, Stephens M, Donnelly P (2000) Inference of population structure using multilocus genotype data.
Genetics 155:945–959 Quérouil S, Silva AM, Freitas L, Prieto R, Magalhães S, Dinis A, Alves F, Matos J, Mendonça D, Hammond
PS, Santos RS (2007) High gene flow in oceanic bottlenose dolphins (Tursiops truncatus) of the North Atlantic. Conserv Genet 8:1405–1419

Acc
epte
d A
rtic
leA
ccep
ted
Art
icle
This article is protected by copyright. All rights reserved.
Read AJ, Drinker P, Northridge S (2006) Bycatch of marine mammals in U.S. and global fisheries. Conserv Biol 20:163–169
Reeves RR, McClellan K, Werner TB (2013) Marine mammal bycatch in gillnet and other entangling net
fisheries, 1990 to 2011. Endang Species Res 20:71-97 Reeves RR, Stewart BS, Clapham PJ, Powell JA (eds) (2002) Guide to Marine Mammals of the World. Alfred
A. Knopf, New York Rice DW (1998) Marine Mammals of the World: Systematics and distribution. Soc Mar Mamm, Lawrence Rice WR (1989) Analyzing tables of statistical tests. Evolution 43:223-225 Rosel PE, Dizon AE, Heyning JE (1994) Genetic analysis of sympatric morphotypes of common dolphins
(genus Delphinus). Mar Biol 119:159–167 Ross GJB (2006) Review of the Conservation Status of Australia’s Smaller Whales and Dolphins. Australian
Government, Canberra. 124 p. http://www.environment.gov.au/coasts/publications/pubs/conservationsmaller-whales-dolphins.pdf.
Ross HA, Lento GM, Dalebout ML, Goode M, Ewing G, McLaren P, Rodrigo AG, Lavery S, Baker CS (2003)
DNA surveillance: web-based molecular identification of whales, dolphins, and porpoises. J Hered 94:111–114
Rousset F (2008) Genepop’007: a complete reimplementation of the Genepop software for Windows and Linux.
Mol Ecol Resour 8:103-106 Runemark A, Hey J, Hansson B, Svensson EI (2012) Vicariance, divergence and gene flow among islet
populations of an endemic lizard. Mol Ecol 21:117-29 Schaurich M, Vieira Lopes F, de Oliveira L (2012) Hybridization phenomenon in cetacean and pinniped
species. Neotropical Biology and Conservation 7:199-209 Sellas AB, Wells RS, Rosel PE (2005) Mitochondrial and nuclear DNA analyses reveal fine scale geographic
structure in bottlenose dolphins (Tursiops truncatus) in the Gulf of Mexico. Conserv Genet 6:715–728 Slooten E (2013) Effectiveness of area-based management in reducing bycatch of the New Zealand dolphin.
Endang Species Res 20:121-130 Stephenson PC, Chidlow J (2003) Bycatch in the Pilbara trawl fishery. Final report to the Natural Heritage
Trust. Perth: Natural Heritage Trust. 74 p. Svane I (2005) Occurrence of dolphins and seabirds and their consumption of by-catch during prawn trawling in
Spencer Gulf, South Australia. Fish Res 76:317–327 Tezanos-Pinto G, Baker CS, Russell K, Martien K, Baird RW, Hutt A, Stone G, Mignucci-Giannoni AA,
Caballero S, Endo T, Lavery S, Oremus M, Olavarria C, Garrige C (2009) A worldwide perspective on the population structure and genetic diversity of bottlenose dolphins (Tursiops truncatus) in New Zealand. J Hered 100:11–24
Viricel A, Rosel PE (2012) Evaluating the utility of cox1 for cetacean species identification. Mar Mamm Sci
28:37-62 Vilstrup JT, Ho SYW, Foote AD, Morin PA, Kreb D, Krützen M, Parra GJ, Robertson KM, de Stephanis R,
Verborgh P, Willerslev E, Orlando L, Gilbert MTP (2011) Mitogenomic phylogenetic analyses of the Delphinidae with an emphasis on the Globicephalinae. BMC Evol Biol 11:65
Wade P, Angliss RP (1997) Guidelines for Assessing Marine Mammal Stocks: Report of the GAMMS
Workshop April 3-5, 1996, Seattle, WA. U.S. Dep. Commer., NOAA Tech. Memo. NMFS-OPR-12, 93 p
Acc
epte
d A
rtic
leA
ccep
ted
Art
icle
This article is protected by copyright. All rights reserved.
Wade PR, Reeves RR, Mesnick SL (2012) Social and behavioural factors in cetacean responses to
overexploitation: Are odontocetes less “resilient” than mysticetes? Mar Biol doi:10.1155/2012/567276 Wang JY, Chou L-S, White BN (1999) Mitochondrial DNA analysis of sympatric morphotypes of bottlenose
dolphins (genus: Tursiops) in Chinese waters. Mol Ecol 8:1603–1612 Wang JY, Chou L-S, White BN (2000a) Osteological differences between two sympatric forms of bottlenose
dolphins (genus Tursiops) in Chinese waters. J Zool Lond 252:147–162 Wang JY, Chou L-S, White BN (2000b) Differences in the external morphology of two sympatric species of
bottlenose dolphins (genus Tursiops) in Chinese waters. J Mammal 81:1157–1165 Waples RS, Gaggiotti O (2006) What is a population? An empirical evaluation of some genetic methods for
identifying the number of gene pools and their degree of connectivity. Mol Ecol 15:1419-1439 Weir B, Cockerham CC (1984) Estimating F-statistics for the analysis of population structure. Evolution
38:1358-1370 Wells RS, Rhinehart HL, Cunningham P, Whaley J, Baran M, Koberna C, Costa DP (1999) Long distance
offshore movements of bottlenose dolphins. Mar Mamm Sci 15:1098–1114 Whitehead H, Reeves RR, Tyack P (2000) Science and the conservation, protection, and management of wild
cetaceans. In Mann J, Connor RC, Tyack PL, Whitehead H (Eds) Cetacean Societies: Field Studies of Dolphins and Whales. Chicago, IL: University of Chicago Press, pp. 308–332.
Whitlock MC (2011) G’ST and D do not replace FST. Mol Ecol 20:1083-1091 Whitlock MC, McCauley DE, (1999) Indirect measures of gene flow and migration: FST ≠ 1/(4Nm+1). Heredity
82:117– 125 Wilson GA, Rannala B (2003) Bayesian inference of recent migration rates using multilocus genotypes.
Genetics 163:1177–1191 Wiszniewski J, Allen SJ, Möller LM (2009) Social cohesion in a hierarchically structured embayment
population of Indo-Pacific Bottlenose Dolphins. Anim Behav 77:1449-1457 Wiszniewski J, Beheregaray LB, Allen SJ, Möller LM (2010) Environmental and social influences on the
genetic structure of bottlenose dolphins (Tursiops aduncus) of South-Eastern Australia. Conserv Genet 11:1405-1419
Woinarski JCZ, Burbidge AA, Harrison PL (2014) The Action Plan for Australian Mammals 2012.
Collingwood, Victoria: CSIRO Publishing. Wright S (1931) Evolution in Mendelian populations. Genetics 16:97-159 Wright S (1943) Isolation by distance. Genetics 28:114-138 Xia X, Xie Z (2001) DAMBE: data analysis in molecular biology and evolution. J Hered 92:371–373 Xiong Y, Brandley MC, Xu S, Zhou K, Yang G (2009) Seven new dolphin mitochondrial genomes and a time-
calibrated phylogeny of whales. BMC Evol Biol 9:20 Yang G, Guoqing J, Ren W, Zhou K (2005) Pattern of genetic variation of bottlenose dolphins in Chinese
waters. Raffles B Zool 53:157-164 Zhou X, Xu S, Yang Y, Zhou K, Yang G (2011) Phylogenomic analyses and improved resolution of
Cetartiodactyla. Mol Phylogenet Evol 61:255-264
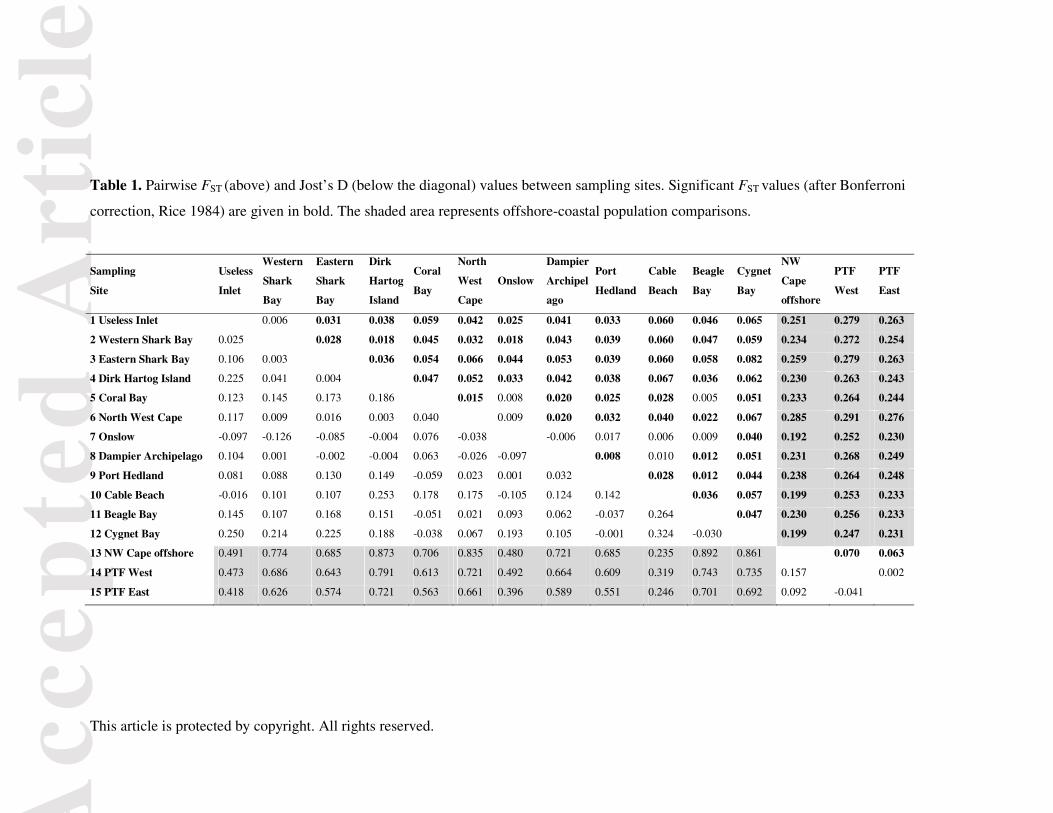
Acc
epte
d A
rtic
le
This article is protected by copyright. All rights reserved.
Table 1. Pairwise FST (above) and Jost’s D (below the diagonal) values between sampling sites. Significant FST values (after Bonferroni
correction, Rice 1984) are given in bold. The shaded area represents offshore-coastal population comparisons.
Sampling
Site
Useless
Inlet
Western
Shark
Bay
Eastern
Shark
Bay
Dirk
Hartog
Island
Coral
Bay
North
West
Cape
Onslow
Dampier
Archipel
ago
Port
Hedland
Cable
Beach
Beagle
Bay
Cygnet
Bay
NW
Cape
offshore
PTF
West
PTF
East
1 Useless Inlet 0.006 0.031 0.038 0.059 0.042 0.025 0.041 0.033 0.060 0.046 0.065 0.251 0.279 0.263
2 Western Shark Bay 0.025 0.028 0.018 0.045 0.032 0.018 0.043 0.039 0.060 0.047 0.059 0.234 0.272 0.254
3 Eastern Shark Bay 0.106 0.003 0.036 0.054 0.066 0.044 0.053 0.039 0.060 0.058 0.082 0.259 0.279 0.263
4 Dirk Hartog Island 0.225 0.041 0.004 0.047 0.052 0.033 0.042 0.038 0.067 0.036 0.062 0.230 0.263 0.243
5 Coral Bay 0.123 0.145 0.173 0.186 0.015 0.008 0.020 0.025 0.028 0.005 0.051 0.233 0.264 0.244
6 North West Cape 0.117 0.009 0.016 0.003 0.040 0.009 0.020 0.032 0.040 0.022 0.067 0.285 0.291 0.276
7 Onslow -0.097 -0.126 -0.085 -0.004 0.076 -0.038 -0.006 0.017 0.006 0.009 0.040 0.192 0.252 0.230
8 Dampier Archipelago 0.104 0.001 -0.002 -0.004 0.063 -0.026 -0.097 0.008 0.010 0.012 0.051 0.231 0.268 0.249
9 Port Hedland 0.081 0.088 0.130 0.149 -0.059 0.023 0.001 0.032 0.028 0.012 0.044 0.238 0.264 0.248
10 Cable Beach -0.016 0.101 0.107 0.253 0.178 0.175 -0.105 0.124 0.142 0.036 0.057 0.199 0.253 0.233
11 Beagle Bay 0.145 0.107 0.168 0.151 -0.051 0.021 0.093 0.062 -0.037 0.264 0.047 0.230 0.256 0.233
12 Cygnet Bay 0.250 0.214 0.225 0.188 -0.038 0.067 0.193 0.105 -0.001 0.324 -0.030 0.199 0.247 0.231
13 NW Cape offshore 0.491 0.774 0.685 0.873 0.706 0.835 0.480 0.721 0.685 0.235 0.892 0.861 0.070 0.063
14 PTF West 0.473 0.686 0.643 0.791 0.613 0.721 0.492 0.664 0.609 0.319 0.743 0.735 0.157 0.002
15 PTF East 0.418 0.626 0.574 0.721 0.563 0.661 0.396 0.589 0.551 0.246 0.701 0.692 0.092 -0.041

Acc
epte
d A
rtic
leA
ccep
ted
Art
icle
This article is protected by copyright. All rights reserved.
Table 2. Comparisons of four different migration models used in MIGRATE-N. For model
comparisons, we pooled sampling sites into three populations (see Material and Methods).
SB = Shark Bay (Sites 1-4), OC = Other Coastal (Sites 5-11), PTF = Pilbara Trawl Fishery
(Sites 14-15). In each of the migration models, nine parameters, i.e. migration rates between
populations, were considered. Asterisks indicate that migration rates were estimated by
MIGRATE-N. In some migration models, we set the migration rate among certain populations
to nought (0), or allowed only a fixed, low (c) migration rate of 0.001 (see Material and
Methods). Parameters 1-3 indicate migration rate into the SB populations from the SB, OC
and PTF populations, parameters 4-6 indicate migration rate into the OC population from the
SB, OC and PTF populations, and parameters 7-9 indicate migration rate into the PTF
population from the SB, OC and PTF populations. Model scores are given by Bezier
approximation and differences between models highlighted in column ΔBAS.
Model Populations and model parameters
Bezier approximation
score (BAS)
ΔBAS
SB OC PTF Full *** *** *** -359,466 133,001 Low migration PTF **c **c cc* -237,198 10,733PTF SB/OC *** *** 00* -226,465 0SB/OC PTF **0 **0 *** -260,614 34,149
Table 3. Mean posterior distribution values (95% CI) of fraction of individuals in population
i that are migrants derived from population j (per generation) among four combined
populations as determined by BAYESASS. 95% confidence intervals smaller than 0 and larger
than 1 were rounded to the nearest integer.
from/to Shark Bay Other Coastal
Cygnet Bay PTF
Shark Bay
0.982 (0.963-1.000)
0.013 (0.000-0.031)
0.003 (0.000-0.008)
0.003 (0.000-0.008)
Other Coastal
0.034 (0.000-0.071)
0.961 (0.924-0.998)
0.003 (0.000-0.007)
0.003 (0.000-0.007)
Cygnet Bay
0.022 (0.000-0.059)
0.284 (0.235-0.334)
0.681 (0.654-0.707)
0.013 (0.000-0.037)
PTF 0.005 (0.000-0.014)
0.005 (0.000-0.014)
0.005 (0.000-0.014)
0.986 (0.971-1.000)
Acc
epte
d A
rtic
leA
ccep
ted
Art
icle
This article is protected by copyright. All rights reserved.
Figure captions
Figure 1. Map of the sampling sites, north-western Australia, showing the biopsy sample
collection sites for: incidentally captured and free-ranging dolphins associating with the
Pilbara Trawl Fishery (n = 68, black fill); Site 15, the ‘PTF East’ sampling site, was collected
around 119°E, while 14, the ‘PTF West’ sampling site, was collected ca. 160 km to the west,
between ca. 116°E and 117°E; dolphins in deep water off the North West Cape (n = 3, grey
fill); and coastal dolphins (n = 273) from 12 sites (single circles may indicate multiple
samples collected from some locations, light blue fill = Shark Bay sites, dark blue fill = other
coastal sites, green fill = coastal Cygnet Bay). The boundaries of the PTF management areas
and the 20 m, 50 m and 100 m depth contours are also shown.
Figure 2. Structure plots (each column representing assignment probability of an individual
dolphin, with sampling sites separated by a white line) and log-likelihoods for different
number of clusters, K: A. Full dataset including all north-western Australian samples (n =
344). B. Coastal samples only (n = 273). The sampling site numbers correspond to their
geographical site from the south-west to the north-east (coastal and then offshore) as in Fig.
1: 1 Useless Inlet; 2 Western Shark Bay; 3 Eastern Shark Bay; 4 Dirk Hartog Island; 5 Coral
Bay; 6 North West Cape; 7 Onslow; 8 Dampier Archipelago; 9 Port Hedland; 10 Cable
Beach; 11 Beagle Bay; 12 Cygnet Bay; 13 NW Cape offshore; 14 PTF West; 15 PTF East.
Figure 3. Three-dimensional representation of a factorial correspondence analysis projecting
all sampled individuals of north-western Australian bottlenose (Tursiops spp.) dolphins on
the factor space. The factor space is defined by the similarity of allelic states, in order to
visualize the degree of dissimilarity among sampling sites. As per Figures 1 and 2: black/grey
fill = individuals sampled deeper waters in the PTF/NW Cape offshore; blue/green fill =
individuals sampled in shallow, coastal sites.
Figure 4. Isolation-by-distance plot of genetic (FST) versus geographic (km) distance for all
coastal sampling locations (1-12), which is highly significant (P = 0.0011, r = 0.482).
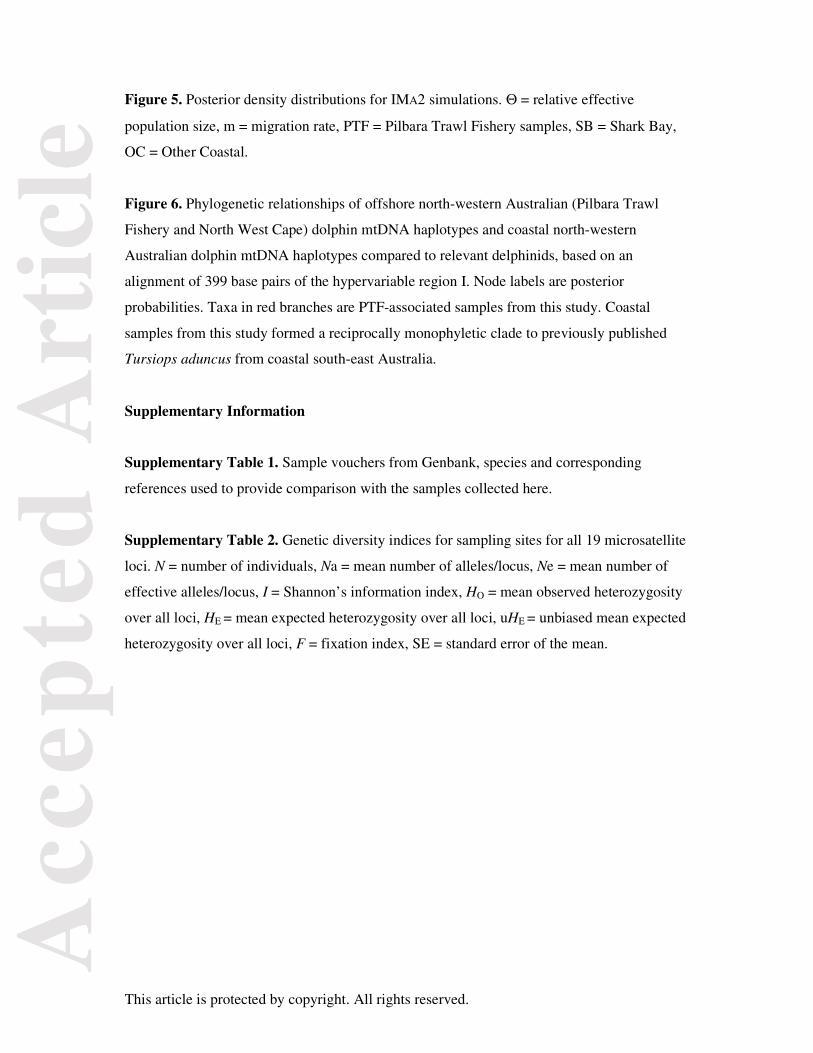
Acc
epte
d A
rtic
leA
ccep
ted
Art
icle
This article is protected by copyright. All rights reserved.
Figure 5. Posterior density distributions for IMA2 simulations. Θ = relative effective
population size, m = migration rate, PTF = Pilbara Trawl Fishery samples, SB = Shark Bay,
OC = Other Coastal.
Figure 6. Phylogenetic relationships of offshore north-western Australian (Pilbara Trawl
Fishery and North West Cape) dolphin mtDNA haplotypes and coastal north-western
Australian dolphin mtDNA haplotypes compared to relevant delphinids, based on an
alignment of 399 base pairs of the hypervariable region I. Node labels are posterior
probabilities. Taxa in red branches are PTF-associated samples from this study. Coastal
samples from this study formed a reciprocally monophyletic clade to previously published
Tursiops aduncus from coastal south-east Australia.
Supplementary Information
Supplementary Table 1. Sample vouchers from Genbank, species and corresponding
references used to provide comparison with the samples collected here.
Supplementary Table 2. Genetic diversity indices for sampling sites for all 19 microsatellite
loci. N = number of individuals, Na = mean number of alleles/locus, Ne = mean number of
effective alleles/locus, I = Shannon’s information index, HO = mean observed heterozygosity
over all loci, HE = mean expected heterozygosity over all loci, uHE = unbiased mean expected
heterozygosity over all loci, F = fixation index, SE = standard error of the mean.

Acc
epte
d A
rtic
leA
ccep
ted
Art
icle
This article is protected by copyright. All rights reserved.
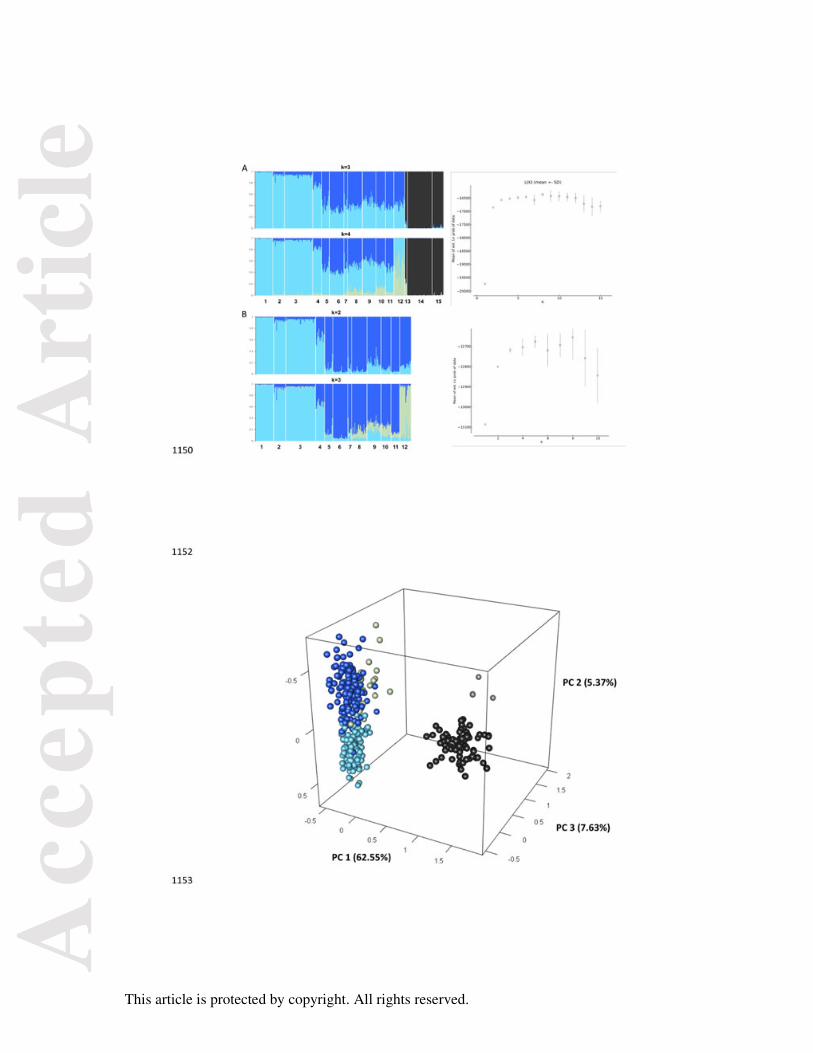
Acc
epte
d A
rtic
leA
ccep
ted
Art
icle
This article is protected by copyright. All rights reserved.

Acc
epte
d A
rtic
leA
ccep
ted
Art
icle
This article is protected by copyright. All rights reserved.
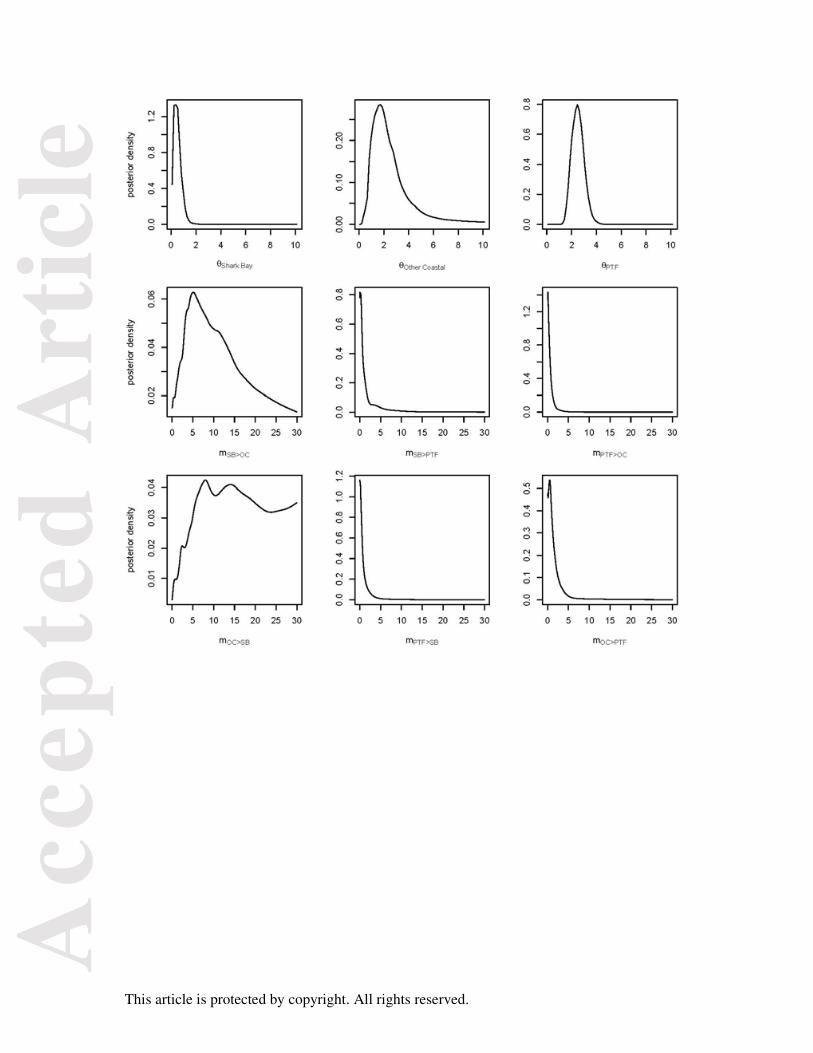
Acc
epte
d A
rtic
leA
ccep
ted
Art
icle
This article is protected by copyright. All rights reserved.

Acc
epte
d A
rtic
leA
ccep
ted
Art
icle
This article is protected by copyright. All rights reserved.


