Download - GENERAL AGREEMENT ON TARIEFS ,'JŒ) TRADE …
GENERAL AGREEMENT ON TARIEFS ,'JŒ) TRADE CONFIDENTIAL
16 May 1960
PROBLEM OF MARKET DISRUPTION
Statistical Information Supplied by contracting parties
As mentioned in paragraph 5 of L/1164, certain contracting parties have included in their replies to the questionnaire, curtain statistical âaâSSBBB? dLoutx tiorr. Insofar as tt£«|Pnave not been fully incorporated in the secretariat paper, they are reproduced here for reference by contracting parties.
t
Information supplied by: Page
Australia 2
Ceylon 8
Norway 10/11
United States 15
MGT(60)32 English only/Anglais seulement
MGT{60}32 Page 2 AUSTRALIA
A. PRINTED COTTON PISCEGOODS
Prices (as at October 1957)
(a) Landed duty paid *WBESÎ3« Prices Japanese
textiles:
Screen Printed
(Per sq.yd.)
5/2d,
Roller Printed Satin
(Per sq.yd.)
(b) Identical textiles, Australian origin: 8/ld.
4/2d.
6/l£d.
.'fen;
Screen Printed Satin
(11 Colours) (Per. sq.yd.)
5/7d.
9/9^d.
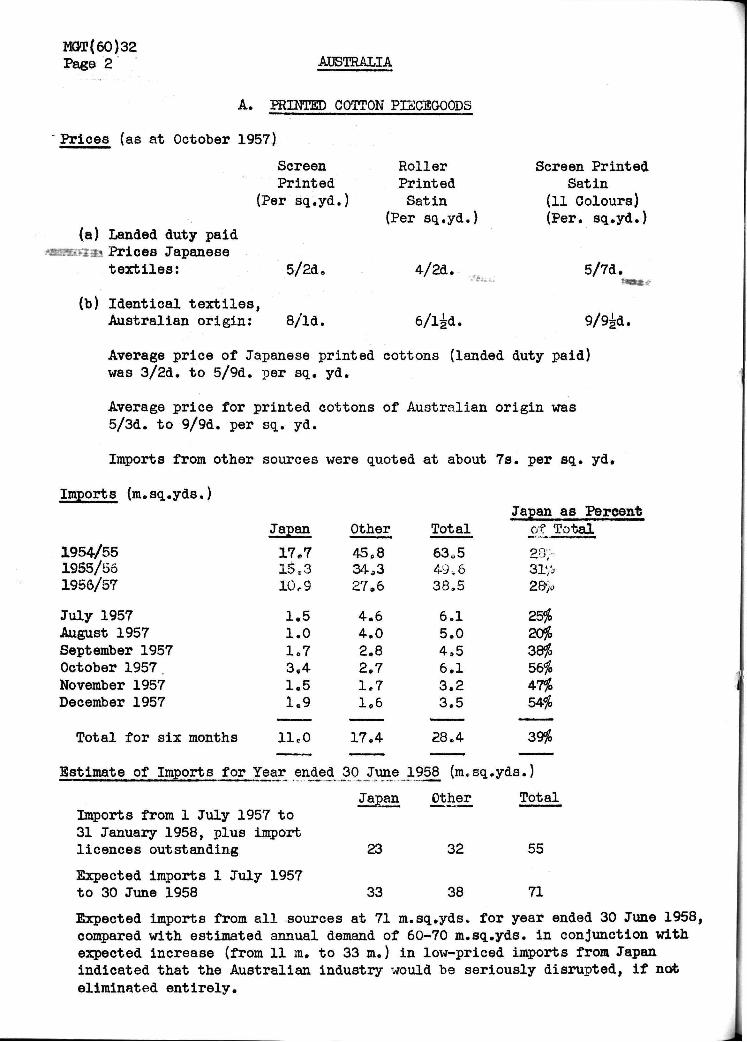
Average price of Japanese printed cottons (landed duty paid) was 3/2d. to 5/9d. per sq. yd.
Average price for printed cottons of Australian origin was 5/3d. to 9/9d. per sq. yd.
Imports from other sources were quoted at about 7s. per sq. yd.
Imports (m.sq.yds.)
1954/55 1965/56 1956/57
July 1957 August 1957 September 1957 October 1957. November 1957 December 1957
Total for six months
Estimate of Imports
Japan
17,7 15.3 10c9
1.5 1.0 1.7 3.4 1.5 1.9
lleO
for Year ended
Other
45.8 34,3 27.6
4.6 4.0 2.8 2.7 1.7 1.6
17,4
30 June
Japan
Japan as Percent Total of Total
63 „ 5 20, 49 v 6 3r/c 38,5 28>
6.1 25% 5.0 20% 4,5 38% 6.1 56% 3.2 47% 3,5 54%
28.4 39%
1958 (m.sq.yds.)
Other Total Imports from 1 July 1957 to 31 January 1958, plus import licences outstanding
Expected imports 1 July 1957 to 30 June 1958
23
33
32
38
55
71
Expected imports from all sources at 71 m.sq.yds. for year ended 30 June 1958, compared with estimated annual demand of 60-70 m.sq.yds. in conjunction with expected increase (from 11 m. to 33 m. ) in low-priced imports from Japan indicated that the Australian industry would be seriously disrupted, if not eliminated entirely.
MGT(60)32 Page 3
Australian Production
Year ended 30 June
1955 1956 1957
m.sq.yds.
2.2 3.2 9.2
Demand Annual Australian demand 60 - 70 m.sq.yds. (estimated)
B. FOOTWEAR
Prices (as at August 1958)
Rubber soled Men's shoes -Australian (leather) Japanese (plastic)
llj" Rubber thong sandals -Australian Japanese
Mocassins -Australian Japanese
Maid's shoes -Australian (leather) Japanese (plastic)
Sandals -Australian (leather) Japanese (plastic)
40/- pair ex factory 12/4 pair c.i.f. Melbourne
See "sandals" below 13/6 pair retail
49/11 retail 10/6 wholesale
22/6 ex factory 13/5 landed duty paid
24/- ex factory 9/2 c.i.f.
Imports Prior to Sudden Influx and Market Disruption
(i) Rubber footwear ('000 pairs)
Japan
1955/56 0.4 1956/57 20.0 1957/58 306.0 1958/59 (3 months) 381.8
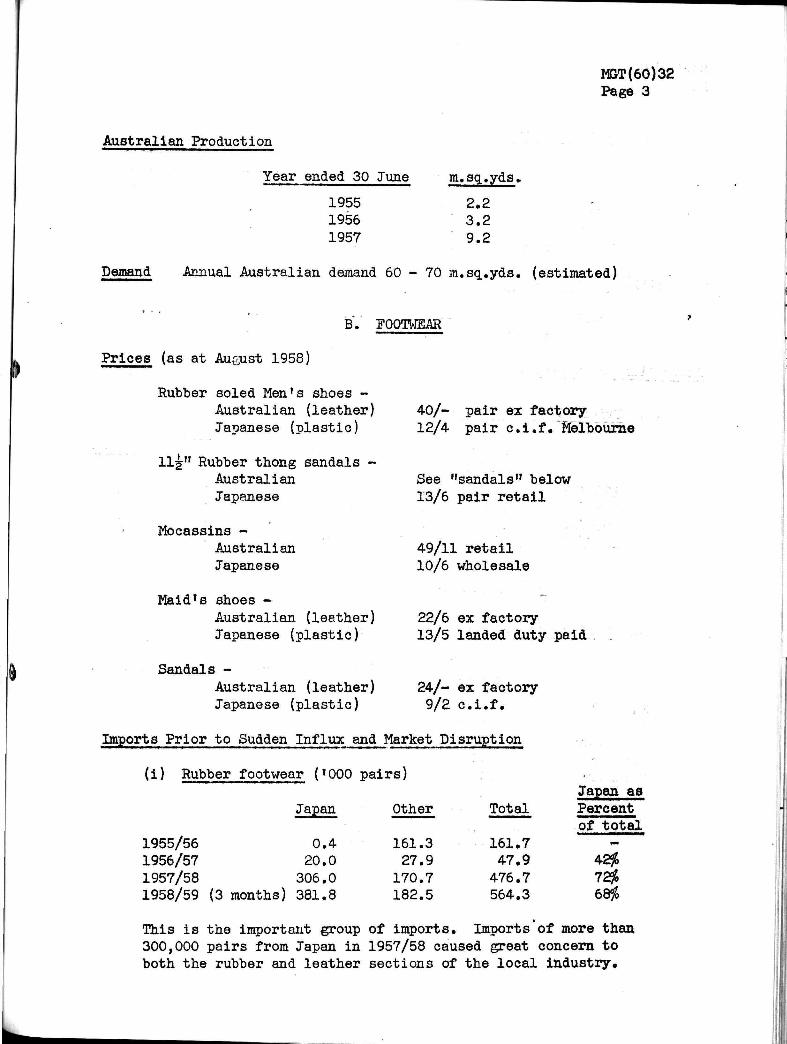
This is the important group of imports. Imports of more than 300,000 pairs from Japan in 1957/58 caused great concern to both the rubber and leather sections of the local industry.
Other
161.3 27.9 170.7 182.5
Total
161.7 47.9 476.7 564.3
Japan as Percent of total
-
42$ 72% 68%
MET (60) 32 Page 4
(ii) Leather footwear ('000 pairs)
Japan
1956/57 .2 1957/58 9.1 1958/59 (3 months) 7.5
(ill) Other footwear
Previous ... 1958/59 (3 months)52.2
Australian Production ('000 pairs)
Other
107.2 106.2 20.4'
Total
107.4 115.3 27.9
Japan as Percent of total
8% 37$
101.1 153.3 29%
(a) Prior to sudden influx of imports:
Boots &Sh7e7
Sandals Sllppers
R u b b e r Boots Shoes Goloshes
1954/55 1955/56 1956/57 1957/58
(b) During
July 1958 August September October November December
*
i
17,901 18,006 19,282 19,185
1,980 1,809 1,952 2,328
7,324 7,977 7,852 8,905
Not separately recorded
829 937
1,197 737
Not available for publication
currency of sudden influx:
•Root, s ShnfiS
Sandals
2,152 2; 267 2,433 2,486 2;i36 1,807
Slippers
724 1 767 < 723 I 692 1 638 1 517 \
Boots
Not
2,788 2,163 2,098 2,356
Shoes
*
108 101 /
Goloshes
available •
Total for 6 months 13,281 4,061
1GT(60)32 Pago 5
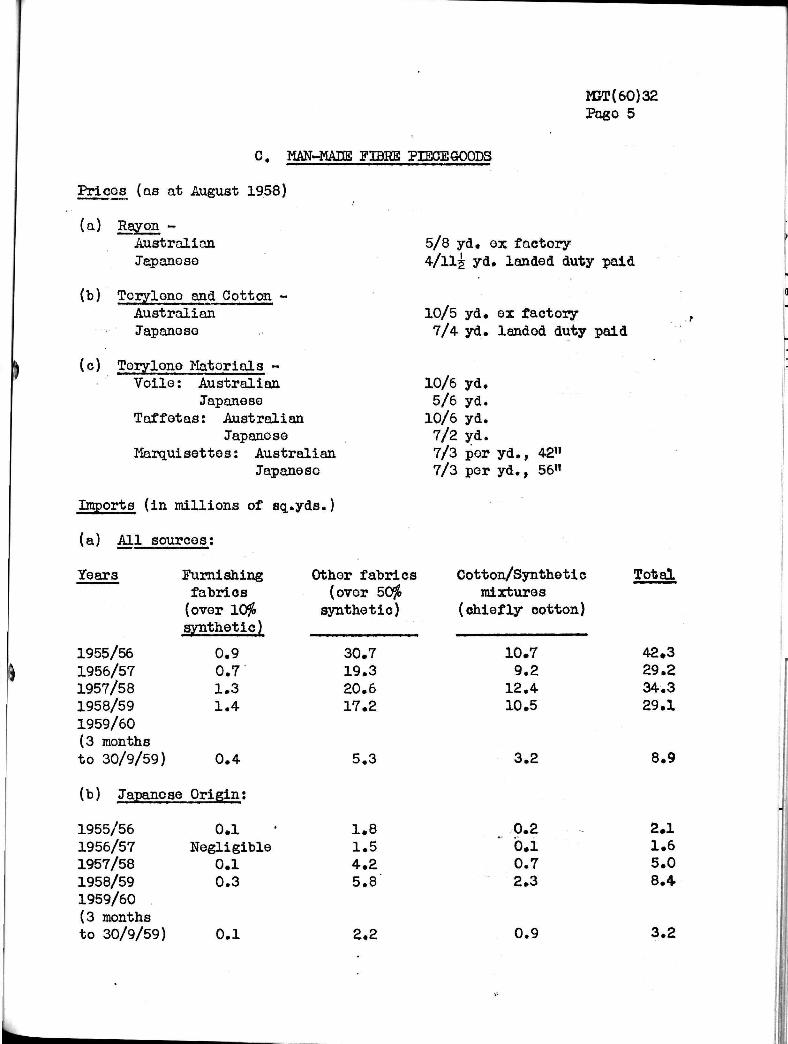
C. MAN̂ tABE FIBRE PIBOEGOODS
)
Prices (as at August 1958)
(a) Rayon -Australian Japanese
(b) Torylono and Cotton -Austral ian Japanese
(c) Torylone Materials -Voile: Australian
Japanese Taffetas: Australian
Japanese Marquisettes: Australian
Japanese
Imports (in millions of sq,.yds.)
(a) All sources:
5/8 yd. ex factory 4/H5 yd. landed duty paid
10/5 yd. ox factory 7/4 yd. landod duty paid
10/6 yd. 5/6 yd. 10/6 yd. 7/2 yd. 7/3 por yd., 42" 7/3 por yd., 56»
Years
1955/56 1956/57 1957/58 1958/59 1959/60 (3 months to 30/9/59)
Furnishing fabrics (over 10% synthetic)
0.9 0.7 1.3 1.4
0.4
(b) Japanese Origin:
1955/56 1956/57 1957/58 1958/59 1959/60 (3 months to 30/9/59)
0.1 Negligible
0.1 0.3
0.1
Other fabrics (over 50%
synthetic)
30.7 19.3 20.6 17.2
5.3
1.8 1.5 4.2 5.8
2.2
Cotton/Syntheti c mixtures
(chiefly cotton)
10.7 9.2
12.4 10.5
3.2
0.2 0.1 0.7 2.3
0.9
Total
42,3 29.2 34.3 29.1
8.9
2.1 1.6 5.0 8.4
3.2
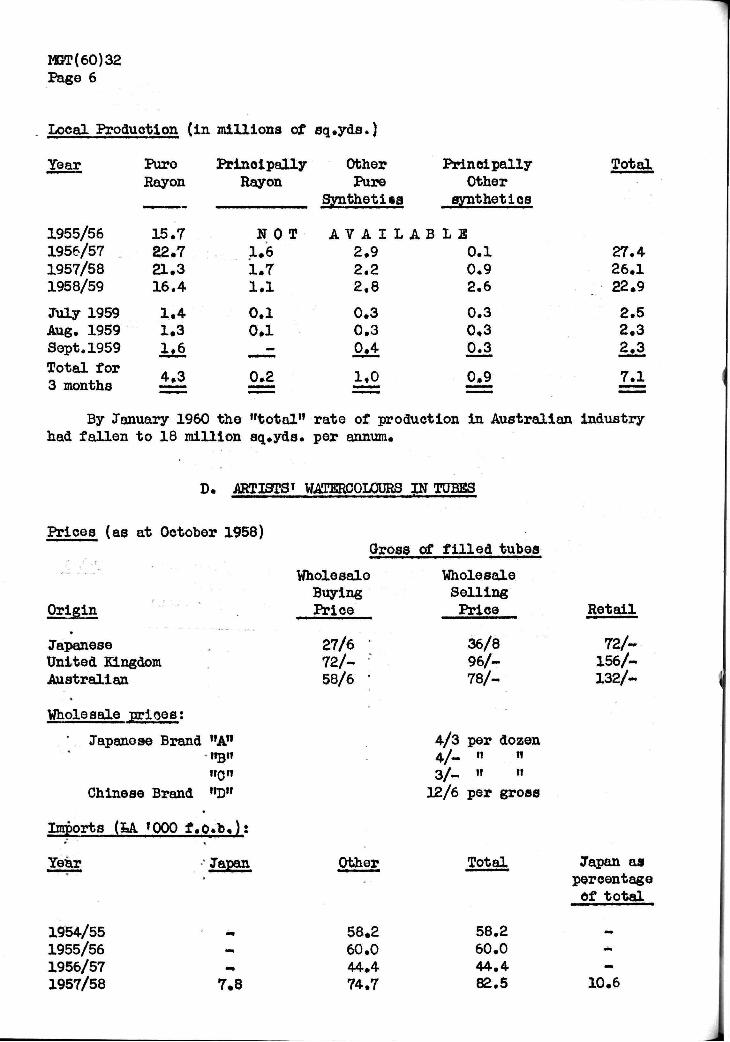
M3T(60)32 Page 6
Local Production (in millions of sq.yds.)
Year
1955/56 1956/57 1957/58 1958/59
July 1959 Aug. 1959 Sept,1959
Total for 3 months
Pure Rayon
15.7 22.7 21.3 16.4
1.4 1.3 1.6
4.3
Principally Rayon
N O T 1.6 1.7 1.1
0.1 0.1
-
0.2
Other Pure
Synthetics
Principally Other
synthetics
A V A I L A B L E 2.9 2.2 2,8
0.3 0.3 0.4
1.0
0.1 0.9 2.6
0.3 0,3 0.3
0.9
Total
27.4 26.1 22.9
2.5 2.3 2.3
7.1
By January 1960 the "total" rate of production in Australian industry had fallen to 18 million sq.yds. per annum.
D. ARTISTS' WATERCOLOURS IN TUBES
Prices (as at October 1958)
Origin
Japanese United Kingdom Australian
Wholesale prioes:
Japanese Brand "A" "B" "0"
Chinese Brand "D"
Imports (ÏA '000 f.o.b,):
Year • Japan
1954/55 1955/56 1956/57 1957/58 7.8
Gross
Wholesale Buying Price
27/6 72/-58/6 '
=
Other
58,2 60.0 44.4 74.7
of filled tubes
Wholesale Selling Price
V3 4/-3/-12/6
36/8 96/-78/-
-
per dozen It I!
ii IT
per gross
Total
58.2 60,0 44.4 82.5
Retail
72/-156/-132/-
Japan as percentage ôf total
10.6
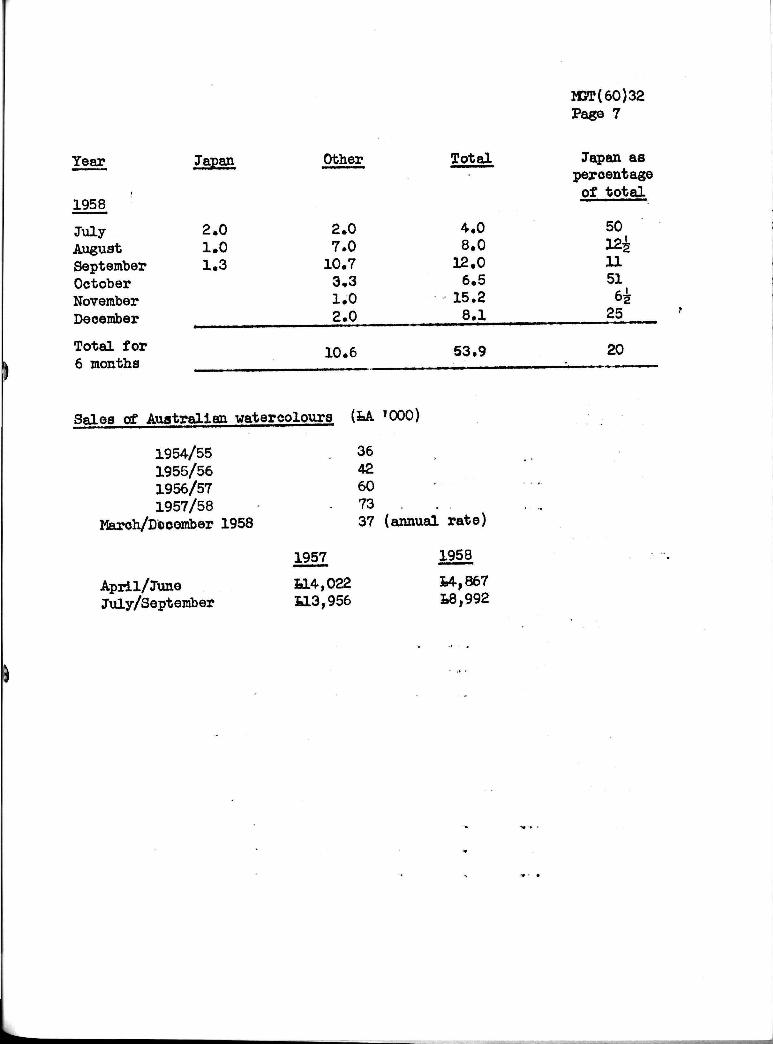
Year Japan
1958
July 2.0 August 1.0 September 1.3 October November December
Total for 6 months
Other
2.0 7.0 10.7 3.3 1.0 2.0
10.6
Sales of Australian watercolours (£>A '000)
1954/55 1955/56 1956/57 1957/58
March/Dtocember 1958
April/June July/September
Total
4.0 8.0 12.0 6.5
15.2 8.1
53.9
36 42 60
. 73 37 (annual rate)
1957
Î14,022 KL3,956
1958
£4,867 i8,992
M3T(60)32 Page 7
Japan as percentage of total
50 12^ 11 51 6^ 25
20
-
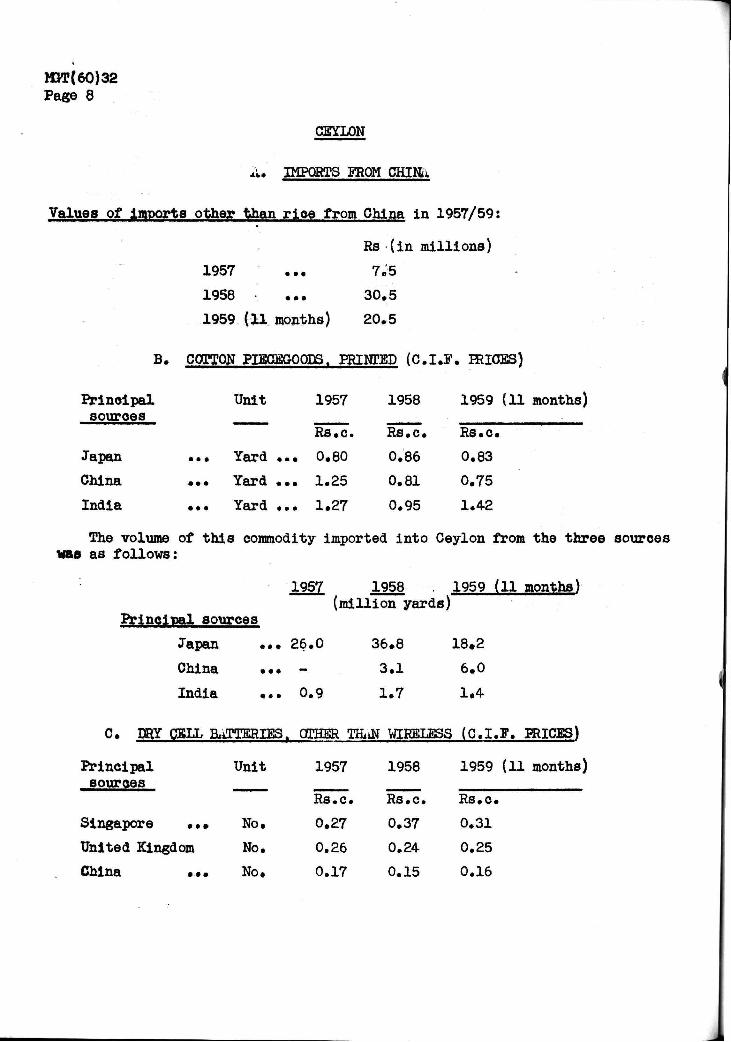
M3T{60)32 Page 8
CEYLON
Values of import!
B.
Principal sources
Japan
China
India
A. IMPORTS FROM CHINa
3 other than rice from China in 1957/59:
1957
1958 •
1959 (11 months)
Rs (in millions)
7„'5
30.5
20.5
COTTON PIECEGOODS. PRINTED (C.I.F. PRICES)
Unit 1957
Rs.c.
Yard ... 0.80
... Yard ... 1.25
... Yard ... 1.27
1958 1959 (11 months]
Rs.c. Rs.c.
0.86 0.83
0.81 0.75
0.95 1.42
The volume of this commodity imported into Ceylon from the three sources «as as follows:
1957 1958 1959 (11 months) (million yards)
Principal sources
Japan ... 26.0 36.8 18.2
China ... - 3.1 6.0
India ... 0.9 1.7 1.4
C. DRY CELL BATTERIES. OTHER THiJJ WIRELESS ( C . I . F . PRICES)
Principal sources
Singapore
United Kingd
China
• ••
am
...
Unit
No.
No.
No.
1957
Rs.c.
0.27
0.26
0.17
1958
Rs.c.
0.37
0.24
0.15
1959 (11 months,
Rs.c.
0.31
0.25
0.16
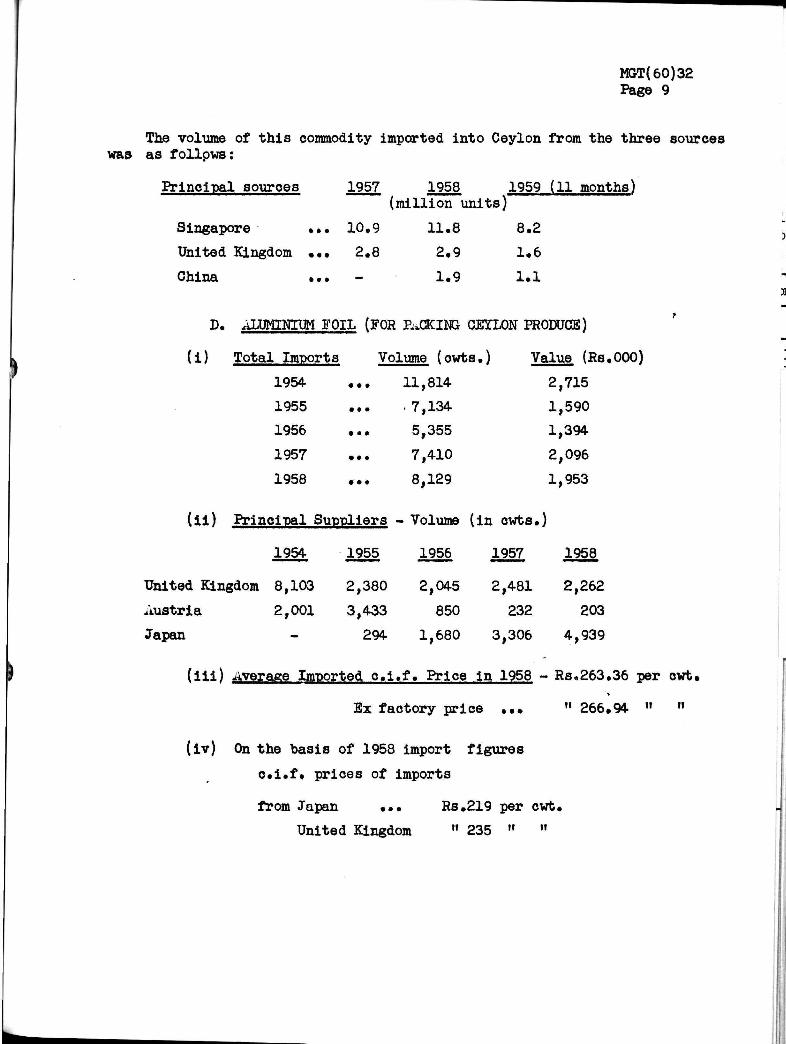
MGT(60)32 Page 9
The volume of this commodity imported into Ceylon from the three sources was as follows:
Principal sources 1957 1958 1959 (11 months)
Singapore
United Kingdom
China
• • •
• • *
• • t
10.9
2.8
_
(million units)
11.8
2.9
1.9
8.2
1.6
1.1
D. ALUMINIUM FOIL (FOR PACKING CEYLON PRODUCE)
(i) Total Imports Volume (owts.) Value (Rs.000)
1954 ... 11,814- 2,715
1955 ... 7,134- 1,590
1956 ... 5,355 1,394
1957 •.. 7,4-10 2,096
1958 ... 8,129 1,953
(ii) Principal Suppliers - Volume (in owts.)
1954- 1955 1956 1957 1958
United Kingdom 8,103
Austria 2,001
Japan
(iii) Average Imported c.i.f. Price in 1958 - Rs,263.36 per owt,
Ex factory price ... " 266.94- " »
(iv) On the basis of 1958 import figures
c.i.f. prices of imports
2,380
3,433
294
2,045
850
1,680
2,481
232
3,306
2,262
203
4,939
from Japan ...
United Kingdom
Rs.219 per cwt.
» 235 " "
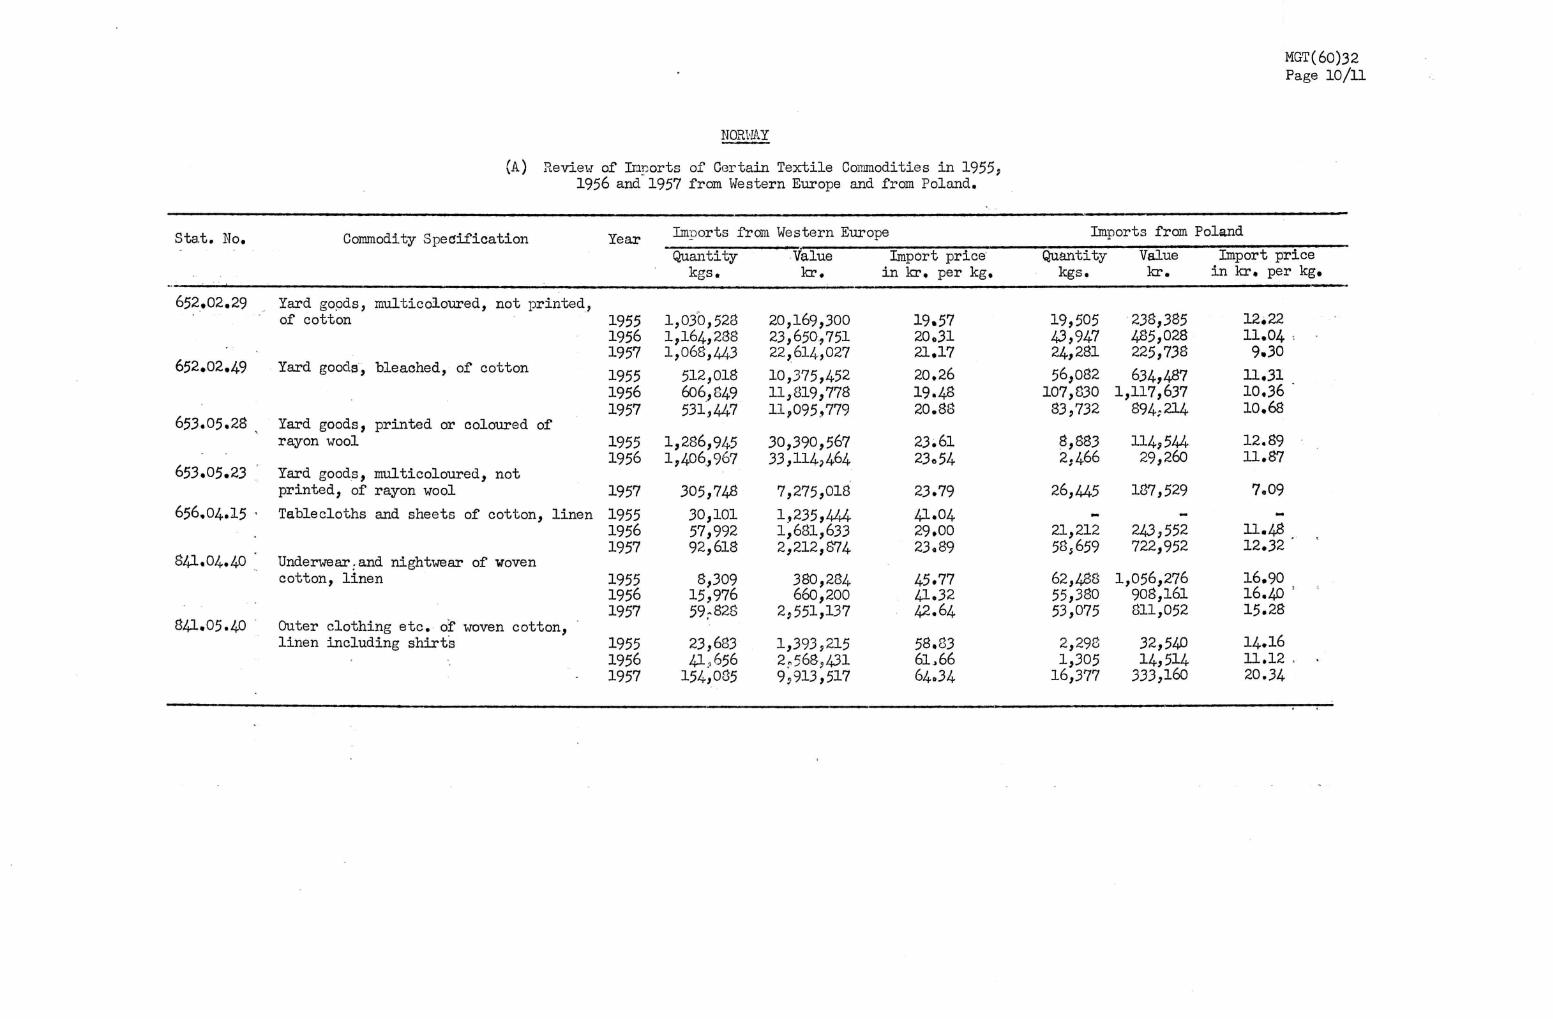
MGT(60)32 Page 10/11
NORWAY
(A) Review of Imports of Certain Textile Commodities in 1955, 1956 and 1957 from Western Europe and from Poland.
Stat. No.
652.02.29
652.02.49
653.05.28
653.05.23
656,04.15 -
841.04.40 '
84i.O5.4O
Commodity Specification
Yard goods, multicoloured, not printed, of cotton
Yard goods, bleached, of cotton
Yard goods, printed or coloured of rayon wool
Yard goods, multicoloured, not printed, of rayon wool
Tablecloths and sheets of cotton, linen
Underwear.and nightwear of woven cotton, linen
Outer clothing etc. of woven cotton, linen including shirts
Year
1955 1956 1957
1955 1956 1957
1955 1956
1957
1955 1956 1957
1955 1956 1957
1955 1956 1957
Imports from Western Eur op
Quantity kgs.
1,030,523 1,164,238 1,068,443
512,018 606,849 531,447
1,286,945 1,406,967
305,748
30,101 57,992 92,618
8,309 15,976 59 - 828
23,633 41,656 154,035
Value kr.
20,169,300 23,650,751 22,614,027
10,375,452 11,819,778 11,095,779
30,390,567 33,114,464
7,275,018
1,235,444-1,681,633 2,212,874
380,284 660,200
2,551,137
1,393,215 2,568,431 9,913,517
ie
Import price in kr. per kg.
19.57 20.31 21.17
20.26 19.48 20.88
23.61 23 «54
23.79
41.04 29.00 23.89
45.77 41.32 42.64
58.83 61,66 64.34
Imports from Poland
Quantity kgs.
19,505 43,947 24,281
56,082 107,830 33,732
8,883 2,466
26,445
-
21,212 58,659
62,488 55,380 53,075
2,298 1,305 16,377
Value
kr.
238,385 485,028 225,738
634,487 1,117,637 894;214
114,544 29,260
187,529
-
243,552 722,952
1,056,276 908,161 811,052
32,540 14,514 333,160
Import price in kr. per kg.
12.22 11.04 > 9.30
11.31 10,36 " 10.68
12.89 11.87
7.09
-
11.48 12.32 '
16.90 16.40 !
15.28
14.16 11.12 , • 20.34
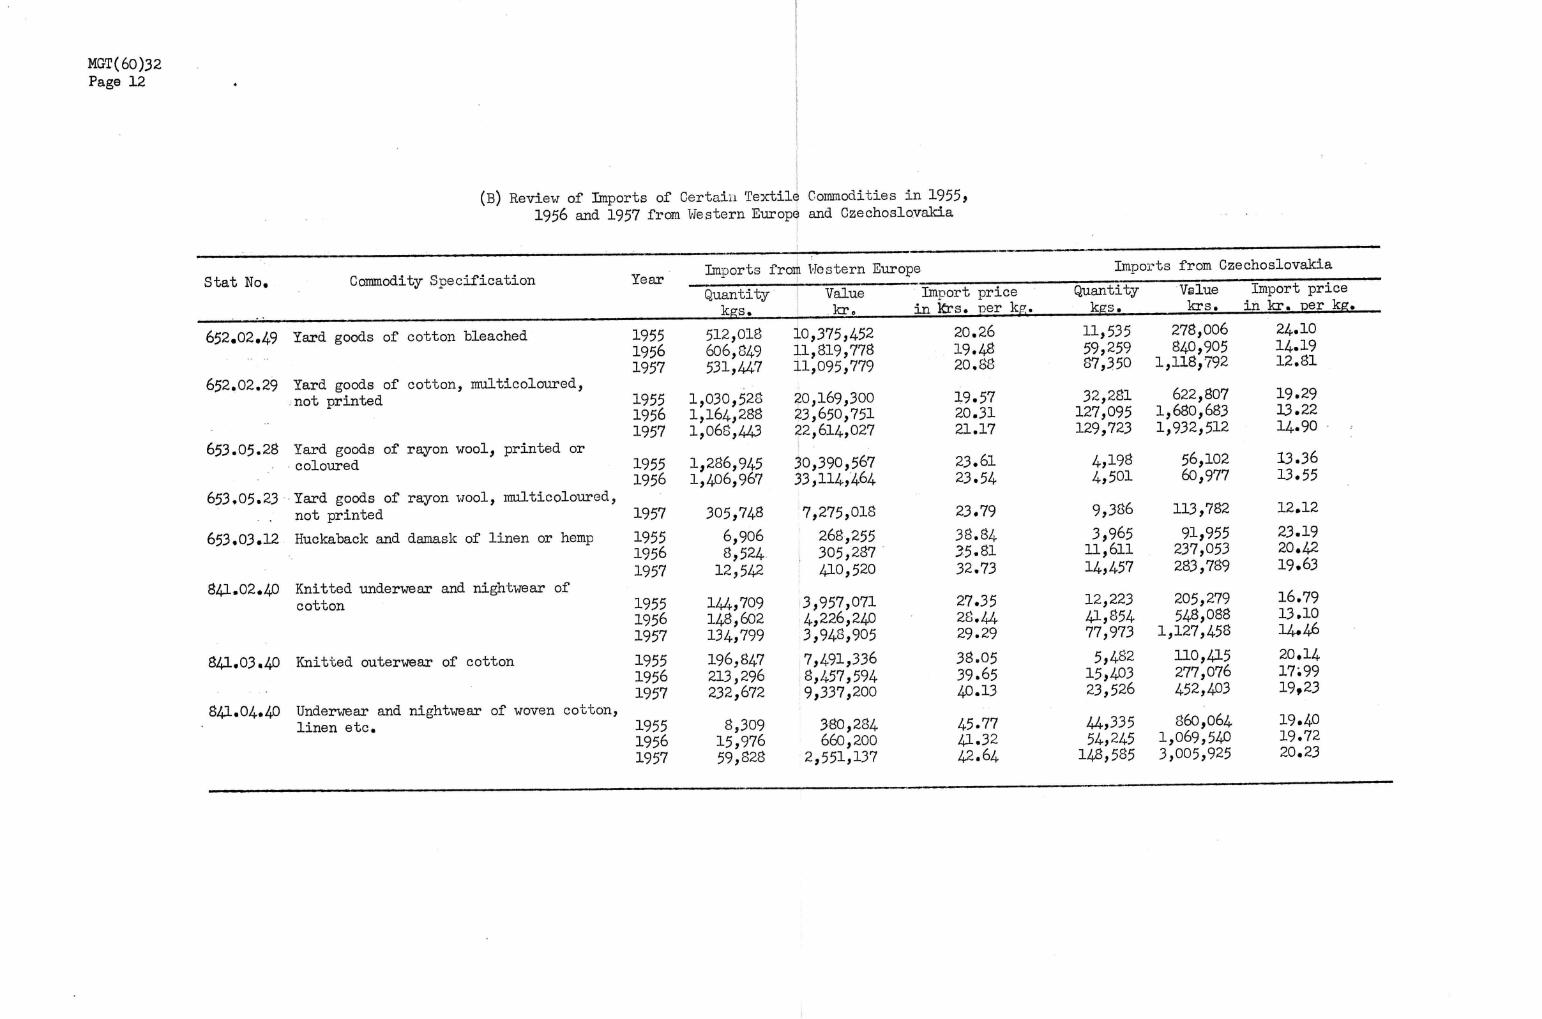
(B) Review of Imports of Certain Textile Commodities in 1955, 1956 and 1957 from Western Europe and Czechoslovakia
Stat No, Commodity Specification Year Imports from Vie stern Europe Imports from Czechoslovakia
Quantity Value Import price kgs. kr. in krs. per kp.
Quantity
652.02.49 Yard goods of cotton bleached
652.02.29 Yard goods of cotton, multicoloured, not printed
653.05.28 Yard goods of rayon wool, printed or coloured
653,05.23 Yard goods of rayon wool, multicoloured, . . not printed
653,03.12 Huckaback and damask of linen or hemp
84i.O2.4O Knitted underwear and nightwear of cotton
841.03,40 Knitted outerwear of cotton
841.04,40 Underwear and nightwear of woven cotton, linen etc.
1955 1956 1957
1955 1956 1957
1955 1956
1957
1955 1956 1957
1955 1956 1957
1955 1956 1957
1955 1956 1957
512,018 606,849 531,44-7
1,030,528 1,164,288 1,068,443
1,286,945 1,406,967
305,748
6,906 8,524 12,542
144,709 148,602 134,799
196,847 213,296 232,672
8,309 15,976 59,828
10,375,452 11,819,778 11,095,779
20,169,300 23,650,751 22,614,027
30,390,567 33,114,464
7,275,018
268,255 305,287 410,520
3,957,071 4,226,240 3,948,905
7,491,336 8,457,594 9,337,200
380,284 660,200
2,551,137
20.26 19.48 20.88
19.57 20.31 21.17
23.61 23.54
23.79
38.84 35.81 32.73
27.35 28.44 29.29
38.05 39.65 40.13
45.77 41.32 42.64
kgs Value Import price krs. in kr. per kg.
11,535 278,006 59,259 840,905 87,350 1,118,792
32,281 127,095 129,723
4,198 4,501
9,386
3,965 11,611 14,457
12,223 41,854 77,973
5,482 15,403 23,526
44,335 54,245
148,585
622,807 1,680,683 1,932,512
56,102 60,977
113,782
91,955 237,053 283,789
205,279 548,088
1,127,458
110,415 277,076 452,403
860,064 1,069,540 3,005,925
24.10 14.19 12.81
19.29 13.22 14.90
13.36 13.55
12.12
23.19 20.42 19.63
16.79 13.10 14.46
20.14 17; 99 19,23
19.40 19.72 20.23
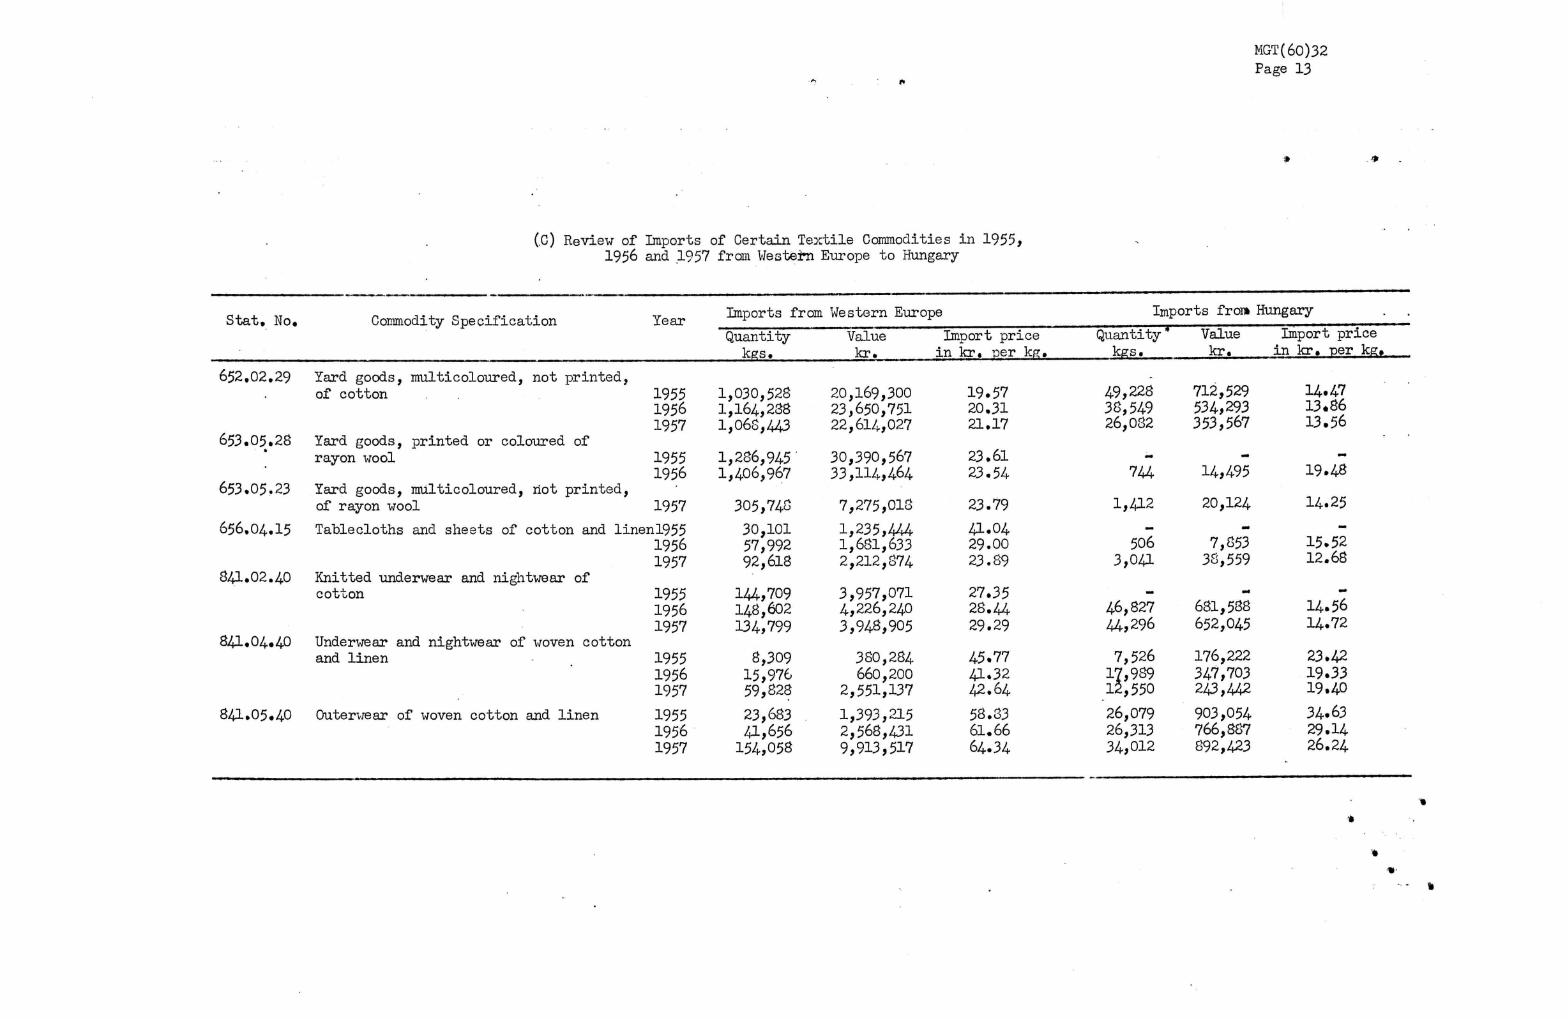
(.C) Review of Imports of Certain Textile Commodities in 1955, 1956 and .1957 from Western Europe to Hungary
MGT(60)32 Page 13
Stat. No. Commodity Specification Year Imports from Western Europe
Quantity Value Import price kgs. kr. in kr. per kg.
Imports fro» Hungary
Quantity * Value Import price kgs. kr. in kr. per kg..
652,02.29 Yard goods, multicoloured, not printed, of cotton . . 1955
1956 1957
653.05.28 Yard goods, printed or coloured of rayon wool 1955
1956 653.05.23 Yard goods, multicoloured, riot printed,
of rayon wool 1957
656,04.15 Tablecloths and sheets of cotton and linenl955 1956 1957
84I.02.4O Knitted underwear and nightwear of cotton 1955
1956 1957
84i.O4.40 Underwear and nightwear of woven cotton and linen 1955
1956 1957
84i.O5.4O Outerwear of woven cotton and linen 1955 1956 1957
1,030,528 1,164,238 1,068,443
1,286,945 1,406,967
305,748
30,101 57,992 92,618
144,709 148,602 134,799
8,309 15,976 59,328
23,683 41,656
154,058
20,169,300 23,650,751 22,614,027
30,390,567 33,114,464
7,275,018
1,235,444 1,681,633 2,212,874
3,957,071 4,226,240 3,948,905
380,284 660,200
2,551,137
1,393,215 2,568,431 9,913,517
19.57 20.31 21.17
23.61 23.54
23.79
41.04 29.00 23.89
27.35 28.44 29.29
45.77 41.32 42.64
58.83 61.66 64.34
49,228 38,549 26,082
744
1,412
506 3,041
46,827 44,296
7,526 17,939 12,550
26,079 26,313 34,012
712,529 534,293 353,567
14,495
20,124
7,353 33,559
681,538 652,045
176,222 347,703 243,442
903,054 766,887 892,423
14.47 13.86 13.56
19.48
14.25
15.52 12.68
14.56 14.72
23.42 19.33 19.40
34.63 29.14 26.24
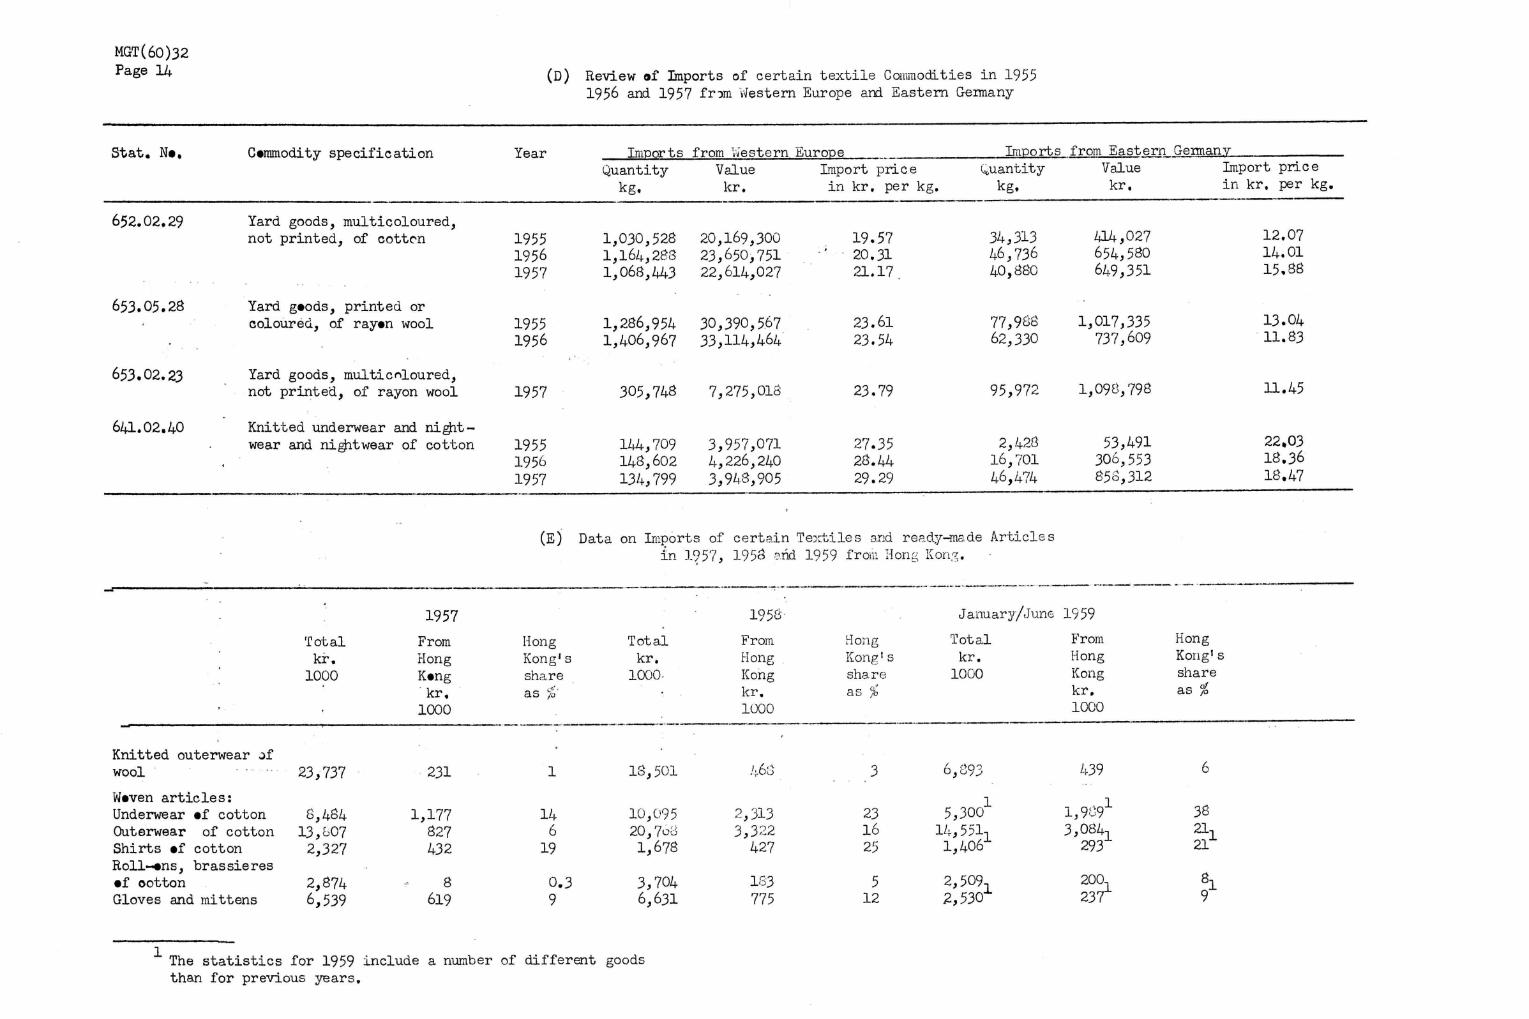
MGT(60)32 Page 14 (D) Review of Imports of cer ta in t e x t i l e Commodities in 1955
1956 and 1957 from Western Europe and Eastern Germany
Stat. No. Commodity specification Year Imports from Western Europe Imports from Eastern Germany
652.02.29
653.05.28
653.02.23
641.02.40
Quantity kg.
Value kr.
Yard goods, multicoloured, not printed, of cotton
Yard goods, printed or coloured, of rayon wool
Yard goods, multicoloured, not printed, of rayon wool
Knitted underwear and night -wear and nightwear of cotton
1955 1956 1957
1955 1956
1957
1955 1956 1957
1,030,528 1,164,283 1,068,443
1,286,954 1,406,967
144,709 148,602 134,799
20,169,300 23,650,751 22,614,027
30,390,567 33,114,464
305,748 7,275,018
3,957,071 4,226,240 3,948,905
Import pr ice in k r . per kg.
19.57 20.31 21.17
23.61 23.54
23.79
27.35 28.44 29.29
Quantity
kg.
34,313 46,736 40,880
77,988 62,330
95,97^
2,423 16,701 46,474
Value kr .
414,027 654,580 649,351
1,017,335 737,609
1,098,798
53,491 306,553 853,312
Import price in kr, per kg.
12.07 14.01 15.88
13.04 11.83
11.45
22,03 18.36 18.47
(E) Data on Imports of cer ta in Text i les and ready-made Art ic les In 1957, 1958 ?nd 1959 from Hong Kong.
Total k r .
1000
1957
From Hong Kong
kr . 1000
Hong Kong4 s share
Total kr .
1000.
1958
From Hong Kong kr . 1000
Hong Kong's sha re as %
Knitted outerwear oî wool
Woven articles: Underwear of cotton Outerwear of cotton Shirts of cotton Roll-ons, brassieres of ootton Gloves and mittens
23,737
8,484 13,307 2,327
2,874 6,539
231
1,177 827 432
8 619
-
1
14 6 19
0.3 9
18,501
10,095 20,7o8 1,678
3,704 6,631
•
463
2,313 3,322 427
133 775
3
23 16 25
5 12
January/June 1959
Total kr .
1000
1 floo
5,300 14,551, 1,406
2,509. 2,530x
From Hong Kong kr . 1000
439
l ^ 1
3,084, 293
200, 237"̂
Hong Kong' s share as %
33 21-, 21
8,
The statistics for 1959 include a number of different goods than for previous years.
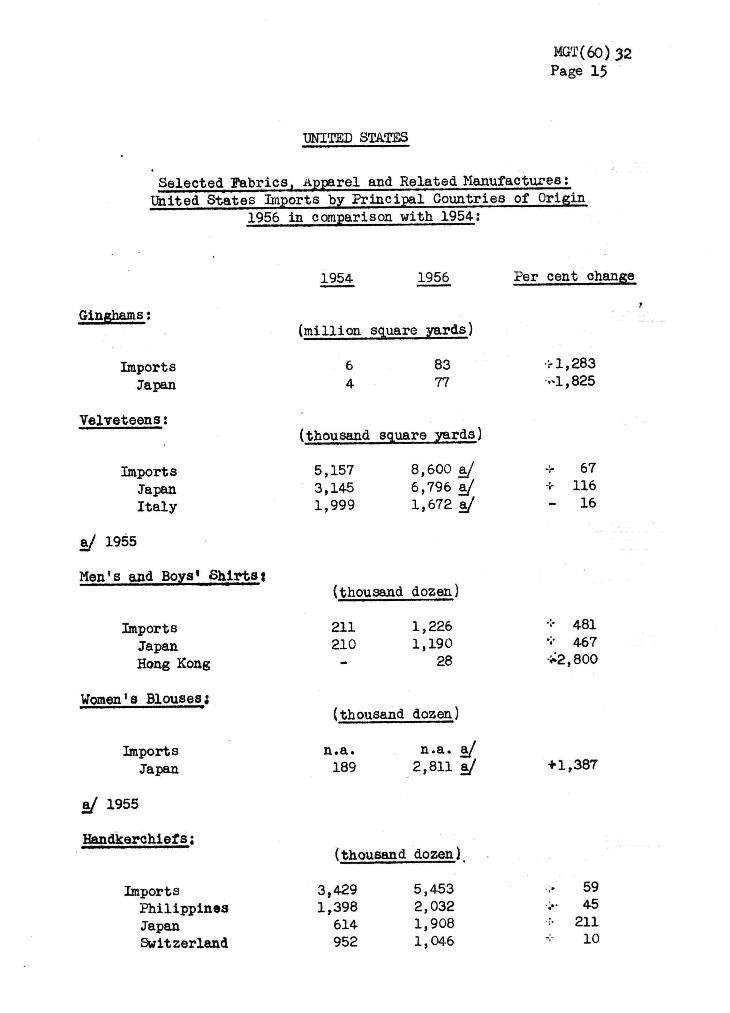
MGT(60) 32 Page 15
Selected Fabrics
UNITED STATES
i, Apparel and Related Manufactures : United States Imports by Principal Countries
Ginghams :
Imports Japan
Velveteens :
Imports Japan Italy
a/ 1955
Men's and Boys'
1956
•
Shirts t
in comparison with 1954:
1954 1956
(million square yards)
6 83 4 77
(thousand square yards)
5,157 8,600 a/ 3,145 6,796 â/ 1,999 1,672 a/
of Origin
Per cent change
•r 1,283 KL,825
+ 67 + 116 - 16
Imports Japan Hong Kong
Women's Blouses;
Imports Japan
a/ 1955
Handkerchiefs ;
Imports Philippines Japan Switzerland
(thousand dozen)
211 210
1,226 1,190
28
(thousand dozen)
n . a . 189
n . a . a/ 2,811 a/
(thousand dozen)
3,429 1,398 614 952
5,453 2,032 1,908 1,046
+ 481 * 467 *2,800
+ 1,387
59 45 211 10
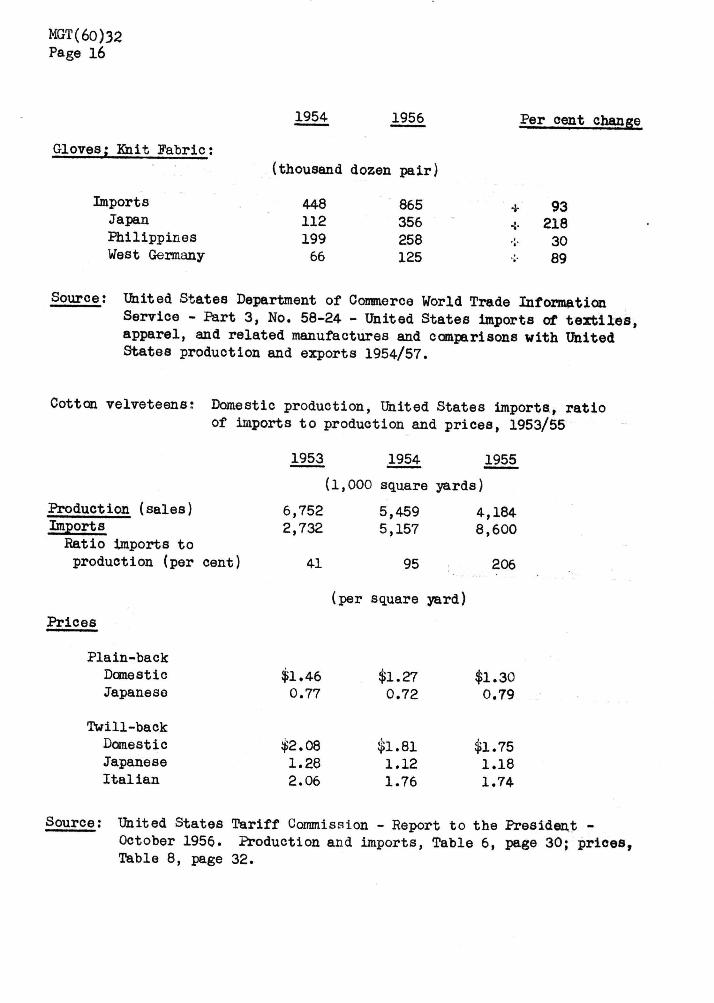
MGT(60)32 Page 16
1954 1956 Per cent change
Gloves; Knit Fabric:
Imports Japan Philippines West Germany
(thousand dozen pair)
448 112 199 66
865 356 258 125
•»--:• V
•;•
93 218
30 89
Source: United States Department of Commerce World Trade Information Service - Part 3, No. 58-24 - United States imports of textiles, apparel, and related manufactures and comparisons with United States production and exports 1954/57.
Cotton velveteens: Domestic production, United States imports, ratio of imports to production and prices, 1953/55
Production (sales) Imports Ratio imports to production (per cent)
Prices
1953 1954 1955
(1,000 square yards)
6,752 2,732
5,459 5,157
4,184 8,600
41 95 206
(per square yard)
Plain-back Domestic Japanese
Twill-back Domestic Japanese Italian
$1.46 0.77
$2.08 1.28 2.06
$1.27 0.72
p . 81 1.12 1.76
$1.30 0.79
$1.75 1.18 1.74
Source : United States Tariff Commission - Report to the President -October 1956. Production and imports, Table 6, page 30; prices, Table 8, page 32.


