Indonesia Power Market Outlook to 2030 Market Trends, Regulations and Competitive Landscape GDPE0649ICR / Published February 2013
GDPE0649ICR / Published FEB 2013 Page 2 Indonesia Power Market Outlook to 2030 –Market Trends, Regulations
and Competitive Landscape © GlobalData. This report is a licensed product and is not to be copied, reproduced, shared or resold in any form
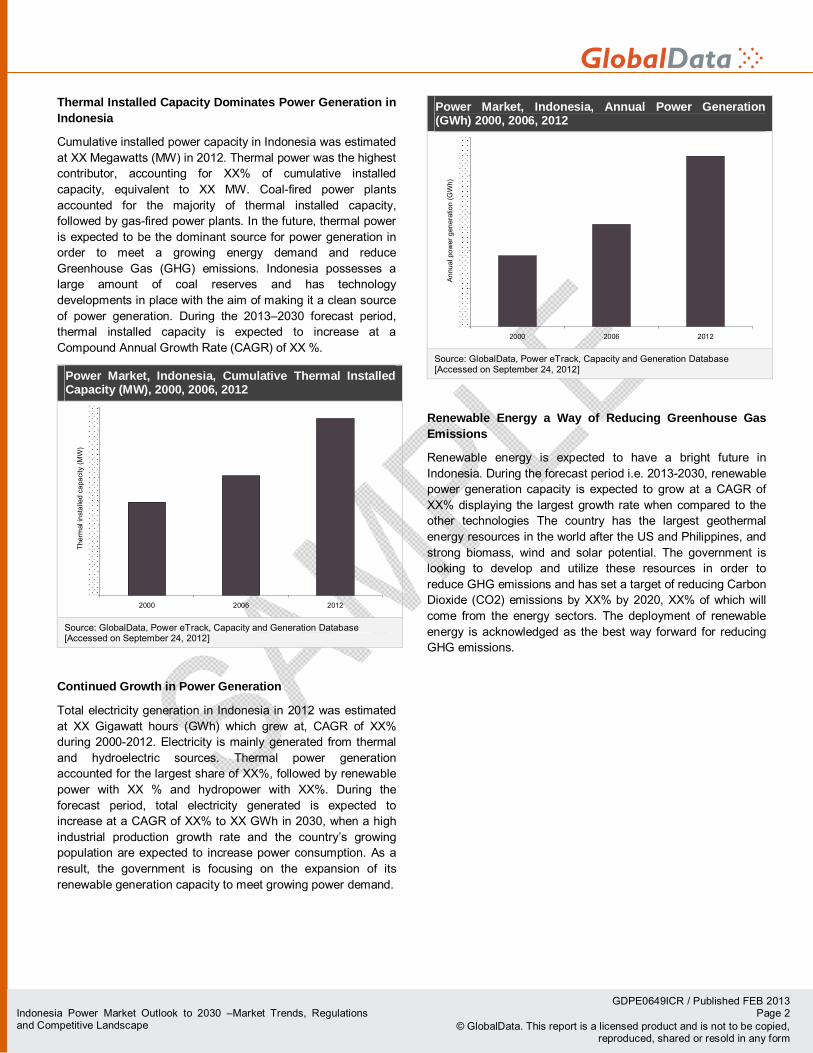
Thermal Installed Capacity Dominates Power Generation in Indonesia
Cumulative installed power capacity in Indonesia was estimated at XX Megawatts (MW) in 2012. Thermal power was the highest contributor, accounting for XX% of cumulative installed capacity, equivalent to XX MW. Coal-fired power plants accounted for the majority of thermal installed capacity, followed by gas-fired power plants. In the future, thermal power is expected to be the dominant source for power generation in order to meet a growing energy demand and reduce Greenhouse Gas (GHG) emissions. Indonesia possesses a large amount of coal reserves and has technology developments in place with the aim of making it a clean source of power generation. During the 2013–2030 forecast period, thermal installed capacity is expected to increase at a Compound Annual Growth Rate (CAGR) of XX %.
Power Market, Indonesia, Cumulative Thermal Installed Capacity (MW), 2000, 2006, 2012
2000 2006 2012
Ther
mal
inst
alle
d ca
paci
ty (M
W)
Source: GlobalData, Power eTrack, Capacity and Generation Database [Accessed on September 24, 2012]
Continued Growth in Power Generation
Total electricity generation in Indonesia in 2012 was estimated at XX Gigawatt hours (GWh) which grew at, CAGR of XX% during 2000-2012. Electricity is mainly generated from thermal and hydroelectric sources. Thermal power generation accounted for the largest share of XX%, followed by renewable power with XX % and hydropower with XX%. During the forecast period, total electricity generated is expected to increase at a CAGR of XX% to XX GWh in 2030, when a high industrial production growth rate and the country’s growing population are expected to increase power consumption. As a result, the government is focusing on the expansion of its renewable generation capacity to meet growing power demand.
Power Market, Indonesia, Annual Power Generation (GWh) 2000, 2006, 2012
2000 2006 2012
Ann
ual p
ower
gen
erat
ion
(GW
h)
Source: GlobalData, Power eTrack, Capacity and Generation Database [Accessed on September 24, 2012]
Renewable Energy a Way of Reducing Greenhouse Gas Emissions
Renewable energy is expected to have a bright future in Indonesia. During the forecast period i.e. 2013-2030, renewable power generation capacity is expected to grow at a CAGR of XX% displaying the largest growth rate when compared to the other technologies The country has the largest geothermal energy resources in the world after the US and Philippines, and strong biomass, wind and solar potential. The government is looking to develop and utilize these resources in order to reduce GHG emissions and has set a target of reducing Carbon Dioxide (CO2) emissions by XX% by 2020, XX% of which will come from the energy sectors. The deployment of renewable energy is acknowledged as the best way forward for reducing GHG emissions.
GDPE0649ICR / Published FEB 2013 Page 3 Indonesia Power Market Outlook to 2030 –Market Trends, Regulations
and Competitive Landscape © GlobalData. This report is a licensed product and is not to be copied, reproduced, shared or resold in any form
1 Table of Contents 1 Table of Contents ............................................................................................................................ 3
1.1 List of Tables............................................................................................................................. 5 1.2 List of Figures............................................................................................................................ 5
2 Introduction ..................................................................................................................................... 6 2.1 GlobalData Report Guidance ..................................................................................................... 6
3 Indonesia, Power Market, A Snapshot .............................................................................................. 7 3.1 Macroeconomic Scenario .......................................................................................................... 7 3.2 Supply Security ......................................................................................................................... 7 3.3 Generation Infrastructure........................................................................................................... 8 3.4 Transmission Infrastructure........................................................................................................ 8 3.5 Degree of Competition............................................................................................................... 8 3.6 Regulatory Scenario.................................................................................................................. 8 3.7 Future Potential......................................................................................................................... 9
4 Indonesia, Power Market, Analysis 2000–2030............................................................................... 10 4.1 Indonesia, Power Market, Installed Capacity, 2000–2030 ......................................................... 10
4.1.1 Installed Capacity: Breakdown by Type of Power Plant, 2012........................................... 10 4.1.2 Cumulative Installed Capacity and Annual Generation, 2000–2030 .................................. 11 4.1.3 Thermal Installed Capacity and Generation, 2000–2030 .................................................. 13 4.1.4 Hydropower Installed Capacity and Generation, 2000–2030............................................. 15 4.1.5 Renewable Power Installed Capacity and Generation, 2000–2030 ................................... 17
4.2 Indonesia, Power Market, Import and Export Scenario.............................................................. 19 4.3 Indonesia, Power Market, Annual Power Consumption, 2000–2030 .......................................... 19 4.4 Indonesia, Power Market, Power Consumption by Sector, 2012................................................ 21
5 Indonesia, Power Market, Infrastructure Overview .......................................................................... 22 5.1 Indonesia, Power Market, Active Power Projects ...................................................................... 22
5.1.1 Leading Thermal Power Projects..................................................................................... 22 5.1.2 Leading Hydro Power Projects ........................................................................................ 23 5.1.3 Leading Renewable Power Projects ................................................................................ 23
5.2 Indonesia, Power Market, Upcoming Power Projects ................................................................ 24 5.2.1 Leading Thermal Power Projects..................................................................................... 24 5.2.2 Leading Upcoming Hydropower Projects ......................................................................... 25 5.2.3 Leading Upcoming Renewable Power Projects................................................................ 26
5.3 Indonesia, Power Market, Transmission Network Overview ...................................................... 27 5.4 Indonesia, Power Market, Distribution Network Overview.......................................................... 28 5.5 Grid Interconnection ................................................................................................................ 29
6 Indonesia, Power Market, Regulatory Structure .............................................................................. 30 6.1 Indonesia, Power Market, Regulatory Structure Overview......................................................... 30 6.2 Indonesia, Policies to Support Renewable Energy .................................................................... 30 6.3 Indonesia, Nuclear Development Scenario ............................................................................... 30
7 Indonesia, Power Market, Competitive Landscape: Snapshot of Leading Power-generating Companies.................................................................................................................................... 31
7.1 Indonesia, Power Market, Market Share of Major Power-generating Companies........................ 31 7.2 Key Company in the Indonesia Power Generation Market, PT PLN (Persero)............................ 32
7.2.1 PT PLN (Persero), Company Overview ........................................................................... 32 7.2.2 PT PLN (Persero), Business Description ......................................................................... 32 7.2.3 PT PLN (Persero), SWOT Analysis ................................................................................. 33 7.2.4 PT PLN (Persero) Strengths............................................................................................ 34 7.2.5 PT PLN (Persero) Weaknesses....................................................................................... 35 7.2.6 PT PLN (Persero) Opportunities...................................................................................... 35 7.2.7 PT PLN (Persero) Threats............................................................................................... 36
8 Appendix....................................................................................................................................... 37 8.1 Market Definitions.................................................................................................................... 37
8.1.1 Power............................................................................................................................. 37 8.1.2 Installed Capacity ........................................................................................................... 37 8.1.3 Active Installed Capacity ................................................................................................. 37 8.1.4 Electricity Generation...................................................................................................... 37 8.1.5 Electricity Consumption................................................................................................... 37 8.1.6 Thermal Power Plant ...................................................................................................... 37 8.1.7 Hydropower Plant ........................................................................................................... 37

GDPE0649ICR / Published FEB 2013 Page 4 Indonesia Power Market Outlook to 2030 –Market Trends, Regulations
and Competitive Landscape © GlobalData. This report is a licensed product and is not to be copied, reproduced, shared or resold in any form
8.1.8 Nuclear Power................................................................................................................ 37 8.1.9 Renewable Energy Resources ........................................................................................ 37
8.2 Abbreviations .......................................................................................................................... 38 8.3 Bibliography ............................................................................................................................ 39 8.4 Coverage ................................................................................................................................ 40 8.5 GlobalData’s Methodology....................................................................................................... 40 8.6 Contact Us .............................................................................................................................. 41 8.7 Disclaimer ............................................................................................................................... 41

GDPE0649ICR / Published FEB 2013 Page 5 Indonesia Power Market Outlook to 2030 –Market Trends, Regulations
and Competitive Landscape © GlobalData. This report is a licensed product and is not to be copied, reproduced, shared or resold in any form
1.1 List of Tables Table 1: Power Market, Indonesia, Cumulative Installed Capacity by Type of Power Plant (%), 2012.. 10 Table 2: Power Market, Indonesia, Cumulative Installed Capacity (MW) and Annual Power Generation
(GWh), 2000–2030 ............................................................................................................. 12 Table 3: Power Market, Indonesia, Cumulative Thermal Installed Capacity (MW) and Generation
(GWh), 2000–2030 ............................................................................................................. 14 Table 4: Power Market, Indonesia, Cumulative Hydropower Installed Capacity (MW) and Generation
(GWh), 2000–2030 ............................................................................................................. 16 Table 5: Power Market, Indonesia, Cumulative Renewable Installed Capacity (MW) and Generation
(GWh), 2000–2030 ............................................................................................................. 18 Table 6: Power Market, Indonesia, Annual Power Consumption (GWh), 2000–2030 .......................... 20 Table 7: Power Market, Indonesia, Breakdown of Electricity Consumption, By Sector (%), 2012......... 21 Table 8: Power Market, Indonesia, Leading Active Thermal Power Projects, 2012.............................. 22 Table 9: Power Market, Indonesia, Leading Active Hydro Power Projects, 2012................................. 23 Table 10: Power Market, Indonesia, Leading Active Renewable Power Projects, 2012......................... 23 Table 11: Power Market, Indonesia, Leading Upcoming Thermal Power Projects, 2012 ....................... 24 Table 12: Power Market, Indonesia, Leading Upcoming Hydro Power Projects, 2012........................... 25 Table 13: Power Market, Indonesia, Leading Upcoming Renewable Power Projects, 2012................... 26 Table 14: Power Market, Indonesia, Transmission Line Length (Ckm), 2000–2020 .............................. 27 Table 15: Power Market, Indonesia, Distribution Network, Length (Ckm), 2000–2020........................... 28 Table 16: Power Market, Indonesia, Installed Capacity Share of Major Power Companies (%), 2012.... 31 Table 17: PT PLN (Persero), SWOT Analysis ..................................................................................... 33 Table 18: Abbreviations...................................................................................................................... 38
1.2 List of Figures Figure 1: Power Market, Indonesia, Cumulative Installed Capacity by Type of Power Plant (%), 2012.. 10 Figure 2: Power Market, Indonesia, Cumulative Installed Capacity (MW) and Annual Power Generation
(GWh), 2000–2030 ............................................................................................................. 11 Figure 3: Power Market, Indonesia, Cumulative Thermal Installed Capacity (MW) and Power Generation
(GWh), 2000–2030 ............................................................................................................. 13 Figure 4: Power Market, Indonesia, Cumulative Hydropower Installed Capacity (MW) and Generation
(GWh), 2000–2030 ............................................................................................................. 15 Figure 5: Power Market, Indonesia, Cumulative Renewable Installed Capacity (MW) and Generation
(GWh), 2000–2030 ............................................................................................................. 17 Figure 6: Power Market, Indonesia, Annual Power Consumption (GWh), 2000–2030 .......................... 19 Figure 7: Power Market, Indonesia, Breakdown of Electricity Consumption, By Sector (%), 2012......... 21 Figure 8: Power Market, Indonesia, Installed Capacity Share of Major Power Companies (%), 2012.... 31
GDPE0649ICR / Published FEB 2013 Page 6 Indonesia Power Market Outlook to 2030 –Market Trends, Regulations
and Competitive Landscape © GlobalData. This report is a licensed product and is not to be copied, reproduced, shared or resold in any form
2 Introduction Indonesia is the largest economy in Southeast Asia, as well as being the fourth most populated country and 17th largest economy in the world. Post-independence, it has seen tremendous economic development, partly as a result of government changes to its regulatory framework in order to encourage economic growth. This has resulted in increased investment from the private sector, both foreign and domestic. Despite this, Indonesia still struggles with poverty, unemployment, corruption, poor infrastructure, a complex regulatory environment and unequal resource distribution among regions.
With an estimated Gross Domestic Product (GDP) (at current prices) of $XX billion in 2012, the country registered a growth rate of XX% in the same year (CIA, 2012). The industry sector was estimated to account for XX% of the country’s GDP in 2012, followed by the service sector (XX%) and the agriculture sector (XX%). The country has substantial natural resources including crude oil, natural gas, tin, copper and gold. It is a major importer of chemicals, fuels, food stuffs, and machinery and equipment, and a net importer of crude oil. The country exports gas, coal, electrical appliances, rubber, textiles and plywood. Its major trading partners include China, Japan, Singapore and the US. Since 1998, the country’s oil production has declined because its largest oil fields have reached maturity and it is unable to develop new comparable resources. Despite being a net importer of crude oil, since 2004 it has been the world’s sixth largest net exporter of natural gas and second largest net exporter of coal.
The Ministry of Energy and Mineral Resources (MEMR) is the chief regulator of the electricity sector, which is responsible for the legislation, implementation, co-ordination, enforcement and compliance of the electricity sector. Perusahaan Perseroan PT Perusahaan Listrik Negara (PLN), a state-owned utility, is the dominant player in the power sector. It owns XX% of the country's power-generating capacity through its subsidiaries and maintains a monopoly over Transmission and Distribution (T&D) activities. The remaining XX% is owned by the private sector through Independent Power Producers (IPPs). This contribution is likely to increase as new private power projects are expected to come online in the next few years. The electrification ratio in the country is currently XX%, but expected to increase due to increasing private investments in the electricity infrastructure.
2.1 GlobalData Report Guidance The report begins with an executive summary capturing key growth trends in the Indonesian power
market.
Chapter three provides snapshot of Indonesia’s power sector.
Chapter four provides cumulative capacity and power generation information, as well as segmentation according to source of energy from 2000 to 2012, forecast to 2030. This is followed by the consumption scenario for the market between 2000 and 2012, with forecasts provided until 2030.
Chapter five provides information on the power infrastructure in Indonesia, including details of leading active and upcoming power plants according to energy source, and existing and planned developments in T&D infrastructure, and cross-country interconnections.
Chapter six provides information on regulatory structure and gives a brief description of the power regulatory structure and prominent policies likely to influence the future of the power market.
Chapter seven describes the competitive landscape of Indonesia’s power market with SWOT analysis of the leading companies.
Note: From 2012 the report provides actual or estimated data depending on information availability at the time of writing.

GDPE0649ICR / Published FEB 2013 Page 10 Indonesia Power Market Outlook to 2030 –Market Trends, Regulations
and Competitive Landscape © GlobalData. This report is a licensed product and is not to be copied, reproduced, shared or resold in any form
4 Indonesia, Power Market, Analysis 2000–2030 4.1 Indonesia, Power Market, Installed Capacity, 2000–2030 4.1.1 Installed Capacity: Breakdown by Type of Power Plant, 2012 In 2012, cumulative installed capacity was dominated by coal-fired power plants, which accounted for XX% of the cumulative installed capacity. Gas-fired plants made the next highest contribution, with a share of XX%, followed by hydroelectric power and oil-fired plants with XX% and XX% respectively. Renewable sources accounted for a share of XX% in the total capacity during the same year.
Figure 1: Power Market, Indonesia, Cumulative Installed Capacity by Type of Power Plant (%), 2012
Coal
Gas
Hydro
Oil
Biomass
GeothermalSolar PV
Source: GlobalData, Power eTrack, Capacity and Generation Database [Accessed on September 17, 2012] PV: Photovoltaic
Table 1: Power Market, Indonesia, Cumulative Installed Capacity by Type of Power Plant (%), 2012
Type of Power Plant Percentage Share (%)
Coal
Gas
Hydro
Oil
Biomass
Geothermal
Solar PV
Source: GlobalData, Power eTrack, Capacity and Generation Database [Accessed on September 17, 2012]

GDPE0649ICR / Published FEB 2013 Page 11 Indonesia Power Market Outlook to 2030 –Market Trends, Regulations
and Competitive Landscape © GlobalData. This report is a licensed product and is not to be copied, reproduced, shared or resold in any form
4.1.2 Cumulative Installed Capacity and Annual Generation, 2000–2030 Indonesia’s cumulative installed capacity increased from XX MW in 2000 to XX MW in 2012 at a CAGR of XX%, attributed to growth in the thermal, hydro and renewable power between 2000 and 2012. Thermal fuel sources (coal, oil and gas) contributed the most with a combined share of XX% or XX MW of total installed capacity.
During the forecasted period 2013-2020, Indonesia will continue to see a good growth of installed capacity, reaching XX MW in 2030. Thermal fuel sources will remain the highest contributors during the forecast period and will contribute XX MW in 2030, although their share is expected to fall to XX% by 2030 due to higher contributions from renewable and hydro power plants. From 2013 to 2030, renewable power sources are expected to grow at a CAGR of XX% and hydro plants are expected to grow at a CAGR of XX%.
Total electricity generation in Indonesia in 2012 was estimated at XX Gigawatt hours (GWh), of which thermal power generation accounted for XX%, and hydro and renewable power generation accounted for XX% and XX% respectively. Between 2013and 2030, Indonesia’s total electricity generation is expected to increase at a CAGR of XX% to XX GWh by 2030.
Figure 2: Power Market, Indonesia, Cumulative Installed Capacity (MW) and Annual Power Generation (GWh), 2000–2030
2000
2002
2004
2006
2008
2010
2012
2014
2016
2018
2020
2022
2024
2026
2028
2030
Cum
ulat
ive
inst
alle
d ca
paci
ty (M
W)
Ann
ual p
ower
gen
erat
ion
(GW
h)
Cumulative Installed Capacity (MW) Annual Power Generation (GWh)
Source: GlobalData, Power eTrack, Capacity and Generation Database [Accessed on September 24, 2012]

GDPE0649ICR / Published FEB 2013 Page 12 Indonesia Power Market Outlook to 2030 –Market Trends, Regulations
and Competitive Landscape © GlobalData. This report is a licensed product and is not to be copied, reproduced, shared or resold in any form
Table 2: Power Market, Indonesia, Cumulative Installed Capacity (MW) and Annual Power Generation (GWh), 2000–2030
Year Cumulative Installed Capacity (MW) Annual Power Generation (GWh)
2000
2001
2002
2003
2004
2005
2006
2007
2008
2009
2010
2011
2012
2013
2014
2015
2016
2017
2018
2019
2020
2021
2022
2023
2024
2025
2026
2027
2028
2029
2030
Source: GlobalData, Power eTrack, Capacity and Generation Database [Accessed on September 24, 2012]
GDPE0649ICR / Published FEB 2013 Page 37 Indonesia Power Market Outlook to 2030 –Market Trends, Regulations
and Competitive Landscape © GlobalData. This report is a licensed product and is not to be copied, reproduced, shared or resold in any form
8 Appendix 8.1 Market Definitions The geographical coverage of the report is Indonesia. The report covers market segments related to installed electricity capacity, generation, consumption, power infrastructure and power regulations. The report covers the whole of Indonesia for a quantitative and qualitative assessment of its power market.
8.1.1 Power Power refers to the rate of production, transfer, or energy use, usually related to electricity. It is measured in watts and often expressed in kW or MW. It is also known as "real" or "active" power.
8.1.2 Installed Capacity Installed capacity refers to the generator’s nameplate capacity as stated by the manufacturer or the maximum rated output of a generator under given conditions. It is given in MW on a nameplate physically affixed to the generator.
8.1.3 Active Installed Capacity Active installed capacity refers to the component of electric power that performs work, given in kW or MW.
8.1.4 Electricity Generation Electricity generation refers to the production of electric energy by transforming other forms of energy. It also refers to the amount of electric energy produced, expressed in GWh.
8.1.5 Electricity Consumption Consumption of electricity is calculated as generation, plus imports, minus exports, minus T&D losses and measured in GWh.
8.1.6 Thermal Power Plant A thermal power plant is one in which turbine generators are driven by burning fossil fuels.
8.1.7 Hydropower Plant A hydropower plant is one in which turbine generators are driven by falling water.
8.1.8 Nuclear Power Nuclear power refers to the electricity generated by the use of the thermal energy released from the fission of nuclear fuel in a reactor.
8.1.9 Renewable Energy Resources Renewable energy resources are naturally replenishing energy resources that are limited in the amount of energy that is available per unit of time, such as biomass, geothermal, solar and wind.

GDPE0649ICR / Published FEB 2013 Page 38 Indonesia Power Market Outlook to 2030 –Market Trends, Regulations
and Competitive Landscape © GlobalData. This report is a licensed product and is not to be copied, reproduced, shared or resold in any form
8.2 Abbreviations
Table 18: Abbreviations Full Form Abbreviations
Nuclear Energy Regulatory Agency BAPETEN
National Atomic Energy Agency BATAN
Balanced Corporate Management BCM
Brazil, Russia, India and China BRIC
Compound Annual Growth Rate CAGR
Continuous Emission Monitoring System CEMS
Circuit Kilometre Ckm
Electronic Devices ED
Energy and Electric Systems EES
EMIS Electrics GmbH EMIS
Enhanced Oil Recovery EOR
Engineering, Procurement and Construction EPC
Electric Power Steering EPS
Economic Transformation Programme ETP
Foreign Direct Investment FDI
Feed-in tariffs FITs
'Fast Track Programs FTP
Gross Domestic Product GDP
General Electric Company GE
Greenhouse Gases GHG
gas insulated substations GIS
Gigawatt hours GWh
Home Appliances HA
Industrial Automation Systems IAS
Integrated Compressor Line ICL
Integrated Compressor Line ICR
Information and Communication Systems ICS
Intellectual Properties IP
Integrated Pump and Energy Recovery IPER
Independent Power Producers IPPs
Information Technology IT
ITC Holdings Corp ITC
in vitro diagnostics IVD
Kilometres circuits kmc
Kilovolts kV
Liquefied Natural Gas LNG
Atomic Energy Agency LTA
Membrane Bioreactor MBR
Microcontroller Units MCUs
Membrane Distillation MD
Memorandum of Understanding MoU
Metals Technologies MT

GDPE0649ICR / Published FEB 2013 Page 39 Indonesia Power Market Outlook to 2030 –Market Trends, Regulations
and Competitive Landscape © GlobalData. This report is a licensed product and is not to be copied, reproduced, shared or resold in any form
Megawatt MW
National Key Economic Areas NKEA
Organisation for Economic Co-operation and Development OECD
Perusahaan Perseroan PT Perusahaan Listrik Negara PLN
Research and Development R&D
Siemens Financial Services SFS
Technical and Vocational Training Corporation TVTC
Terawatt hours TWh
World Economic Outlook WEO
Source: GlobalData
8.3 Bibliography CIA (2012). Indonesia-The World Factbook. Central Intelligence Agency.
Available from: https://www.cia.gov/library/publications/the-world-factbook/geos/id.html. [Accessed on November 29, 2012].
Fitri Wulandari (2012). Indonesia Coal Reserves Rise to 28 billion tons from 21 billion. Bloomberg Business Week, February 20, 2012. Available from: http://www.businessweek.com/news/2012-02-20/indonesia-coal-reserves-rise-to-28-billion-tons-from-21-billion.html[ Accessed on: January 03, 2013]
HRW (2012). PLN report shows hydro growth potential in Indonesia. Hydro Review Worldwide. Available from: http://www.hydroworld.com/articles/print/volume-20/issue-2/departments/hrw-briefings.html [Accessed on: January 04, 2013
IAEE (2005). Electricity Industry in Indonesia after Implementation of electricity Law No 20/2002. International Association for Energy Economics. Available from: http://www.bappenas.go.id/get-file-server/node/2782/
IESR (2012). Catalyzing Indonesian Civil Society Action to Deliver Sustainable Energy for All. Institute for Essential Services Reforms. Available from: http://www.iesr.or.id/english/2012/12/civil-society-workshop-catalyzing-indonesian-civil-society-action-to-deliver-sustainable-energy-for-all/ [Accessed on: January 04, 2013
Jeremy Wilcox (2012). Indonesia’s Energy Transit: Struggle to Realize Renewable Potential. Renewable Energy World, September 14, 2012. Available from: http://www.renewableenergyworld.com/rea/news/article/2012/09/indonesias-energy-transit?page=2 [Accessed on: January 04, 2013
Kementerian Energi Dan Sumber Daya Mineral (2008). Indonesia’s Renewable Energy Potential. Kementerian Energi dan Sumber Daya Mineral. Available from: http://www.esdm.go.id/news-archives/general/49-general/1963-indonesias-renewable-energy-potential.html. [Accessed on November 29, 2012].
MEMR (2012) via Jakarta Globe. Oil year Give Way to Era of Indonesian Natural Gas. Ministry of Energy and Mineral Resources. Available from: http://www.thejakartaglobe.com/business/oil-years-give-way-to-era-of-indonesian-natural-gas/501245 [Accessed on: January 03, 2013]
MEMR (2011). Energy and Economic Statistics of Indonesia. Ministry of Energy and Mineral Resource. Available From: http://www.esdm.go.id/publikasi/handbook-of-energy-a-economics-statistics-of-indon-handbook-of-energy-a-economics-statistics-of-indon-.html [Accessed On: November 29, 2011]
PI (2012). Indonesia and China Development Bank continue financial Corporation. Power Insider. Available from: http://www.pimagazine-asia.com/news/power-generation/indonesia-and-china-development-bank-continue-financial-co-operation/ [Accessed on: January 03, 2013]

GDPE0649ICR / Published FEB 2013 Page 40 Indonesia Power Market Outlook to 2030 –Market Trends, Regulations
and Competitive Landscape © GlobalData. This report is a licensed product and is not to be copied, reproduced, shared or resold in any form
PLN (2012a) via Indonesia Finance Today (2012). “PLN Exports 600 MW Electricity to Malaysia By End of 2016”. Indonesia Finance Today November29, 2012. Available from: http://en.indonesiafinancetoday.com/read/19847/PLN-Exports-600-MW-Electricity-to-Malaysia-By-End-of-2016. [Accessed on November 29, 2012].
PLN (2012b) via China Securities Journal. Indonesia needs to solve power shortage for sustainable development. Perusahaan Listrik Negara. Available from: http://www.cs.com.cn/english/opinion/201212/t20121207_3768330.html [Accessed on: January 03, 2013]
Senin (2012). Indonesia’s Oil Reserves Will Run Out in 12 years. Skala News, April 9, 2012. Available from: http://skalanews.com/news/detail/109047/5/komodo--nasibmu-nanti--.html [Accessed on: January 03, 2013]
Wayne Arnold (2012). Coal slide poses broader risks for Indonesia. Reuters, September 11, 2012. Available from: http://blogs.reuters.com/breakingviews/2012/09/11/coals-slide-poses-broader-risks-for-indonesia/[Accessed on January 03, 2013].
Wong & Jensen (2012). Indonesia eyes coal export curb, tax. Reuters, June 4, 2012. Available from: http://www.reuters.com/article/2012/06/04/coal-asia-indonesia-exports-idUSL3E8H41QS20120604 [Accessed on: January 03, 2013]
World Bank (2013). Doing Business–Economy Rankings. The World Bank. Available from: http://www.doingbusiness.org/rankings. [Accessed on January 03, 2013].
World Bank (2012). The Worldwide Governance Indicators 2012 Update. The World Bank Group. Available from: http://info.worldbank.org/governance/wgi/pdf/wgidataset.xlsx [Accessed on: January 03, 2013]
8.4 Coverage This report gives detailed information on Indonesia’s power market. It examines the country’s power market structure and provides historical and forecast numbers for generation, capacity and consumption up to 2030. The report provides insights on the market’s regulatory structure, import and export trends, competitive landscape and leading active and upcoming power projects. The report also provides a snapshot of the country’s power sector by analyzing the power sector of the country on broad parameters of –macroeconomics, supply security, generation infrastructure, transmission infrastructure, degree of competition, regulatory scenario and future potential.
8.5 GlobalData’s Methodology GlobalData’s dedicated research and analysis teams consist of experienced professionals with backgrounds in marketing, market research and consulting in the power industry, and advanced statistical expertise.
GlobalData adheres to the codes of practice of the Market Research Society (www.mrs.org.uk) and the Strategic and Competitive Intelligence Professionals (www.scip.org).
The following research methodology is followed for all country outlook reports.
Secondary research and analysis
The capacity, generation and consumption data is collected and validated using a number of secondary resources including but not limited to:
Government agencies, ministerial websites, industry associations, the World Bank, statistical databases
Company websites, annual reports, financial reports, broker reports and investor presentations
Industry trade journals, market reports and other literature
GlobalData’s proprietary databases such as the Capacity and Generation Database, Power Plant Database and Transmission and Distribution Database.
Further to this, the following secondary information is collected and analyzed to project the country’s power market scenario through to 2030, analyzing factors such as the following:

GDPE0649ICR / Published FEB 2013 Page 41 Indonesia Power Market Outlook to 2030 –Market Trends, Regulations
and Competitive Landscape © GlobalData. This report is a licensed product and is not to be copied, reproduced, shared or resold in any form
The country’s macroeconomic scenario
Government regulations, policies and targets
Government and private sector investments
Contract and deal announcements
Utility expansion plans
The sector’s historic track record
Other qualitative insights built through secondary research and analysis of company websites, annual reports, investor presentations, industry and trade journals, and data from industry associations.
Primary Research and Analysis
Secondary research is further complemented through primary interviews with industry participants to verify and fine-tune the market numbers obtained through secondary research and get first-hand information on industry trends.
The participants are drawn from a diverse set of backgrounds, including equipment manufacturers, industry associations, government bodies, utilities, distributors, and academia. The participants include, but are not limited to, C-level executives, industry consultants, academic experts, business development and sales managers, purchasing managers, plant managers, government officials, and industry spokespeople.
8.7 Disclaimer All Rights Reserved.
No part of this publication may be reproduced, stored in a retrieval system or transmitted in any form by any means, electronic, mechanical, photocopying, recording or otherwise, without the prior permission of the publisher, GlobalData.
This report is a licensed product and should not to be reproduced without prior permission.


