
Gas Competence SeminarMaputo, Mozambique – Septembre 2015
FUNDAMENTALREQUIREMENTSFOR MARKETDEVELOPMENT
Akmal M Zaghloul, MBABusiness Development Director

2
Energy Dimensions in Market Development
Engine for Economic Growth (High Correlation: Energy Consumption & GNP)
Facilitator of Social Progress
Key to Poverty Reduction
Employment Generation
Promotes Gender Equality
Vital Input in Production (All Sectors of Economy)
Increasingly Becoming a Need Rather than a Luxury
Key Element for Attracting Foreign Investment
Foreign Exchange Earner
2

3
Market development challenges
Energy Mix
Energy Pricing Crisis
Supply / Demand
Infrastructure
Legal, Governance & Regulatory framework
Social Impacts
4
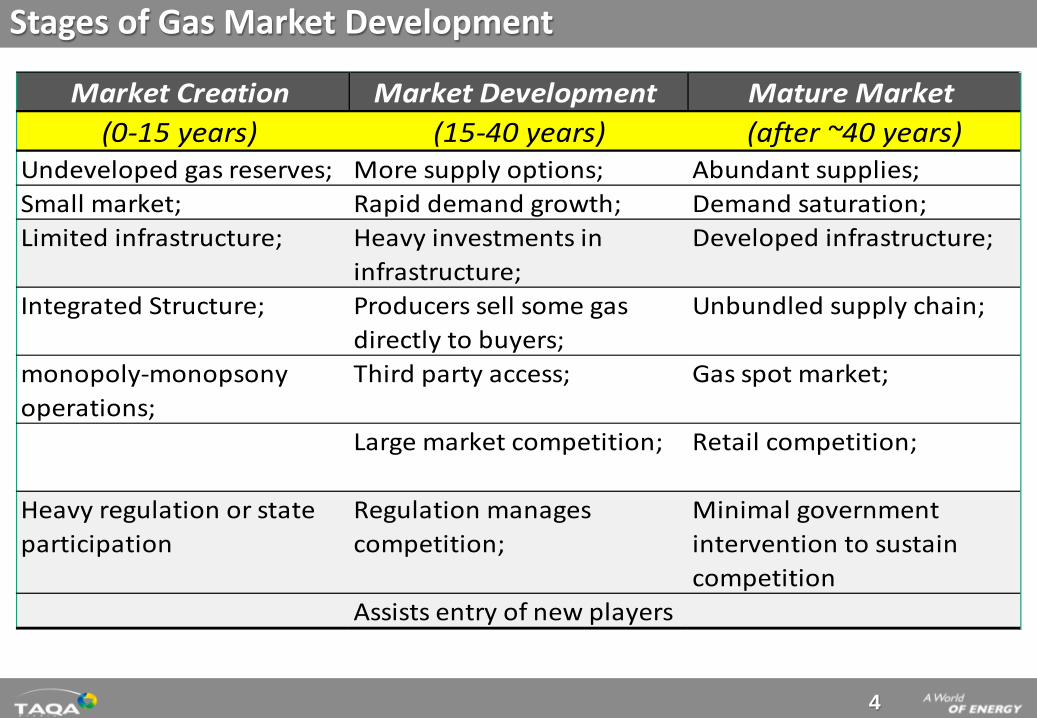
Stages of Gas Market Development
Market Creation Market Development Mature Market (0-15 years) (15-40 years) (after ~40 years)
Undeveloped gas reserves; More supply options; Abundant supplies;Small market; Rapid demand growth; Demand saturation;Limited infrastructure; Heavy investments in
infrastructure;Developed infrastructure;
Integrated Structure; Producers sell some gas directly to buyers;
Unbundled supply chain;
monopoly-monopsony operations;
Third party access; Gas spot market;
Large market competition; Retail competition;
Heavy regulation or state participation
Regulation manages competition;
Minimal government intervention to sustain competition
Assists entry of new players

5
Factors affecting level of development
Political differences
Different levels of economic development
Non-existance of own natural gas resources
Unavailability of foreign natural gas resourcescaused by their distance or a distance of supplygas pipelines
Availability of other own / imported energyresources

6
EGYPT CASE STUDY

7
Egypt’s Gas Industry Milestones
In 2014, Natural Gas share in Egypt total Energy Consumption: 52.5%
1st gasDiscovery
1967 1976 1981 1992 1996 2003 2012
1st
Industrialcustomer
1st
Residentialcustomer
1st CNG Vehicle
Private LDC
1st Gas Export
1st FSRUTender
2015
1st LNG import

8
New Exploration Concession Agreements
56 new upstream Exploration agreements signed$12 billion minimum commitment

9
Accelerate Existing Gas Development
Total Investment: $21.8 bn Total Production: 3,600 MMSCFD Total Condensate Production: 86.7 MBBL/D

10
Abu sir
West Abu Qir
North Idku
RavenScrab/safron
LNGDamietta
Arish &El masaid
Baltem
Port said
Hap’y
Theka
North Bardwell
Akhen
Naf
Roseta
El Sheikh Zowayed
East Port Said P.S & Ind. Area
East Gas
Flower
North SinaiHelm
Temsah
Talkha
Shabshir
Abu MadiAbu Qir
Abu Hommos South El Mansoura
Mahmudiya
Qara
Tanta
SouthBelquas
Abu sultan6 October
QusinaBanhaSadat
Suez
A’youn Moussa
Mostorud I-ATebbin
Koraymat
Ras BakrBeni Suef
Za’frana
October
Unit 103El Menia
Assuit
Unit 104
Unit 108
Zeit bay
Abu Rudis
Morgan
Ramadan
Esma 8
AgibaSea bird
Shoab Ali
Badri
Esma 2
Sinai Cement & industrial Area
Sedi Krier
Ameriya
King
El-Max
Intergene
BorgElarab
Ameriya Cement
12“- 14 Km
El obyed
Salam
South Aum Barkah
El Qasr
Tarek
Bed - 2
Abu Sannan
South Dab’aaMeleha Deep
Bed - 3Bed - 1 265 Km 24“-
Qena
LuxorAswan
Kima
Hurgada
Safaga
Cairo
Neag
A/GHKaroun
SouthEl-Tina
WestEl Tena
Jordan
DeniseTaurt
El GamilUGDC
South El Manzala
Shams
Saffaire
Simian/ sienna
Fayroz
Robi
Tarouse
Theth Med. South East Fields
Vegas fields
Desouk
A/RSuco
Belayim
Wastani
Fayoum
El Sokhna
• Existing . PL• Under cons. PL• Future. PL (5 Years)• Gas fields• Future Gas Fields• Facilities• Distribution Stations• Power stations• Industrial Areas• Consumer• Distribution Co.• Export
Ameriya
24“- 26 Km
18“- 12 Km
16“- 9 Km
24“- 26 Km
24“- 26 Km
32“- 160 Km
24“- 14 Km
30“- 26 Km
22“- 87 Km
24“- 25 Km
32“- 75 Km
24“- 215 Km
32“- 85 Km
28“- 86 Km
42“- 40 Km
30“- 28 Km
16“- 256 Km
16“- 192 Km
24“- 10 Km
22“- 40 Km
24“- 50 Km
36“- 196 Km
36“- 264 Km10 BCMY
20“- 660 Km
20“- 40 Km
12“- 40 Km
National Oil, Gas Grid & Facilities
Dahshour
Nubariya
North Port Said
Port Fouad
Sharm El Shikh
Suco
West Aswan
Ras Shukir
El Fayoum Offtake
Deshna
Quos
New Assuit
Upper Egypt P/L930 km, 1 Billon $
Total Length is 18000 Km with Capacity of 190 MM meter3/D In June 2012

11
Transmission Projects
Planned Projects: $355 million

12
Abu Madi
El Qara
Abu qir
Sedi Kreir
Ameriya 1
TarekEL-ObayiedSalamSouth Om Barka
Abu ElGhradikأ
Bed 2,3Ayoun Moussa
tebbin
suez
Zafrana
Ras bakr
Ras shoukier
المنیا
LTSLPGLTS & LPGNGLLNG
N. Abu Madi
Port said
Port fouadDamiatte
Production 2011/2012LPG : 1475 MTCond : 39.8 MMBBL Propane: 605 MT Ethane/ propane : 437 MT
Gas Treatment Facilities
Added Valuebillion $
Abu qirLPG& LTS
Design capacity:480 mmscf/d
sales Gas: 238 mmscf/dCond: 5530 bbl/d
Lpg: 220 Ton/d
SalamLTS
Design Capacity:400 mmscf/d
Sales Gas: 427 mmscf/dCond: 24000 bbl/d
TAREKLTS
Capacity: 100 mmscf/dsales gas: 111 mmscf/d
Cond: 12000 bbl/d
ObayiedLTS
Design capacity:420 mmscf/d
sales gas: 376 mmscf/dcond: 9500 bbl/d
Abu sanan / s. dabaaDesign capacity: 85 mmscf/d
Sales Gas: 38 mmscf/dCond: 980 bbl/d
Abu sanan
Bed 2,3LTS
Design capacity: 315 mmscf/dSales Gas: 275 mmscf/d
Cond: 5930 bbl/d
Abu ElghradigDesign capacity: 160 mmscf/d
Sales Gas: 72mmscf/d Cond: 1360 bbl/d
S.MansouraLTS
Design capacity:15 mmscf/d
Cond: 178 bbl/d
RosettaDesign capacity:
400 mmscf/d Sales Gas: 393mmscf/d
Cond: 340 bbl/d
BurullesFeed : 1328 mmscf/d
Cond: 6850 bbl/d
El GamilDesign capacity:1650 mmcsf/d
Sales Gas: 1368 mmscf/d Cond : 21685 bbl/d
WASCOSales Gas: 160 mmscf/d
Cond: 3920 bbl/dLPG: 190 Ton/d
W/ KHELALASales Gas:73 mmscf/d
Cond: 85 BBL/D
DahshourDesign capacity: 140 mmscf/d
Sales Gas: 0 mmscf/dLPG: 0 ton/d
Trans Gulf Design capacity : 130mmscf/d
Saled Gas : 1.8 mmscf/dCond : 1085 bbl/d LPG : 232 Ton/d
Ras ShoukierDesign capacity:
220 mmscf/dSales Gas: 24 mmscf/d
Cond: 555 bbl/d LPG: 185 Ton/d
Zeit BayDesign capacity : 90 mmscf/d
Sales Gas : 17 mmscf/dCond: 510 bbl/dLPG: 103 Ton/d
Abu RudiesDesign capacity: 50 mmscf/d
Sales Gas : 0.5 mmscf/dCond :1075 bbl/dLPG : 242 Ton/d
IdkuTrain1 : 580 mmscf/d Train2 : 580 mmscf/d
UGDCFeed : 1100mmscf/dPropane : 839 Ton/d
Lpg : 755Ton/ dCond : 3365 bbl/d
W/D Gas ComplexNGL Unit
Design capacity : 900 mmscfdEthane/ Propane : 1195 Ton/d
Propane : 815 Ton/d LPG : 1255 Ton/dCond : 2155 bbl/d
AmeriyaDesign capacity :
300 mmscf/dCond : 440 bbl/dLPG : 520 Ton/d
Hapy & TaurtDesign capacity:
600mm`scf/dSales Gas: 513 mmscf/d
Cond: 305bbl/d
N. SinaiDesign capacity:
180 mmscf/dSales Gas: 128 mmscf/d
Damiatte LNG Feed : 750 mmscf/d
LNG : 30 mscm/d
W.Dikrnis (Ph.1) S.Batra &Sales Gas : 14mmscfd
Cond :240 bbl/dLPG : 40 Ton/d
Abu Madi &N. Abu adiLTS
Design capacity : 360 mmscf/dLPG
Design capacity : 540 mmscf/d Sales Gas : 352 mmscf/d
Cond: 6600 bbl/d LPG : 290 Ton/d
S manzlaDesign capacity:
35 mmscf/dSales Gas: 18 mmscf/d

13
Expand & Upgrade Infrastructure
Projects in Refining: $9 bn

14
Develop the Petrochemicals Industry
Projects in Petrochemicals: $9.7 bn

15
Ensuring power generation security

16
Demand & Consumption Evolution

17
Gas Usages
Gas GridLocal Distribution
Gas Delivery
Fertilizers
Industry
CNG
Domestic
Power
Gas Value Chain in Egypt
18
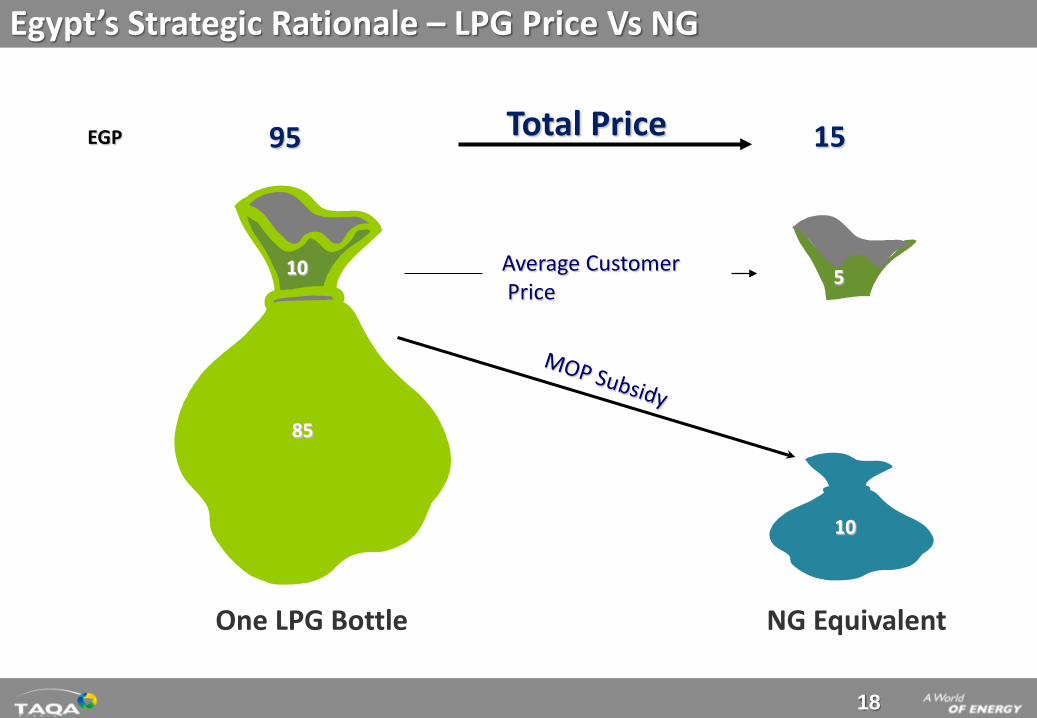
85
10
5
One LPG Bottle NG Equivalent
95 15Total Price
Average CustomerPrice
EGP
10
Egypt’s Strategic Rationale – LPG Price Vs NG

19
Gas to end users
• FactoriesMedium Heavy
- Chemical - Steel- Paint - Cement- Textile - Fertilizer- Food
Fuels substitution & conversionWater heating Space heating
Cooking Steam Generation
Furnaces Manufacturing Process Heat
Refrigeration Gas-fired Air-conditioning
Natural gas will replace:
• Diesel for water and central heating
• LPG for heating and cooking
• Fuel oil and diesel for industrial applications
• Gasoline in cars
Residential
Commercial
Industrial
• Apartments• Houses• Villas
• Hospitals• Schools and Universities• Offices• Restaurants• Bakeries etc.

20
GASCO
Power Stations HouseholdsIndustrial
FactoriesCommercial
Establishments
EGAS20-25Y Concession Agreement to :Finance, design, execute, operate& maintain Gas Networks
Manage, operate andmaintain the EgyptianNational Gas Grid
Transportation Vehicles
Gas Supply Contract
Agreement for :Gas Delivery & Metering
Gas Midstream & Downstream Market Structure
Gov. guarantees 18%IRR for LDCs (+ O&Mcosts +5Y tax exemption)
Local DistributionCompanies
EPCs

21
Gas Distribution – Deregulation Development
The Main National Grid / Trunk line is constructed & Operated by GASCO (on behalf of EGAS)Everything down stream of the Pressure Reduction Station is within the cost of the LDC connection rate. Payments made “per converted customer”

22
OverseasGas Maya Gas
Gas Contractor
LDC
Gas Distribution – Market Players

23
From ONE state monopoly …
… to 14 private sectors & 5 state-owned LDCs/EPCs
Development of the Egyptian Gas Distribution Sector
Off Take
P.R.SRegulator
Regulator
Typical Downstream Gas Network
Ongoing Distribution ActivitiesApprox. 3.5 Million customers connected
Over 1 bn $ of Foreign & Local investment
16 Egyptian Governorates covered by Gas networks
600 MM $ /Year Saved in subsidies
Enhanced HSE Standards
Introducing new technologies
Attracting the Multi-Nationals
Social Investment – Jobs/Employment - Environmental
Provide a better quality of life for Egypt’s citizens

24
Market based Incentives: CNG Smart Card
24
Mechanism
Financing 100% of cost of conversion throughcommercial lending on a debit card to bepresented at fueling stations by convertedvehicles’ drivers
Increase
No. of Vehicles Converted
25
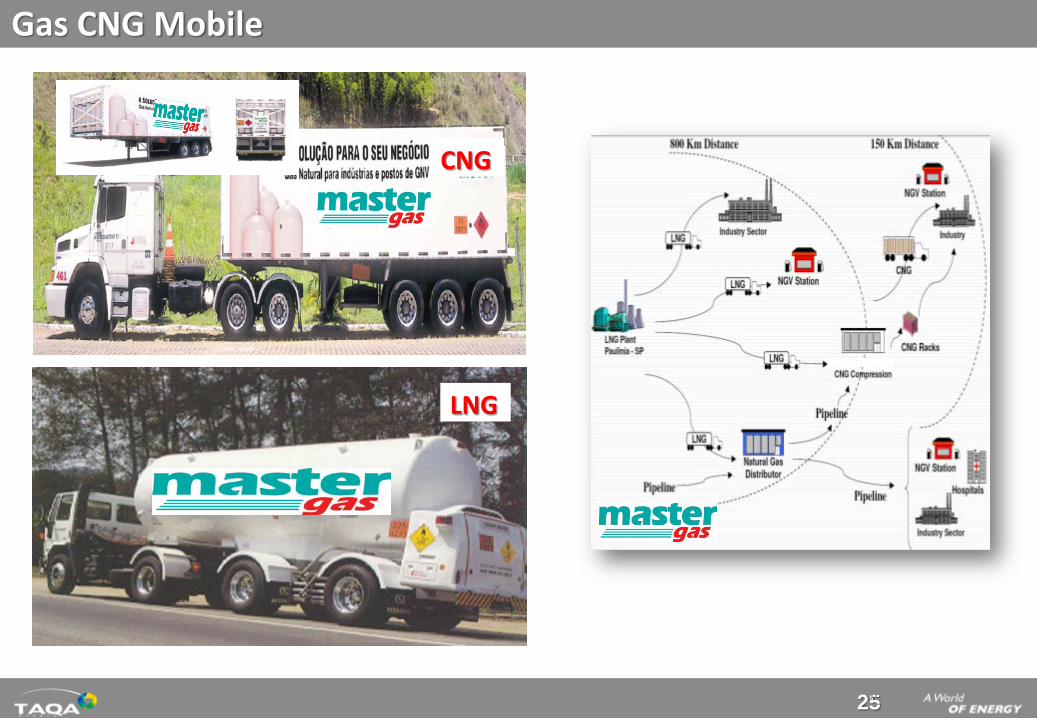
CNG
LNG
25
Gas CNG Mobile

26
Scope:• Using absorption chillers / heater units• BOO District cooling projects• 250 000 Ton
Clients Benefits:• Saving of 30-40% of operating cost
compared to electricity driven chillers• Less building Capex & Opex• Less Power • Less maintenance & staffing• Economical operating costs• No chillers noise & vibration• Space saving in the buildings
District cooling consists of 3 main parts:
Plant
Gas District Cooling

27
Synthetic Natural Gas (LPG+Air) Distribution Network
R
R
R
R
SNG StationLPG Tank
SNG =
LPG + Air
27

28
SNG Ready to use

29

30

31
EGYPT ENERGY STRATEGY
Winning hearts and changing mindsets ...

32
Egypt’s Strategic Investment/Development Rationale
Government Solutions Creating Market Opportunities
Egypt’s Economic Growth Vs. Energy Challenges
• Large increase in energy demand to 13 % annually• Economy growing at 7.2% before 2008 Global crisis• Energy subsidy increased from 30 B EGP in 2004 to 100 B in 2014-2015 budget.• National plan to convert additional 4 million customers to natural gas, to the existing 3
million• Government need to increase Power Generation capacity from 25 GW to 75 GW by 2030
• Egypt’s government is taking bold steps to liberalize the energy sector gradual phasingout of subsidies which is currently a burden on the budget, gradual market deregulation
• Implement and activate strong regulatory bodies• Encourage strong involvement of private sector investment and foreign direct investment
• Driven by rapidly rising domestic energy consumption on the back of population anddemographic dynamics, rising per capita income levels and a heightened level ofindustrialization, urbanization, real estate and tourism related investments, Egypt's primaryenergy demand continues to outpace energy supply infrastructure;
• From 2002 to 2012, oil products and natural gas consumption levels increased by 37%while electricity consumption increased by 30%. According to the Government's guidance,the former is expected to increase by 30-35% by 2015 and the latter is forecasted toincrease by 37-40% over the same period after incorporating the dragging effect of thecurrent economic slowdown.
Growing Energy Demand

33
Egypt Energy Challenges & Policy Options
33
Pricing Reform: Tariffs Subsidies
Institutional Restructure: Integrated Energy Regulator Market Liberalization (unbundling)
Legislation Modifications: New Electricity Law Hydrocarbon / Petroleum Law
Assessment & Prioritization of Energy DemandSecurity & Affordability of Energy Supply LNG import New & Renewable Energy Development
Energy Infrastructure DevelopmentAttraction of FDI in most of the Egyptian Energy Value ChainHuman Capacity Building & Best Practices Development
34
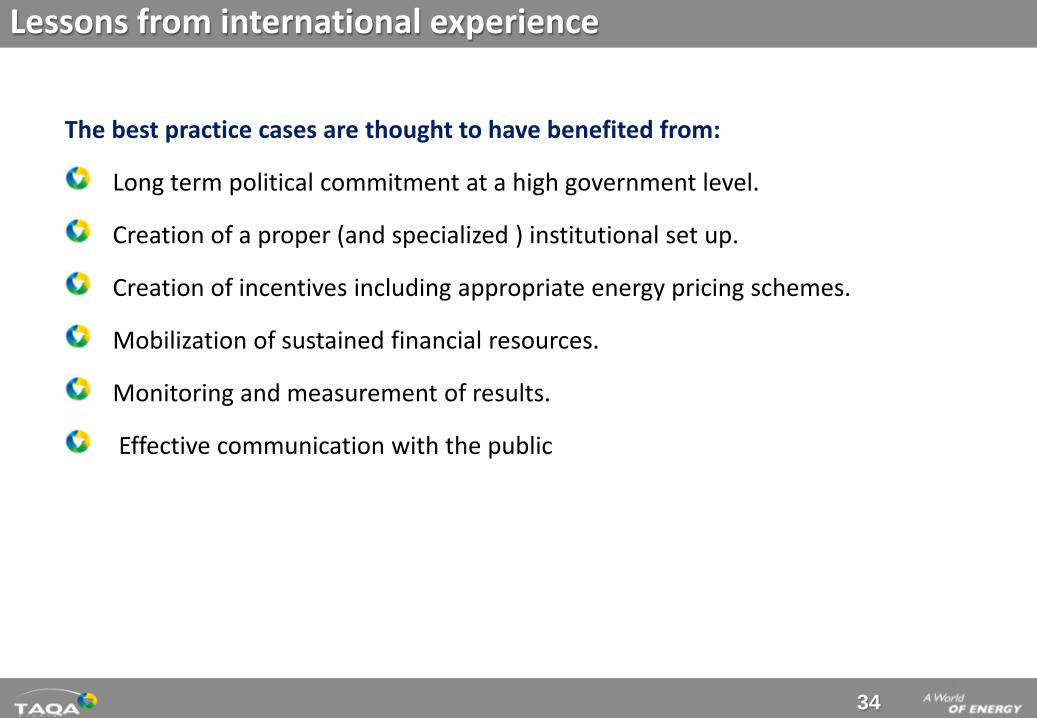
Lessons from international experience
34
The best practice cases are thought to have benefited from:
Long term political commitment at a high government level.
Creation of a proper (and specialized ) institutional set up.
Creation of incentives including appropriate energy pricing schemes.
Mobilization of sustained financial resources.
Monitoring and measurement of results.
Effective communication with the public


