
GAP- Global Alzheimer’s Platform Foundation Webinar
Aducanumab Data Review
Samantha Budd Haeberlein, PhD
Senior Vice President, Head Neurodegeneration Development Unit Biogen
February 23, 2021

Forward-Looking Statements▪ This presentation contains forward-looking statements, including statements made pursuant to the safe harbor provisions of the Private
Securities Litigation Reform Act of 1995, relating to results from the Phase 3 clinical studies of aducanumab; the potential clinical effects of
aducanumab; the potential benefits, safety, and efficacy of aducanumab; potential regulatory discussions, submissions, and approvals and
the timing thereof; clinical development programs, clinical trials, data readouts, and presentations related to aducanumab; the treatment of
Alzheimer’s disease; the potential of Biogen’s pipeline programs, including aducanumab; and risks and uncertainties associated with drug
development and commercialization. These forward-looking statements may be accompanied by such words as “aim,” “anticipate,”
“believe,” “could,” “estimate,” “expect,” “forecast,” “intend,” “may,” “plan,” “potential,” “possible,” “will,” “would,” and other words and terms of
similar meaning. Drug development and commercialization involve a high degree of risk, and only a small number of research and
development programs result in commercialization of a product. Results in early-stage clinical trials may not be indicative of full results or
results from later-stage or larger-scale clinical trials and do not ensure regulatory approval. You should not place undue reliance on these
statements or the scientific data presented.
▪ These statements involve risks and uncertainties that could cause actual results to differ materially from those reflected in such statements,
including actual timing and content of submissions to and decisions made by the regulatory authorities regarding aducanumab; regulatory
submissions may take longer or be more difficult to complete than expected; regulatory authorities may require additional inf ormation or
further studies, or may fail or refuse to approve or may delay approval of Biogen’s drug candidates, including aducanumab; the occurrence
of adverse safety events and/or unexpected concerns that may arise from additional data or analysis; risks of unexpected costs or delays;
the risks of other unexpected hurdles; uncertainty of success in the development and potential commercialization of aducanumab; failure to
protect and enforce Biogen’s data, intellectual property, and other proprietary rights and uncertainties relating to intellec tual property claims
and challenges; risks relating to the potential launch of aducanumab, including preparedness of healthcare providers to treat patients, the
ability to obtain and maintain adequate reimbursement for aducanumab, and other unexpected difficulties or hurdles; product l iability
claims; third-party collaboration risks; and the other risks and uncertainties that are described in the Risk Factors section of Biogen’s most
recent annual or quarterly report and in other reports Biogen has filed with the U.S. Securities and Exchange Commission. These
statements are based on Biogen’s current beliefs and expectations and speak only as of the date of this presentation. Biogen does not
undertake any obligation to publicly update any forward-looking statements, whether as a result of new information, future developments or
otherwise.

Statement on Aducanumab
Aducanumab is an investigational drug that is currently under regulatory review. It is
not approved for use in any country at this time.

Thank You to Everyone Who Has Contributed to Alzheimer’s Disease Research!
Aducanumab Phase 3 trials
included 3285 patients at 348
sites in 20 countries
Countries with active sites included:
Australia, Austria, Belgium, Canada, Denmark, Finland, France,
Germany, Italy, Japan, the Netherlands, Poland, Portugal, South
Korea, Spain, Sweden, Switzerland, Taiwan, United Kingdom,
United States
Biogen Position on the FDA Advisory Committee
Biogen stands behind the analyses and results of aducanumab:
▪ The core joint briefing book (FDA & Biogen) is the first ever in the neurology division
▪ The totality of data provides substantial evidence of clinical effectiveness of
aducanumab, as demonstrated by study 302 (EMERGE) and supported by study
103 (PRIME)
▪ Biogen and the FDA concluded that partially discordant results of study 301
(ENGAGE) do not meaningfully detract from the persuasiveness of study 302
▪ We have applied the highest scientific rigor and integrity in the analyses submitted
▪ We recognize the complexity of the dataset and the challenges associated with the first
positive Ph3 study in Alzheimer
Alzheimer’s Disease Presents a Significant Unmet Medical Need
• As of 2018, there were about 50 million people living with dementia
worldwidea
• Progressive neurological disorder resulting in memory loss,
behavioral symptoms, and loss of ability to perform daily activities
• In advanced stages of dementia patients become completely
dependent
• Alzheimer’s disease is ultimately fatal
• No available treatment that alters the course of disease
a 2018 Alzheimer’s Disease International .

Amyloid β Plaque
Fibrils
Monomers
Microglia
2) Aggregation of Aβ
Oligomers
The Two Pathological Hallmarks of Alzheimer’s Disease in the Brain Are Aβ Plaques and Neurofibrillary Tangles
Aβ=amyloid beta; APP=amyloid precursor protein.
Based on Pospich S, Raunser S. Science. 2017;358(6359):45-46.
1) Amyloid beta peptides are
released extraneuronally as
monomersAPP
Processing
Dysfunctional
Microglia
Dying Neuron
4) Synaptic dysfunction,
inflammation and neuronal death
Microtubule
Tau protein
Aggregated
p-Tau
3) Intraneuronal tau
phosphorylation and aggregation
Tau Fibrils and
Tangles

Aducanumab
Aducanumab Treatment:
Reduced Progression of
Alzheimer’s Disease
Healthy Neuron
Amyloid Plaque
Reduction
Aducanumab: Targeting Alzheimer’s Disease Pathology
Amyloid β
Aggregation
Oligomer
Amyloid β Plaque
Fibrils
Microglia
Monomers
No treatment
Dysfunctional
Microglia
Dysfunctional and
Dying Neurons

Aducanumab Is Differentiated From the First Generation of Anti-Aβ Antibodies
• Aducanumab was the first of this generation of antibodies to demonstrate proof of
concept before initiating phase 3 trials
• Aducanumab is the only program at this time to have read out with positive
results in phase 3 trials*
Molecular Characteristics of
Aducanumab
• Specificity for neurotoxic aggregated forms of Aβ
• Effector-function enabling immune cell-mediated
clearance of aggregated Aβ
Key Clinical Trial Design Elements
• Inclusion of patients with biomarker-confirmed
early symptomatic Alzheimer’s disease
• Demonstration of robust reduction in pathology
• Appropriate clinical outcome measures
*Primary and secondary endpoints were met in Study 302. In Study 301, patients with the opportunity for full 10mg/kg dosing had
results similar to Study 302.

Study
102
Aducanumab Clinical Development Program
2011 2012 2013 2014 2015 2016 2017 2018 2019 2020 2021 2022 2023
H1 H2 H1 H2 H1 H2 H1 H2 H1 H2 H1 H2 H1 H2 H1 H2 H1 H2 H1 H2 H1 H2 H1 H2 H1 H2
Study 101, n=53
Japanese phase 1
Study 103, n=197
Study 103 Long-term extension (LTE)
Safety study, n=52
Study 301, n=1653
Study 302, n=1643
Study 304, n=max 2400
Bioavailability, n=28
Ph
as
e 3
/3b
Ph
as
e 1
b/2
Ph
as
e 1
Study 302 Long-term extension (LTE)
Study 104, n=21
Single ascending dose
Study
205
Study 301 Long-term extension (LTE)
Proof-of-Concept

Phase 1b Study 103

Aducanumab Was the First Program Where Proof-of-Concept Was Demonstrated Prior to Phase 3
Baseline One year
Placebo
3 mg/kg
6 mg/kg
10 mg/kg
Change in CDR-SB
*p<0.05, compared with placebo (nominal)
Image reprinted with permission from Springer Nature: Nature. The antibody aducanumab reduces Aβ
plaques in Alzheimer’s disease. Sevigny J, Chiao P, Bussière T, et al. Copyright 2016.
0.0
0.5
1.0
1.5
2.0
2.5
Ad
jus
ted
me
an
ch
an
ge
fro
m
ba
se
lin
e a
t W
ee
k 5
4 (
SE
)
Placebo 1 mg/kg 3 mg/kg 6 mg/kg Titration 10 mg/kg
**

Phase 3 Studies

Aducanumab Phase 3 Trial DesignStudies 301 and 302
Studies Two 18-month, randomized, double-blind,
placebo-controlled, Phase 3 studies
Countries with active sites included:
Australia, Austria, Belgium, Canada, Denmark, Finland, France,
Germany, Italy, Japan, the Netherlands, Poland, Portugal, South
Korea, Spain, Sweden, Switzerland, Taiwan, United Kingdom,
United States
Other
endpoints
• Secondary: MMSE, ADAS-Cog 13,
ADCS-ADL-MCI
• Sub-studies: amyloid PET, tau PET, CSF
disease-related biomarkers
Geography/
Sample size
3285 patients at 348 sites in 20 countries
Population • Early Alzheimer’s disease (MCI due to
Alzheimer’s disease + mild Alzheimer’s
disease dementia)
‒ MMSE 24-30, CDR-G 0.5, RBANS
≤ 85, with confirmed amyloid pathology
Doses • Two dosing regimens (low and high) and
placebo; randomized 1:1:1
Primary
endpoint
• CDR-SB at 18 months

Phase 3 Target Dose: 10 mg/kg With 6-Month Titration Studies 301 and 302
0 4 8 12 16 20 24 28 32 36 40 44 48 52 56 60 64 68 72 76 80
Dose mg/kg
24-week titration to reduce
incidence of ARIA14 doses of 10 mg/kg
as in Study 103
Week
1 1 3 3 6 6 10 10 10 10 10 10 10 10 10 10 10 10 10 10 10
10 mg/kg
3 mg/kg
1 mg/kg
6 mg/kg

Dose RegimenStudies 301 and 302
ApoE=apolipoprotein E; PV4=Protocol Version 4.
Median cumulative dose
at Week 78
0 4 8 12 16 20 24 28 32 36 40 44 48 52 56 60 64 68 72 76 80
3 mg/kg
1 mg/kg
3 mg/kg
6 mg/kg
1 mg/kg
ApoE ε4+
Low dose
3 mg/kg
6 mg/kg
10 mg/kg
1 mg/kg
ApoE ε4+
and ApoE ε4−
High dose
ApoE ε4−
Low dose
Expected # of 10 mg/kg in high-dose group by Week 26:
1 dose
by Week 50:
7 doses
by Week 78:
14 doses
98 mg/kg
56 mg/kg
Early enrolled patients in the high-dose arm received a lower dose
116 mg/kg (pre-PV4)
153 mg/kg (post-PV4)

Phase 3 Studies Were Prematurely Terminated Following What Was Later Determined To be An Inaccurate Futility Prediction
• Conditional power: probability that primary efficacy endpoint analysis would
be statistically significant at final analysis
• Two key assumptions did not hold, and futility analysis did not
accurately predict the future results
o Assumption 1: Identically designed studies would lead to similar study results.
Therefore, pooled conditional power is appropriate
o Assumption 2: Treatment effect will remain consistent over time
• At the time of futility analysis, Study 302 was trending positive, whereas
Study 301 was not

Clinical Endpoints Measure Distinct, Important Symptoms of Cognition, Function, and Behavior
Overlap of scales is only 5% to 25%Five clinical rating scales were used in
Studies 301 and 302
• Validated and widely used in early
Alzheimer’s disease
• Covers the full scope of symptoms
experienced by patients with Alzheimer’s
disease
• Include a range of paradigms:
• Expert clinical judgements based on patient
examination and caregiver input
• Patient and caregiver reports
• Cognitive performance tests
• Together they cover a range of important
and distinct dimensions with minimal overlap
ADAS-
Cog 13 MMSE
ADCS-ADL
-MCI
CDR
NPI

-15%
-22%
-45
-40
-35
-30
-25
-20
-15
-10
-5
0
5
Percent Difference From Placebo
% D
iffe
ren
ce
vs
pla
ce
bo
Low dose
n=543
High dose
n=547
-0.39
(-0.694, -0.086)
p=0.0120
-0.26
(-0.569, 0.041)
p=0.0901
Low-dose aducanumab
High-dose aducanumab
%
Difference from placebo
(95% CI)
p value
Study 302: High Dose Aducanumab Met Primary Objective of CDR-SB at Week 78
n=numbers of randomized and dosed participants included in the analysis

Study 302: All Items Measured in Primary Endpoint (CDR-SB) Were Improved by High-Dose Aducanumab
0.2
0.25
0.28
0.29
0.31
0.34
0 0.05 0.1 0.15 0.2 0.25 0.3 0.35
Personal care
Memory
Judgment and problem solving
Home and hobbies
Community affairs
Orientation
Adjusted mean change from baseline at week 78
Placebo High-dose aducanumab
Treatment difference (%)
-0.08 (–24%)
-0.07 (–23%)
-0.07 (–24%)
-0.07 (–25%)
-0.07 (–28%)
-0.03 (–15%)0.17
0.17
0.21
0.23
0.24
0.26
Worsening

Study 302: High-dose Aducanumab Met All Clinical Endpoints Assessing Cognition and Function at Week 78
-15%
-22%
-45
-40
-35
-30
-25
-20
-15
-10
-5
0
5
CDR-SB
% D
iffe
ren
ce
vs
pla
ce
bo
Primary Endpoint Secondary Endpoints
3%
-14%-16%
-18%
-27%
-40%
MMSE ADAS-Cog13 ADCS-ADL-MCI
Low-dose
n=543
High-dose
n=547
Low-dose
n=543
High-dose
n=547
Low-dose
n=543
High-dose
n=547
Low-dose
n=543
High-dose
n=547
0.6
(0.00, 1.13)
p=0.0493
-1.4
(-2.46, -0.34)
p=0.0097
1.7
(-0.75, 2.74)
p=0.0006
-0.1
(-0.65, 0.48)
p=0.7578
-0.7
(-1.76, 0.36)
p=0.1962
0.7
(-0.27, 1.73)
p=0.1515
Low-dose aducanumab High-dose aducanumab
%
Difference from placebo (95% CI)
p value
-0.26
(-0.569, 0.041)
p=0.0901 -0.39
(-0.694, -0.086)
p=0.0120
n=numbers of randomized and dosed participants included in the analysis
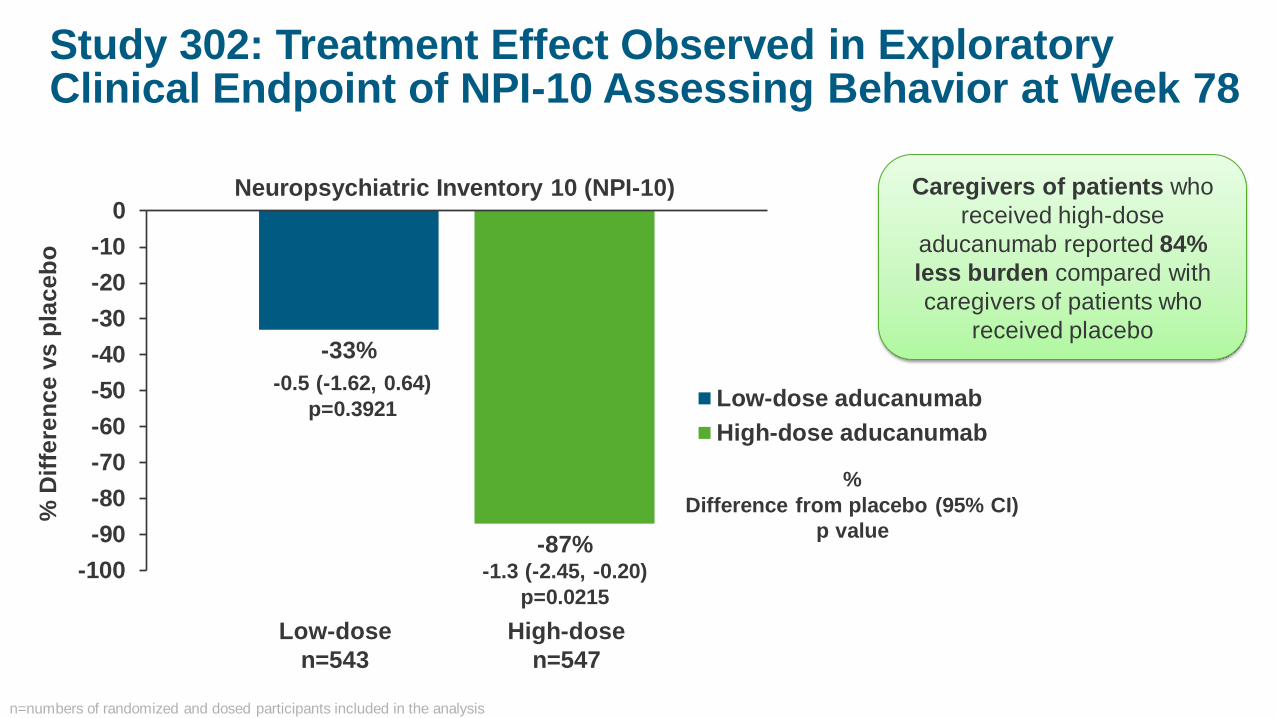
Study 302: Treatment Effect Observed in Exploratory Clinical Endpoint of NPI-10 Assessing Behavior at Week 78
-33%
-87%-100
-90
-80
-70
-60
-50
-40
-30
-20
-10
0
1
% D
iffe
ren
ce
vs
pla
ce
bo
Low-dose aducanumab
High-dose aducanumab
-0.5 (-1.62, 0.64)
p=0.3921
-1.3 (-2.45, -0.20)
p=0.0215
Low-dose
n=543
High-dose
n=547
%
Difference from placebo (95% CI)
p value
Caregivers of patients who
received high-dose
aducanumab reported 84%
less burden compared with
caregivers of patients who
received placebo
n=numbers of randomized and dosed participants included in the analysis
Neuropsychiatric Inventory 10 (NPI-10)

Study 302: Amyloid PET Shows Aducanumab Dose-Dependent Reduction in b-Amyloid Pathology
-0.179
-0.278
-0.35
-0.30
-0.25
-0.20
-0.15
-0.10
-0.05
0.00
0.05
0 26 52 78
Ad
juste
d m
ean
ch
an
ge
fro
m b
aselin
e (
±S
E)
Analysis visit, week
Placebo
Low-dose aducanumab
High-dose aducanumab
***
***
***
***
Diff. from
placebo,
Week 78
*** p<0.001 (nominal)
Placebo 159 129 93
Low-dose aducanumab 159 129 100
High-dose aducanumab 170 138 109

Study 302: Aducanumab Reduced Biomarkers of Alzheimer’s Disease-specific Tau Pathophysiology and Neurodegeneration
*p<0.05, ** p<0.01 , *** p<0.001 (nominal)n=numbers of randomized and dosed participants included in the analysis
-30
-25
-20
-15
-10
-5
0
Placebon=28
Low dosen=33
High dosen=17
Ad
juste
d m
ean
ch
an
ge f
rom
b
aselin
e (
SE
)
-160
-140
-120
-100
-80
-60
-40
-20
0
Placebon=28
Low dosen=33
High dosen=17
Ad
juste
d m
ean
ch
an
ge f
rom
b
aselin
e (
SE
)
CSF p-Tau CSF t-Tau
Tau pathophysiology Neurodegeneration
***
*** **

-0.1
-0.08
-0.06
-0.04
-0.02
0
0.02
0.04
0.06
0.08
0.1
0.12
Placebon=12
Low-dosen=14
High-dosen=11
Ad
juste
d m
ean
ch
an
ge
fro
m b
aselin
e (
SE
)
Medial temporal composite Frontal compositeTemporal composite
****
* p<0.05, *** p<0.001 (nominal).
Aducanumab Reduced Biomarkers of Tau Neurofibrillary Tangles in the BrainPooled Data, Studies 301 and 302
-0.1
-0.08
-0.06
-0.04
-0.02
0
0.02
0.04
0.06
0.08
0.1
0.12
Placebon=12
Low-dosen=14
High-dosen=11
Ad
juste
d m
ean
ch
an
ge
fro
m b
aselin
e (
SE
)*
-0.1
-0.08
-0.06
-0.04
-0.02
0
0.02
0.04
0.06
0.08
0.1
0.12
Placebon=12
Low-dosen=14
High-dosen=11
Ad
juste
d m
ean
ch
an
ge
fro
m b
aselin
e (
SE
)
*
n=numbers of randomized and dosed participants included in the analysis

Study 302: Aducanumab-related Biomarker Changes Are Associated With Slowing in Clinical Decline
Tau
(CSF p-Tau)
Aducanumab
0.52 * 0.20
(CDR-SB)
-0.39 *
(MMSE)
0.11
(ADAS-Cog13)
-0.44 *
(ADCS-ADL-MCI)
0.19 *
(CDR-SB)
-0.24 *
(MMSE)
0.20 *
(ADAS-Cog13)
-0.29 *
(ADCS-ADL-MCI)
All associations are partial Spearman correlation of change from baseline to Week 78 between each variable
β-amyloid
(Composite
SUVR)
Clinical
outcomes
* p<0.05 (nominal)

Results of Study 301 Were Partially Discordant
-12%
-6%
-11%
-18%
2% 3%
-11%
-18%
-45
-40
-35
-30
-25
-20
-15
-10
-5
0
5
CDR-SB MMSE ADAS-Cog-13 ADCS-ADL-MCI
% D
iffe
ren
ce
vs
pla
ce
bo
Low-dose aducanumab
High-dose aducanumab
Primary Endpoint Secondary Endpoints
Low-dose
n=547
High-dose
n=555
-0.18
(-0.469, 0.110)
p=0.2250
0.03
(-0.262, 0.326)
p=0.8330
%
Difference from placebo
(95% CI)
p value
-0.1
(-0.62, 0.49)
p=0.8106
-0.588
(-1.6067,
0.4309)
p=0.25780.7
(-0.25, 1.61)
p=0.1506
0.2
(-0.35, 0.74)
p=0.4795 -0.583
(-1.5835,
0.4181)
p=0.25360.7
(-0.19, 1.64)
p=0.1225
Low-dose
n=547
High-dose
n=555
Low-dose
n=547
High-dose
n=555
Low-dose
n=547
High-dose
n=555
n=numbers of randomized and dosed participants included in the analysis

Biomarker Response in High Dose Aducanumab is Lower in Study 301 than in Study 302
-0.170
-0.235
-0.35
-0.30
-0.25
-0.20
-0.15
-0.10
-0.05
0.00
0.05
0 26 52 78
Ad
jus
ted
me
an
ch
an
ge
fr
om
ba
se
lin
e (
±S
E)
Analysis visit, week
Placebo
Low-dose aducanumab
High-dose aducanumab
***
***
***
***
Amyloid PET
Patients, n
Placebo 204 168 124
Low-dose 198 169 138
High-dose 183 156 112
-30
-25
-20
-15
-10
-5
0
Placebon=15
Low-dosen=20
High-dosen=18
Ad
jus
ted
me
an
ch
an
ge
fro
m b
as
eli
ne
, p
g/m
L (
SE
)
p=0.2726p=0.3019
CSF p-Tau
• Treatment effect 16.5% smaller
• Cumulative dose 10.4% smaller
• Treatment effect 51.2% smaller
• Cumulative dose 20.3% smaller
*** p<0.001 (nominal)

Study 301 High-Dose Group Diverged From an Otherwise Consistent Association Between Aβ Reduction and Slowing of Clinical DeclineStudies 301, 302, and 103
Greater extent of amyloid removal
302
high
302
low
301
low
301
high
103
3 mg/kg
103
6 mg/kg103
titration
(avg. 5.3 mg/kg)103
10 mg/kg
103
1 mg/kg
0.5
0.0
-0.5
-1.0
CD
R-S
B a
dju
ste
d m
ea
n d
iffe
ren
ce
fro
m p
lac
eb
o
-0.25 -0.20 -0.15 -0.10
Bubble size represents sample size at baseline
Amyloid PET composite SUVR adjusted mean difference from placebo
-0.05
Fav
ors
tre
atm
en
t F
av
ors
pla
ceb
o

Results in Study 301 and 302 Were Partially Discordant
Supports
efficacy of
aducanumab
301 high dose
discordant with
the set
Low dose
β-amyloid
PET
Low dose
CSF Tau
Low dose
clinical
Exposure
response
relationship
302
High dose

Summary of Efficacy and Biomarker Results Studies 301, 302, and 103
Study 301 Study 302 Study 103
Diff vs Placebo (%)Low dose
N=547
High dose
N=545
Low dose
N=543
High dose
N=547
10 mg/kg
N=32
CDR-SB -0.18 (-12%) 0.03 (2%) -0.26 (-15%) -0.39 (-22%) -1.26 (-67%)
MMSE0.2 (-6%)
-0.1 (3%) -0.1 (3%) 0.6 (-18%) 1.9 (-76%)
ADAS-Cog13 -0.583 (-11%) -0.588 (-11%) -0.70 (-14%) -1.40 (-27%)
ADCS-ADL-MCI 0.7 (-18%) 0.7 (-18%) 0.7 (-16%) 1.7 (-40%)
Amyloid-PET*
SUVR (centiloid)
-0.167
(-38.476)
-0.232
(-53.472)
-0.179
(-41.250)
-0.278
(-64.182)
-0.277
(-61.363)
N=numbers of randomized and dosed participants(*) Number of participants in 301 PET substudy = 585 and 302 substudy = 488
Dark green = p<0.05
favoring aducanumab
Light green = numeric
advantage favoring
aducanumab

Differences in Study 301 Are Sufficiently Understood so as Not to Detract From Study 302
• Demographics, disease characteristics, frequency, severity
and management of ARIA were all similar between studies
• Underlying pharmacology of aducanumab is similar in Studies 301 and 302
• Differences between studies were largely driven by:
‒ Lower exposure to 10 mg/kg dosing in Study 301
‒ Imbalance in number and distribution of rapid progressing Alzheimer’s
disease patients
In Study 301, patients randomized to groups with the opportunity for full
10mg/kg dosing had results similar to Study 302

Patients Who Had the Opportunity for 14 Doses of 10 mg/kg Had Similar Benefit in Both Studies
-2.5 -2 -1.5 -1 -0.5 0 0.5 1
Week 78
Favors aducanumab
Weighted mean (N=161, n=137)
Post-PV4, ApoE+ (N=58, n=48)
N: number at baseline. n: number at Week 78.
Weighted mean (N=180, n=160)
Post-PV4, ApoE+ (N=65, n=56)
Pre-PV4, ApoE- (N=84, n=75)
Post-PV4, ApoE- (N=31, n=29)
Study 301
Study 302
Median
cum dose
(mg/kg)
150.0
150.0
160.0
150.0
160.0
160.0
Mean
cum dose
(mg/kg)
122.9
123.4
145.9
124.7
131.4
134.3
Pre-PV4, ApoE- (N=78, n=66)
Post-PV4, ApoE- (N=25, n=23)
% diff
vs pbo
-29%
-3%
-46%
-25%
-15%
-34%
-23%
-23%
CDR-SB Adjusted Mean Change vs Placebo
(95% CI for difference)Patients who have had the opportunity to complete week 78 visit by 20 March 2019.

Safety

Amyloid-Related Imaging Abnormalities (ARIA)
ARIA refers to radiographic abnormalities observed with anti-Aβ
antibodies
• ARIA-Edema (ARIA-E): vasogenic edema or sulcal effusion
• ARIA-Hemorrhage (ARIA-H): brain microhemorrhages or localized
superficial siderosis
• May result from increased cerebrovascular permeability as a consequence
of antibody binding to deposited amyloid-beta
Greenberg SM, et al. Nature Rev Neurol. 2020;16(1):30-42.

Most Common Adverse Events with AducanumabStudies 301 and 302 Placebo-Controlled Period
Patients, n (%)
Placebo
N=1087
Aducanumab
10 mg/kg
N=1033
Adverse events 945 (86.9) 946 (91.6)
ARIA-E 29 (2.7) 362 (35.0)
Headache 165 (15.2) 212 (20.5)
ARIA-H Brain microhemorrhage 71 (6.5) 197 (19.1)
Fall 128 (11.8) 155 (15.0)
ARIA-H Superficial siderosis 24 (2.2) 151 (14.6)
Diarrhea 74 (6.8) 92 (8.9)
• Serious hypersensitivity reactions to aducanumab had an incidence of <0.1%
• Compared to placebo, aducanumab treatment was not associated with abnormalities in
vital signs, clinical labs, or ECGs

Clinical and MRI Characteristics of ARIA-EStudies 301 and 302 Placebo-Controlled Period
• The most common symptoms were headache, confusion, dizziness, and nausea
• Most symptoms were mild (68%) or moderate (28%) in clinical severity
• MRI findings of ARIA-E were typically mild (30%) or moderate (58%) in severity and transient
(98% resolved)
Patients, n (%)
Placebo
N=1076
Aducanumab
10 mg/kg
N=1029
Patients with ARIA-E 29 362
Asymptomatic 26 (89.7) 268 (74.0)
Symptomatic 3 (10.3) 94 (26.0)
Each participant counted once, at maximum symptomatic status and severity.

Exploratory Endpoint
87% relative reduction in
decline the Neuropsychiatric
Inventory-10 (NPI-10)
NPI-10
Cognition & Function
Functional Independence
Neuropsychiatric
Primary Endpoint
22% relative reduction in
decline from baseline in the
Clinical Dementia Rating Scale
Sum of Boxes (CDR-SB)
CDR-SB
Secondary Endpoint
40% relative reduction in decline
in AD Cooperative Study-Activities
of Daily Living Inventory Mild
Cognitive Impairment Version
(ADCS-ADL-MCI)
ADCS-ADL-MCIHigh dose outcomes at week 78
versus placebo
Secondary Endpoints (Cognition)
MMSE: 18% relative reduction
ADAS Cog: 27% relative reduction
Study 302: Aducanumab Impacts Multiple Clinically Meaningful Dimensions of Alzheimer’s Disease

Establishing the Safety and Efficacy of Aducanumab
Study 302 A positive study with robust and internally consistent
results
Study 103 An independent, second study providing supportive
evidence
Study 301 A failed study with reasons for difference between studies
in results understood and post hoc subgroups supportive
of Study 302 and 103
Consistent exposure to 10 mg/kg aducanumab is effective at reducing
the clinical decline in patients with early symptomatic Alzheimer’s
disease and has a favorable benefit/risk profile

Conclusion • Aducanumab targets underlying pathology of disease and is the first investigational drug to show a
reduction in clinical decline in patients with Alzheimer’s disease
• Based on prespecified analyses, Study 302 is a robustly positive study, while Study 301 is a failed
study
• Differences between Study 301 and 302 were largely driven by:
▪ Lower exposure to 10 mg/kg dosing in Study 301
▪ Imbalance in number and distribution of rapid progressing Alzheimer’s disease patients
• In Study 301, patients with the opportunity for full 10mg/kg dosing had results similar to Study 302
• A small earlier clinical trial, Study 103, demonstrated a treatment effect on clinical and biomarker
endpoints
• Consistent exposure to 10 mg/kg aducanumab is effective at reducing the clinical decline in patients
with early symptomatic Alzheimer’s disease and has a favorable benefit/risk profile


