GAMIFICATION IN
HIGHER EDUCATION Factors Influencing the Usage Intensity
of a Gamified E-learning Application
MASTER THESIS
Jarmo J. Vleeshouwer
s1384392
University of Twente
Faculty of Behavioural Sciences
Department of Communication Sciences
Date: 23 November 2015
Supervisors:
Dr. A.J.A.M. van Deursen
Dr. S.M. Hegner
Gamification in Higher Education J.J. Vleeshouwer
Page 2
ABSTRACT
By applying typical game design elements to non-game settings, gamification aims to
improve the user experience in terms of fun and engagement. Derived from a growing interest
for this phenomenon in the educational area, this study aims to investigate the influence of
Performance Expectancy, Effort Expectancy, Social Influence, Facilitating Conditions, and
Perceived Enjoyment on the Usage Intensity of a gamified e-learning application. In an attempt
to do so, an application called InStaQuest was designed using gamification principles and then
implemented into a university statistics course for a duration of eight weeks. Data was gathered
by means of an online survey as well as through the application itself. Results from a multiple
linear regression analysis indicate that the aforementioned constructs together were not capable
of explaining the Usage Intensity construct. Effort Expectancy, representing the ease of using
the application, did show a significant association with Usage Intensity. This study then seeks
to find an explanation for these results, followed by several recommendations for future studies.
Keywords: gamification, UTAUT, technology adoption, e-learning, Performance
Expectancy, Effort Expectancy, Social Influence, Facilitating Conditions, Perceived
Enjoyment, Usage Intensity.
Gamification in Higher Education J.J. Vleeshouwer
Page 3
INTRODUCTION
During the past few years, games have started to enter the real world. No longer
restricted to computers and consoles, games are now motivating people to exercise, work and
even study. The social running game Nike Plus, for example, tries to motivate runners by
employing game mechanics such as leaderboards, achievements and challenges. Health Month,
a social game that helps users to improve their health habits, uses points, badges, and a virtual
‘Spin the Wheel’ to make diets and fitness more fun. What these examples have in common is
that they only use certain elements from video games. This phenomenon is called gamification,
and is most commonly defined as the use of game design elements in non-game contexts
(Deterding, Dixon, Khaled & Nacke, 2011). By stripping the addictive and engaging game
elements from video games and applying them to less engaging activities, gamification aims to
improve the user experience in terms of fun and engagement.
Various researchers and practitioners have now begun to examine the opportunities of
gamification in the educational environment. After all, it often remains challenging to fully
motivate and engage students in educational systems (Lee & Hammer, 2011). It is believed
that gamification can help to increase the student’s motivation in learning by integrating the
engaging strength of video games into study learning tasks and assignments (Nah, Telaprolu,
Rallapalli & Venkata, 2013). This thought is not that strange once you consider that many
students play video games during their leisure time, be it either on their smartphones, game
consoles or desktop computers. Modern students grow up with computers and video games, yet
these kinds of technology are rarely found in classrooms. As stated by Erenli (2013), “young
learners of today gain skills and a method to learn using games in their everyday life but have
to use other methods to be successful in school or at university” (p. 1).
The use of video games in classrooms might not sound as something new, as serious
games have been around for many years. Serious games, however, differ from gamification in
Gamification in Higher Education J.J. Vleeshouwer
Page 4
terms of scale and purpose. Serious games are full-fledged computer games with serious
intentions, usually employing a large amount of resources in terms of game design knowledge
and graphics. Gamified applications on the other hand, only use certain playful elements from
these games, thus requiring less resources (Deterding et al., 2011; Groh, 2012). Still, one might
argue that gamification is already being practiced in schools. Here, the grades that students
receive for their tests are the rewards, and being promoted to a higher class can be seen as the
next level. Yet most students would not describe their school activities as playful experiences,
most likely because these dynamics differ greatly from the ones that can be found in video
games. Nowadays, video game players willingly invest countless of hours into scenarios where
they become gradually skilful throughout tailored objectives, often situated in social
environments that stimulate cooperation and competition with other players. If students were
to approach their learning objectives in a similar fashion, it is easy to imagine why some
researchers and practitioners are eager to apply gaming principles to schools and universities.
Given the previously mentioned premises of educational gamification, it is not
surprising to see that the interest for this phenomenon is increasing. This is also reflected in the
academic context, where the number of articles published on gamification is growing (Hamari,
Koivisto & Sarsa, 2014). Still, there is a lot unknown regarding the effective utilization of
gamification in education. This is mostly because there are only a handful of studies that have
actually designed and tested a gamified e-learning application (e.g., Goehle, 2013; Domínguez
et al., 2013). For instance, it is yet unknown which factors influence the individual adoption
process of potential users. Once we gain insight into these factors, future gamification
practitioners can use this knowledge to establish focus points within their design processes.
Therefore, this study will contribute to current literature by answering the following research
question:
RQ: Which factors explain the individual adoption of gamification in higher education?
Gamification in Higher Education J.J. Vleeshouwer
Page 5
Because the amount of research regarding the adoption of gamification in education has
been limited, this study will also take on an exploratory approach. This implies that knowledge
is not only gained through quantitative analyses, but also through qualitative results and
experiences that are gained throughout the whole project. This information will then be used to
guide future gamification adoption studies in determining suitable research methods and
designs. In an attempt to answer the research question of this study, we will first discuss the
concept of gamification, followed by a review of technology adoption literature. Knowledge
from both subjects will then be used to compose a conceptual model that aims to explain
adoption behaviours of target users. Following, the method section provides an outline of the
research design, as well as a description of the gamified e-learning application that was created
specifically for this study. Finally, the results of this study will be presented, followed by a
discussion that provides recommendations for future studies.
Gamification in Higher Education J.J. Vleeshouwer
Page 6
Theoretical background
Our research question brings forth two concepts that require a theoretical analysis. First,
we will discuss the concept of gamification. More specifically, we will discuss the elements
and principles of gamification, and how these fit within the context of education. Subsequently,
previous literature regarding information technology adoption will be discussed. As a gamified
e-learning application can be considered an information technology, this research area should
provide us with factors that are likely to influence the adoption decisions of target users. Finally,
we will use this knowledge to compose a conceptual model that aims to explain the adoption of
a gamified e-learning application.
Principles of Gamification
Gamification is the use of game design elements in non-game contexts (Deterding et al.,
2011). Although the use of the term gamification can be traced back to 2008 (Terrill, 2008), its
widespread adoption started during the second half of 2010 (Deterding et al., 2011). Since then,
the amount of research regarding this phenomenon has grown slowly but steadily. Remarkably,
there are very few studies that have conducted an empirical experiment with a gamified e-
learning application, especially in higher education (Domínguez et al., 2013). Moreover, there
seems to be no research focusing on the adoption of gamification in educational settings.
Therefore, with the absence of relevant previous research, we will first try to acquire a general
understanding of what gamification has to offer in educational environments, and how these
benefits can be achieved.
According to Lee and Hammer (2011), there are three areas in which gamification can
motivate students to engage more with their study tasks. The first area is the cognitive area,
where games provide players with an objective and a set of rules. In order to complete the
objective, players need to experiment within the boundaries of those rules. Characteristic to
Gamification in Higher Education J.J. Vleeshouwer
Page 7
video games, the ultimate objective is divided into smaller tasks or levels, so called cycles of
expertise. These cycles of expertise allow players to practice and fail, until they eventually gain
the skill to complete the task at hand. Here, failure can be seen as learning something new,
rather than making a mistake. In addition, video game players are not only rewarded for
completing end goals - they receive rewards for intermediate objectives as well. This can be
quite different when compared to traditional learning processes, where students often know the
vague long-term objective (i.e., obtaining sufficient knowledge to pass the exam), but they are
unsure on how to get there. Thus, in the cognitive area, gamification is able to provide students
with clear and reasonable tasks, while providing immediate feedback and rewards throughout
the whole learning process.
The second area in which gamification can motivate students is the emotional area.
Games can evoke a range of emotional experiences, such as curiosity, joy, and pride (Lee &
Hammer, 2011). As mentioned earlier, players experience repeated failure as well. This
negative emotion is possible because games provide fast feedback cycles without risking too
much. According to the Flow Theory (Nakamura & Csikszentmihalyi, 2013), the key here is to
correctly balance the difficulty of the task between anxiety and boredom, which then keeps the
player highly motivated with the task at hand (Domínguez et al., 2013). A good example is the
famous mobile game Angry Birds, which challenges players to shoot birds at a target. Here, a
failure means learning something new: aiming the bird high didn’t really work out, so perhaps
it might be better to aim a bit lower. It doesn’t matter how long it takes the player to complete
it, because eventually, he or she has gathered the skills to do so. When compared to a study test,
the opposite holds true: there are only a few opportunities which are often accompanied with
high risks. This can even result in students feeling too much fear of failure, causing performance
anxiety during tests that are of great importance for the continuation of their study.
Gamification in Higher Education J.J. Vleeshouwer
Page 8
The third and last area in which gamification is able to motivate students is the social
area. Gamification offers the possibility for multiple players to interact, compete and work with
each other through various forms of online multiplayer mechanisms. For instance, students can
interact through digital message boards, compete by making comparisons in leaderboards and
collaborate by forming teams with their fellow classmates. These kinds of interactions allow
students to take on in-game identities that are different from their offline identity. To illustrate:
shy students who might otherwise excel at certain topics, often prefer to stay in the background.
With gamification, these students might now stand out, gaining recognition not only from the
teacher but also from their fellow classmates. To summarise, the premises of gamification can
be found in cognitive, emotional and social areas. It offers new ways of structuring study
materials, while also positively influencing the social positions and emotional experiences of
the students (Lee & Hammer, 2011).
Now that we have acquired a general understanding of what gamification can contribute
to the educational experience of the student, we can begin to look at the more concrete
characteristics of gamification. The definition of gamification speaks of game design elements
in non-game contexts. But what exactly are game design elements? Deterding et al. (2011)
describe game design elements as elements that are characteristic to games, implying that such
elements are significant to gameplay and can be found in- and associated with most video
games. In their book Gamification by Design, Zichermann and Cunningham (2011) describe
five commonly used game elements: points, levels, leaderboards, badges, and challenges.
Points - A central element in games are the points that players can achieve. Points can
be used for several purposes, however they are most commonly used to guide players in their
progress. Similar to the grades that are to be found in schools, points can be used to tell players
how well they have performed on an objective. Furthermore, points can also be used as a
currency, for instance to redeem rewards or unlock new content within the game.
Gamification in Higher Education J.J. Vleeshouwer
Page 9
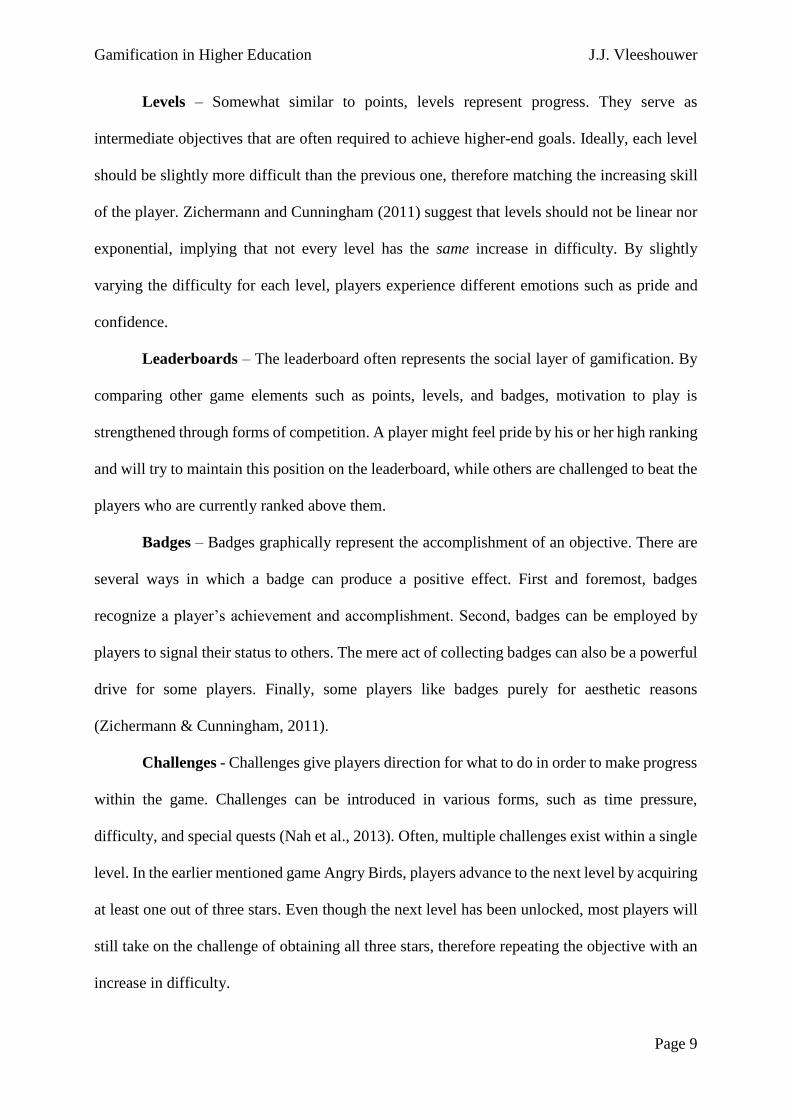
Levels – Somewhat similar to points, levels represent progress. They serve as
intermediate objectives that are often required to achieve higher-end goals. Ideally, each level
should be slightly more difficult than the previous one, therefore matching the increasing skill
of the player. Zichermann and Cunningham (2011) suggest that levels should not be linear nor
exponential, implying that not every level has the same increase in difficulty. By slightly
varying the difficulty for each level, players experience different emotions such as pride and
confidence.
Leaderboards – The leaderboard often represents the social layer of gamification. By
comparing other game elements such as points, levels, and badges, motivation to play is
strengthened through forms of competition. A player might feel pride by his or her high ranking
and will try to maintain this position on the leaderboard, while others are challenged to beat the
players who are currently ranked above them.
Badges – Badges graphically represent the accomplishment of an objective. There are
several ways in which a badge can produce a positive effect. First and foremost, badges
recognize a player’s achievement and accomplishment. Second, badges can be employed by
players to signal their status to others. The mere act of collecting badges can also be a powerful
drive for some players. Finally, some players like badges purely for aesthetic reasons
(Zichermann & Cunningham, 2011).
Challenges - Challenges give players direction for what to do in order to make progress
within the game. Challenges can be introduced in various forms, such as time pressure,
difficulty, and special quests (Nah et al., 2013). Often, multiple challenges exist within a single
level. In the earlier mentioned game Angry Birds, players advance to the next level by acquiring
at least one out of three stars. Even though the next level has been unlocked, most players will
still take on the challenge of obtaining all three stars, therefore repeating the objective with an
increase in difficulty.
Gamification in Higher Education J.J. Vleeshouwer
Page 10
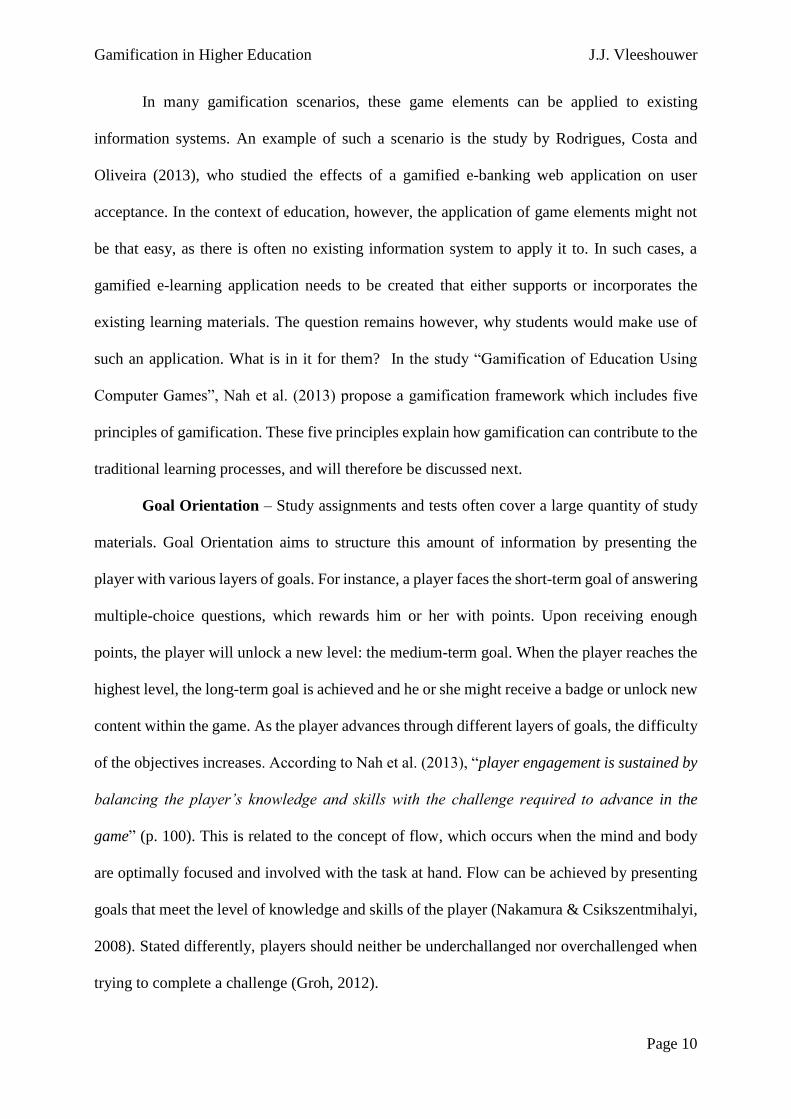
In many gamification scenarios, these game elements can be applied to existing
information systems. An example of such a scenario is the study by Rodrigues, Costa and
Oliveira (2013), who studied the effects of a gamified e-banking web application on user
acceptance. In the context of education, however, the application of game elements might not
be that easy, as there is often no existing information system to apply it to. In such cases, a
gamified e-learning application needs to be created that either supports or incorporates the
existing learning materials. The question remains however, why students would make use of
such an application. What is in it for them? In the study “Gamification of Education Using
Computer Games”, Nah et al. (2013) propose a gamification framework which includes five
principles of gamification. These five principles explain how gamification can contribute to the
traditional learning processes, and will therefore be discussed next.
Goal Orientation – Study assignments and tests often cover a large quantity of study
materials. Goal Orientation aims to structure this amount of information by presenting the
player with various layers of goals. For instance, a player faces the short-term goal of answering
multiple-choice questions, which rewards him or her with points. Upon receiving enough
points, the player will unlock a new level: the medium-term goal. When the player reaches the
highest level, the long-term goal is achieved and he or she might receive a badge or unlock new
content within the game. As the player advances through different layers of goals, the difficulty
of the objectives increases. According to Nah et al. (2013), “player engagement is sustained by
balancing the player’s knowledge and skills with the challenge required to advance in the
game” (p. 100). This is related to the concept of flow, which occurs when the mind and body
are optimally focused and involved with the task at hand. Flow can be achieved by presenting
goals that meet the level of knowledge and skills of the player (Nakamura & Csikszentmihalyi,
2008). Stated differently, players should neither be underchallanged nor overchallenged when
trying to complete a challenge (Groh, 2012).
Gamification in Higher Education J.J. Vleeshouwer
Page 11
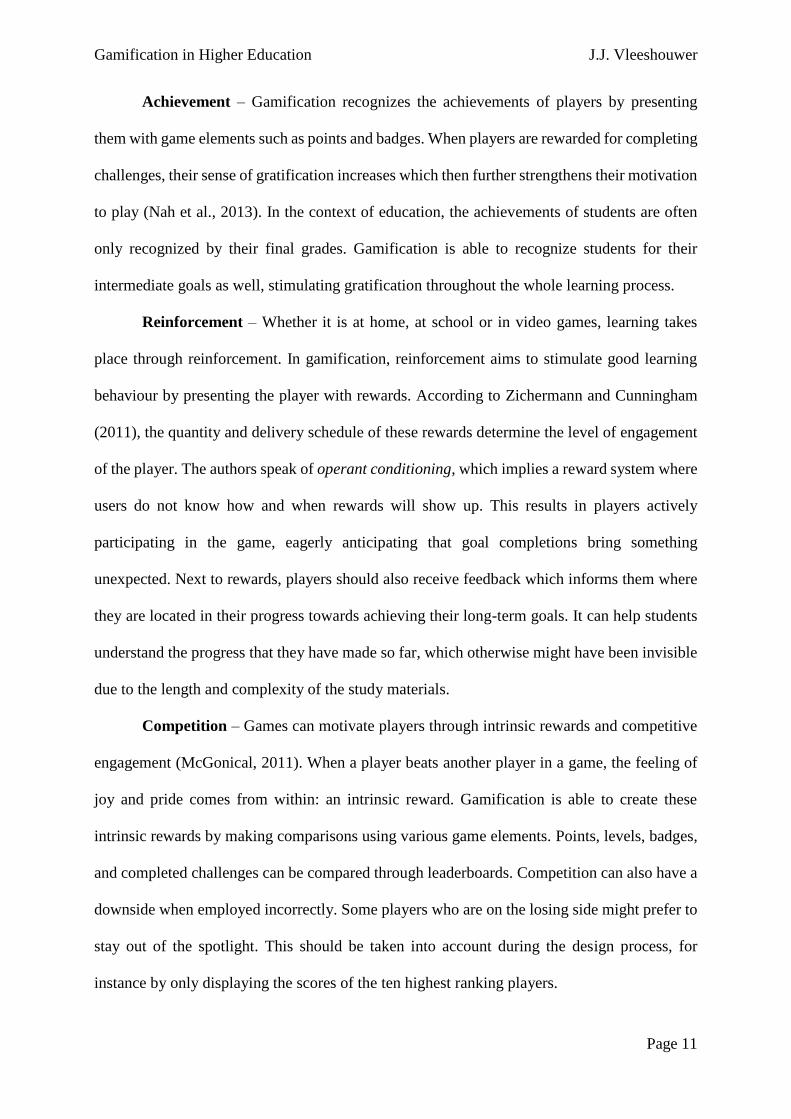
Achievement – Gamification recognizes the achievements of players by presenting
them with game elements such as points and badges. When players are rewarded for completing
challenges, their sense of gratification increases which then further strengthens their motivation
to play (Nah et al., 2013). In the context of education, the achievements of students are often
only recognized by their final grades. Gamification is able to recognize students for their
intermediate goals as well, stimulating gratification throughout the whole learning process.
Reinforcement – Whether it is at home, at school or in video games, learning takes
place through reinforcement. In gamification, reinforcement aims to stimulate good learning
behaviour by presenting the player with rewards. According to Zichermann and Cunningham
(2011), the quantity and delivery schedule of these rewards determine the level of engagement
of the player. The authors speak of operant conditioning, which implies a reward system where
users do not know how and when rewards will show up. This results in players actively
participating in the game, eagerly anticipating that goal completions bring something
unexpected. Next to rewards, players should also receive feedback which informs them where
they are located in their progress towards achieving their long-term goals. It can help students
understand the progress that they have made so far, which otherwise might have been invisible
due to the length and complexity of the study materials.
Competition – Games can motivate players through intrinsic rewards and competitive
engagement (McGonical, 2011). When a player beats another player in a game, the feeling of
joy and pride comes from within: an intrinsic reward. Gamification is able to create these
intrinsic rewards by making comparisons using various game elements. Points, levels, badges,
and completed challenges can be compared through leaderboards. Competition can also have a
downside when employed incorrectly. Some players who are on the losing side might prefer to
stay out of the spotlight. This should be taken into account during the design process, for
instance by only displaying the scores of the ten highest ranking players.
Gamification in Higher Education J.J. Vleeshouwer
Page 12
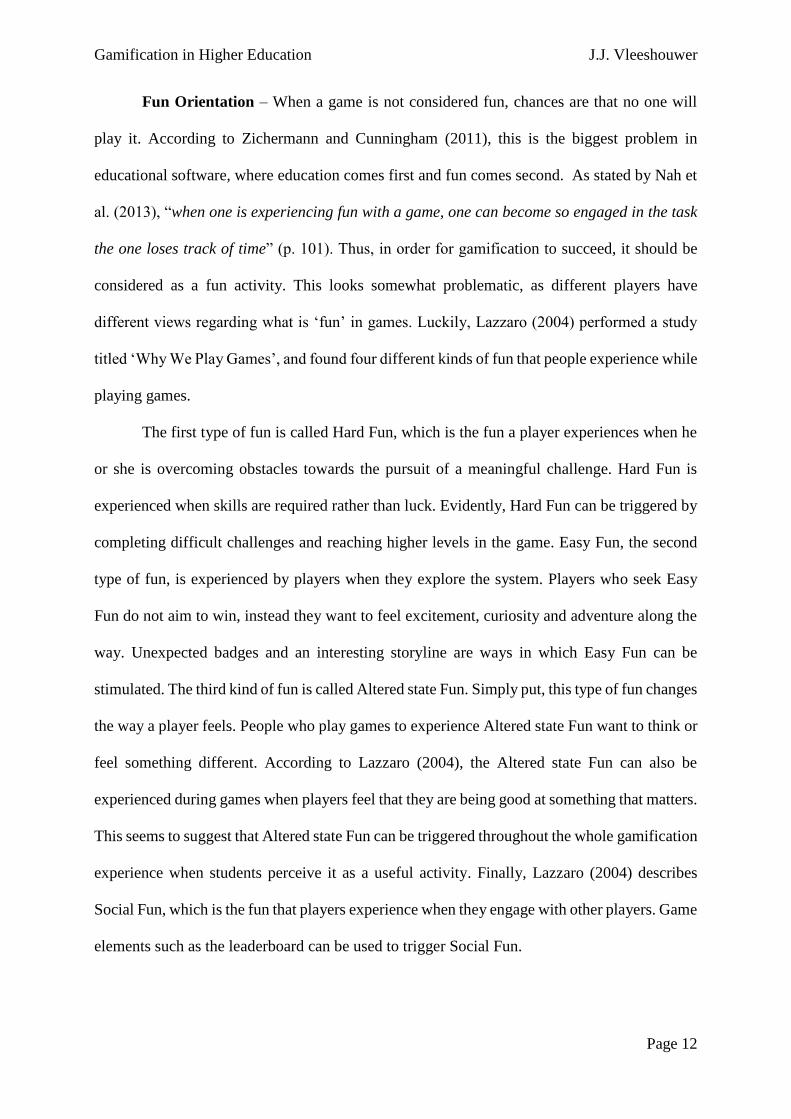
Fun Orientation – When a game is not considered fun, chances are that no one will
play it. According to Zichermann and Cunningham (2011), this is the biggest problem in
educational software, where education comes first and fun comes second. As stated by Nah et
al. (2013), “when one is experiencing fun with a game, one can become so engaged in the task
the one loses track of time” (p. 101). Thus, in order for gamification to succeed, it should be
considered as a fun activity. This looks somewhat problematic, as different players have
different views regarding what is ‘fun’ in games. Luckily, Lazzaro (2004) performed a study
titled ‘Why We Play Games’, and found four different kinds of fun that people experience while
playing games.
The first type of fun is called Hard Fun, which is the fun a player experiences when he
or she is overcoming obstacles towards the pursuit of a meaningful challenge. Hard Fun is
experienced when skills are required rather than luck. Evidently, Hard Fun can be triggered by
completing difficult challenges and reaching higher levels in the game. Easy Fun, the second
type of fun, is experienced by players when they explore the system. Players who seek Easy
Fun do not aim to win, instead they want to feel excitement, curiosity and adventure along the
way. Unexpected badges and an interesting storyline are ways in which Easy Fun can be
stimulated. The third kind of fun is called Altered state Fun. Simply put, this type of fun changes
the way a player feels. People who play games to experience Altered state Fun want to think or
feel something different. According to Lazzaro (2004), the Altered state Fun can also be
experienced during games when players feel that they are being good at something that matters.
This seems to suggest that Altered state Fun can be triggered throughout the whole gamification
experience when students perceive it as a useful activity. Finally, Lazzaro (2004) describes
Social Fun, which is the fun that players experience when they engage with other players. Game
elements such as the leaderboard can be used to trigger Social Fun.
Gamification in Higher Education J.J. Vleeshouwer
Page 13
Adoption of Information Systems
This study aims to explain why students will or will not adopt gamified e-learning
applications. In the previous section, we discussed the principles of gamification and how these
can contribute to the educational environment. In this section, we will review the information
technology adoption literature, which aims to explain why individuals choose to (not) adopt
information technologies. Relevant factors derived from these studies will then be used to
compose a conceptual model.
Many research models that can be found in today’s information technology adoption
literature include variables that are derived from Rogers’s (1962) attributes of innovations. In
his work, Rogers identified five characteristics of innovations that explain the rate at which
innovations are adopted by members of a social system. These five characteristics are defined
as follows:
Relative advantage: the extent to which an innovation is perceived as being better than
its precursor;
Compatibility: the degree to which an innovation is perceived as being consistent with
the existing values, needs and past experiences of potential users;
Complexity: the degree to which an innovation is perceived as difficult to understand
and complex to use;
Trialability: the degree to which an innovation may be experimented with before
adoption;
Observability: the degree to which the use and effects of an innovation are observable
to others.

Gamification in Higher Education J.J. Vleeshouwer
Page 14
Moore and Benbasat (1991) argued that the above definitions are based upon
perceptions and are not taking the actual use of the innovation into consideration. Therefore,
they advised to recast the definitions in terms of usage. The definition of Complexity, for
example, resulted in the degree to which using an innovation is difficult to understand and
complex to use. As a result, all characteristics were redefined in terms of using the innovation,
and labelled as the Perceived Characteristics of Innovating (PCI). Based upon other research,
Moore and Benbasat (1991) also added two other variables to the PCI:
Image: the degree to which the use of an innovation is perceived to enhance one’s image
or status;
Voluntariness: the degree to which the use of the innovation is perceived as being
voluntary.
In 1986, Davis aimed to explain the intention of users to adopt a new technology by
focusing on their attitude towards it. This resulted in the Technology Acceptance Model and
has since been used in many information technology adoption studies. Adapted from Azjen and
Fishbein’s Theory of Reasoned Action (1975), the Technology Acceptance Model focusses on
two key variables, called Perceived Usefulness and Perceived Ease of Use, which are
considered to be similar to Rogers’s (1962) attributes Relative Advantage and Complexity
respectively. The Technology Acceptance Model (see Figure 1) theorizes that these two
variables determine the attitude of an individual towards a technology, which in turn influences
their behavioural intention to use it. Perceived Ease of Use is also expected to influence
Perceived Usefulness, as Davis hypothesized that a technology that is easy to use becomes more
useful as well. Studies that have empirically tested the Technology Acceptance Model found
that Perceived Usefulness is often to be a more important determinant than Perceived Ease of
Use (Bouwman, van den Hooff, van de Wijngaert & van Dijk, 2002).
Gamification in Higher Education J.J. Vleeshouwer
Page 15
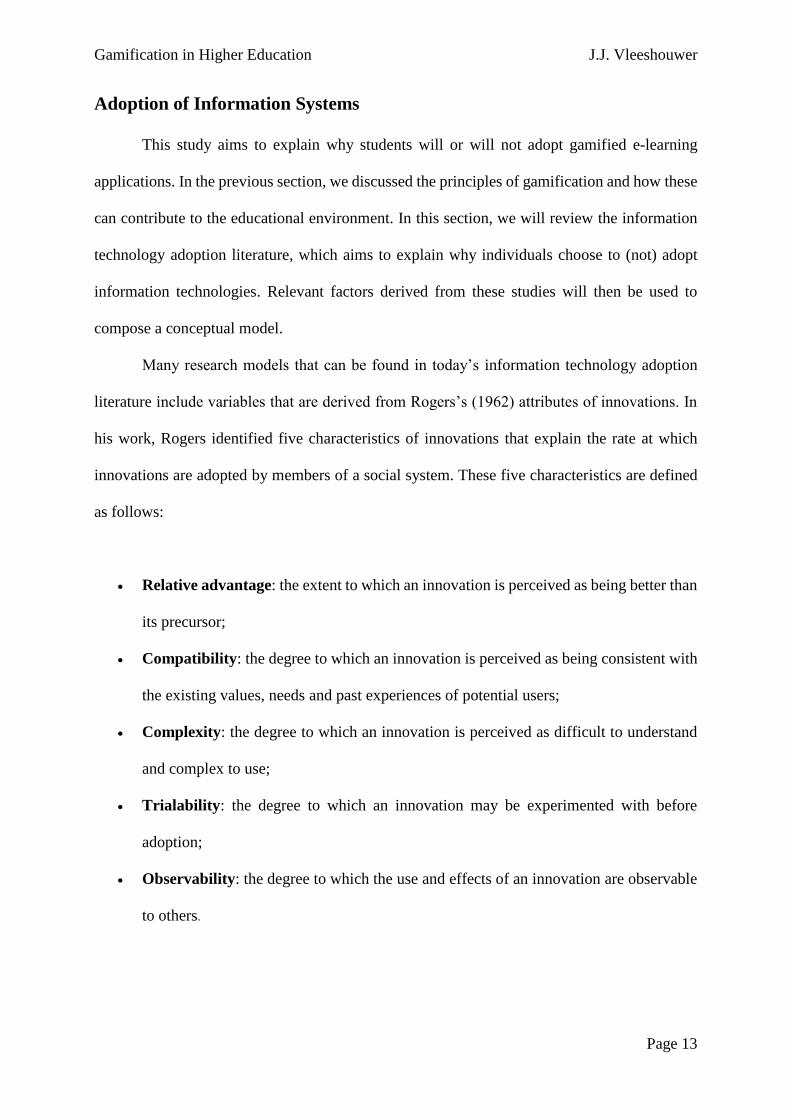
■ Figure 1. The Technology Acceptance Model (Davis, 1986).
As Figure 1 shows, both Perceived Usefulness and Perceived Ease of Use are influenced
by External variables. These variables have been the research goal of many studies that
followed the publication of the Technology Acceptance Model. One variable that showed
consistent relevance across multiple studies is a user’s prior experience with the technology
(Bouwman et al., 2002). As one might expect, prior experience with a technology reduces the
Perceived Ease of Use, which in turn increases the Perceived Usefulness. Furthermore, if the
prior experience with a technology is bad, users are more likely to perceive the technology as
less useful as well.
As an extension to the Technology Acceptance Model, Venkatesh and Davis (2000)
proposed the Technology Acceptance Model 2, which incorporates additional social influence
variables explaining technology adoption. Besides the previously discussed variables
Voluntariness and Image, Venkatesh and Davis also added the variable Subjective Norm to
their model, which represents the perceived social pressure from important others to (not)
perform a certain behaviour.
Gamification in Higher Education J.J. Vleeshouwer
Page 16
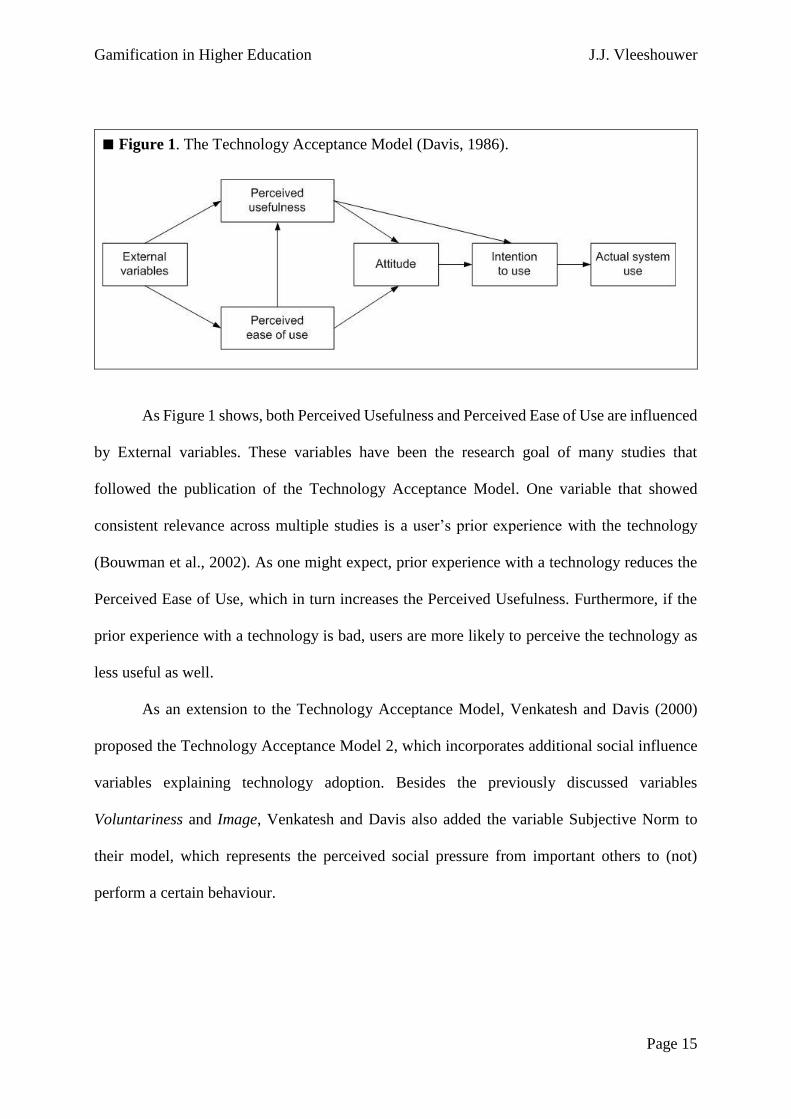
Following the Technology Acceptance Model 2, Venkatesh, Morris, David & Davis
(2003) reviewed and compared eight user adoption models and united these models into the
Unified Theory of Acceptance and Use of Technology (UTAUT). This model (see Figure 2)
includes four determinants (Performance Expectancy, Effort Expectancy, Social Influence, and
Facilitating Conditions) of user acceptance and usage behaviour. These four determinants are
furthermore moderated by four variables: Gender, Age, Voluntariness, and Experience.
■ Figure 2. Unified Theory of Acceptance and Use of Technology (Venkatesh et al., 2003).
Venkatesh et al. (2003) defined Performance Expectancy as “the degree to which an
individual believes that using the system will help him or her to attain gains in job
performance”. Evidently, Performance Expectancy was derived from the previously mentioned
constructs Perceived Usefulness and Relative Advantage. Effort Expectancy, the second direct
determinant in UTAUT, was derived from the constructs Complexity and Perceived Ease of
Use, and was defined as the degree of ease associated with the use of the new technology. Social
Influence was considered to be similar to TAM’s Subjective Norm. The last direct determinant,
Facilitating Conditions, is defined by Venkatesh et al. (2003) as “the degree to which an
Gamification in Higher Education J.J. Vleeshouwer
Page 17
individual believes that an organizational and technical infrastructure exists to support use of
the system”. Facilitating Conditions incorporates the previously mentioned constructs
Compatibility, Observability and Triability.
Since its publication in 2003, the UTAUT model has become a popular model in the
field of information technology adoption. This is not without reason, as the model has received
empirical support for different kinds of technology uses. To give some examples, the UTAUT
model has been able to explain the adoption of information kiosks (Wang & Shih, 2009), small
and medium enterprises (Mursalin, 2012), internet banking (AbuShanab & Pearson, 2007) and
electronic library systems (Oluchi, 2010). In addition, other studies have shown that the
UTAUT model is robust enough to withstand cultural differences (Oshlyansky, Cairns &
Thimbleby, 2007; Nistor, Gögüs & Lerche, 2013) However to this date, there have been no
studies to test the UTAUT model with a gamified e-learning application. Therefore, we need to
ask ourselves: how does the UTAUT model fit within the context of gamification? Looking at
the four UTAUT constructs in Figure 2, there seems to be no reason to expect that the UTAUT
model is not capable of predicting the adoption of gamified e-learning applications.
Performance Expectancy is expected to play an important role, as a gamification application
that has no benefits over traditional study materials is not likely to be used by students. The
same can be said about Effort Expectancy: when the gamified e-learning application is too
difficult to use, adoption is less likely to occur. Since gamification incorporates social elements
as well, UTAUT’s Social Influence also seems to be a good match. Lastly, we expect to see
that Facilitating Conditions is also relevant, as a lack of support (be it either organizational or
technical) will likely hinder the use of gamified e-learning applications.
Gamification in Higher Education J.J. Vleeshouwer
Page 18
Up to now, it seems that the four constructs of the UTAUT model are applicable to
gamification. Still, one might argue that the model does not cover all the aspects of
gamification. Especially the hedonic characteristic of gamification, increasing engagement
through game elements, does not seem to be treated by the model. Do adoption factors differ
between hedonic and utilitarian systems? According to van der Heijden (2004), the value of a
hedonic system is to have a self-fulfilling, pleasurable experience, whereas utilitarian systems
aim to provide instrumental values. Furthermore, van der Heijden describes hedonic
applications as aesthetically appealing with the objective to encourage prolonged use. Although
the ultimate goal of gamification might be of instrumental value (e.g., an improvement in study
performance), the means of achieving such values are actually through playful game dynamics
that users experience. Thus, a gamification user is more likely to assess the application based
on its hedonic features rather than on its utilitarian features. Furthermore, when game dynamics
become the main driver for using gamified applications, users might not even consider the
beneficial outcomes. Hence, we believe that the hedonic features of gamification are more
prevalent in user assessments of gamification compared to utilitarian characteristics.
Results from van der Heijden’s (2004) study show that Perceived Enjoyment is a strong
determinant for the usage of hedonic systems. This is in line with the study by Lin and
Bhattacherjee (2007), who suggest that Perceived Enjoyment “should have a stronger effect on
user attitudes towards hedonic systems because the expressed intent of such systems is to
maximize user’s enjoyment or entertainment from their use” (p. 5). In addition, the authors
suggest that Perceived Usefulness and Perceived Ease of Use are less relevant for hedonic
systems as the goal of these systems is not to improve practical outcomes. By adding Perceived
Enjoyment to the four constructs of the UTAUT model (Figure 2), we now have five potential
constructs that explain the adoption of gamified e-learning applications.
Gamification in Higher Education J.J. Vleeshouwer
Page 19
Usage Intensity
An important aspect of gamification are the social dynamics between players. For some
players, being rewarded with points, badges or achievements provides sufficient motivation to
keep playing. Others might prefer forms of social recognition, which can be earned through the
social game dynamics cooperation and competition. One might argue that, without a solid user
base, gamification will not become truly useful. Students who try to reach the highest scores on
challenges might lose interest once they find out that none of the other classmates are
participating. Rewards for reaching higher levels lose their value when there are only a few
other users to show them to. In other words, a sufficient amount of users is needed in order for
gamification to become truly successful. This is related to the concept of critical mass, which
implies that a technology is only interesting to the majority of potential users when there are
already enough users working with that technology (Rogers, 1962). As a consequence, adoption
of potential users is crucial. However, one might wonder if adoption is the appropriate
dependent variable to represent the effectiveness of a gamification application. After all, a fully
engaged user differs from an occasional user, even though both have adopted the application.
Following Corrocher’s (2011) line of thought, the usage intensity might be a preferable
construct, as it covers all the activities that users perform in order to benefit from the adopted
innovation. Usage Intensity can be measured using digital metrics from the gamified e-learning
application itself, such as the frequency of use, the depth of use, and the amount of activities
performed. Merging these values into an overall Usage Intensity score gives u a better
understanding about the degree of adoption, compared to a situation where students either do
or do not choose to adopt.
Gamification in Higher Education J.J. Vleeshouwer
Page 20
Constructs of the Conceptual Model
We currently have five constructs (Performance Expectancy, Effort Expectancy, Social
Influence, Facilitating Conditions, and Perceived Enjoyment) that are likely to influence our
dependent variable, Usage Intensity. In the remainder of this chapter, these constructs and their
interrelationships will be discussed in greater detail. Additionally, we will add two moderating
variables to our study: Age and Experience.
Performance Expectancy - In the context of this research, Performance Expectancy is
defined as the degree to which a student perceives that using the gamified e-learning
application will enhance his or her study performance. In line with the UTAUT model
(Venkatesh et al., 2003), we expect Performance Expectancy to positively contribute to Usage
Intensity, as technologies that are perceived as more useful are likely to be used more as well.
Stated differently, students who believe that the gamified e-learning application is capable of
enhancing their study performance will use the application to a greater extent, compared to
students who hold the opposite supposition. Therefore, the following hypothesis is proposed:
H1: Performance Expectancy positively contributes to Usage Intensity.
Effort Expectancy – Effort Expectancy is defined as the degree to which a student
perceives that using the gamified e-learning application is effortless (derived from Davis,
1986). We expect that Effort Expectancy positively contributes to Usage Intensity, as
technologies that are easy to use are likely to be used more frequently compared to technologies
that are difficult to use. Furthermore, in line with the Technology Acceptance Model (Davis,
1986) and other related studies (e.g., Hsu & Lu, 2004; van der Heijden, 2004; Bruner & Kumar,
2005; Chesney, 2006), we expect Effort Expectancy to positively contribute to Performance
Expectancy, as technologies that are easy to use should become more useful as well. When the
Gamification in Higher Education J.J. Vleeshouwer
Page 21
gamification application is too difficult to use, students are less likely to receive benefits from
it. In line with previous related studies (e.g., van der Heijden, 2004; Sun & Zhang, 2006;
Chesney, 2006), we furthermore expect Effort Expectancy to positively contribute to Perceived
Enjoyment. When the gamification application is too difficult to use, frustrations may arise,
thus influencing the user satisfaction. As a result, the following three hypotheses are proposed:
H2a: Effort Expectancy positively contributes to Usage Intensity.
H2b: Effort Expectancy positively contributes to Performance Expectancy.
H2c: Effort Expectancy positively contributes to Perceived Enjoyment.
Social Influence – Venkatesh et al. (2003) define Social Influence as “the degree to
which an individual perceives that important others believe he or she should use the new
system” (p. 451). Within the context of this study, we believe that these important others are the
fellow classmates and teachers of the student. When social influences are high, students feel
pressure to adopt, for instance because a vast majority of the students is already participating.
Likewise, when Social Influence is low, other students might openly disapprove the application,
therefore negatively influencing the adoption decision of others. As a result, we propose the
following hypothesis:
H3: Social Influence positively contributes to Usage Intensity.

Gamification in Higher Education J.J. Vleeshouwer
Page 22
Facilitating Conditions – Derived from the UTAUT model (Venkatesh et al., 2003),
Facilitating Conditions represents the degree to which a student believes that an organizational
and technical infrastructure exists to support the use of the gamified e-learning application.
When Facilitating Conditions is low, students experience barriers that hinder the usage of the
application. These barriers can be either organizational (e.g., no introduction, training or
support) or technical (e.g., no internet access, errors present in the application). In line with the
UTAUT model, we expect to see that as Facilitating Conditions increases, the Usage Intensity
increases as well. Furthermore, we expect that Facilitating Conditions positively contributes to
Performance Expectancy, since organizational and technical barriers are likely to delay results.
Therefore, the following two hypotheses are proposed:
H4a: Facilitating Conditions positively contributes to Usage Intensity.
H4b: Facilitating Conditions positively contributes to Performance Expectancy.
Perceived Enjoyment - Perceived Enjoyment is defined as the degree to which a
student perceives the use of the gamified e-learning application to be enjoyable or pleasant.
Perceived Enjoyment distinguishes from Performance Expectancy in terms of extrinsic and
intrinsic motivation. Performance Expectancy represents motivators that are external to the
interaction with the application, i.e., an improvement in study performance. Perceived
Enjoyment, on the other hand, focuses on intrinsic motivation, such as the feelings of joy that
students might experience when using the application (van der Heijden, 2004). We expect that
Perceived Enjoyment is positively associated with the Usage Intensity of the gamified
e-learning application, since gamification tries to motivate users by adding the ‘fun ingredient’
to less appealing activities. It is expected, that as the application is perceived as more enjoyable,
the use of the application increases as well. Therefore, the following hypothesis is proposed:
H5: Perceived Enjoyment positively contributes to Usage Intensity.
Gamification in Higher Education J.J. Vleeshouwer
Page 23
Moderating Constructs – In addition to the five aforementioned predictors of
technology adoption, the UTAUT model as depicted in Figure 2 also includes four moderating
factors: Gender, Age, Experience, and Voluntariness. These will be discussed next.
Gender – Do we expect differences in usage intensity between men and women?
Previous studies regarding technology adoption suggest that the usefulness of a system is more
important to men, whereas women tend to focus more on its ease of use (Morris & Venkatesh,
2000; Kim, 2010; Terzis & Economides, 2011; Padilla-Meléndez, del Aguila-Obra, & Garrido-
Moreno, 2013). In addition, the UTAUT model states that women are influenced more strongly
by other people’s opinions with regard to information technology usage (Venkatesh et al.,
2003). Thus, the following three hypotheses will be tested:
H6a: Performance Expectancy will contribute to Usage Intensity more strongly for men
than it will for women.
H6b: Effort Expectancy will contribute to Usage Intensity more strongly for women
than it will for men.
H6c: Social Influence will contribute to Usage Intensity more strongly for women than
it will for men.
Age –Previous studies have shown that age plays a moderating role in the adoption of
information technologies. Venkatesh et al. (2003) found that older people attach more meaning
to Facilitating Conditions and Effort Expectancy, whereas younger people find Performance
Expectancy to be of greater importance. If we were to test the moderating effects of age, a
sample is needed that covers a widespread of different ages. Unfortunately this is not the case
for this current study, as a gamified e-learning application will be implemented into a university
Gamification in Higher Education J.J. Vleeshouwer
Page 24
course. Because this makes it practically impossible to study the effects of age on the adoption
of gamification, we will not include this moderating variable into our study.
Experience – Various information technology adoption studies have included
experience as a moderating variable, however there appears to be inconsistency regarding its
conceptualization. In some studies, such as the study by Venkatesh et al. (2003), experience
represents the increase in familiarity and knowledge with the technology that is being studied.
In these cases, experience is measured at different stages of use, for instance by using time
intervals of several weeks. Other studies include experience as a moderating variable to
represent a user’s prior experience with the technology. Here, experience is a fixed variable
that captures the level of familiarity and knowledge users have with the technology in general
(Sun & Zhang, 2005). In the context of gamified e-learning, we believe that both representations
of experience are of interest. As demonstrated by Venkatesh et al., Effort Expectancy and
Facilitating Conditions are assessed by users more heavily during the early stages of technology
use. The idea behind this is that difficulty and usage barriers are likely to decrease as experience
with technology increases. As much as we would like to test these effects, the length of a single
academic course is rather short, causing the different stages of use to be too close to each other.
Instead, we will test experience as a representation of a student’s prior experience with the
technology. This means that we first need to determine what kind of technology that is. One’s
first notion would be to use gamified e-learning applications as a reference point, however as
gamification is still hardly being practiced at schools and universities, we believe this notion
will not hold. Instead, we believe that experience with video games is a better fit, as gamification
incorporates game design elements that are familiar to most video game players. This idea is in
accordance with Goehle (2013), who found that “students who play video games regularly were
more engaged with our gamification techniques” (p. 243). Students who play video games for
Gamification in Higher Education J.J. Vleeshouwer
Page 25
entertainment purposes will recognize the familiar game design elements in gamification
practices, which may lead to an increase in appreciation for the gamified application. Hence,
the following hypothesis is proposed:
H7: Perceived Enjoyment will contribute to Usage Intensity more strongly for students
who regularly play video games compared to students who do not.
Voluntariness – The fourth and last moderating variable of the UTAUT model is
voluntariness of use, which distinguishes voluntary and mandatory information technology
usage. In voluntary settings, target users are free to decide whether they will or will not adopt
a certain technology, whereas in mandatory settings, adoption is required. This distinction also
holds in the educational setting, where some information technologies are obligatory (e.g., the
university’s course managements tool) while others are not (e.g., the university’s library search
engine). Venkatesh et al. (2003) found that social influences are only present in mandatory
settings, suggesting that compliances (e.g., with bosses and teachers) play a vital role in the
adoption decisions of target users. The gamified e-learning application, which will be described
in the next section of this article, is of voluntary use, meaning that students are free to decide
whether they will or will not use the application. Does this mean that we can remove the Social
Influence construct from our model? Perhaps, but this would also rule out any social influences
that occur between students. Thus, it seems wise to keep the Social Influence construct in our
study. Evidently, because we will not create both a voluntary and mandatory application,
comparisons between both settings cannot be made. Instead, this variable needs to be controlled
so that students are aware that usage is voluntary.
Gamification in Higher Education J.J. Vleeshouwer
Page 26
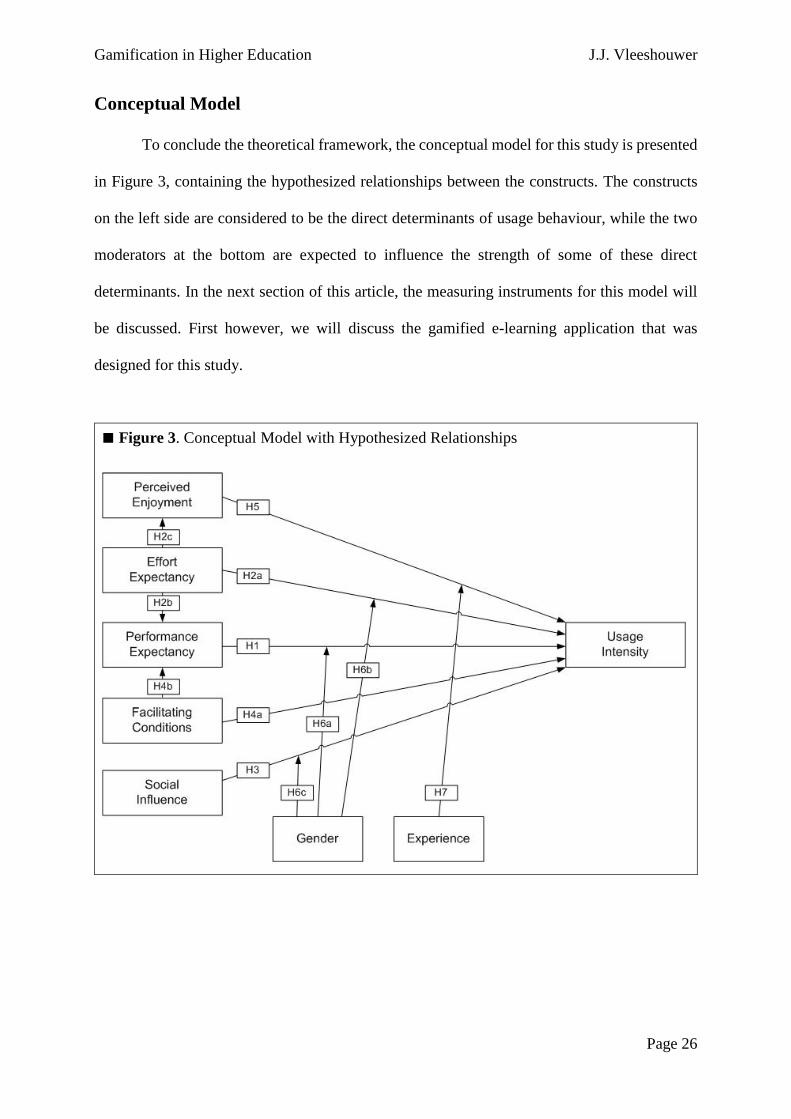
Conceptual Model
To conclude the theoretical framework, the conceptual model for this study is presented
in Figure 3, containing the hypothesized relationships between the constructs. The constructs
on the left side are considered to be the direct determinants of usage behaviour, while the two
moderators at the bottom are expected to influence the strength of some of these direct
determinants. In the next section of this article, the measuring instruments for this model will
be discussed. First however, we will discuss the gamified e-learning application that was
designed for this study.
■ Figure 3. Conceptual Model with Hypothesized Relationships
Gamification in Higher Education J.J. Vleeshouwer
Page 27
METHOD
In the first part of the method section, we will describe the design of the interactive
website InStaQuest, which was created using the gamification principles as discussed in the
theoretical background. The second part will cover the research design itself, addressing the
sample, procedures and measurements of this study.
Gamification Design
Target group – InStaQuest was designed for an inferential statistics course at the
University of Twente. This course, which ran from April till July 2015, was positioned in the
pre-master curriculum for multiple behavioural science studies. Roughly 110 students signed
up for this course. With a few exceptions, the majority of these students were between the ages
of 20 and 28. The use of InStaQuest was not mandatory. Evidently, this was needed to study
the factors influencing the adoption decisions of the students. An invitation e-mail was sent to
all course participating students at the start of the statistics course. This e-mail, which invited
all students to participate in the project, also underlined that the use of InStaQuest was not
mandatory. The voluntariness of use was again mentioned after students logged in to the
website for the first time.
Technical – InStaQuest was built using web-programming languages HTML, CSS, and
PHP. The website was hosted online, enabling students to access the application at any time
and place. Students received their personal login credentials in an invitation e-mail that was
sent at the start of the statistics course. To create additional project awareness amongst the
students, announcements were posted on Blackboard (the electronic learning and course
management environment used by the university). The design of the website was made
responsive, so that it could be accessed and viewed properly on different devices (i.e.: desktop
computers, tablets, and smartphones).
Gamification in Higher Education J.J. Vleeshouwer
Page 28
Main features – InStaQuest consisted of two main features: the practice environment
and the play environment. In the practice environment (see Appendix B.1. and B.2. for
screenshots), students had to complete levels that included ten multiple choice questions. In
order to complete a level, students had to earn at least one star, which required them to answer
six out of ten questions correctly. Two stars were earned by correctly answering eight questions,
whereas three stars were given to those that could answer all questions correctly. Each level
covered more study material, thus increasing the difficulty one step at a time.
The play environment included a murder mystery game, in which players had to solve
a murder on the fictional ‘Fisher Island’ (see Appendix B.3.). In order to obtain clues, players
had to travel around the island, completing statistical quests at different cities. Upon acquiring
all clues, players were able to identify the murderer.
Gamification principles – Below, we will describe how gamification was applied to
InStaQuest by discussing each of the five principles of gamification: goal orientation,
achievement, reinforcement, competition, and fun orientation.
Goal orientation aims to structure information in various goal layers. This principle was
most visible in the practice feature, where the study materials of the course were divided
into five subjects. Each subject contained three levels, with each level being slightly
more difficult than the previous one. The final level in the practice area covered all the
study materials, thus giving the students the opportunity to test their overall knowledge
of the course.
Reinforcement aims to stimulate learning behaviour by presenting the player with
rewards. There were three types of rewards to be achieved in InStaQuest: experience
points, coins, and clues. Experience points determined a player’s level and were
acquired by participation itself: activities such as completing practice levels or traveling
Gamification in Higher Education J.J. Vleeshouwer
Page 29
from one city to another gave the player experience points. The player level and the
amount of acquired experience points were visible in the progress bar, located at the top
of every page. The second type of reward that could be achieved in InStaQuest were
coins, which served as a currency within the play environment. Coins were acquired by
completing practice levels and were needed to travel around Fisher Island. Lastly, clues
were earned by completing quests in the play environment, and were needed to solve
the murder mystery game.
Competition was employed by comparing experience points and coins through
leaderboards. The main leaderboard, which was located on the home page of the
website, listed the top five players in terms of experience points. The group
leaderboards, located in the play environment, made comparisons in experience points
and coins between the different studies, thus stimulating a form of cooperation as well.
Achievements give recognition to players for completing (intermediate) goals.
Whenever a player completed a level or quest, their achievement was displayed in the
‘Recent Activities’ window, located on the home page of InStaQuest. A different type
of achievement was a player’s level, which increased by receiving experience points
through general participation. Early on, students levelled up quite fast, however the
amount of experience points needed to level up increased with every level. Finally, the
group leaderboards also displayed the top contributors of every group, therefore
recognizing players who contributed the most.
Fun is an important part of gamification, yet it is perhaps also the most difficult principle
to design. In the theory section of this article, we discussed four different types of fun:
Hard Fun (becoming skilled at the task at hand), Easy Fun (feeling excitement, curiosity
and adventure through exploration), Altered State Fun (changing the way a player feels
or thinks) and Social Fun (engaging with others). We believe that all four types of fun
Gamification in Higher Education J.J. Vleeshouwer
Page 30
were to be found in InStaQuest: Hard Fun could be experienced by progressing in the
practice environment (i.e., trying to get the maximum score for each level), Easy Fun
could be experienced by exploring the play environment (i.e., traveling around Fisher
Island), Altered State Fun could be experienced by taking on the role as a detective in
the murder mystery game, and lastly, Social Fun could be experienced through the
competitive and cooperative game elements found in the leaderboards.
Research design
Procedure – InStaQuest was positioned in an inferential statistics course that ran for
approximately eight weeks. The initial procedure was to measure the five constructs using the
InStaQuest website itself, however as the amount of participants turned out to be less than
expected, we decided to use an online survey tool instead. This enabled us to acquire
perceptions about InStaQuest from the non-users (students who had not participated in
InStaQuest) as well, therefore increasing the sample size. A downside to this approach however,
was that the non-users only received a general description of the gamified e-learning
application, whereas the users had actually interacted with the website.
Online Survey – After InStaQuest had run its course, all course participating students
received a survey invitation (n = 114). This survey started with a question that asked students
whether they had or had not participated in InStaQuest. This distinction between users and non-
users made it possible to create side branches within the online survey. To illustrate: non-users
received a general description of the website, whereas users did not. Likewise, statements could
be phrased differently: users read ‘InStaQuest improved my study performance’ whereas non-
users read ‘InStaQuest would have improved my study performance’. Finally, in contrast to
users, non-users were asked about their motives to not adopt InStaQuest.
Gamification in Higher Education J.J. Vleeshouwer
Page 31
The four constructs derived from the UTAUT model (Performance Expectancy, Effort
Expectancy, Social Influence, and Facilitating Conditions) were measured using their original
item scales. Participants were asked to evaluate these items using a five-point Likert scale
ranging from ‘strongly disagree’ to ‘strongly agree’. Evidently, the item scales needed to be
slightly adapted to better fit the technology of this study (see Appendix A). Similar to the rest
of the survey, all items were formulated in English. The fifth construct, Perceived Enjoyment,
was measured in a similar way, using items derived from Davis (1992) and Venkatesh (2000).
To increase the validity across the item scales, several items were formulated negatively.
Following the item scales, non-users were asked about their motives for non-adoption.
A four-point Likert scale (To a great extent, Somewhat, Very little, Not at all) was used to
weigh the importance of the following eight motives: lack of interest or motivation, lack of
information, dislike of technology, dislike of method, lack of skills or confidence, insufficient
time, privacy, and technical issues. To ensure that all motives were captured, participants were
able to add their own motive as well, though none were given.
Three items in our online survey measured the moderating variable Experience, which
distinguishes students who regularly play video games from those that do not. The first item
asked survey respondents about the amount of years they have been playing video games,
followed by a similar question that asked respondents about the average time they play video
games per day. The third item asked participants to label themselves as either a non-gamer,
casual gamer, regular gamer, or hardcore gamer. These three items were later used to make a
distinction between students who regularly play videogames (referred to as gamers) and those
who do not (referred to as non-gamers). Finally, all survey respondents were given the
opportunity to provide general feedback regarding this project. These student responses can be
found in Appendix C.

Gamification in Higher Education J.J. Vleeshouwer
Page 32
Reliability - The reliability of the scales used to measure the five constructs are
presented in Table 1. With the exception of Social Influence, we believe the remaining item
scales to be reliable, as they are based upon the well-established item scales from the UTAUT
model. The Cronbach’s Alpha’s below 0.7 are likely to be the result of the low number of items
used for those scales (Lance, Butts & Michels, 2006).
Upon closer inspection of the Social Influence construct, we found that the item ‘My
fellow students thought using InStaQuest was a bad idea’ did not correlate well with the other
statements measuring Social Influence. The reason for this was a contradiction within the item
scale: the aforementioned statement focused on fellow students, whereas the other items
focused on teachers and the university in general. As a result, we decided to divide the Social
Influence scale between the two social groups, resulting in a ‘Social Influence (Students)’
construct and a ‘Social Influence (University)’ construct. The former construct only
encompassed the ‘My fellow students though using InStaQuest was a bad idea’ item, whereas
the latter encompassed the remaining three Social Influence items.
Table 1.
Construct Reliability
Construct n α
Performance Expectancy 4 0.839
Effort Expectancy 4 0.738
Facilitating Conditions 4 0.651
Perceived Enjoyment 4 0.817
Social Influence 4 0.545
Social Influence (Students) 1 -
Social Influence (University) 3 0.663
Gamification in Higher Education J.J. Vleeshouwer
Page 33
Dependent Variable – The dependent variable of this study, Usage Intensity, was
measured using three website statistics: amount of logins, amount of activities performed, and
the depth of use. The first two statistics could be easily measured by the website’s database:
each time a user logged in or performed an activity, a count would be updated in the database.
The depth of use referred to the type of activities students performed in InStaQuest. As
mentioned earlier, InStaQuest consisted of two main features: the practice environment and the
play environment. The practice environment was the most easily accessible feature of the
website: after logging in, students could start right off the bat without any further instructions
necessary. The play environment on the other hand, took some time and understanding (i.e.,
reading the storyline and learning the controls), thus representing the deeper layer of the
website.
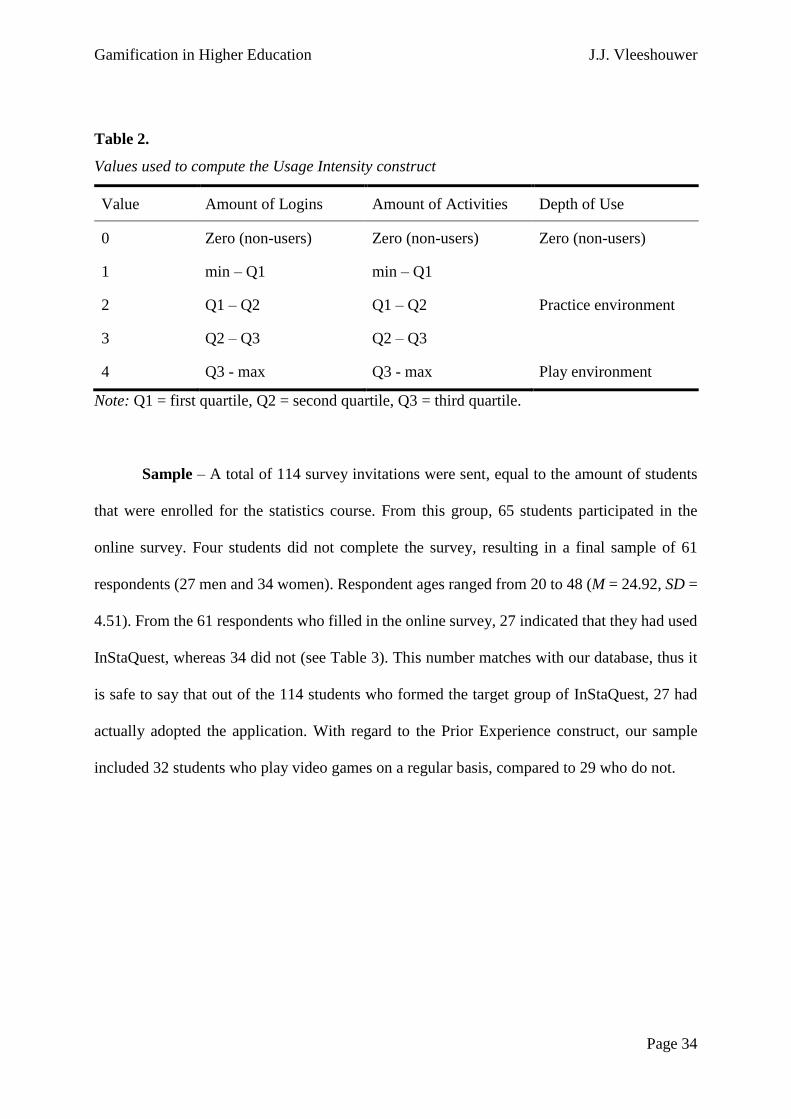
The amount of logins and activities performed by the users were transformed in
categorical variables using their quartiles (see Table 2). To give equal weight to the Depth of
Use variable, value 2 was given to players who only performed activities in the practice
environment, whereas value 4 was given to players who participated in the play environment.
Finally, the Usage Intensity could be calculated using the following formula: Usage Intensity
= (Logins + Activities + Depth of Use) / 12. This formula gave each respondent a Usage
Intensity score between 0 and 1, where a higher score referred to a higher degree of usage.
Gamification in Higher Education J.J. Vleeshouwer
Page 34
Table 2.
Values used to compute the Usage Intensity construct
Value Amount of Logins Amount of Activities Depth of Use
0 Zero (non-users) Zero (non-users) Zero (non-users)
1 min – Q1 min – Q1
2 Q1 – Q2 Q1 – Q2 Practice environment
3 Q2 – Q3 Q2 – Q3
4 Q3 - max Q3 - max Play environment
Note: Q1 = first quartile, Q2 = second quartile, Q3 = third quartile.
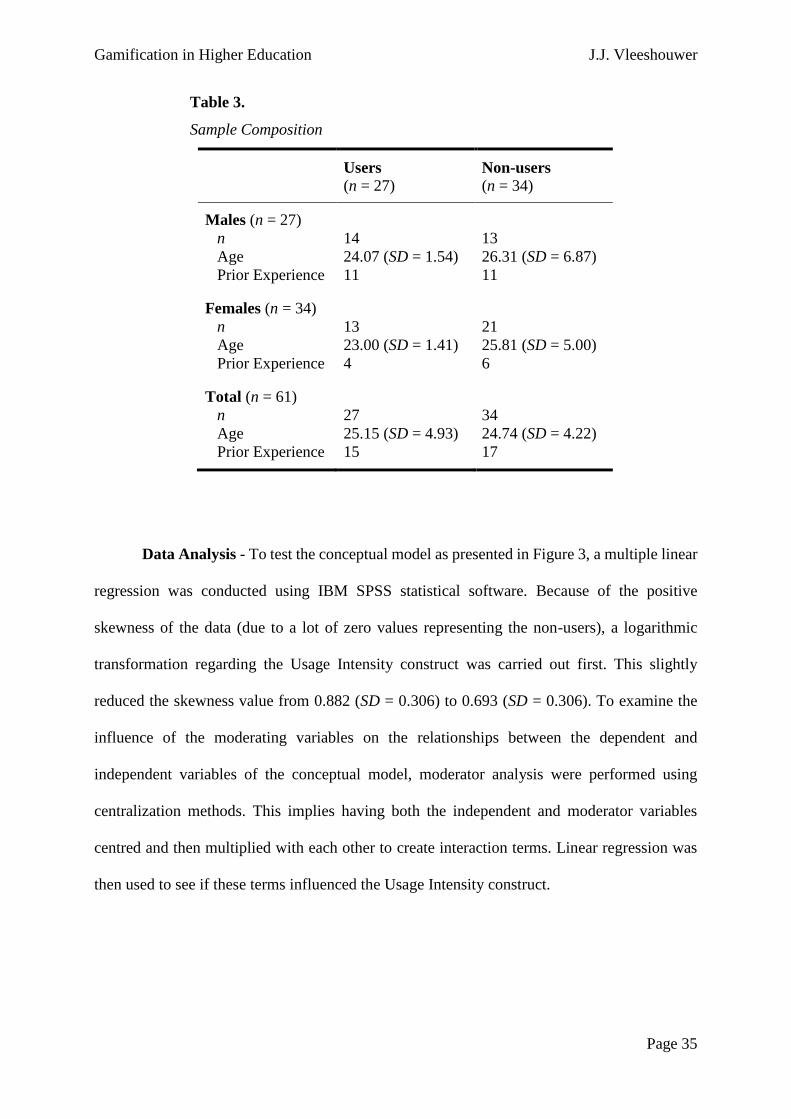
Sample – A total of 114 survey invitations were sent, equal to the amount of students
that were enrolled for the statistics course. From this group, 65 students participated in the
online survey. Four students did not complete the survey, resulting in a final sample of 61
respondents (27 men and 34 women). Respondent ages ranged from 20 to 48 (M = 24.92, SD =
4.51). From the 61 respondents who filled in the online survey, 27 indicated that they had used
InStaQuest, whereas 34 did not (see Table 3). This number matches with our database, thus it
is safe to say that out of the 114 students who formed the target group of InStaQuest, 27 had
actually adopted the application. With regard to the Prior Experience construct, our sample
included 32 students who play video games on a regular basis, compared to 29 who do not.
Gamification in Higher Education J.J. Vleeshouwer
Page 35
Table 3.
Sample Composition
Users
(n = 27) Non-users
(n = 34)
Males (n = 27)
n
Age
Prior Experience
14
24.07 (SD = 1.54)
11
13
26.31 (SD = 6.87)
11
Females (n = 34)
n
Age
Prior Experience
13
23.00 (SD = 1.41)
4
21
25.81 (SD = 5.00)
6
Total (n = 61)
n
Age
Prior Experience
27
25.15 (SD = 4.93)
15
34
24.74 (SD = 4.22)
17
Data Analysis - To test the conceptual model as presented in Figure 3, a multiple linear
regression was conducted using IBM SPSS statistical software. Because of the positive
skewness of the data (due to a lot of zero values representing the non-users), a logarithmic
transformation regarding the Usage Intensity construct was carried out first. This slightly
reduced the skewness value from 0.882 (SD = 0.306) to 0.693 (SD = 0.306). To examine the
influence of the moderating variables on the relationships between the dependent and
independent variables of the conceptual model, moderator analysis were performed using
centralization methods. This implies having both the independent and moderator variables
centred and then multiplied with each other to create interaction terms. Linear regression was
then used to see if these terms influenced the Usage Intensity construct.
Gamification in Higher Education J.J. Vleeshouwer
Page 36
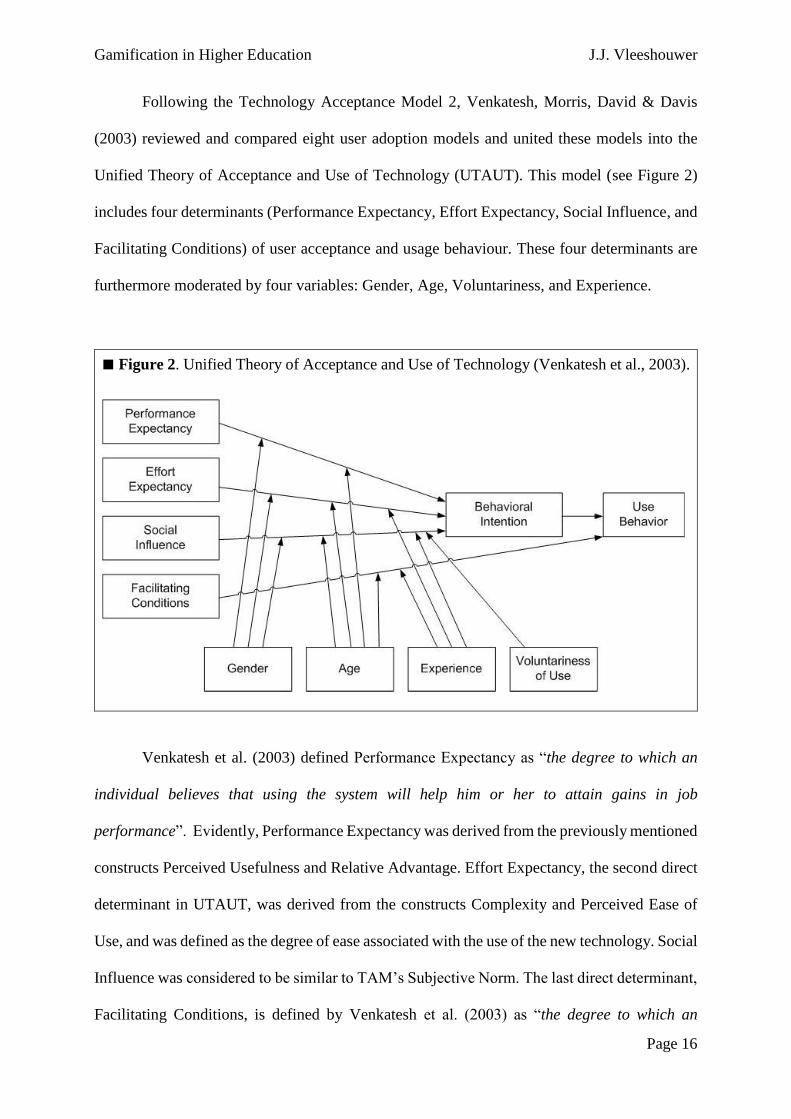
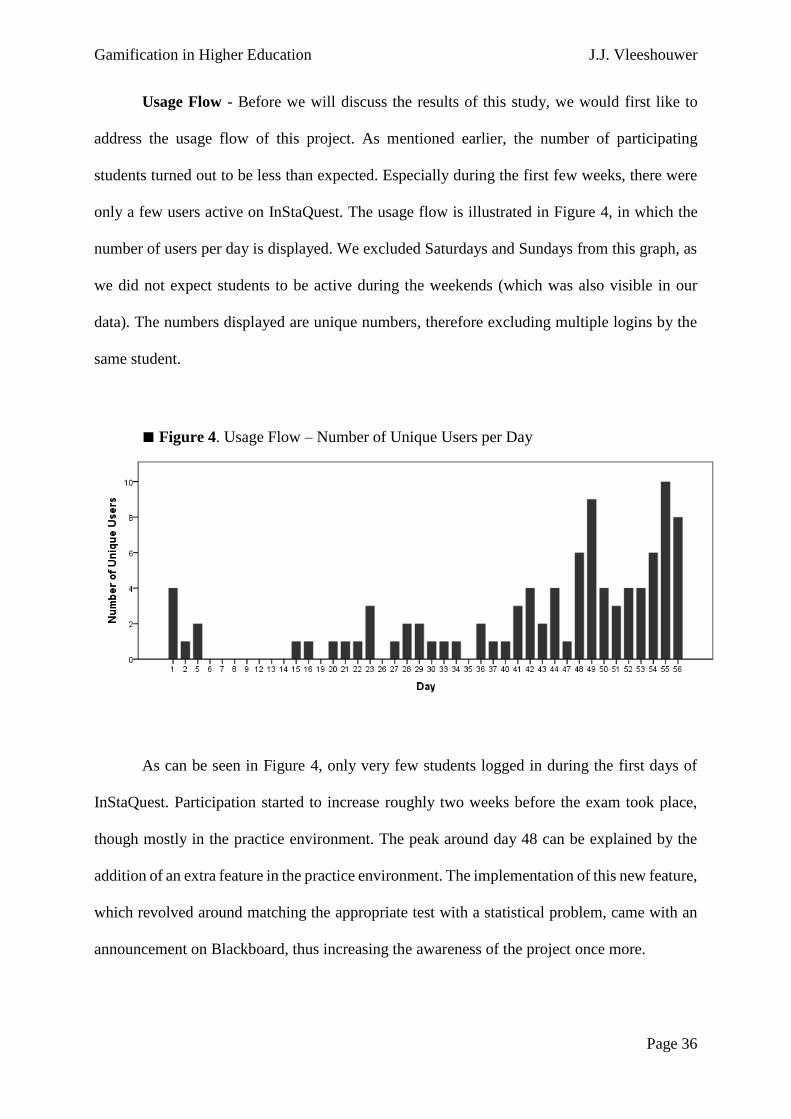
Usage Flow - Before we will discuss the results of this study, we would first like to
address the usage flow of this project. As mentioned earlier, the number of participating
students turned out to be less than expected. Especially during the first few weeks, there were
only a few users active on InStaQuest. The usage flow is illustrated in Figure 4, in which the
number of users per day is displayed. We excluded Saturdays and Sundays from this graph, as
we did not expect students to be active during the weekends (which was also visible in our
data). The numbers displayed are unique numbers, therefore excluding multiple logins by the
same student.
■ Figure 4. Usage Flow – Number of Unique Users per Day
As can be seen in Figure 4, only very few students logged in during the first days of
InStaQuest. Participation started to increase roughly two weeks before the exam took place,
though mostly in the practice environment. The peak around day 48 can be explained by the
addition of an extra feature in the practice environment. The implementation of this new feature,
which revolved around matching the appropriate test with a statistical problem, came with an
announcement on Blackboard, thus increasing the awareness of the project once more.
Gamification in Higher Education J.J. Vleeshouwer
Page 37
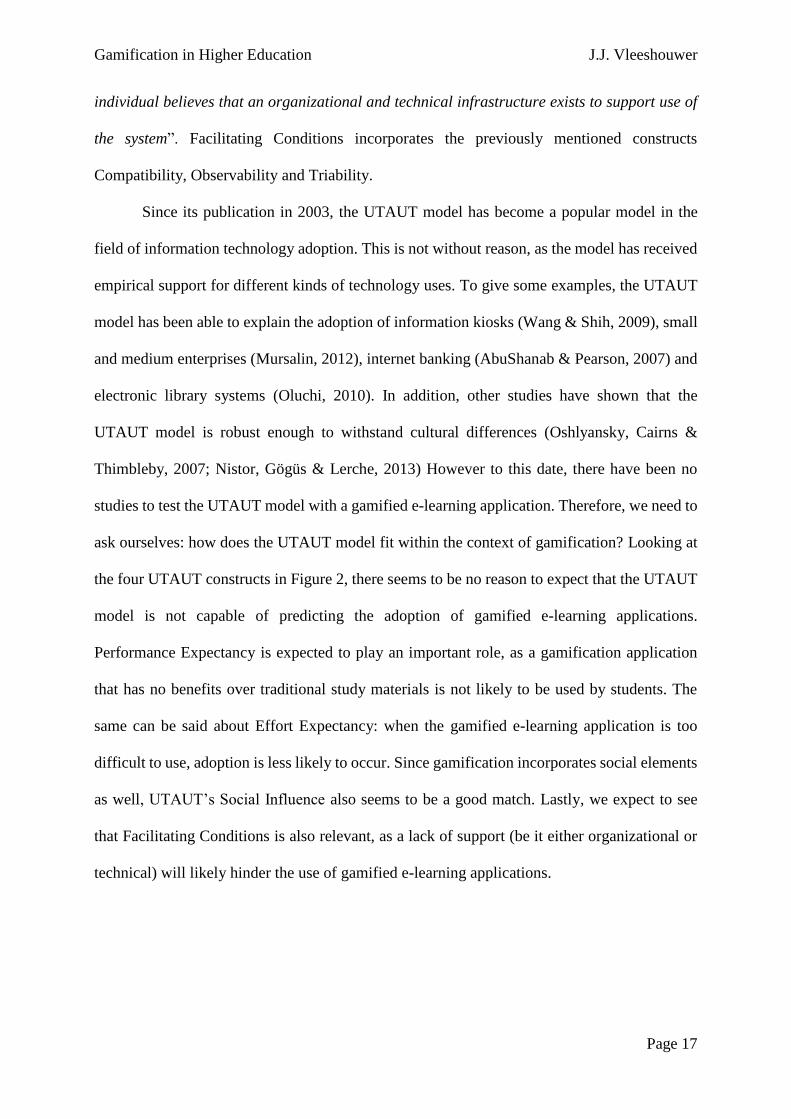
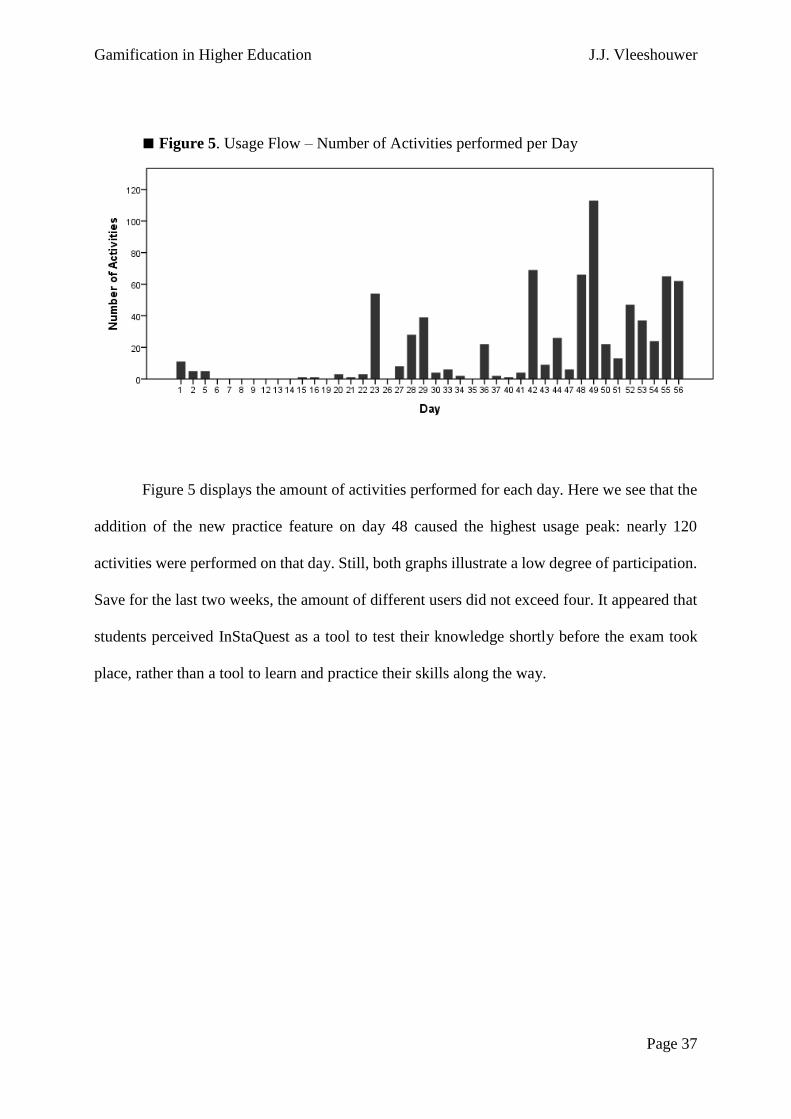
■ Figure 5. Usage Flow – Number of Activities performed per Day
Figure 5 displays the amount of activities performed for each day. Here we see that the
addition of the new practice feature on day 48 caused the highest usage peak: nearly 120
activities were performed on that day. Still, both graphs illustrate a low degree of participation.
Save for the last two weeks, the amount of different users did not exceed four. It appeared that
students perceived InStaQuest as a tool to test their knowledge shortly before the exam took
place, rather than a tool to learn and practice their skills along the way.
Gamification in Higher Education J.J. Vleeshouwer
Page 38
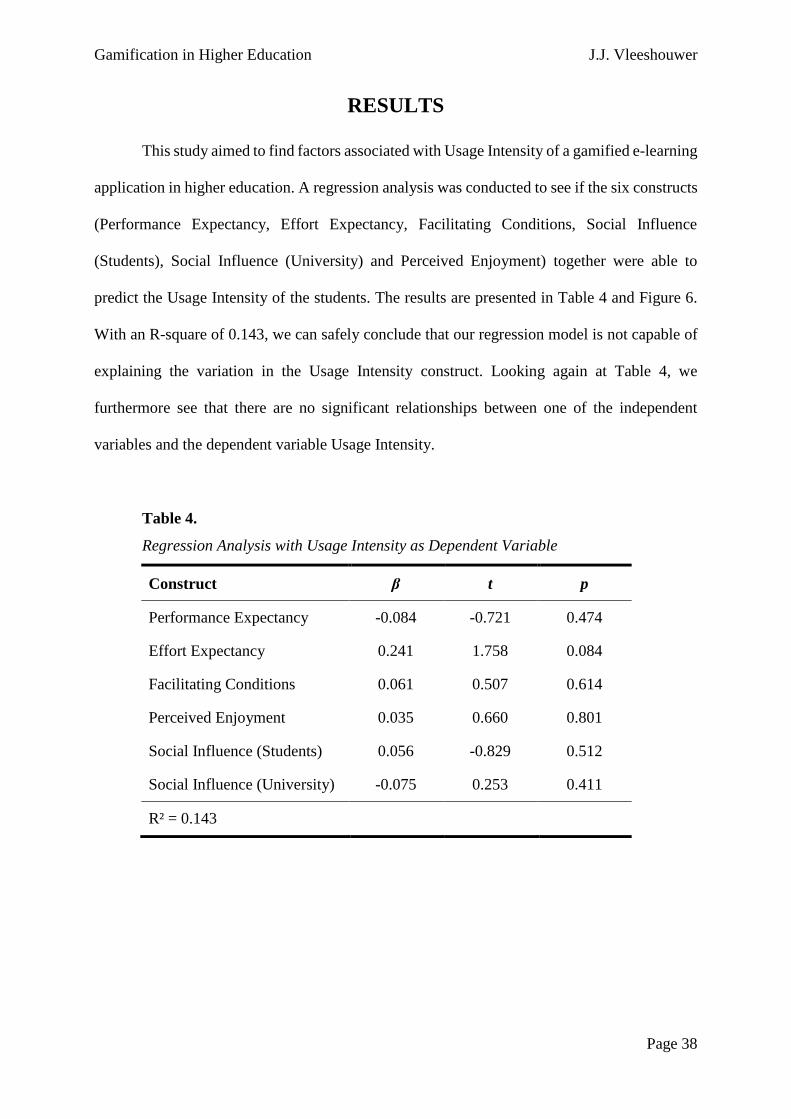
RESULTS
This study aimed to find factors associated with Usage Intensity of a gamified e-learning
application in higher education. A regression analysis was conducted to see if the six constructs
(Performance Expectancy, Effort Expectancy, Facilitating Conditions, Social Influence
(Students), Social Influence (University) and Perceived Enjoyment) together were able to
predict the Usage Intensity of the students. The results are presented in Table 4 and Figure 6.
With an R-square of 0.143, we can safely conclude that our regression model is not capable of
explaining the variation in the Usage Intensity construct. Looking again at Table 4, we
furthermore see that there are no significant relationships between one of the independent
variables and the dependent variable Usage Intensity.
Table 4.
Regression Analysis with Usage Intensity as Dependent Variable
Construct β t p
Performance Expectancy -0.084 -0.721 0.474
Effort Expectancy 0.241 1.758 0.084
Facilitating Conditions 0.061 0.507 0.614
Perceived Enjoyment 0.035 0.660 0.801
Social Influence (Students) 0.056 -0.829 0.512
Social Influence (University) -0.075 0.253 0.411
R² = 0.143
Gamification in Higher Education J.J. Vleeshouwer
Page 39
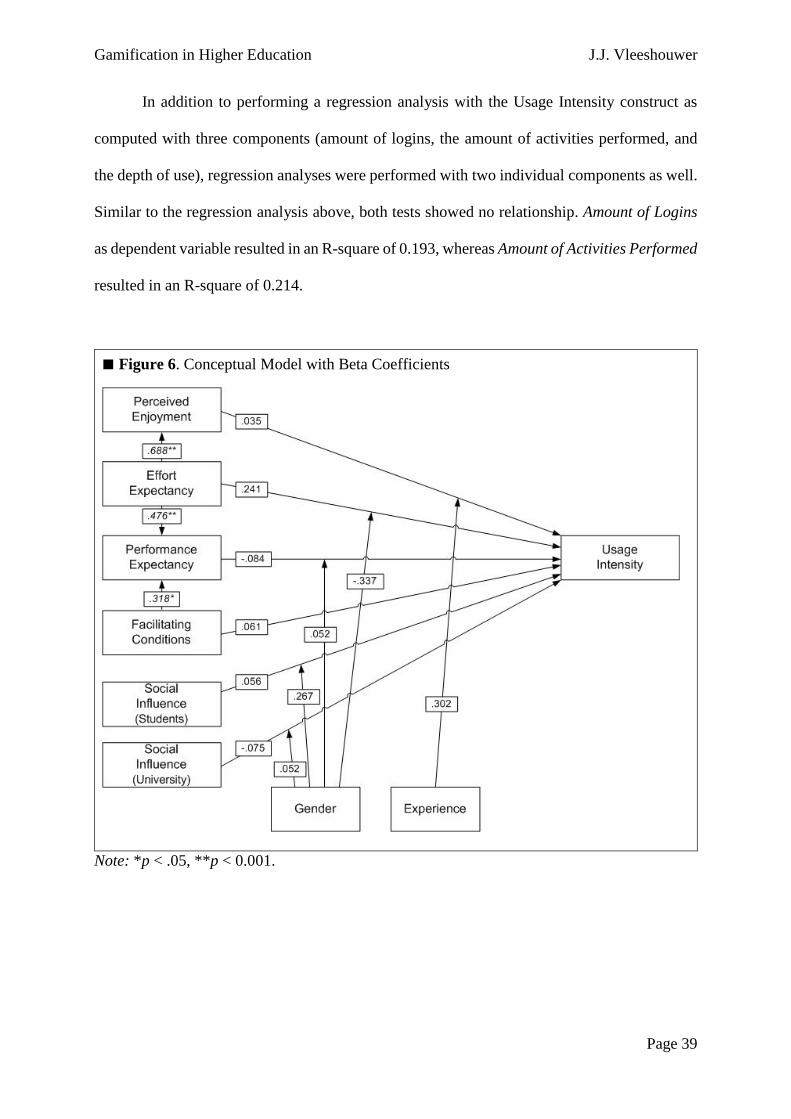
In addition to performing a regression analysis with the Usage Intensity construct as
computed with three components (amount of logins, the amount of activities performed, and
the depth of use), regression analyses were performed with two individual components as well.
Similar to the regression analysis above, both tests showed no relationship. Amount of Logins
as dependent variable resulted in an R-square of 0.193, whereas Amount of Activities Performed
resulted in an R-square of 0.214.
■ Figure 6. Conceptual Model with Beta Coefficients
Note: *p < .05, **p < 0.001.
Gamification in Higher Education J.J. Vleeshouwer
Page 40
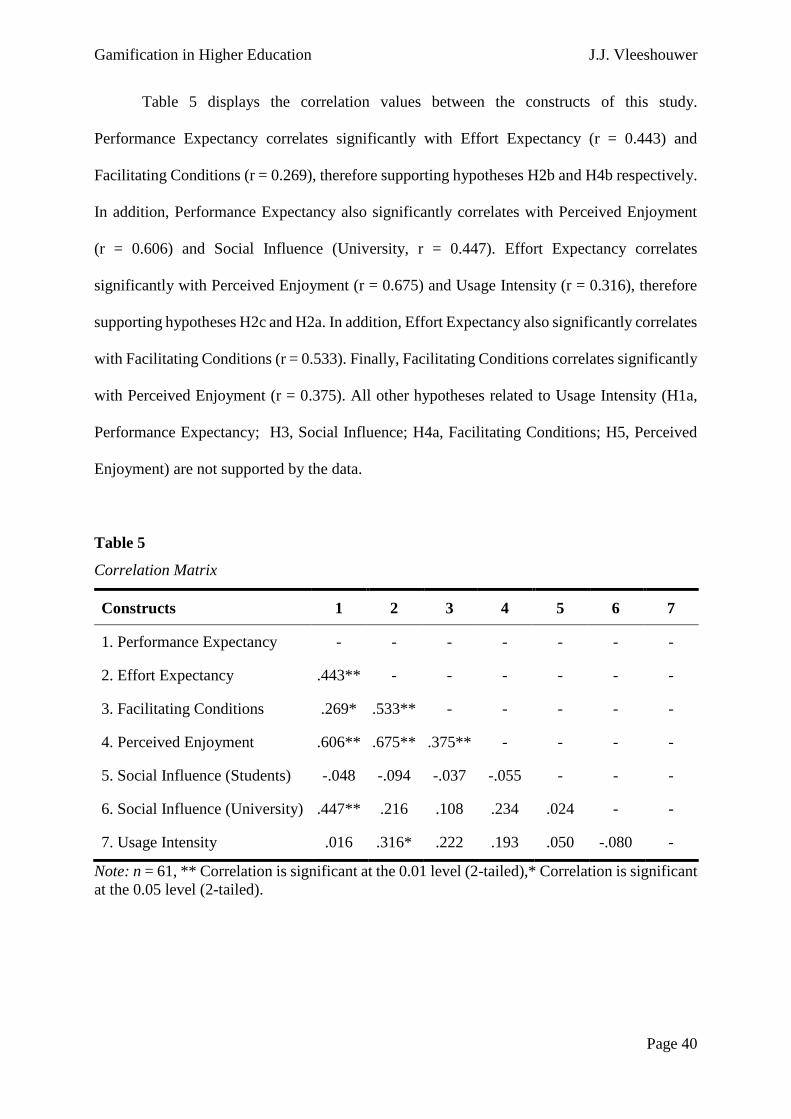
Table 5 displays the correlation values between the constructs of this study.
Performance Expectancy correlates significantly with Effort Expectancy (r = 0.443) and
Facilitating Conditions (r = 0.269), therefore supporting hypotheses H2b and H4b respectively.
In addition, Performance Expectancy also significantly correlates with Perceived Enjoyment
(r = 0.606) and Social Influence (University, r = 0.447). Effort Expectancy correlates
significantly with Perceived Enjoyment (r = 0.675) and Usage Intensity (r = 0.316), therefore
supporting hypotheses H2c and H2a. In addition, Effort Expectancy also significantly correlates
with Facilitating Conditions (r = 0.533). Finally, Facilitating Conditions correlates significantly
with Perceived Enjoyment (r = 0.375). All other hypotheses related to Usage Intensity (H1a,
Performance Expectancy; H3, Social Influence; H4a, Facilitating Conditions; H5, Perceived
Enjoyment) are not supported by the data.
Table 5
Correlation Matrix
Constructs 1 2 3 4 5 6 7
1. Performance Expectancy - - - - - - -
2. Effort Expectancy .443** - - - - - -
3. Facilitating Conditions .269* .533** - - - - -
4. Perceived Enjoyment .606** .675** .375** - - - -
5. Social Influence (Students) -.048 -.094 -.037 -.055 - - -
6. Social Influence (University) .447** .216 .108 .234 .024 - -
7. Usage Intensity .016 .316* .222 .193 .050 -.080 -
Note: n = 61, ** Correlation is significant at the 0.01 level (2-tailed),* Correlation is significant
at the 0.05 level (2-tailed).
Gamification in Higher Education J.J. Vleeshouwer
Page 41
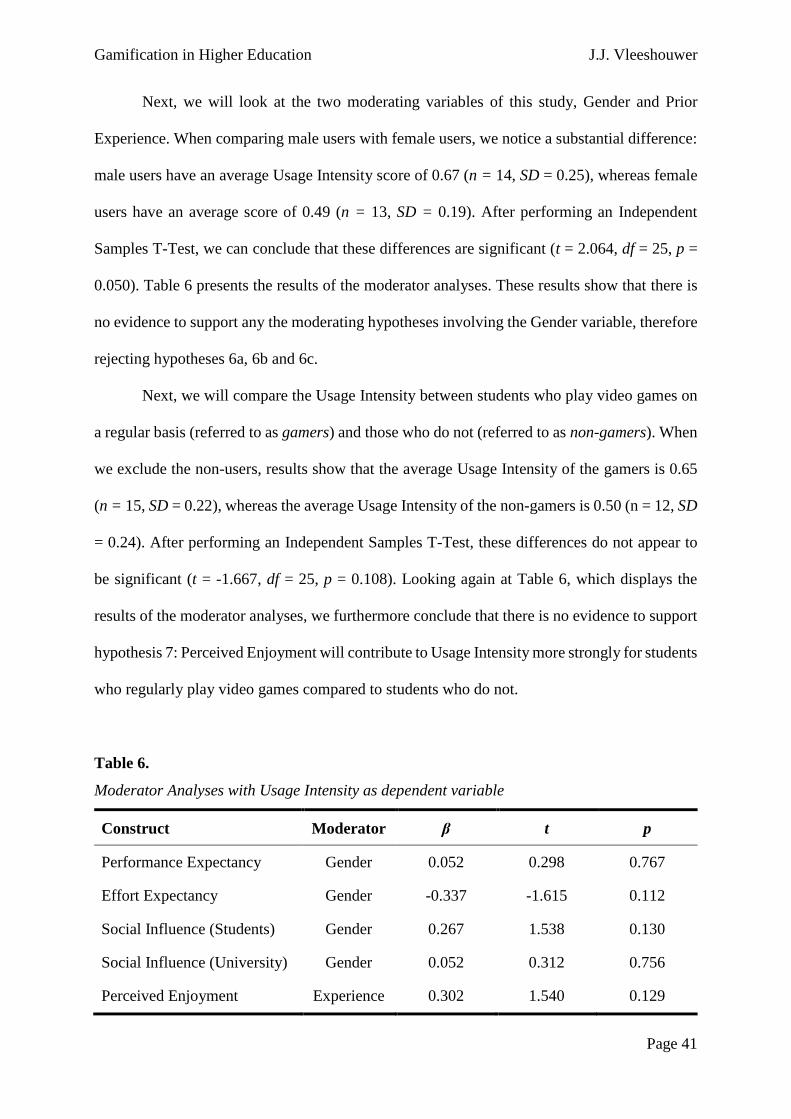
Next, we will look at the two moderating variables of this study, Gender and Prior
Experience. When comparing male users with female users, we notice a substantial difference:
male users have an average Usage Intensity score of 0.67 (n = 14, SD = 0.25), whereas female
users have an average score of 0.49 (n = 13, SD = 0.19). After performing an Independent
Samples T-Test, we can conclude that these differences are significant (t = 2.064, df = 25, p =
0.050). Table 6 presents the results of the moderator analyses. These results show that there is
no evidence to support any the moderating hypotheses involving the Gender variable, therefore
rejecting hypotheses 6a, 6b and 6c.
Next, we will compare the Usage Intensity between students who play video games on
a regular basis (referred to as gamers) and those who do not (referred to as non-gamers). When
we exclude the non-users, results show that the average Usage Intensity of the gamers is 0.65
(n = 15, SD = 0.22), whereas the average Usage Intensity of the non-gamers is 0.50 (n = 12, SD
= 0.24). After performing an Independent Samples T-Test, these differences do not appear to
be significant (t = -1.667, df = 25, p = 0.108). Looking again at Table 6, which displays the
results of the moderator analyses, we furthermore conclude that there is no evidence to support
hypothesis 7: Perceived Enjoyment will contribute to Usage Intensity more strongly for students
who regularly play video games compared to students who do not.
Table 6.
Moderator Analyses with Usage Intensity as dependent variable
Construct Moderator β t p
Performance Expectancy Gender 0.052 0.298 0.767
Effort Expectancy Gender -0.337 -1.615 0.112
Social Influence (Students) Gender 0.267 1.538 0.130
Social Influence (University) Gender 0.052 0.312 0.756
Perceived Enjoyment Experience 0.302 1.540 0.129
Gamification in Higher Education J.J. Vleeshouwer
Page 42
When comparing the scores of the six constructs between the gamer and non-gamer
group, we did find that gamers evaluated the Perceived Enjoyment construct significantly
higher compared to non-gamers (t = 2.795, df = 59, p = 0.007). This seems to support the idea
that gamification is favoured by those who already have some experience with video games in
general. Although not significant, students who play video games also evaluated Performance
Expectancy, Effort Expectancy and Facilitating Conditions higher compared to students who
do not play video games on a regular basis.
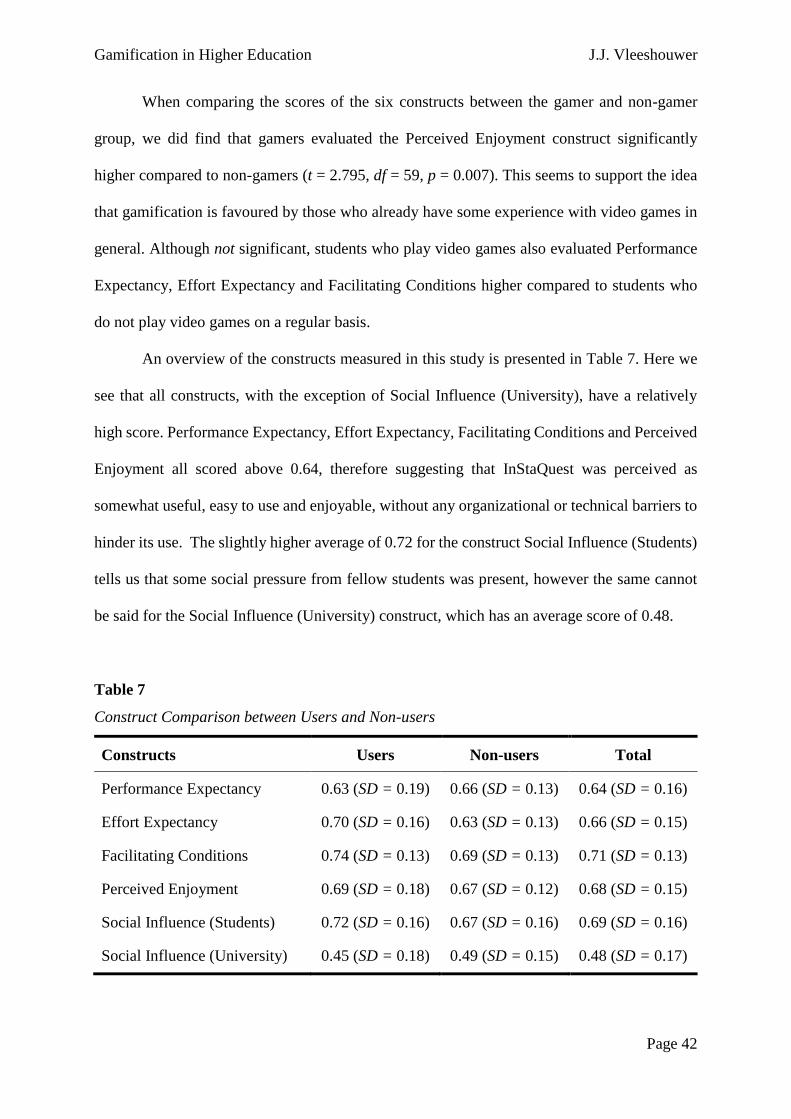
An overview of the constructs measured in this study is presented in Table 7. Here we
see that all constructs, with the exception of Social Influence (University), have a relatively
high score. Performance Expectancy, Effort Expectancy, Facilitating Conditions and Perceived
Enjoyment all scored above 0.64, therefore suggesting that InStaQuest was perceived as
somewhat useful, easy to use and enjoyable, without any organizational or technical barriers to
hinder its use. The slightly higher average of 0.72 for the construct Social Influence (Students)
tells us that some social pressure from fellow students was present, however the same cannot
be said for the Social Influence (University) construct, which has an average score of 0.48.
Table 7
Construct Comparison between Users and Non-users
Constructs Users Non-users Total
Performance Expectancy 0.63 (SD = 0.19) 0.66 (SD = 0.13) 0.64 (SD = 0.16)
Effort Expectancy 0.70 (SD = 0.16) 0.63 (SD = 0.13) 0.66 (SD = 0.15)
Facilitating Conditions 0.74 (SD = 0.13) 0.69 (SD = 0.13) 0.71 (SD = 0.13)
Perceived Enjoyment 0.69 (SD = 0.18) 0.67 (SD = 0.12) 0.68 (SD = 0.15)
Social Influence (Students) 0.72 (SD = 0.16) 0.67 (SD = 0.16) 0.69 (SD = 0.16)
Social Influence (University) 0.45 (SD = 0.18) 0.49 (SD = 0.15) 0.48 (SD = 0.17)
Gamification in Higher Education J.J. Vleeshouwer
Page 43
Table 7 makes a distinction between users and non-users as well. What is interesting to
note is the difference in Performance Expectancy; albeit the difference is small, non-users
perceived the gamified e-learning application to be more useful compared to those who had
actually used InStaQuest. One possible explanation for this is that the program did not fulfil its
initial expectations. Independent Samples T-Tests were performed to see if significant
differences existed between the users and non-users regarding the six constructs presented in
Table 6. These tests did not result in any significant differences between the two groups.
Students who did not participate in InStaQuest were asked about their motives for non-
adoption. The results are presented in Table 8. Noticeably, time played a major role in the
adoption decisions of the non-users, as 46.9% stated that insufficient time influenced their
decision to a great extent. Another important motive was lack of interest or motivation, which
56.3% of the non-users answered with somewhat, though this motive seemed not to have played
a key role as only 3.1% stated that it influenced their decision to a great extent. Lack of
information seemed to have hindered usage as well, since the answers somewhat and to a great
extent combined account for 43.7% of the answer possibilities. Finally, we can conclude that
the remaining motives (Dislike of technology, Dislike of method, Lack of skills or confidence,
Privacy, and Technical) played little to no role in the adoption decisions of the non-users.
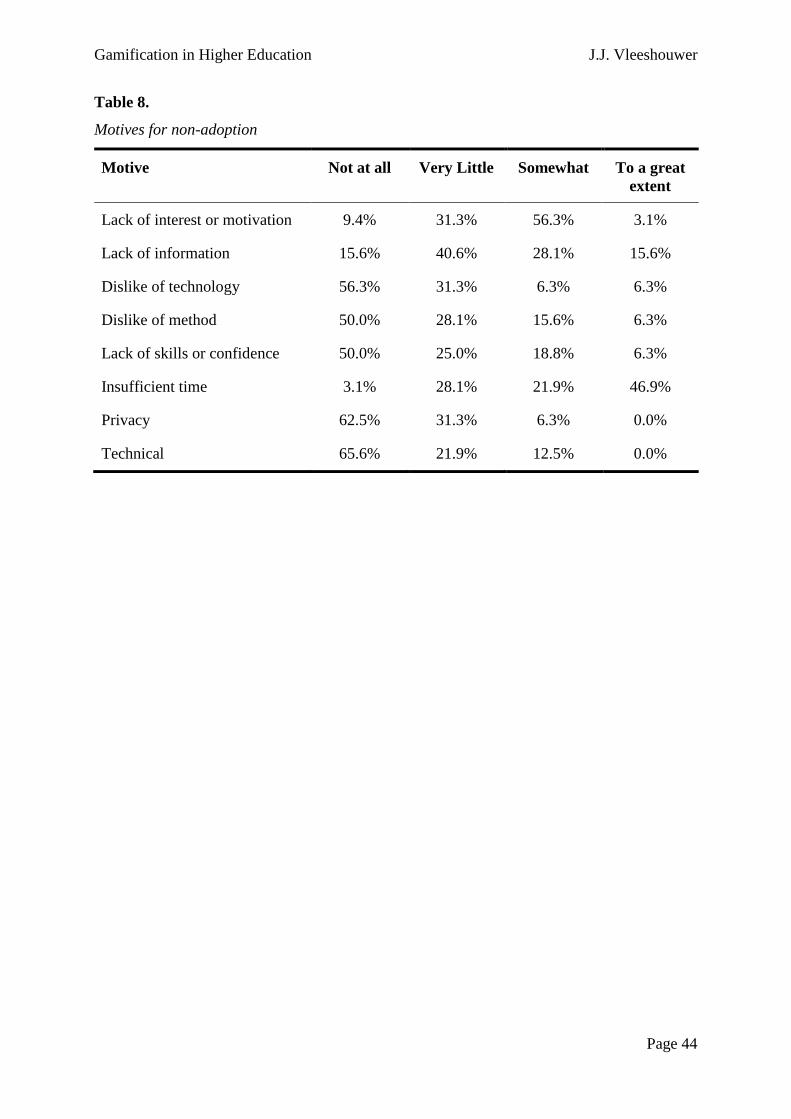
Gamification in Higher Education J.J. Vleeshouwer
Page 44
Table 8.
Motives for non-adoption
Motive Not at all Very Little Somewhat To a great
extent
Lack of interest or motivation 9.4% 31.3% 56.3% 3.1%
Lack of information 15.6% 40.6% 28.1% 15.6%
Dislike of technology 56.3% 31.3% 6.3% 6.3%
Dislike of method 50.0% 28.1% 15.6% 6.3%
Lack of skills or confidence 50.0% 25.0% 18.8% 6.3%
Insufficient time 3.1% 28.1% 21.9% 46.9%
Privacy 62.5% 31.3% 6.3% 0.0%
Technical 65.6% 21.9% 12.5% 0.0%
Gamification in Higher Education J.J. Vleeshouwer
Page 45
DISCUSSION
Main Findings - This exploratory study aimed to investigate the roles of Performance
Expectancy, Effort Expectancy, Social Influence, Facilitating Conditions, and Perceived
Enjoyment in explaining the Usage Intensity of a gamified e-learning application in a higher
educational setting. Data have been gathered through the use of a gamified e-learning
application that was designed and then implemented into a university statistics course. The
results provided in the previous section indicate that the conceptual model of this study (see
Figure 3) was not capable of explaining the adoption behaviour of students. Following the
multiple linear regression analysis, a significant correlation was found between Effort
Expectancy and Usage Intensity. This finding stresses the importance of the ease of use once
more: a gamified e-learning application that is too difficult to use will be used to a lesser extent
by its target users.
Consistent with previous information technology adoption literature, all hypotheses
regarding the interrelationships of the independent variables were supported. In addition, two
unexpected associations were found. First, Performance Expectancy showed a significant
correlation with Perceived Enjoyment, therefore suggesting that as the perceived usefulness of
a gamified e-learning application increases, the enjoyment derived from using the application
increases as well. Second, Performance Expectancy showed a significant correlation with
Social Influence (University). This finding seems to suggest that students are influenced by the
opinion of those representing the university: when teachers openly favour the use of the
gamified e-learning application, students are likely to perceive the application as more useful.
Understandably, if teachers show a less favourable attitude towards the use of a gamified e-
learning application, students will probably assume that the application will not benefit their
study performance.
Gamification in Higher Education J.J. Vleeshouwer
Page 46
Finally, this study found a significant difference between male and female users
regarding the Usage Intensity construct. After adoption had taken place, male students used the
gamified e-learning application to a greater extent compared to female students. This finding
seems to suggest that gamification methods are favoured by men, though future studies are
needed to validate this assumption.
Recommendations for Future Studies – Given the exploratory nature of this study,
we will proceed this discussion by reviewing our research design. The research question of this
study reads: Which factors explain the individual adoption of gamification in higher education?
Besides Effort Expectancy, none of the other constructs showed a significant association with
Usage Intensity. What led to these results? One possible explanation for these findings would
be a mismatch between the UTAUT model and gamification. In the theory section of this article,
we argued that users are more likely to assess gamification applications based on their hedonic
features. Given that Venkatesh et al. (2003) tested the UTAUT model with utilitarian systems
in workplace environments, the model might be less successful in explaining the adoption of
hedonic systems that are targeted for usage during leisure time. This is in line with van der
Heijden (2004), who concluded that the validity of the Technology Acceptance Model (Davis,
1986) could be threatened when applied to hedonic systems. However, since the Perceived
Enjoyment construct did not show a relationship with Usage Intensity, the solution of adding
more hedonic features as independent variables seems to be unjustified. In fact, we still hold on
to the idea that the UTAUT, with the addition of the Perceived Enjoyment construct, is capable
of explaining the adoption of gamified e-learning applications. After all, the nature of gamified
technologies is not purely hedonic nor is it utilitarian: it is a combination.
Gamification in Higher Education J.J. Vleeshouwer
Page 47
Another feature on which this study deviated from the original UTAUT model is the
conceptualization of the dependent variable. In the UTAUT model, Venkatesh et al. (2003)
measure usage as the “duration of use via system logs” (p. 438). Although this might give an
indication of the level of involvement users have with a system, we believe it does not cover all
aspects of usage behaviour. In this current study, Usage Intensity was constructed using three
metrics: the amount of logins (which can be seen as similar to the way usage was measured in
the study by Venkatesh et al.), the amount of activities performed, and the depth of use. The
addition of the latter two variables has provided us with a better understanding of usage
behaviour. To illustrate, without the depth of use metric, we would have not been capable of
distinguishing students active in the play environment from students who were merely using
practice environment functionalities. Hence, we recommend future studies to measure usage
behaviour in a similar approach.
Continuing our review of the dependent variable, something we thought was missing in
our conceptual model was the Attitude construct. This variable is often used as a predictor for
the Intention to Use (as is the case in the Technology Acceptance Model – see figure 1).
However, as we did not plan on measuring intentions but rather the actual usage of the students,
we decided to exclude the Attitude – Intention link from our conceptual model and replace it
by a single dependent variable: Usage Intensity. In hindsight, the Attitude construct would have
been a suitable variable to make comparisons between the users and non-users of this study.
The reason for this is that the Usage Intensity construct gives the same value to all non-users:
zero. When the degree of user participation is low, as was the case in this current study, the
Usage Intensity construct will hold many zero values, which may even lead to a skewed data
distribution. Hence, we advise future studies to include the Attitude construct into their research
models (e.g. as a predictor of Usage Intensity), as this is likely to give additional valuable insight
into the adoption motives of target users.
Gamification in Higher Education J.J. Vleeshouwer
Page 48
Next, an important finding that is relevant for future research is the contradiction found
within the Social Influence construct. The original Social Influence item scale by Venkatesh et
al. (2003) does not make a distinction between social groups. However, one can imagine that
different social groups exist that influence the behaviour of individuals. In the context of this
study, both teachers and fellow students are likely to influence the behaviour of individuals
regarding the use of the gamified e-learning application, yet the intent of these influences do
not need to be similar. This led to the decision to divide the Social Influence construct into two
distinct constructs: one that measured the influence of university representatives, and one that
measured the influence of fellow students. Evidently, this is not an idealistic approach as we
were forced to divide four items across two constructs, therefore threatening the validity of the
measurement. As a consequence, we recommend future studies to make this distinction
beforehand, using similar item scales to measure the two social groups separately.
In addition to the conceptual model used in this study, one might also argue that the
gamified e-learning application itself had influenced the results. After all, the analyses
performed in previous section are based upon the perceptions students have of InStaQuest.
Would the results have been different if the gamified application had been designed in a
different way? Most likely, but this should not influence the regression model itself. To
demonstrate: when a technology that is being studied is badly designed, the Effort Expectancy
construct should be able to explain the low levels of usage. Likewise, if a gamified e-learning
application is not entertaining, the Perceived Enjoyment construct should be capable of
explaining these findings. For that reason, we believe that the conceptual model used in this
study should be capable of explaining usage behaviour for both well and poorly designed
applications.
Gamification in Higher Education J.J. Vleeshouwer
Page 49
Nevertheless, what is directly influenced by the quality of design is the degree of user
participation. Understandably, (e-learning) applications which are poorly designed will be used
less by potential users. Given that out of the 114 students who formed the target group of
InStaQuest, only 27 had actually adopted the application, we have to ask ourselves: was
InStaQuest poorly designed? If we look at the average scores on Performance Expectancy,
Effort Expectancy and Perceived Enjoyment (see Table 7: Construct Comparison between
Users and Non-users), we find that InStaQuest was perceived as somewhat useful, easy to use
and enjoyable. Although there is room for improvement, we believe that the design of the
application was not the main cause for the low degree of participation.
One different, fundamental explanation, would be that university students are simply
not interested in learning methods that include game design elements. Results from our online
survey show some support for this claim, with 56.3% of the non-users stating that a lack of
interest or motivation was somewhat important in their decision to not use InStaQuest (see
Table 8: Motives for non-adoption). Contrariwise, dislike of technology and dislike of method
did not appear to be important motives for non-users. Hence, we cannot provide a definitive
answer for this matter. What we can clearly conclude from Table 8, is that insufficient time
played an important role. It appeared that students were too busy with other (study) tasks, which
one might expect of a university student. This also explains why the practice environment was
favoured over the play environment. Where the former only contained familiar game elements
that required no further explanation, the latter was built around a storyline, incorporating a lot
of text and images. Given the busy lifestyle of students, it is reasonable to assume that they did
not feel like reading the introduction and instruction texts which were found in the play
environment. In addition, these texts might have even scared some of the students off, as some
student responses seem to suggest (see Appendix C). Hence, these findings suggest that
gamification targeted at higher educational students should focus on fast-paced and easy-to-use
Gamification in Higher Education J.J. Vleeshouwer
Page 50
game mechanisms. While storylines are considered to be an important aspect of gamification,
we believe that these contribute less in higher educational settings. Moreover, writing narratives
can take up a lot of time, which in hindsight, could be better invested in creating other practice
functionalities.
Lastly, we would recommend future studies to control the added value of gamification.
This can be done by conducting experiments that include control groups. To illustrate, one could
have easily stripped off the game elements from the practice functionalities in this study,
leaving only the multiple choice questions without the points, levels and leaderboards. By
making a comparison between the two types of applications, one can acquire a better
understanding of the added value that gamification has on learning engagement.
Limitations and Future Research
This study had several limitations that should be taken in account. First and foremost,
the gamified e-learning application was not picked up by many students. This limitation was a
rather crucial one, as it led to several further limitations. First, the low amount of participants
made it necessary to adjust our measurement tool. Instead of using the gamified e-learning
application to measure the constructs of this study, an online survey had to be created that could
measure the perceptions of the non-users as well. In return, this method had its own limitations,
as non-users only received a description of the website (including screenshots). Evidently, we
can assume that students who have actually worked with InStaQuest were better capable of
evaluating the application compared to students who merely received a description. In addition,
many non-users turned out to be rather positive about InStaQuest, therefore disrupting our
hypotheses that non-users would evaluate the gamified e-learning application less favourable
compared to actual users. Consequently, this influenced the results of the multiple regression
analysis.
Gamification in Higher Education J.J. Vleeshouwer
Page 51
REFERENCES
AbuShanab, E., & Pearson, J. M. (2007). Internet banking in Jordan. Journal of Systems
and Information Technology, 78-97. doi:10.1108/13287260710817700
Ajzen, I., & Fishbein, M. (1975). Belief, attitude, intention, and behavior: An
introduction to theory and research. Reading, MA: Addison-Wesley.
Bouwman, H., van den Hooff, B., van de Wijngaert, L., & van Dijk, J. (2002).
Information & Communication Technology In Organizations. Amsterdam: Boom Uitgeverij.
Bruner, G. C., & Kumar, A. (2005). Explaining consumer acceptance of handheld
Internet devices. Journal of Business Research, 58(5), 553-558.
doi:10.1016/j.jbusres.2003.08.002
Chesney, T. (2006). An acceptance model for useful and fun information systems.
Human Technology, 2(2), 225-235.
Corrocher, N. (2011). The adoption of Web 2.0 services: An empirical investigation.
Technological Forecasting and Social Change, 78(4), 547-558.
doi:10.1016/j.techfore.2010.10.006
Davis, F. D. (1986). A technology acceptance model for empirically testing new end-
user information systems: Theory and results (Doctoral dissertation, Massachusetts Institute of
Technology).
Davis, F. D. (1992). Extrinsic and intrinsic motivation to use computers in the
workplace. Journal of Applied Social Psychology, 1111-1132.
Deterding, S., Dixon, D., Khaled, R., & Nacke, L. (2011, September). From game
design elements to gamefulness: defining gamification. In Proceedings of the 15th
International Academic MindTrek Conference: Envisioning Future Media Environments, 9-15.
doi: 10.1145/2181037.2181040
Gamification in Higher Education J.J. Vleeshouwer
Page 52
Domínguez, A., Saenz-de-Navarrete, J., De-Marcos, L., Fernández-Sanz, L., Pagés, C.,
& Martínez-Herráiz, J. J. (2013). Gamifying learning experiences: Practical implications and
outcomes. Computers & Education, 63, 380-392. doi:10.1016/j.compedu.2012.12.020
Erenli, K. (2012, September). The impact of gamification: A recommendation of
scenarios for education. In Interactive Collaborative Learning (ICL), 2012 15th International
Conference, 1-8. doi:10.1109/ICL.2012.6402106
Goehle, G. (2013). Gamification and Web-based homework. Primus, 23(3), 234-246.
doi:10.1080/10511970.2012.736451
Groh, F. (2012). Gamification: State of the art definition and utilization. In Proceedings
of the 4th Seminar on Research Trends in Media Informatics, 39-46. Presented at the 4th Seminar
on Research Trends in Media Informatics, Institute of Media Informatics, Ulm University.
Hamari, J., Koivisto, J., & Sarsa, H. (2014, January). Does gamification work? A
literature review of empirical studies on gamification. In System Sciences (HICSS), 2014 47th
Hawaii International Conference, 3025-3034. doi:10.1109/HICSS.2014.377
Hsu, C. L., & Lu, H. P. (2004). Why do people play on-line games? An extended TAM
with social influences and flow experience. Information & Management, 41(7), 853-868.
doi:10.1016/j.im.2003.08.014
Kim, Y.-M. (2010). Gender role and the use of university library website resources: A
social cognitive theory perspective. Journal of Information Science, 1-15.
doi:10.1177/0165551510377709
Lance, C. E., Butts, M. M., & Michels, L. C. (2006). The sources of four commonly
reported cutoff criteria what did they really say?. Organizational research methods, 9(2), 202-
220. doi:10.1177/1094428105284919
Lazzaro, N. (2004). Why we play games: Four keys to more emotion without story.
Retrieved from XEODesign: http://xeodesign.com/xeodesign_whyweplaygames.pdf
Gamification in Higher Education J.J. Vleeshouwer
Page 53
Lee, J. J., & Hammer, J. (2011). Gamification in education: What, how, why bother?.
Academic Exchange Quarterly, 15(2), 146-150
Lin, C. P., & Bhattacherjee, A. (2010). Extending technology usage models to
interactive hedonic technologies: A theoretical model and empirical test. Information Systems
Journal, 20(2), 163-181. doi:10.1111/j.1365-2575.2007.00265.x
McGonigal, J. (2011). Reality is broken: Why games make us better and how they can
change the world. New York: Penguin.
Moore, G. C., & Benbasat, I. (1991). Development of an instrument to measure the
perceptions of adopting an information technology innovation. Information systems research,
2(3), 192-222. doi:10.1287/isre.2.3.192
Morris, M.G., & Venkatesh, V. (2000). Age Differences in Technology Adoption
Decisions: Implications for a Changing Workforce. Personnel Psychology, 53, 375-403.
doi:10.1111/j.1744-6570.2000.tb00206.x
Mursalin, J. A. (2012). Information System Adoption and Usage: Validating UTAUT
Model for Bangladeshi SMES. BRAC University Journal, 15-24.
Nah, F. F. H., Telaprolu, V. R., Rallapalli, S., & Venkata, P. R. (2013). Gamification of
education using computer games. In Human Interface and the Management of Information.
Information and Interaction for Learning, Culture, Collaboration and Business, 99-107.
doi:10.1007/978-3-642-39226-9_12
Nakamura, J., & Csikszentmihalyi, M. (2002). The concept of flow. Handbook of
positive psychology, 89-105. doi:10.1007/978-94-017-9088-8_16
Nistor, N., Göğüş, A., & Lerche, T. (2013). Educational technology acceptance across
national and professional cultures: a European study. Educational Technology Research and
Development, 61(4), 733-749. doi:10.1007/s11423-013-9292-7

Gamification in Higher Education J.J. Vleeshouwer
Page 54
Oluchi, R. (2010). Impact of Gender and Nationality on Acceptance of a Digital Library:
An Empirical Validation of Nationality Based UTAUT Using SEM. Journal of Em erging
Trends in Com puting and I nform ation Sciences, 68-79.
Oshlyansky, L., Cairns, P., & Thimbleby, H. (2007, September). Validating the Unified
Theory of Acceptance and Use of Technology (UTAUT) tool cross-culturally. In Proceedings
of the 21st British HCI Group Annual Conference on People and Computers: HCI... but not as
we know it-Volume 2, 83-86. British Computer Society.
Padilla-Meléndez, A., del Aguila-Obra, A. R., & Garrido-Moreno, A. (2013). Perceived
playfulness, gender differences and technology acceptance model in a blended learning
scenario. Computers & Education, 63, 306-317. doi:10.1016/j.compedu.2012.12.014
Rodrigues, L. F., Costa, C. J., & Oliveira, A. (2013, July). The adoption of gamification
in e-banking. In Proceedings of the 2013 International Conference on Information Systems and
Design of Communication, 47-55. doi:10.1145/2503859.2503867
Rogers, E. (1962). Diffusion of Innovations. Glencoe: The Free Press.
Sun, H., & Zhang, P. (2006). The role of moderating factors in user technology
acceptance. International Journal of Human-Computer Studies, 64(2), 53-78.
doi:10.1016/j.ijhcs.2005.04.013
Terrill, B. (2008, June 16). My Coverage of Lobby of the Social Gaming Summit.
Retrieved from Bret on Social Games: http://www.bretterrill.com/2008/06/my-coverage-of-
lobby-of-social-gaming.html
Terzis, V., & Economides, A. A. (2011). Computer based assessment: Gender
differences in perceptions and acceptance. Computers in Human Behavior, 27(6), 2108-2122.
doi:10.1016/j.chb.2011.06.005
Van der Heijden, H. (2004). User acceptance of hedonic information systems. MIS
quarterly, 695-704.
Gamification in Higher Education J.J. Vleeshouwer
Page 55
Venkatesh, V. (2000). Determinants of Perceived Ease of Use: Integrating Control,
Intrinsic Motivation, and Emotion into the Technology Acceptance Model. Information
Systems Research, 342-365. doi:10.1287/isre.11.4.342.11872
Venkatesh, V., & Davis, F. D. (2000). A theoretical extension of the technology
acceptance model: Four longitudinal field studies. Management science, 46(2), 186-204. doi:
10.1287/mnsc.46.2.186.11926
Venkatesh, V., Morris, M. G., Davis, G. B., & Davis, F. D. (2003). User acceptance of
information technology: Toward a unified view. MIS quarterly, 425-478.
Wang, Y. S., & Shih, Y. W. (2009). Why do people use information kiosks? A
validation of the Unified Theory of Acceptance and Use of Technology. Government
Information Quarterly, 26(1), 158-165. doi:10.1016/j.giq.2008.07.001
Zichermann, G., & Cunningham, C. (2011). Gamification by design: Implementing
game mechanics in web and mobile apps. Sebastopol: O'Reilly Media.
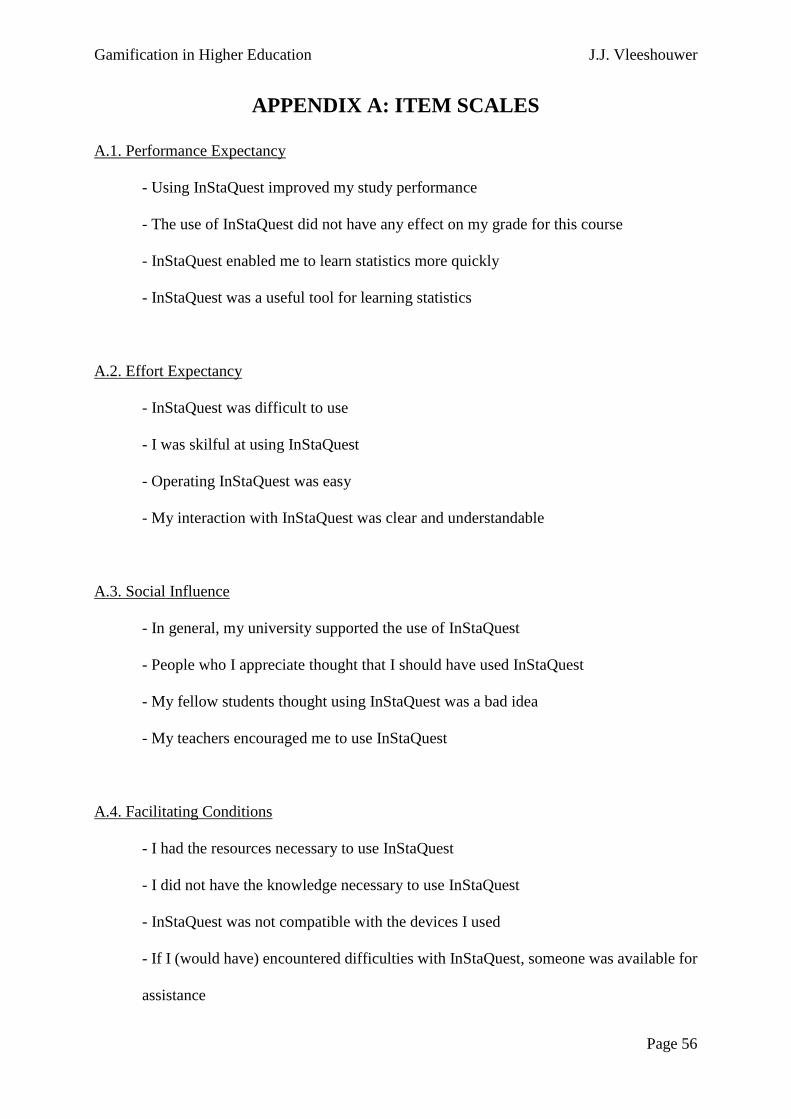
Gamification in Higher Education J.J. Vleeshouwer
Page 56
APPENDIX A: ITEM SCALES
A.1. Performance Expectancy
- Using InStaQuest improved my study performance
- The use of InStaQuest did not have any effect on my grade for this course
- InStaQuest enabled me to learn statistics more quickly
- InStaQuest was a useful tool for learning statistics
A.2. Effort Expectancy
- InStaQuest was difficult to use
- I was skilful at using InStaQuest
- Operating InStaQuest was easy
- My interaction with InStaQuest was clear and understandable
A.3. Social Influence
- In general, my university supported the use of InStaQuest
- People who I appreciate thought that I should have used InStaQuest
- My fellow students thought using InStaQuest was a bad idea
- My teachers encouraged me to use InStaQuest
A.4. Facilitating Conditions
- I had the resources necessary to use InStaQuest
- I did not have the knowledge necessary to use InStaQuest
- InStaQuest was not compatible with the devices I used
- If I (would have) encountered difficulties with InStaQuest, someone was available for
assistance
Gamification in Higher Education J.J. Vleeshouwer
Page 57
A.5. Perceived Enjoyment
- I experienced fun when I was using InStaQuest
- I found InStaQuest to be dull/boring
- It was exciting to use InStaQuest
- The actual use of InStaQuest was enjoyable
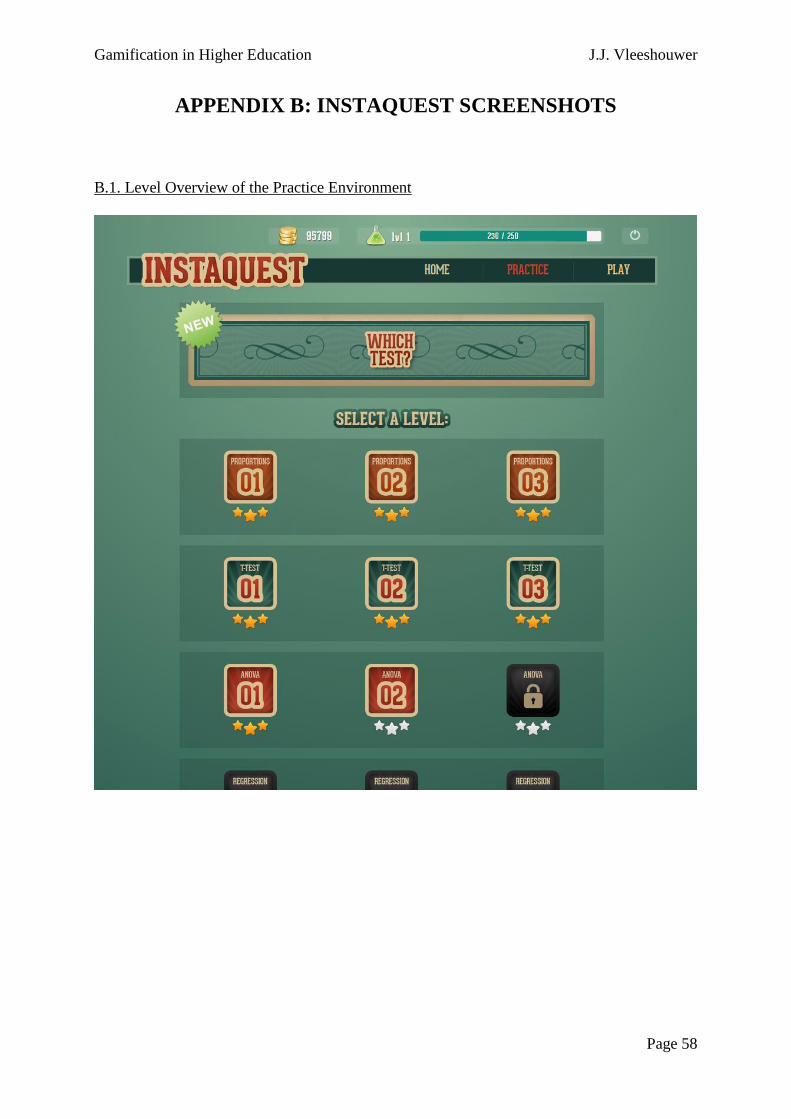
Gamification in Higher Education J.J. Vleeshouwer
Page 58
APPENDIX B: INSTAQUEST SCREENSHOTS
B.1. Level Overview of the Practice Environment
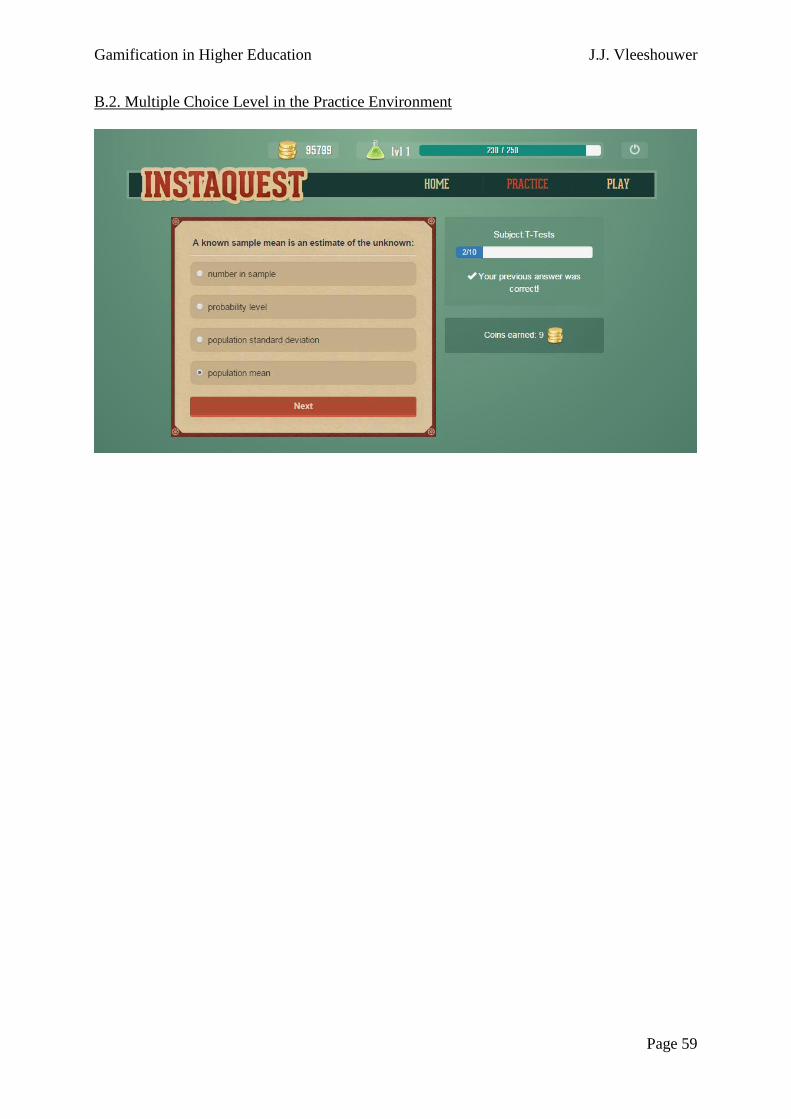
Gamification in Higher Education J.J. Vleeshouwer
Page 59
B.2. Multiple Choice Level in the Practice Environment
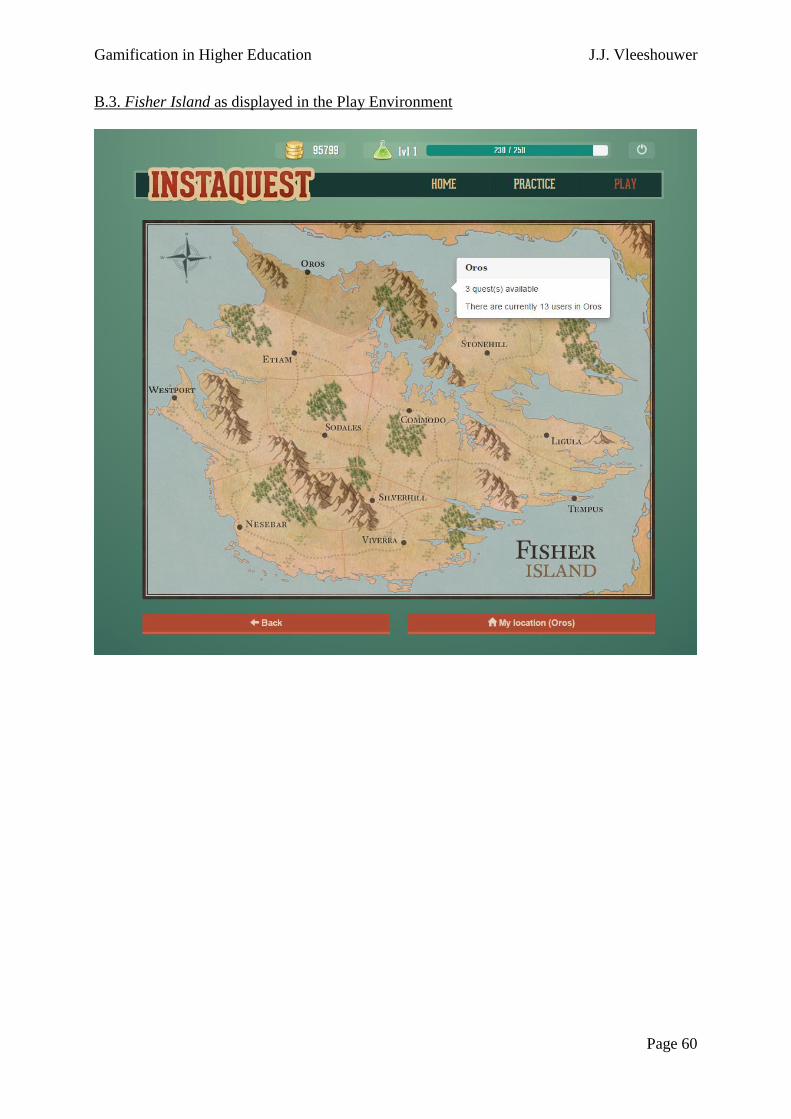
Gamification in Higher Education J.J. Vleeshouwer
Page 60
B.3. Fisher Island as displayed in the Play Environment
Gamification in Higher Education J.J. Vleeshouwer
Page 61
APPENDIX C: STUDENT RESPONSES
If it could be used a bit easier and has a bit more interactive features and help, it would have
been better.
--
There was too much text, while in reality, this is not the case.
--
I would have liked the possibility to start solving example formulas immediately... It takes
forever to get through the theory
--
You couldn’t view the right answer whenever a question was answered incorrectly. This way
you could just keep guessing until you found the right answer. I found the multiple choice
questions more useful compared to the tool in which you had to match a given problem with
an appropriate test.
--
In the 'which test to use' exercise the correct answer was not given. I didn't understand
quickly were to start with the quests so I did not do this. It took too long to figure out.
--
It sure looks like it could have been helpful and actually fun too, but with limited time I
wanted to stick to what I was sure of would be in the test. Perhaps you could offer InStaQuest
as an (optional) course for students who are thinking about transferring to the University. I
think it could be a relatively easy and fun way to get introduced to statistics on a high
educational level.
--
The experience was enjoyable and a learning journey.
Gamification in Higher Education J.J. Vleeshouwer
Page 62
I could only see which questions I had wrong, not the correct answers for these questions. I
would have liked it more if I could just see the correct answers afterwards.
--
During the tutorials it was said that making the exercises was sufficient to pass the exam.
--
The overview was not very clear. The steps to take were not very clear. Way too much text. I
would consider less text and more obvious way to show what you need to do next.
--
Maybe if the tool was introduced earlier, and in the lectures, I would have tried it.


