Máster en Rehabilitación Visual
Functional Asymmetry in Macular Area
in Patients with Pathological Myopia
Using Microperimetry
Final Project of the Master
Medicine Faculty
Zeyad A. Alzaben
Directed by:
Dr. Miguel J. Maldonado
Dr. Ahmad Zaben Omran
Valladolid 2015
AAUUTTOORRIIZZAACCIIÓÓNN DDEELL TTUUTTOORR PPAARRAA LLAA EEXXPPOOSSIICCIIÓÓNN PPÚÚBBLLIICCAA
DDEELL TTRRAABBAAJJOO DDEE FFIINN DDEE MMÁÁSSTTEERR
(Art. 6.2 del Reglamento del la UVA sobre la Elaboración y Evaluación del Trabajo Fin de Máster)
D. Dr. Miguel J. Maldonado en calidad de Tutor / a del alumno
D. Zeyad A. Alzaben
Del Máster en: Rehabilitación Visual
Curso académico: 2013/2015
CERTIFICA haber leído la memoria del Trabajo de Fin de Máster titulado “Functional Asymmetry in Macular Area in Patients with Pathological Myopia Using Microperimetry” y estar de acuerdo con su exposición pública en la convocatoria de julio
En Valladolid, 14 de julio de 2015
Vº Bº
Fdo.:
El Tutor
AAUUTTOORRIIZZAACCIIÓÓNN DDEELL TTUUTTOORR PPAARRAA LLAA EEXXPPOOSSIICCIIÓÓNN PPÚÚBBLLIICCAA
DDEELL TTRRAABBAAJJOO DDEE FFIINN DDEE MMÁÁSSTTEERR
(Art. 6.2 del Reglamento del la UVA sobre la Elaboración y Evaluación del Trabajo Fin de Máster)
D. Dr. Ahmad Zaben Omran en calidad de Tutor / a del alumno
D. Zeyad A. Alzaben
Del Máster en: Rehabilitación Visual
Curso académico: 2013/2015
CERTIFICA haber leído la memoria del Trabajo de Fin de Máster titulado “Functional Asymmetry in Macular Area in Patients with Pathological Myopia Using Microperimetry” y estar de acuerdo con su exposición pública en la convocatoria de julio
En Valladolid, 14 de julio de 2015
Vº Bº
Fdo.:
El Tutor
Acknowledgements
I would never have been able to finish my dissertation without the guidance of my coordinators,
help from friends, and support from my family.
I would like to express my deepest gratitude to my advisor Dr. Miguel J. Maldonado for his excellent
guidance, caring, and patience. I would like to thank Dr. Ahmad Zaben who as a good friend, was
always willing to help and give his best suggestions, and providing me with an excellent atmosphere
for doing the research. Thanks to Dr. Genís Cardona, who was qualifying my skills, as a scientific
investigator.
I would also like to thank Dana N. Koff, Izdihar Alsalman, Mayy Bakkar, Suha Abu Saif, Samah Abu
Mokh, and Areej Otum that have qualified me passing from the Bachelor degree to the Master
degree.
Thanks to Optipunt Zaben Eye Clinic (Figueres) for the contribution of collecting the data for this
study.
Thanks to Ayman Bsharat and Osama Ben Zaid who were cheering me up and stood by me through
the good times and bad.
Thanks to my fabulous team in Spain who have worked hard to bring my skills into this level: Aurora
Torrents, Eulalia Sánchez, Montserrat Morató, Vanesa Budi, Mónica Hernández, Ferran Casals, Dr.
Xavier Corretger, Dr. Sanchez Dalmau, the other partners in the Hospital Clínic de Barcelona, and to
Dr. Begoña Coco Martin in IOBA.
Extra special thanks to my former teacher, Fatiha Assaf. Finally to my close family: my parents, my
sisters Alia & Basmalah, my uncles and my grandparents.
To all,
Thanks
1
ABSTRACT
Introduction: Microperimetry is a clinical innovation to evaluate the retinal sensitivity.
In this study, we explored the inter-ocular retinal variations of retinal sensitivity in the
macular area in patients with pathological myopia.
Methods: A transversal study was designed in which the macular sensitivity (Expert
exam protocol) of MAIATM microperimeter was employed to evaluate the functional
variations of 10° in macular areas in patients affected by pathological myopia using 37
points strategy, in a sample of 36 persons aged between 13 and 60 years (spherical
equivalent from -6.00 to -16.00 diopters). Inter-ocular asymmetry values were
determined and compared with previous published tolerance values by means of a
paired t test, and the interocular differences were calculated as the 2.5th and the 97.5th
percentiles.
Results: The interocular difference tolerance limits for central sensitivity of the macula
was 5.45 dB in patients affected by pathological myopia. Statically significant differences
were found between males and females in the asymmetry of the central ring and the
second ring of retinal sensitivity (SC and S2). There was a significant positive correlation
between the retinal sensitivity and the spherical equivalent, and a weak correlation
between the retinal sensitivity and the fixation level. Also we encountered significant
positive correlation in retinal sensitivity between the central ring and the third ring (SC
and S3).
Conclusions: A general reduction in the central and average retinal sensitivity in eyes
with pathological myopia is expected to be more marked with increasing ametropia.
Considering inter-ocular asymmetry in central and average retinal sensitivity should
help understand better the retinal features of patients with pathological myopia, for
which establishing normative percentile values should prove a useful tool.
2
RESUMEN
Introducción: la microperimetría es una innovación clínica para evaluar la sensibilidad de la
retina. En este estudio, se evaluó las variaciones de la sensibilidad de la retina en el área
macular entre ambos ojos en pacientes con miopía patológica.
Métodos: se diseñó este estudio transversal para evaluar la sensibilidad de la retina, en los
que se empleó examen expert test y estrategia 37 puntos dentro de los 10° del
microperímetro MAIATM, para evaluar las variaciones funcionales en áreas maculares en
pacientes con miopía patológica, en una muestra de 36 personas con edades comprendidas
entre (13 y 60 años) equivalente esférico (-6,00 y 16,00 Dioptrias). Los valores de asimetría
Intraoculares se determinaron y se compararon como se realizó en estudios previos, los
valores de tolerancia por medio de una prueba t pareada y las distribuciones porcentuales
de las diferencias entre los ojos derecho e izquierdo, se calcularon para 2.5th y 97.5th.
Resultados: El límite de tolerancia de las diferencias entre los ojos derechos e izquierdos de
sensibilidad central de la mácula fue de 5,45 dB en pacientes afectados por la miopía
patológica. Estáticamente se encontraron diferencias significativas entre los hombres y las
mujeres y asimetría en el anillo central y el segundo anillo de la sensibilidad retiniana (SC y
S2). Existe una correlación positiva significativa entre la sensibilidad de la retina y el
equivalente esférico, y la correlación débil entre la sensibilidad de la retina y el nivel de
fijación. También nos encontramos correlación positiva significativa en la sensibilidad
retiniana entre la región central y el tercer anillo (SC y S3).
Conclusiones: Hay una reducción general de la sensibilidad retiniana central y media en
ojos con miopía patológica y su valor aumenta con la cantidad de la ametropía.
Teniendo en cuenta la asimetría inter-ocular en la sensibilidad retiniana central y media,
y los valores de los percentiles es una herramienta útil que debe ayudar a comprender
mejor las características de la retina de los pacientes con miopía patológica.

3
Contents
1. Introduction .............................................................................................................................. 4
1.1 Pathological Myopia ............................................................................................................... 4
...................................................................................................................................................... 6
1.2 Microperimetry ....................................................................................................................... 7
1.2.1 Types of Microperimetry ................................................................................................. 9
1.2.2 Clinical Implications ....................................................................................................... 14
1.2.3 Microperimetry in Pathological Myopia ........................................................................ 15
2. Justification............................................................................................................................. 18
3. Hypothesis .............................................................................................................................. 18
4. Objectives ............................................................................................................................... 18
5. Methods ................................................................................................................................. 19
5.1 Study Design ......................................................................................................................... 19
5.2 Patients ................................................................................................................................. 19
5.3 Examination .......................................................................................................................... 19
5.4 Statistical Analysis ................................................................................................................ 22
6. Results .................................................................................................................................... 23
6.1 Descriptive Statistics of Controlled Variables ....................................................................... 23
6.2 Descriptive Statistics of Controlled Variables (Macular Sensitivity) ..................................... 23
7. Discussion ............................................................................................................................... 30
8. Conclusions ............................................................................................................................. 33
9. Bibliography ............................................................................................................................ 34
10. Annexes: ............................................................................................................................. 36
ANNEX I. INFORMED CONSENT .................................................................................................. 36
4
1. Introduction
1.1 Pathological Myopia
It is evident that, impaired vision can be caused by various diseases, accidents or
congenital malformations; in all cases it is a chronic, irreversible condition, thus, it is
essential to know how to evaluate patients presenting these visual alterations, ocular
diseases, how visual function is altered, and the treatment options (Maduka Okafor et
al., 2009)(Saw, 2006).
Within this context, we are talking about the pathological myopia, which is a chronic,
irreversible disease with great social and economic burden. It is one of the leading
causes of blindness in industrialized countries and their effects affect young people,
within the working age. In Spain, is the first reason to get the membership of the
National Organization of Spanish Blind in anis r ani a i o a ional de ie os
Españoles or ONCE) (Wong et al., 2015) (Saxena et al., 2015).
We must recognize that, this pathological myopia is characterized by a progressive
elongation of the anteroposterior axis of the eye (which does not stop at the end of the
growth age), usually has high refractive power of -6.00 diopters and ocular axial length
of 26 mm. Therefore, various changes occur in the optic nerve, sclera, choroid, and
retina, being significantly thinner than normal (Flores-Moreno et al., 2013).
Degenerative changes that occur in eyes affected by pathological myopia in the macular
region and outside the macula, have no clear pathogenesis, but it is believed that,
according to different theories, they are secondary to biomechanical alterations or
hereditary (degenerative) factors with the presence of some signs as myopic cone,
tigroid fundus appearance, lacquer cracks, focal chorioretinal atrophy, etc. (McBrien et
al., 2009).
5
Figure 1.2 Tigroid fundus in degenerative myopia (From: usa.nidek.com)
Figure 1.3 Lacquer cracks (From: imagebank.asrs.org)
Figure 1.4 Posterior staphyloma (From: www.kellogg.umich.edu)
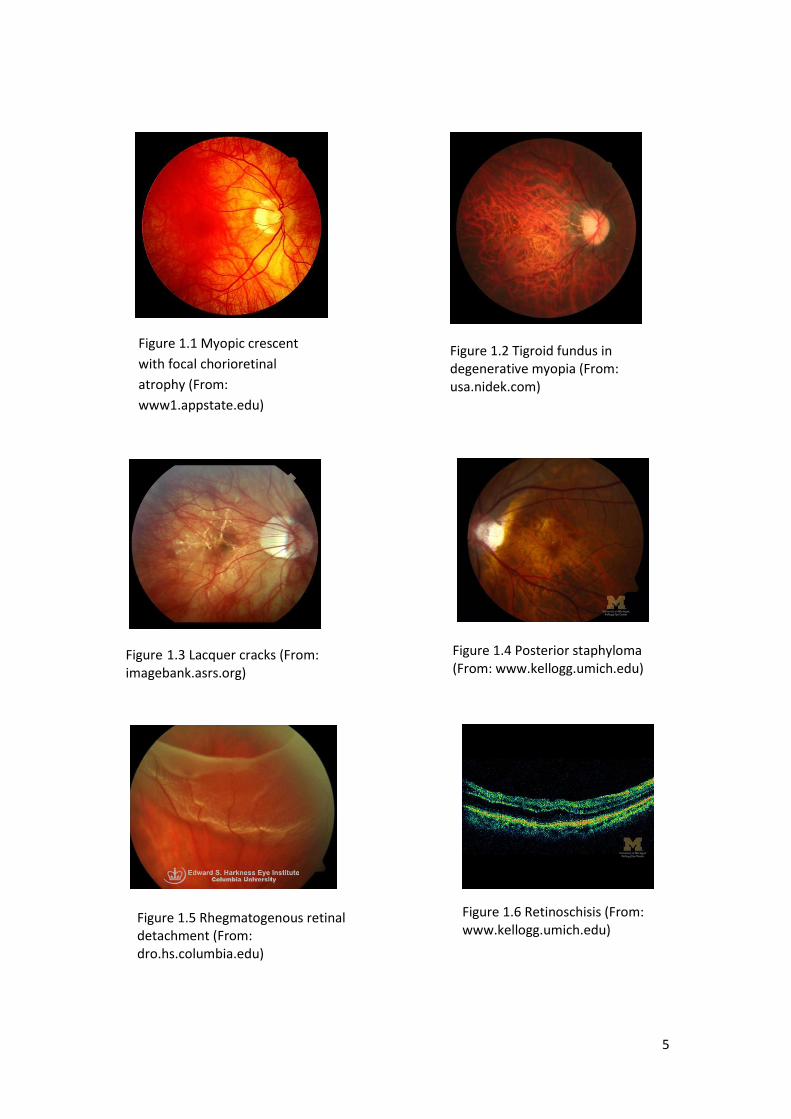
Figure 1.5 Rhegmatogenous retinal detachment (From: dro.hs.columbia.edu)
Figure 1.6 Retinoschisis (From: www.kellogg.umich.edu)
Figure 1.1 Myopic crescent
with focal chorioretinal
atrophy (From:
www1.appstate.edu)
6
Pathological Myopia
Myopia > 6.00 D
Axial length > 26 mm
Signs
* Biomechanical theory
* Degenerative (hereditary) theory
Symptoms
- Staphyloma
- Tigroid fundus appearance
- Peripapillary atrophy
- Decreased VA
- Scotomas
- Metamorphopsia
- Decreased nocturnal vision
- Rhegmatogenous retinal detachment
- Retinoschisis
- Focal chorioretinal atrophy
- Lacquer cracks
-Myopic subretinal neovascular membrane
Complications
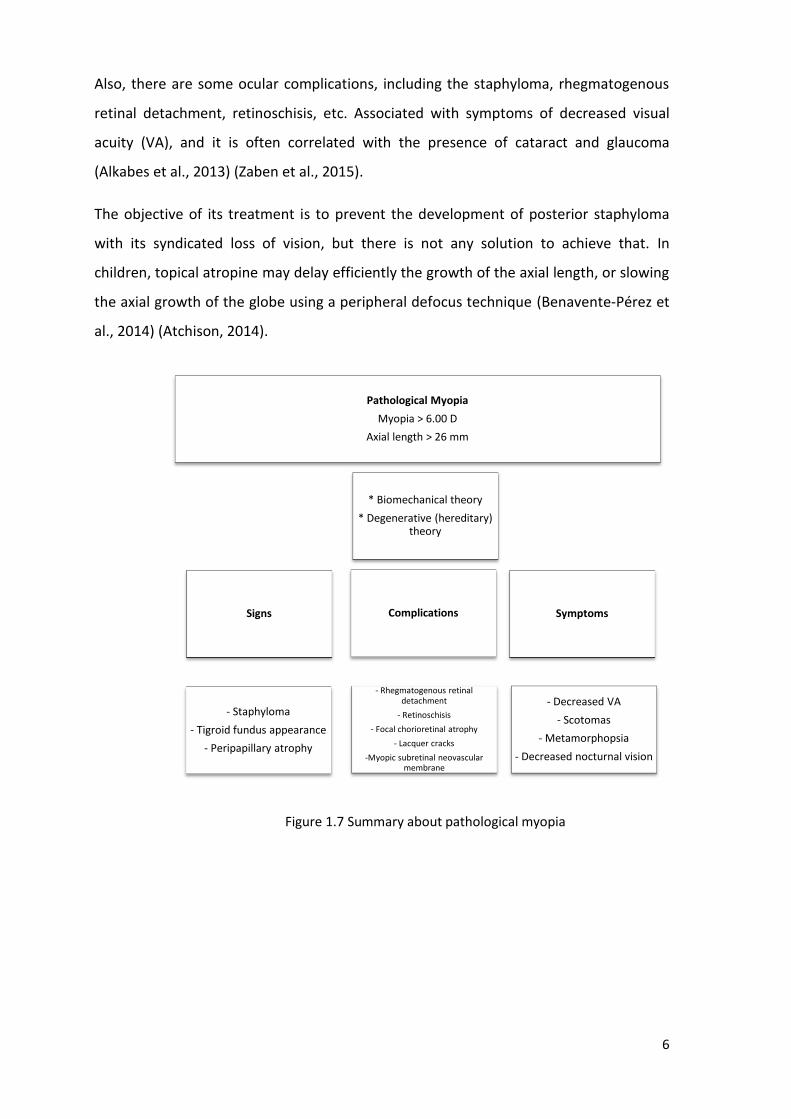
Also, there are some ocular complications, including the staphyloma, rhegmatogenous
retinal detachment, retinoschisis, etc. Associated with symptoms of decreased visual
acuity (VA), and it is often correlated with the presence of cataract and glaucoma
(Alkabes et al., 2013) (Zaben et al., 2015).
The objective of its treatment is to prevent the development of posterior staphyloma
with its syndicated loss of vision, but there is not any solution to achieve that. In
children, topical atropine may delay efficiently the growth of the axial length, or slowing
the axial growth of the globe using a peripheral defocus technique (Benavente-Pérez et
al., 2014) (Atchison, 2014).
Figure 1.7 Summary about pathological myopia
7
1.2 Microperimetry
In order to assess the functional vision of the macula, various tests were used like visual
acuity test, Amsler grid test, speed reading test, and contrast sensitivity test.
Microperimeter has become more advanced than all of these, in which there are stimuli
projected on the retinal surface precisely using eye tracking technology. Microperimetry
is a subjective psychophysiological test to measure the retinal sensitivity using
simultaneous imaging technique to track the retina, in order to calculate the correlation
between the structure and the function of the macula (Virgili et al., 2015) (Chui et al.,
2014) (Markowitz and Reyes, 2013).
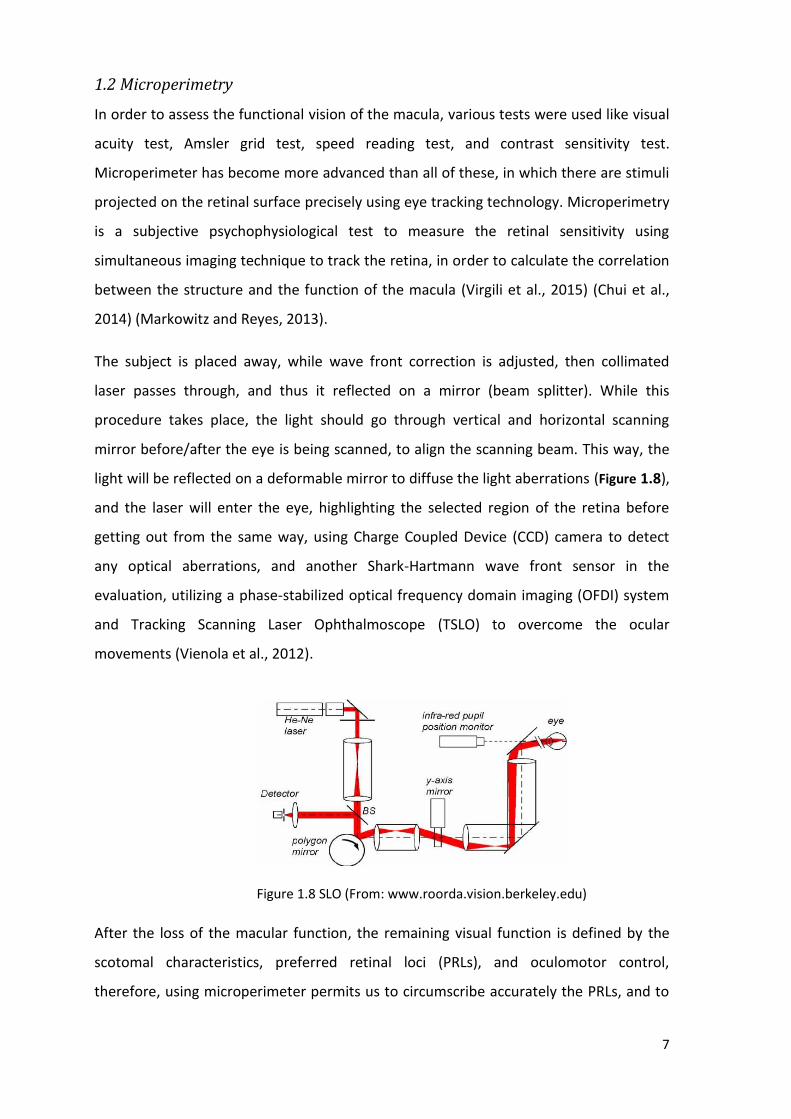
The subject is placed away, while wave front correction is adjusted, then collimated
laser passes through, and thus it reflected on a mirror (beam splitter). While this
procedure takes place, the light should go through vertical and horizontal scanning
mirror before/after the eye is being scanned, to align the scanning beam. This way, the
light will be reflected on a deformable mirror to diffuse the light aberrations (Figure 1.8),
and the laser will enter the eye, highlighting the selected region of the retina before
getting out from the same way, using Charge Coupled Device (CCD) camera to detect
any optical aberrations, and another Shark-Hartmann wave front sensor in the
evaluation, utilizing a phase-stabilized optical frequency domain imaging (OFDI) system
and Tracking Scanning Laser Ophthalmoscope (TSLO) to overcome the ocular
movements (Vienola et al., 2012).
After the loss of the macular function, the remaining visual function is defined by the
scotomal characteristics, preferred retinal loci (PRLs), and oculomotor control,
therefore, using microperimeter permits us to circumscribe accurately the PRLs, and to
Figure 1.8 SLO (From: www.roorda.vision.berkeley.edu)
8
estimate the consequences of some diseases or interventions on the retinal surface
(Nguyen et al., 2007).
The main categories of its functions are to evaluate:
- The glaucomatous damage of the residual visual function
- The visual function
Standard automated perimetry (SAP) is a commonly used method in our
Ophthalmological assessments, but it has clinical limitations, where we can find the grey
grid has little reliability, and patients with cataracts could present shades that do not
mean always a glaucomatous damage (Alencar and Medeiros, 2011).
Beyond, in addition to the SAP, different clinical methods were applicable to assess the
functional vision, like confrontational visual field test, Amsler grid test, and Tangent
screen test.
In patients with central visual field loss, it is better to analyse the functional central
vision using the appropriate test, while monitoring the retina at the same time to get
precise measurements, like so, this property is available using fundus related perimetry,
in order to know the stimulus presented in each specific retinal point, letting us to
correct the instable fixation or the instable central vision (Nguyen et al., 2009).
We can apply visual acuity test at the maximum contrast level, or other conventional
test to check the functional central vision, but they are limited in the existence of
macular diseases or in the elderly. Even though, speed reading test and contrast
sensitivity test enable us to evaluate the improved visual function after the medical
intervention.
Microperimeter provides the examiner a retinal sensitivity ma to onfirm t e atient’s
capacity to see luminance stimuli of different levels of intensity, and in various positions
in the examined retinal area.
The first fundus related microperimeter was Scanning Laser Ophthalmoscope (SLO-101)
microperimeter (Rodenstock, Munich) to evaluate the functional vision in the macular
region, using a fixation protocol of foveal or extrafoveal, and the stability of
stable/instable fixation. Then Nidek MP1 microperimeter was commercially available,
9
which allows automated eye tracking at the same retinal loci, using an infrared camera
of the fundus with a resolution of 768 x 576 pixels, and 45° of visual field (Dunbar et al.,
2010).
Also, there are physical features of the automated microperimetry, such as extreme
resolution (until 10 stimuli / degree), short duration of the examination
(microperimetry, retinography, and analysis of the fixation occur simultaneously),
quantification of the retinal sensitivity, automated eye tracking, scotometry, and
peripapillary microperimetry (to follow-up glaucomatous cases).
1.2.1 Types of Microperimetry
Microperimetry is a non-invasive, in-vivo, functional test, allows us to analyse the retinal
sensitivity with special extreme resolution, regardless of any ocular movements during
the examination, using a controlled projected method of the stimuli.
In this research, we are reviewing briefly the advantages of the microperimeter in the
detection and follow-up of various macular pathologies, using MAIATM (Macular Integrity
Assessment) – CenterVue, Padova, Italia.
a. MP-1 Microperimeter
The first microperimeter was integrated from Nidek Technologies in 2002, Italy. This
type uses infrared (IR) camera in order to image the retina, and the stimuli are projected
on a LCD screen inside the device, performing the retinal follow-up automatically. This
conventional camera gives coloured image of the retina, and this type involves various
visual field patterns including a grid 10-2, macular grids, and optimized patterns in the
retina.
This type could be individualized by reflecting off each stimulus at a certain area,
changing the size of the stimulus, and the fixation points. It allows the examiner to do
the conventional kinetics perimetry, selecting manually the exact retinal area, and by
selecting the follow-up mode, we can perform longitudinal studies to do easily test-
retest of variability, as well as the range of retinal sensitivity using this instrument is (0-
20 dB) which equals to )14-34 dB) using Humphrey perimeter (Wu et al., 2014).
Vujosevic et al. find that the microperimetry is relatively good in patients with retinal
10
fixation impairment due to the existence of diabetic macular oedema, showing the
location of the fixation and its stability (Vujosevic et al., 2008).
Using this instrument, we should dilate the pupil, despite of it is difficult to capture a
clear retinal image (the maximum luminance of 130 cd/m2), but it overcomes the
artefacts of SLO-101, and in comparison with Humphrey perimeter (the maximum
luminance of 3183 cd/m2), in addition due to the low dynamic range of the screen, the
dimmest stimulus is only 1% of t e bri test tar et’s intensity (Crossland et al.,
2012)(Rohrschneider et al., 2008).
b. OCT – SLO (OPKO, Miami, Florida, USA)
It combines OCT with the analysis of microperimeter based on laser ophthalmoscope
principle, which means, that there is no need to dilate the pupil, giving higher quality of
the retinal image. The maximum intensity of the stimulus is similar to MP-1 (137 cd/m2)
having a low dynamic range of screen too (2%).
c. MAIATM Microperimeter
Utilizing this type of microperimeter permits us to capture a retinal image of 36° X 36°
field of view, with a resolution of 1024 X 1024 pixels, penetrating 25 microns of the
retina using the light source of infrared superluminance of about 850 nm wavelength.
The projection of the image occurs in 25 femtosecond, with a working distance of 30
mm using a standard perimetry test of macular protocol of 10° over a visual field of
macular area, which equals to 20° X 20°. The follow-up velocity equals to 25 Hz,
performing the assessment with stimulus size of Goldmann III, a background luminance
of 4 asb (or apostilb, which is an old unit of luminance), dynamic range of its stimuli of
36 dB, and a maximum luminance of 1000 asb.
The utility of MAIATM requires a minimum diameter of the pupil of 2.5 mm, with a focus
range from -15.00 to +10.00 D, which can focus and recognize the eye (right / left)
automatically. It uses a laser scan to capture the retinal image projecting a light LED
stimulus.
11
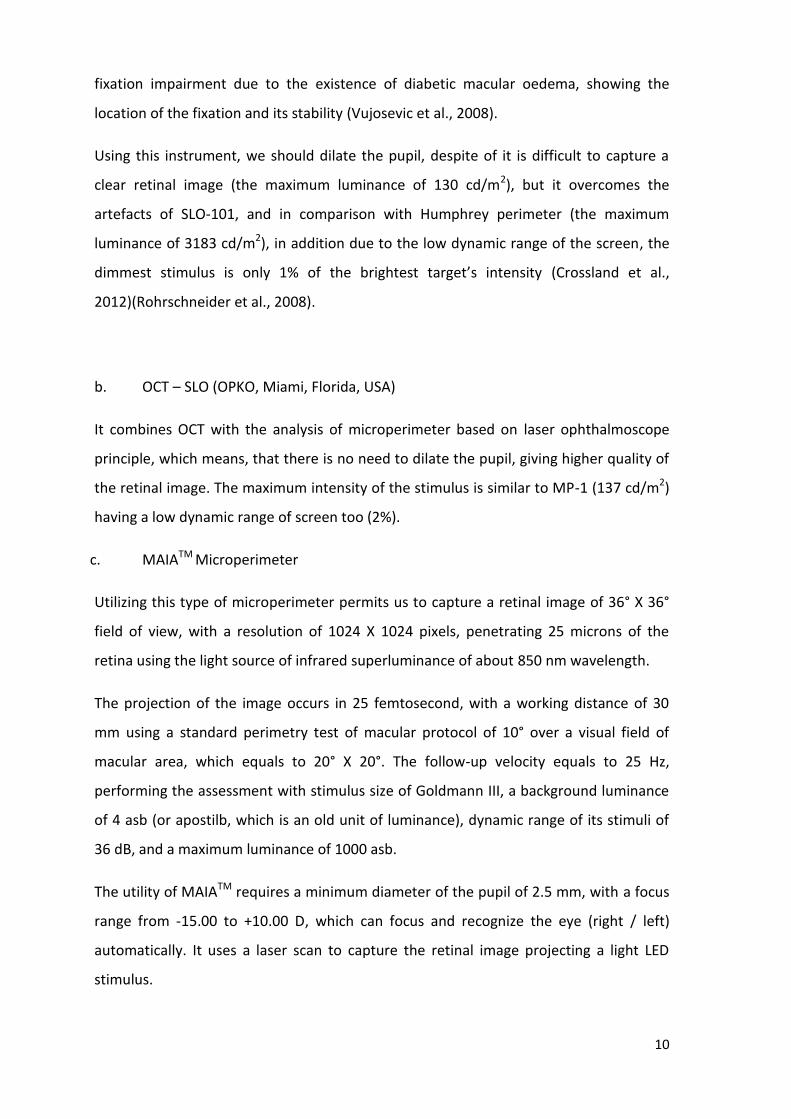
Examination types of this device are:
1. Fast exam: Doing a rapid evaluation of the macular sensitivity and the fixation
stability, figuring out if the results are within the normal range or not, taking 2-3
minutes for each eye.
2. Expert exam: Realizing a complete assessment in order to determine the macular
sensitivity and the fixation stability, notifying the examiner if the results are
within normal limits or not, taking 4-7 minutes for each eye.
3. Follow-up exam: This test is only available if we did one of the previous tests,
repeating the test of the expert type of examinations, while reading the same
points, as a reference.
Figure 1.9 Expert exam microperimetry’s (MAIATM) printout in normal subject; the top left represents SLO image of the fundus, the top right represents sensitivity values and PRL, the histogram represents threshold values in grey compared with normal distribution in green.
12
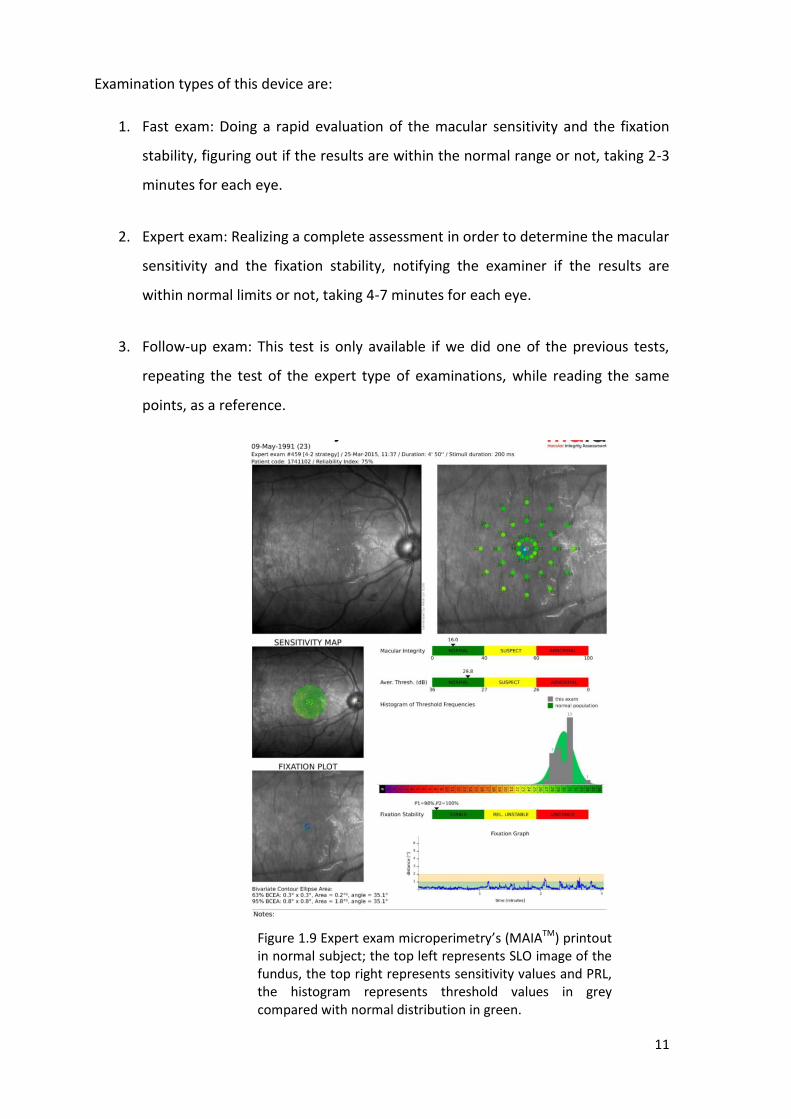
The colour coded scale:
- Green: seen to 27 dB (27 dB represents 90 percentile of normal values)
- Yellow: seen to 25 dB (25 dB represents 97 percentile of normal values)
- Red: Did not see to 25 dB
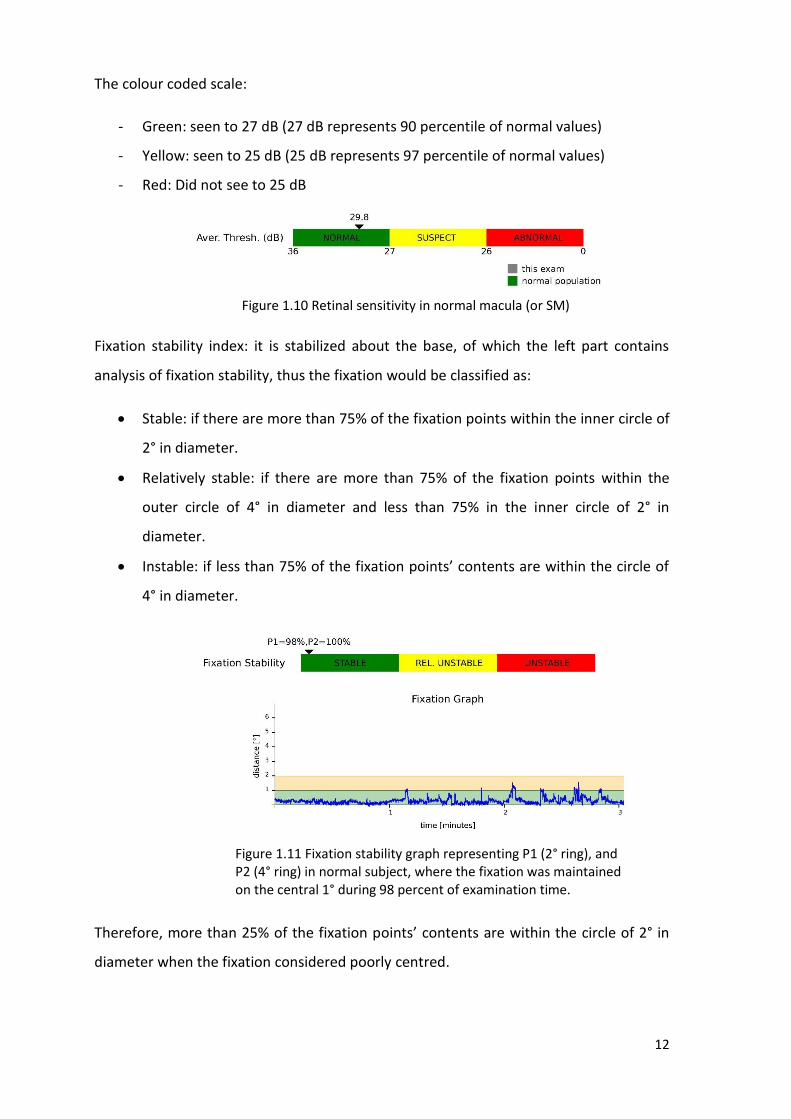
Fixation stability index: it is stabilized about the base, of which the left part contains
analysis of fixation stability, thus the fixation would be classified as:
Stable: if there are more than 75% of the fixation points within the inner circle of
2° in diameter.
Relatively stable: if there are more than 75% of the fixation points within the
outer circle of 4° in diameter and less than 75% in the inner circle of 2° in
diameter.
Instable: if less t an 75% of t e fixation oints’ ontents are wit in t e ir le of
4° in diameter.
Therefore, more than 25% of the fixation points’ ontents are wit in t e ir le of 2° in
diameter when the fixation considered poorly centred.
Figure 1.11 Fixation stability graph representing P1 (2° ring), and P2 (4° ring) in normal subject, where the fixation was maintained on the central 1° during 98 percent of examination time.
Figure 1.10 Retinal sensitivity in normal macula (or SM)
13
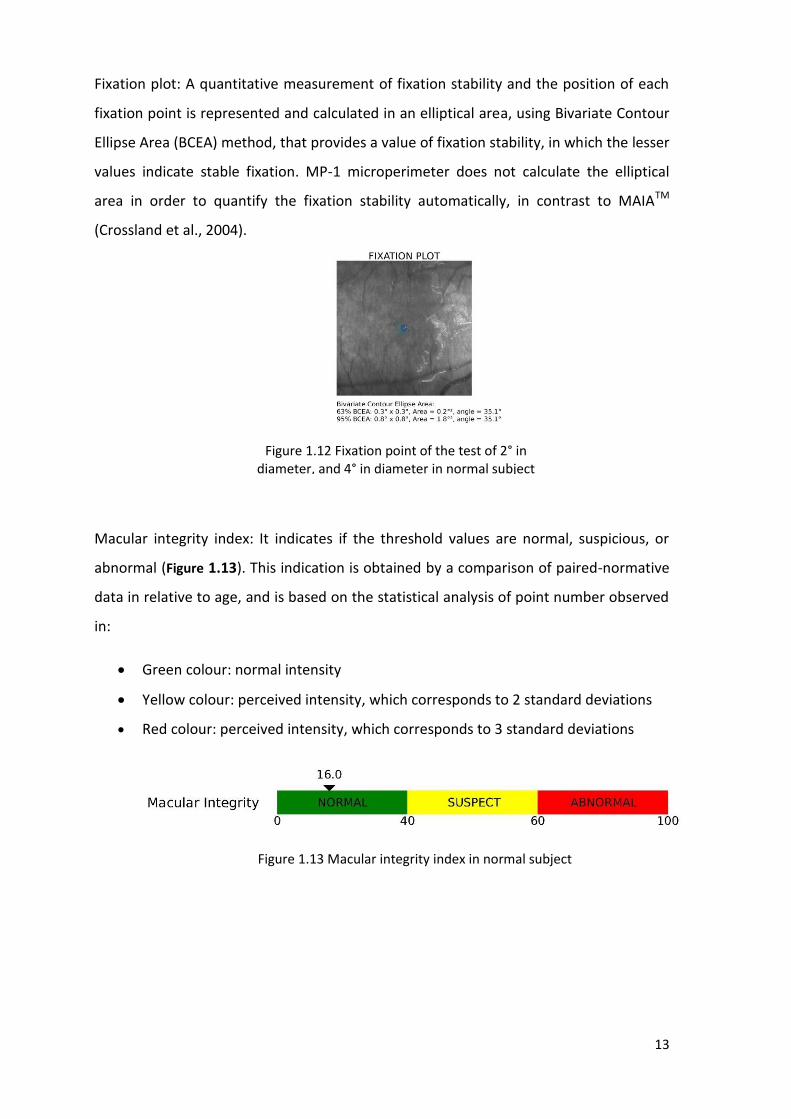
Fixation plot: A quantitative measurement of fixation stability and the position of each
fixation point is represented and calculated in an elliptical area, using Bivariate Contour
Ellipse Area (BCEA) method, that provides a value of fixation stability, in which the lesser
values indicate stable fixation. MP-1 microperimeter does not calculate the elliptical
area in order to quantify the fixation stability automatically, in contrast to MAIATM
(Crossland et al., 2004).
Macular integrity index: It indicates if the threshold values are normal, suspicious, or
abnormal (Figure 1.13). This indication is obtained by a comparison of paired-normative
data in relative to age, and is based on the statistical analysis of point number observed
in:
Green colour: normal intensity
Yellow colour: perceived intensity, which corresponds to 2 standard deviations
Red colour: perceived intensity, which corresponds to 3 standard deviations
Figure 1.13 Macular integrity index in normal subject
Figure 1.12 Fixation point of the test of 2° in diameter, and 4° in diameter in normal subject
14
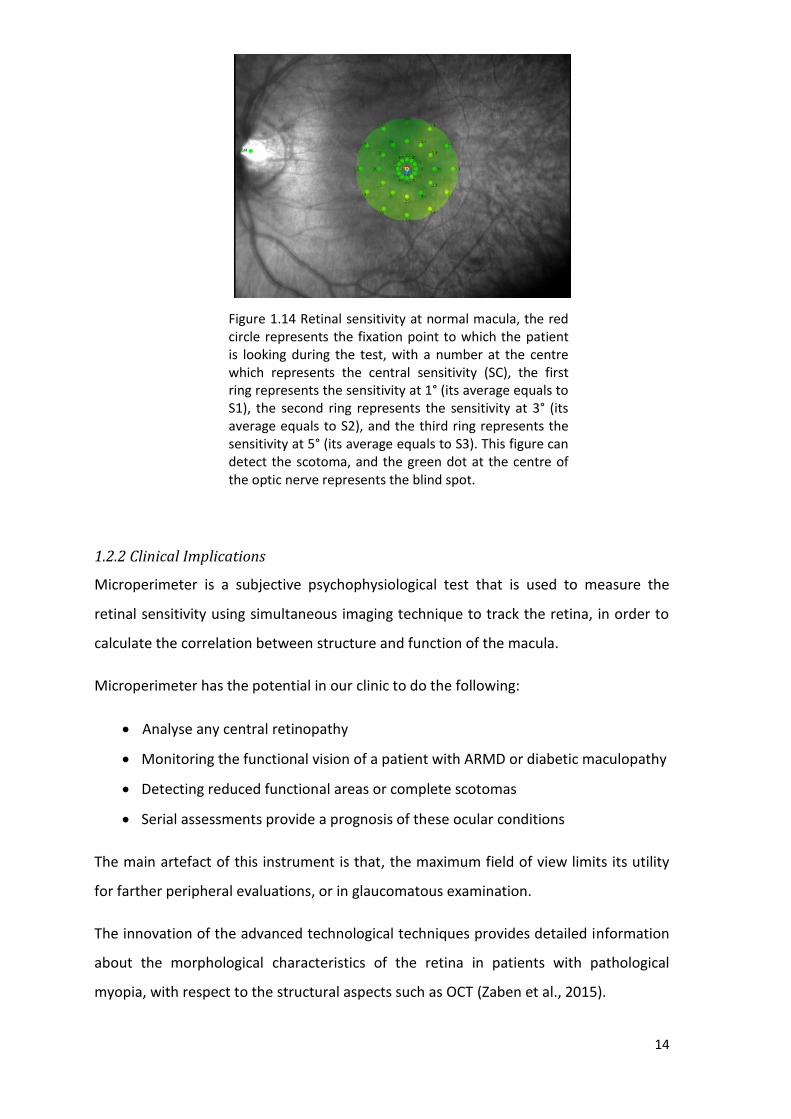
1.2.2 Clinical Implications
Microperimeter is a subjective psychophysiological test that is used to measure the
retinal sensitivity using simultaneous imaging technique to track the retina, in order to
calculate the correlation between structure and function of the macula.
Microperimeter has the potential in our clinic to do the following:
Analyse any central retinopathy
Monitoring the functional vision of a patient with ARMD or diabetic maculopathy
Detecting reduced functional areas or complete scotomas
Serial assessments provide a prognosis of these ocular conditions
The main artefact of this instrument is that, the maximum field of view limits its utility
for farther peripheral evaluations, or in glaucomatous examination.
The innovation of the advanced technological techniques provides detailed information
about the morphological characteristics of the retina in patients with pathological
myopia, with respect to the structural aspects such as OCT (Zaben et al., 2015).
Figure 1.14 Retinal sensitivity at normal macula, the red circle represents the fixation point to which the patient is looking during the test, with a number at the centre which represents the central sensitivity (SC), the first ring represents the sensitivity at 1° (its average equals to S1), the second ring represents the sensitivity at 3° (its average equals to S2), and the third ring represents the sensitivity at 5° (its average equals to S3). This figure can detect the scotoma, and the green dot at the centre of the optic nerve represents the blind spot.
15
The clinical implication of microperimetry is to provide detailed information about the
retina with respect to functional vision, especially in patients with pathological myopia,
where encountered that myopic maculopathy is directly proportion to the extent of
pathological alterations in macular area, therefore, the early diagnosis of the
degenerative myopia is based on the detection of retinal pigmented epithelium atrophy,
and choroidal thinning. The atrophic areas are associated with the presence of dense
scotoma, best detected with microperimeter, due to the stable extrafoveal fixation
which they have.
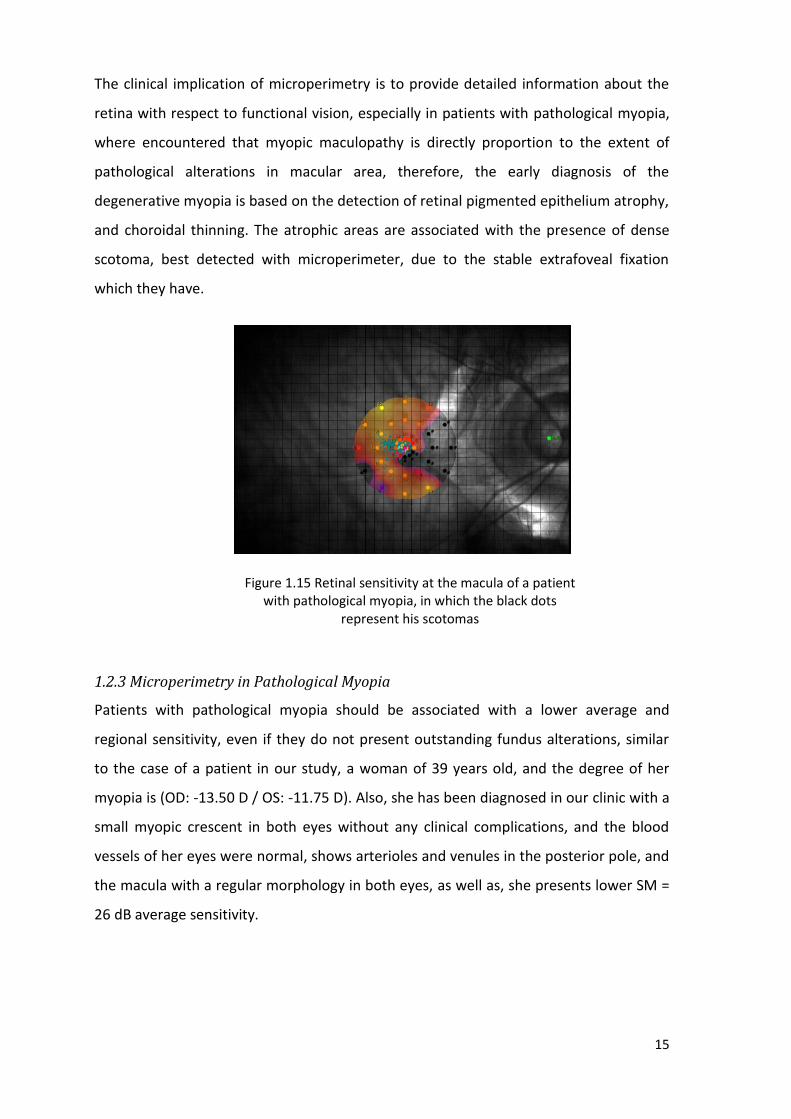
1.2.3 Microperimetry in Pathological Myopia
Patients with pathological myopia should be associated with a lower average and
regional sensitivity, even if they do not present outstanding fundus alterations, similar
to the case of a patient in our study, a woman of 39 years old, and the degree of her
myopia is (OD: -13.50 D / OS: -11.75 D). Also, she has been diagnosed in our clinic with a
small myopic crescent in both eyes without any clinical complications, and the blood
vessels of her eyes were normal, shows arterioles and venules in the posterior pole, and
the macula with a regular morphology in both eyes, as well as, she presents lower SM =
26 dB average sensitivity.
Figure 1.15 Retinal sensitivity at the macula of a patient with pathological myopia, in which the black dots
represent his scotomas
16
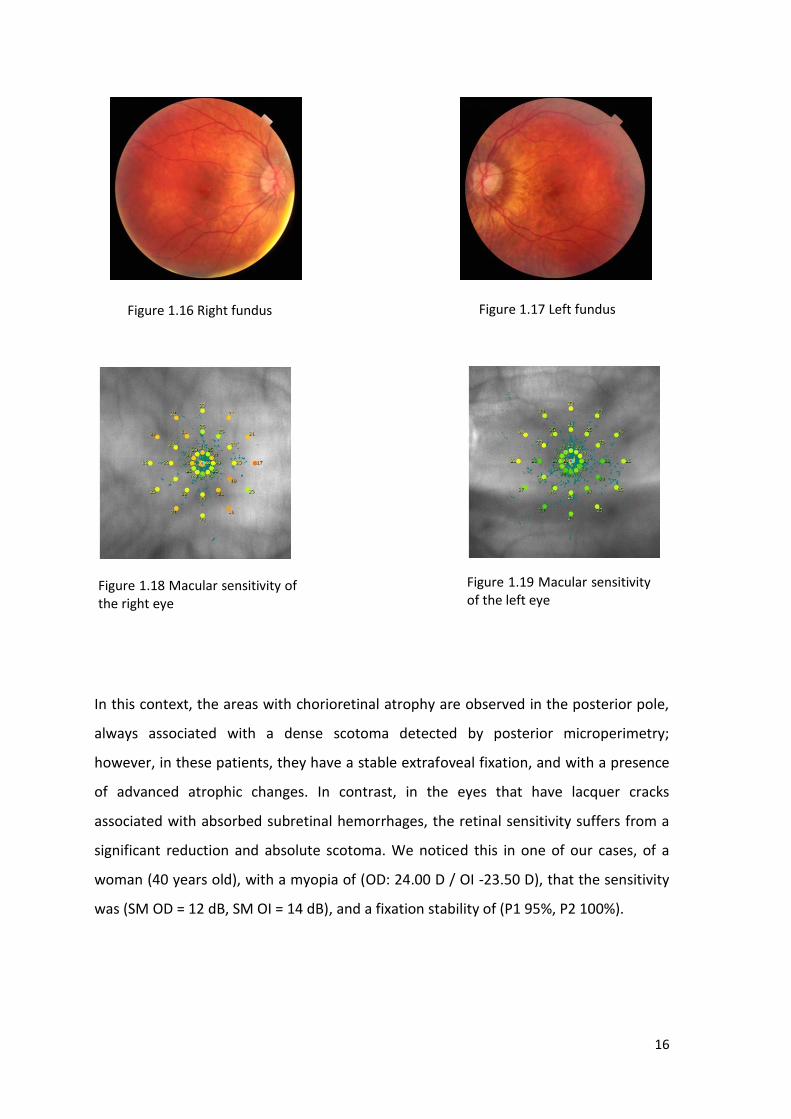
In this context, the areas with chorioretinal atrophy are observed in the posterior pole,
always associated with a dense scotoma detected by posterior microperimetry;
however, in these patients, they have a stable extrafoveal fixation, and with a presence
of advanced atrophic changes. In contrast, in the eyes that have lacquer cracks
associated with absorbed subretinal hemorrhages, the retinal sensitivity suffers from a
significant reduction and absolute scotoma. We noticed this in one of our cases, of a
woman (40 years old), with a myopia of (OD: 24.00 D / OI -23.50 D), that the sensitivity
was (SM OD = 12 dB, SM OI = 14 dB), and a fixation stability of (P1 95%, P2 100%).
Figure 1.17 Left fundus Figure 1.16 Right fundus
Figure 1.18 Macular sensitivity of the right eye
Figure 1.19 Macular sensitivity of the left eye
17
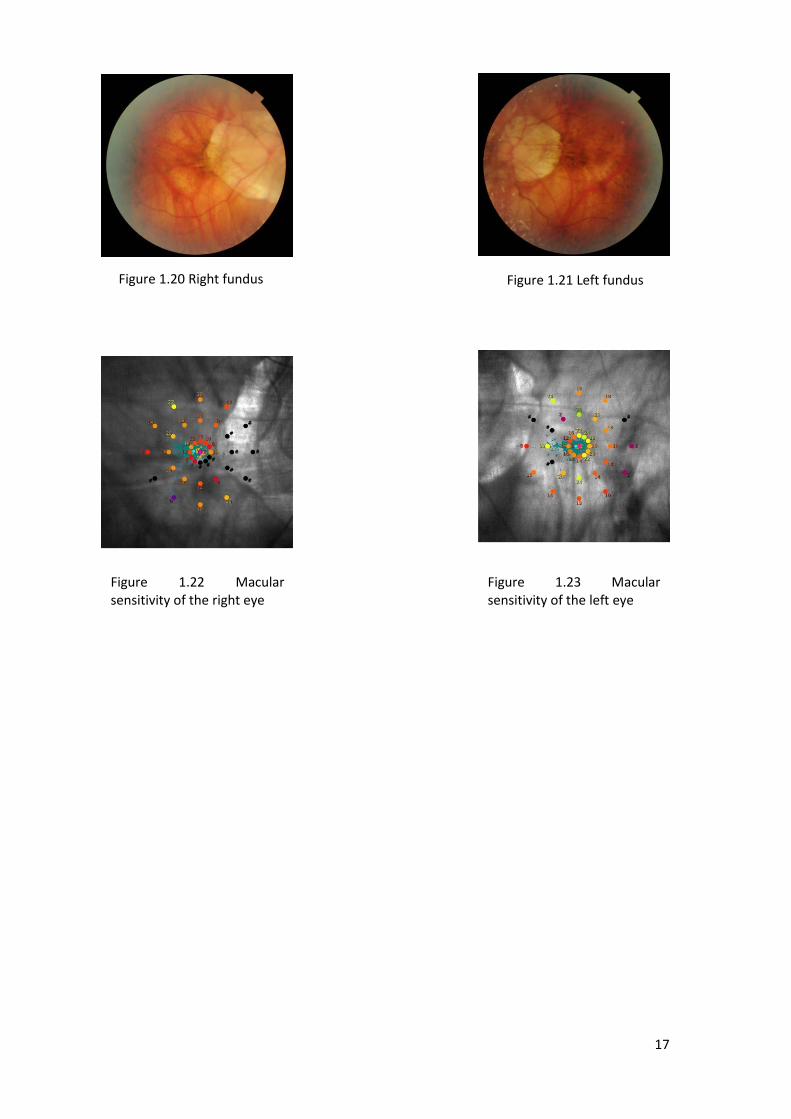
Figure 1.20 Right fundus
Figure 1.22 Macular sensitivity of the right eye
Figure 1.21 Left fundus
Figure 1.23 Macular sensitivity of the left eye
18
2. Justification
Pathological myopia and its complications, such as glaucoma, cataracts, retinal
detachment and macular degeneration are some of the leading causes of blindness and
low vision in industrialized countries. However, it is not entirely clear how it affects the
thinning process that occurs in the structures of the eye in pathological myopia,
specifically the retina, and the associated effects to functional vision, so understanding
the behaviour of these structural and functional changes is a key to describe correctly
the retina of the eye with pathological myopia, in order to help the low vision
rehabilitator to evaluate any retinal alterations and well-define the proper treatment.
On the other hand, it supposed that the asymmetry of the retinal sensitivity is not
explored yet. This information could be relative to the supervision of the conditions and
the treatments that can lead to asymmetry, thus the functional alterations would result
in structural changes.
Therefore, this study aims to conduct an evaluation that allows better understanding of
the functional information of the retina in impaired vision patients, due to the
pathological myopia, through a precise retinal sensitivity analysis, in term of asymmetry.
3. Hypothesis
The retinal sensitivity in low vision patients with pathological myopia is reduced in the
macular region, and also there is an asymmetry and regional variations in macular
function in patients affected by pathological myopia.
4. Objectives
1. Determining the variations of retinal sensitivity in the macular region in low
vision patients with pathological myopia using microperimeter.
2. Evaluate the asymmetry of retinal sensitivity of macular region in patients with
high myopia.
3. Investigate the correlations between the refractive power, age, best corrected
visual acuity for distance vision, and retinal sensitivity of the macular area.
19
5. Methods
5.1 Study Design
Transversal study
5.2 Patients
Data collection was conducted in the period between December 2014, and May 2015.
Patients are part of the population that goes spontaneously to the optometry clinic for a
visual assessment, as well as patients who have it, in our database, agree with our
inclusion criteria for this research.
The study design was carried out following the guidelines of the Declaration of Helsinki.
All participants were asked for permission to be included in the study through informed
consent in which exploration and complementary tests that were undergoing, as well as
the possible consequences of the results that may appear are explained.
All met the inclusion criteria atients wit at olo i al myo ia of ≥ -6.00 D), while the
exclusion criteria were any disease that causes an alteration of macular area, ocular
media opacity of the crystalline lens or the cornea, existence of glaucoma, patients who
have choroidal neovascularization secondary to myopia, amblyopia, and who did not
sign the informed consent. The patient should understand what requires the test, and
be able to respond.
5.3 Examination
A case history was realized, including name, sex, date of birth (age), general diseases
(diabetes mellitus, hypertension or hypotension, cardiovascular disease, etc.), family
history of glaucoma, a history of frequent headaches, previous or current systemic
treatments, a general anamnesis was performed (steroids, etc.) and an
ophthalmological history of previous surgeries, trauma, uveitis, previous ophthalmic
medications or current treatments.
In the optometric examination, objective and subjective examination were performed;
the spherocylindrical refraction was obtained as a result (in diopters) of each patient.

20
The spherical equivalent was used in the formula for calculating the correlations.
Refractive errors were found in myopia of more than 6.00 diopters.
The visual acuity in logMAR was recorded in the ETDRS chart (Early Treatment Diabetic
Retinopathies). Ocular examination with a slit-lamp biomicroscope of the anterior
segment of the eye in general, in order to assess the optical media and to discard the
eye that represents any pathology in the anterior segment, such as cataract.
Measurement of intraocular pressure (in mmHg) was performed using a non-contact,
air-puff tonometer, to exclude any eye over 21 mmHg of intraocular pressure.
The protocol of microperimetry examination of the macular sensitivity was used by
MAIATM microperimeter (Macular Integrity Assessment), where the examination was
held in the dark without cycloplegia, all subjects was exposed to a Fast test of 2 minutes
in duration, to become familiar with the instrument and to minimize the learning
impacts.
Then we did further exploration using Expert test to perform a full assessment,
determining the threshold of macular sensitivity and the stability of fixation, which was
held in the centre of 10 ° (in diameter) of the macular area (1° = 300 microns, therefore
10 ° = 3000 microns encompassing the macular area) using a strategy of 36 stimuli in a
duration of the stimulus of 200 ms, and a duration of the test of 5 minutes for each eye.
Before starting the test, we give some information to our patients about: the test that is
meant to study t e atient’s ability to perceive the light, and he must look at a
stationary target, the test is non-invasive, in particular, the device never touches the eye
and he only will see a tiny red-white light, he should not move, he must stay focused
throughout the test, which will last about 5 minutes for each eye, getting comfortable
rest by keeping the chin and the forehead pressed firmly against the remnants, look for
the small red circle as a target inside the instrument and always keep his eyes fixed on
the centre of the target during the test, he can blink, he will be given a button so that he
can press it with the thumb when he sees, or thinks that he sees a small bright spot that
appears anywhere on the background.
The test began after the subject was comfortable with the procedure. Above, a
threshold stimulus (superthreshold) is projected onto the blind spot of the instrument
21
for controlling false positives. This retinal configuration is manually identified in the
machine before the test as the region of the optic nerve. Any test that produced false
positives was excluded. The outpatient spherical equivalent was added to the focus, to
adjust the clearance of the image as the MAIA allows automatic recognition and
adjustment range in focus from -15.00 D to +10.00 D (automatic) for OD / OS.
The fixation target used for all subjects was a dyne to 1°. The software automatically
calculated the percentage of fixations remained within 2° and 4° in diameter.
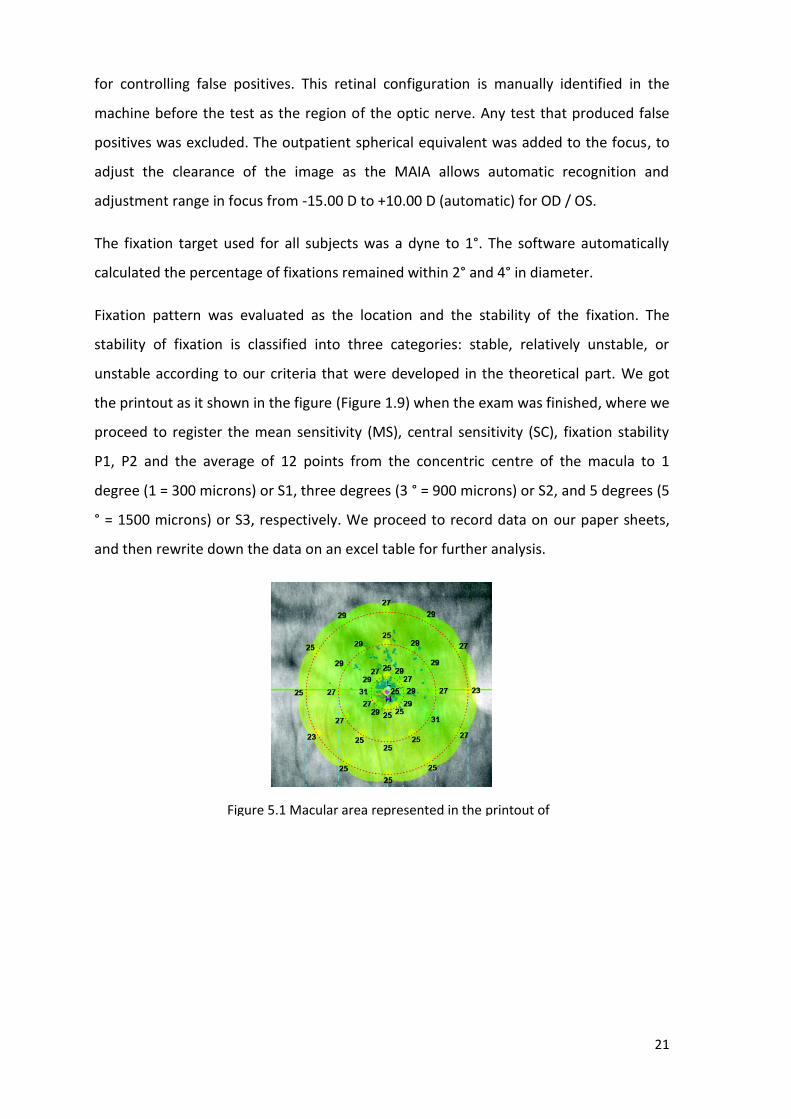
Fixation pattern was evaluated as the location and the stability of the fixation. The
stability of fixation is classified into three categories: stable, relatively unstable, or
unstable according to our criteria that were developed in the theoretical part. We got
the printout as it shown in the figure (Figure 1.9) when the exam was finished, where we
proceed to register the mean sensitivity (MS), central sensitivity (SC), fixation stability
P1, P2 and the average of 12 points from the concentric centre of the macula to 1
degree (1 = 300 microns) or S1, three degrees (3 ° = 900 microns) or S2, and 5 degrees (5
° = 1500 microns) or S3, respectively. We proceed to record data on our paper sheets,
and then rewrite down the data on an excel table for further analysis.
Figure 5.1 Macular area represented in the printout of MAIATM
22
5.4 Statistical Analysis
All statistical analyses were performed using SPSS software (IBM, Inc.) version 17.00 for
Windows 7 and Analysis-it for Microsoft Excel 3.90.7. Before conducting the statistical
analysis, we evaluated our data for normality with the Kolmogorov-Smirnov test,
revealing several instances of non-normal distribution.
Therefore, we opted to present our results for each eye, as well as the differences
between eyes, as median and range (minimum and maximum), although mean values
and standard deviation (±SD) are also summarized to allow comparison with previous
studies.
In order to explore the statistical significance of the differences between non-paired
data (such as between males and females) the Mann-Whitney U-test was used, whereas
when data was paired (comparing right with left eye), the Wilcoxon signed ranks test
was used.
The Spearman correlation test was employed to explore possible associations between
the variables under evaluation. For this test, and given the clinical nature of the present
study we onsidered a r o oeffi ient ≥ ±0.4 as an indi ator of eit er a positive or
negative weak correlation between variables, a rho value between 0.6 and 0.8 as an
indi ator of moderate orrelation and any r o ≥±0.8 as an indi ator of stron
correlation. A p value <0.05 denoted statistical significance throughout the study.
Finally, Inter-ocular asymmetry values were determined and compared with previous
published tolerance values by means of a paired t test, and the interocular differences
were calculated as the 2.5th and the 97.5th percentiles.
23
6. Results
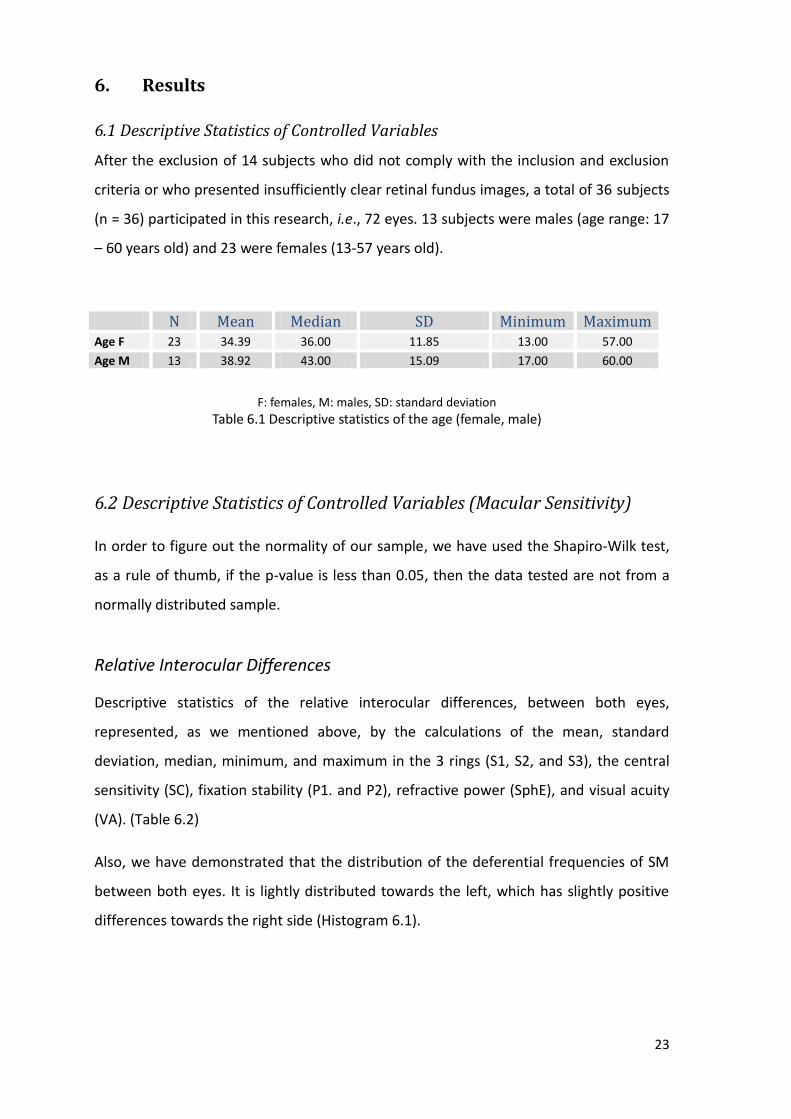
6.1 Descriptive Statistics of Controlled Variables
After t e ex lusion of 14 subje ts w o did not om ly wit t e in lusion and ex lusion
riteria or w o resented insuffi iently lear retinal fundus ima es a total of 36 subje ts
n = 36) arti i ated in t is resear i.e. 72 eyes. 13 subje ts were males a e ran e: 17
– 60 years old) and 23 were females 13-57 years old).
6.2 Descriptive Statistics of Controlled Variables (Macular Sensitivity) In order to fi ure out t e normality of our sam le we ave used t e a iro-Wilk test
as a rule of t umb if t e -value is less t an 0.05 t en t e data tested are not from a
normally distributed sam le.
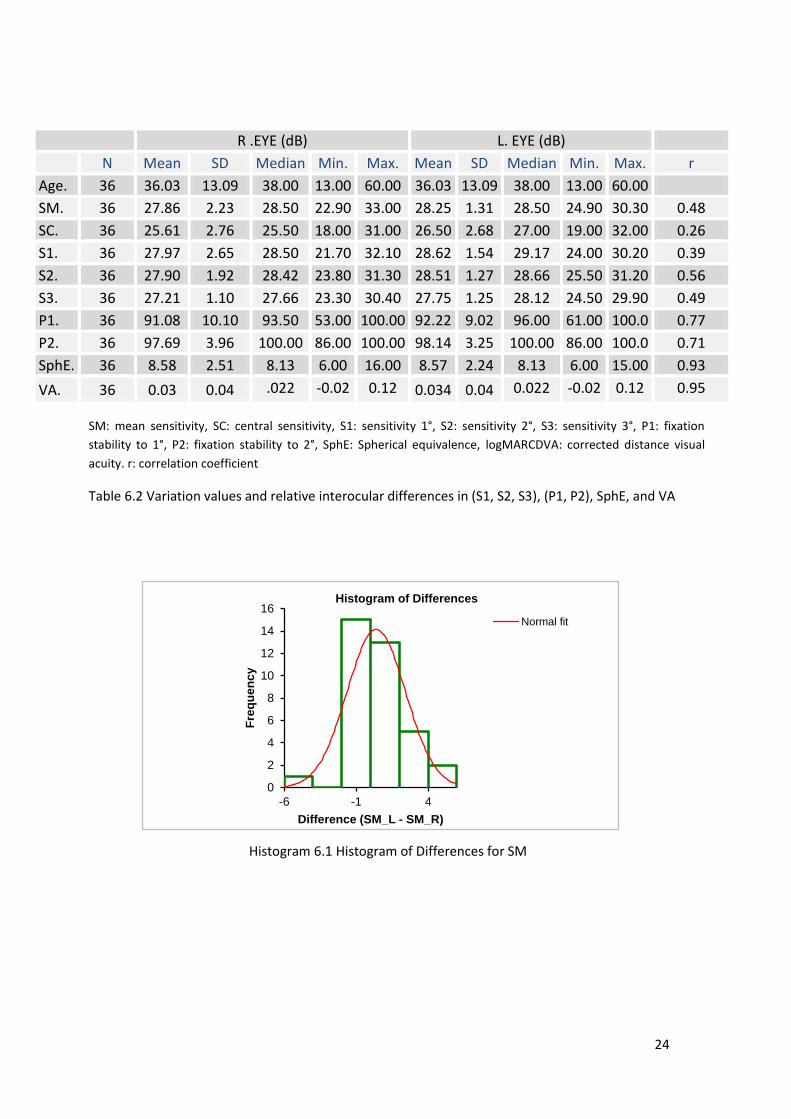
Relative Interocular Differences
Descriptive statistics of the relative interocular differences, between both eyes,
represented, as we mentioned above, by the calculations of the mean, standard
deviation, median, minimum, and maximum in the 3 rings (S1, S2, and S3), the central
sensitivity (SC), fixation stability (P1. and P2), refractive power (SphE), and visual acuity
(VA). (Table 6.2)
Also, we have demonstrated that the distribution of the deferential frequencies of SM
between both eyes. It is lightly distributed towards the left, which has slightly positive
differences towards the right side (Histogram 6.1).
N Mean Median SD Minimum Maximum Age F 23 34.39 36.00 11.85 13.00 57.00
Age M 13 38.92 43.00 15.09 17.00 60.00
F: females M: males D: standard deviation
Table 6.1 Des ri tive statisti s of t e a e female male)
24
0
2
4
6
8
10
12
14
16
-6 -1 4
Fre
qu
en
cy
Difference (SM_L - SM_R)
Histogram of Differences
Normal fit
R .EYE (dB) L. EYE (dB)
N Mean SD Median Min. Max. Mean SD Median Min. Max. r
Age. 36 36.03 13.09 38.00 13.00 60.00 36.03 13.09 38.00 13.00 60.00
SM. 36 27.86 2.23 28.50 22.90 33.00 28.25 1.31 28.50 24.90 30.30 0.48
SC. 36 25.61 2.76 25.50 18.00 31.00 26.50 2.68 27.00 19.00 32.00 0.26
S1. 36 27.97 2.65 28.50 21.70 32.10 28.62 1.54 29.17 24.00 30.20 0.39
S2. 36 27.90 1.92 28.42 23.80 31.30 28.51 1.27 28.66 25.50 31.20 0.56
S3. 36 27.21 1.10 27.66 23.30 30.40 27.75 1.25 28.12 24.50 29.90 0.49
P1. 36 91.08 10.10 93.50 53.00 100.00 92.22 9.02 96.00 61.00 100.0 0.77
P2. 36 97.69 3.96 100.00 86.00 100.00 98.14 3.25 100.00 86.00 100.0 0.71
SphE. 36 8.58 2.51 8.13 6.00 16.00 8.57 2.24 8.13 6.00 15.00 0.93
VA. 36 0.03 0.04 .022 -0.02 0.12 0.034 0.04 0.022 -0.02 0.12 0.95
Histogram 6.1 Histogram of Differences for SM
SM: mean sensitivity, SC: central sensitivity, S1: sensitivity 1°, S2: sensitivity 2°, S3: sensitivity 3°, P1: fixation
stability to 1°, P2: fixation stability to 2°, SphE: Spherical equivalence, logMARCDVA: corrected distance visual
acuity. r: correlation coefficient
Table 6.2 Variation values and relative interocular differences in (S1, S2, S3), (P1, P2), SphE, and VA
25
0
5
10
15
20
25
-10 0 10
Fre
qu
en
cy
Difference (SC_L - SC_R)
Histogram of Differences
Normal fit
0
2
4
6
8
10
12
14
16
-4 1 6
Fre
qu
en
cy
Difference (S1_L - S1_R)
Histogram of Differences
Normal fit
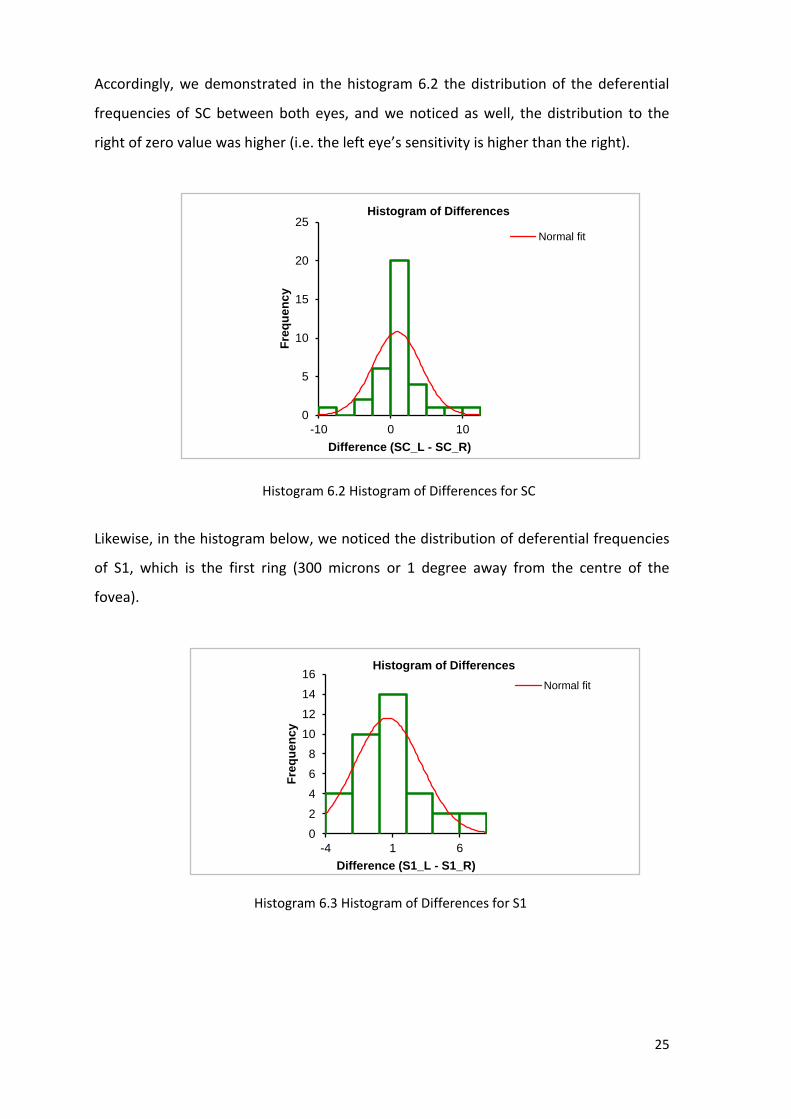
Accordingly, we demonstrated in the histogram 6.2 the distribution of the deferential
frequencies of SC between both eyes, and we noticed as well, the distribution to the
ri t of ero value was i er i.e. t e left eye’s sensitivity is i er t an t e ri t).
Likewise, in the histogram below, we noticed the distribution of deferential frequencies
of S1, which is the first ring (300 microns or 1 degree away from the centre of the
fovea).
Histogram 6.3 Histogram of Differences for S1
Histogram 6.2 Histogram of Differences for SC
26
0
2
4
6
8
10
12
-2 0 2 4
Fre
qu
en
cy
Difference (S2_L - S2_R)
Histogram of Differences
Normal fit
0
2
4
6
8
10
12
-3 2
Fre
qu
en
cy
Difference (S3_L - S3_R)
Histogram of Differences
Normal fit
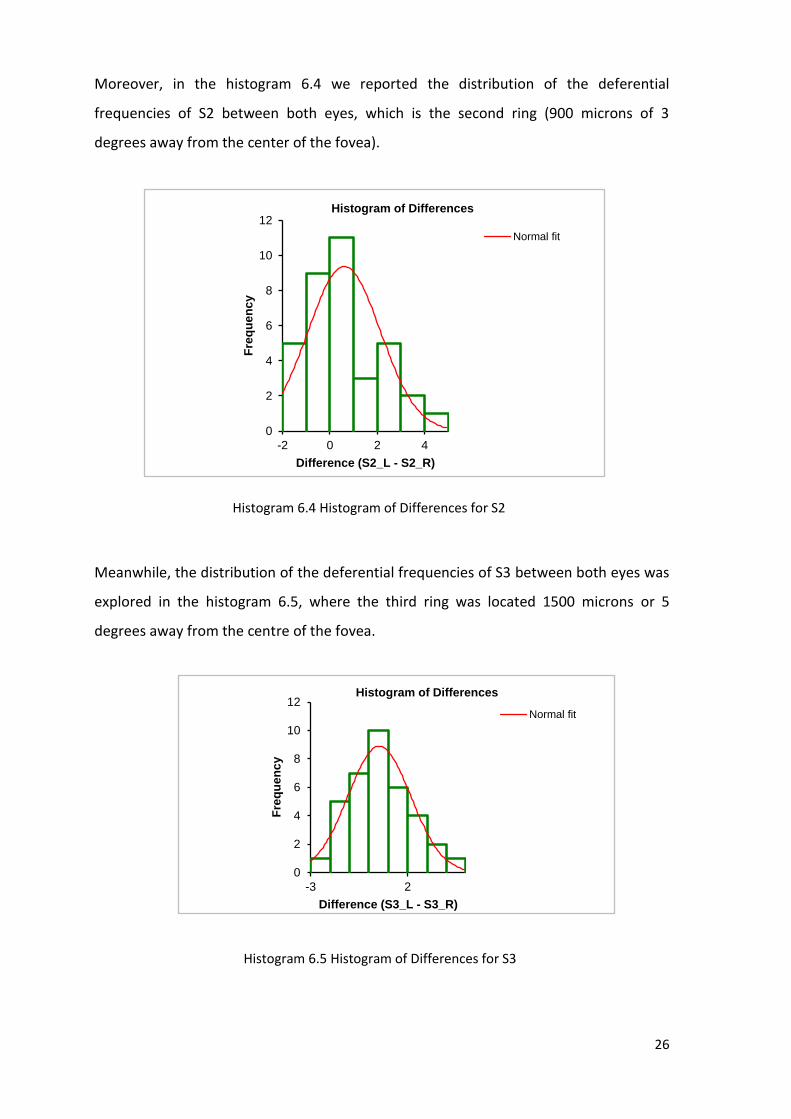
Moreover, in the histogram 6.4 we reported the distribution of the deferential
frequencies of S2 between both eyes, which is the second ring (900 microns of 3
degrees away from the center of the fovea).
Meanwhile, the distribution of the deferential frequencies of S3 between both eyes was
explored in the histogram 6.5, where the third ring was located 1500 microns or 5
degrees away from the centre of the fovea.
Histogram 6.4 Histogram of Differences for S2
Histogram 6.5 Histogram of Differences for S3
27
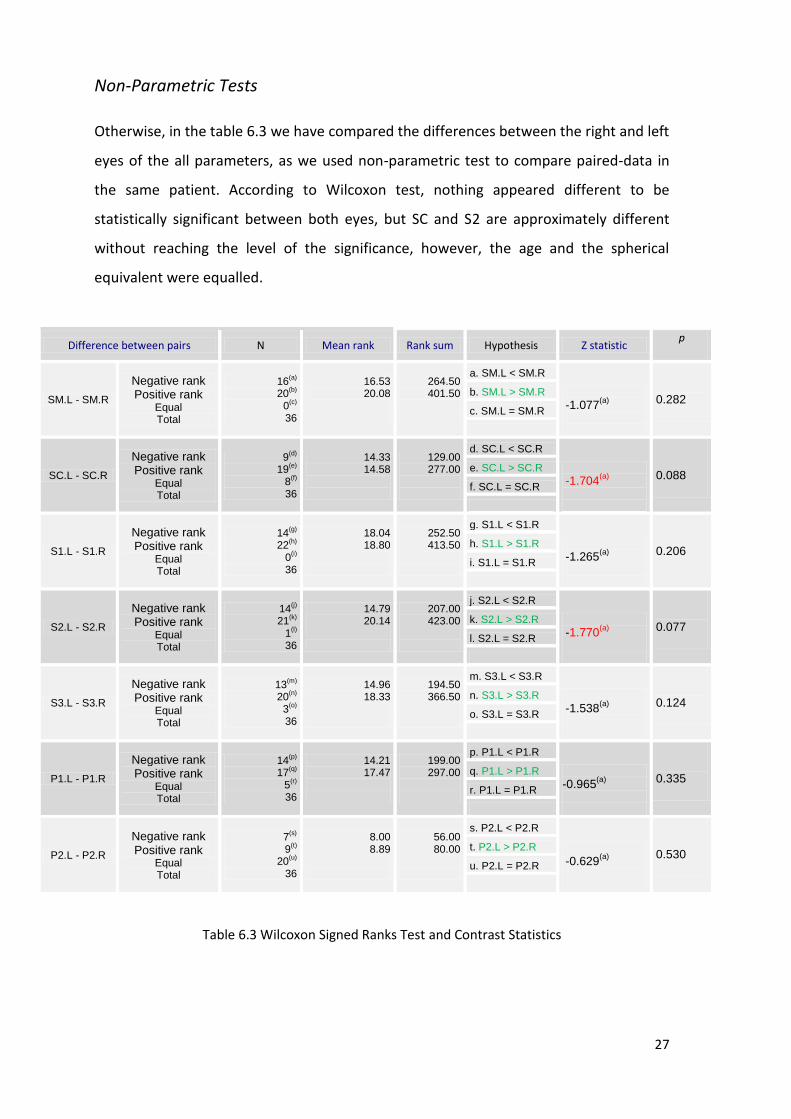
Non-Parametric Tests
Otherwise, in the table 6.3 we have compared the differences between the right and left
eyes of the all parameters, as we used non-parametric test to compare paired-data in
the same patient. According to Wilcoxon test, nothing appeared different to be
statistically significant between both eyes, but SC and S2 are approximately different
without reaching the level of the significance, however, the age and the spherical
equivalent were equalled.
Difference between pairs N Mean rank Rank sum Hypothesis Z statistic p
SM.L - SM.R
Negative rank
Positive rank Equal Total
16(a)
20
(b)
0(c)
36
16.53 20.08
264.50 401.50
a. SM.L < SM.R
-1.077(a)
0.282 b. SM.L > SM.R
c. SM.L = SM.R
SC.L - SC.R
Negative rank
Positive rank Equal Total
9(d)
19
(e)
8(f)
36
14.33 14.58
129.00 277.00
d. SC.L < SC.R
-1.704(a)
0.088 e. SC.L > SC.R
f. SC.L = SC.R
S1.L - S1.R
Negative rank
Positive rank Equal Total
14(g)
22
(h)
0(i)
36
18.04 18.80
252.50 413.50
g. S1.L < S1.R
-1.265(a)
0.206 h. S1.L > S1.R
i. S1.L = S1.R
S2.L - S2.R
Negative rank
Positive rank Equal Total
14(j)
21(k)
1
(l)
36
14.79 20.14
207.00 423.00
j. S2.L < S2.R
-1.770(a)
0.077 k. S2.L > S2.R
l. S2.L = S2.R
S3.L - S3.R
Negative rank
Positive rank Equal Total
13(m)
20
(n)
3(o)
36
14.96 18.33
194.50 366.50
m. S3.L < S3.R
-1.538(a)
0.124 n. S3.L > S3.R
o. S3.L = S3.R
P1.L - P1.R
Negative rank
Positive rank Equal Total
14(p)
17
(q)
5(r)
36
14.21 17.47
199.00 297.00
p. P1.L < P1.R
-0.965(a)
0.335 q. P1.L > P1.R
r. P1.L = P1.R
P2.L - P2.R
Negative rank
Positive rank Equal Total
7(s)
9
(t)
20(u)
36
8.00 8.89
56.00 80.00
s. P2.L < P2.R
-0.629(a)
0.530 t. P2.L > P2.R
u. P2.L = P2.R
Table 6.3 Wilcoxon Signed Ranks Test and Contrast Statistics
28
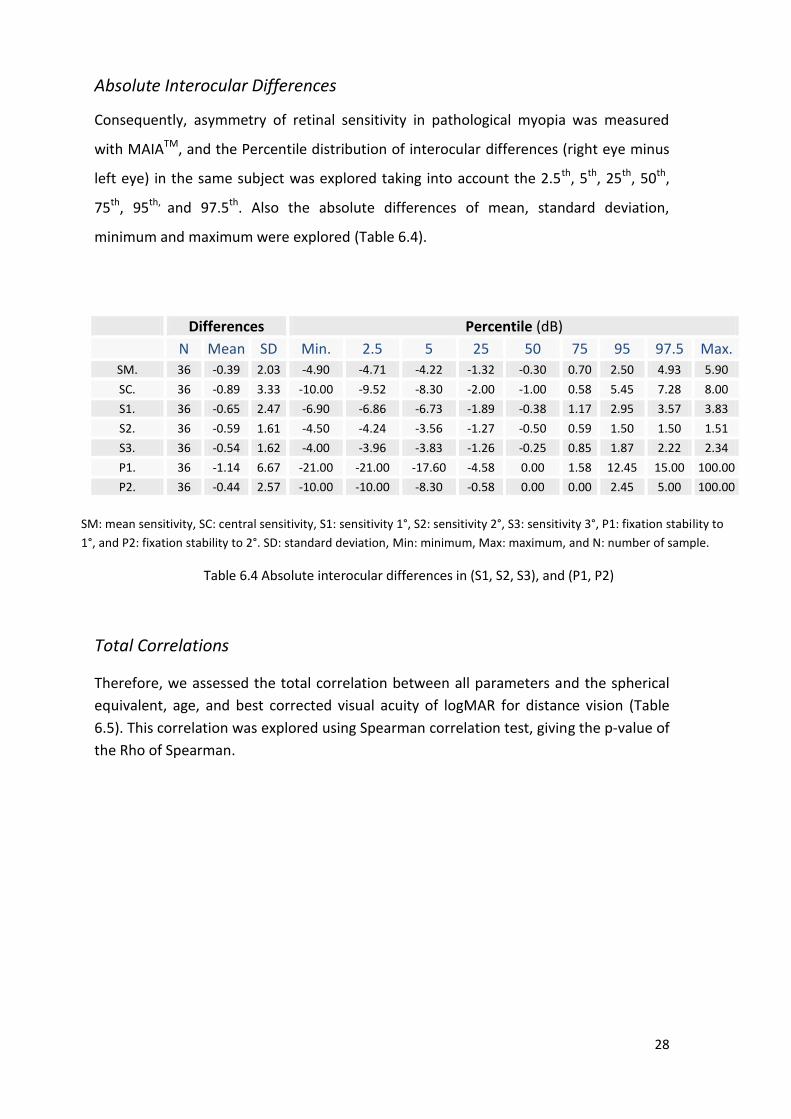
Absolute Interocular Differences
Consequently, asymmetry of retinal sensitivity in pathological myopia was measured
with MAIATM, and the Percentile distribution of interocular differences (right eye minus
left eye) in the same subject was explored taking into account the 2.5th, 5th, 25th, 50th,
75th, 95th, and 97.5th. Also the absolute differences of mean, standard deviation,
minimum and maximum were explored (Table 6.4).
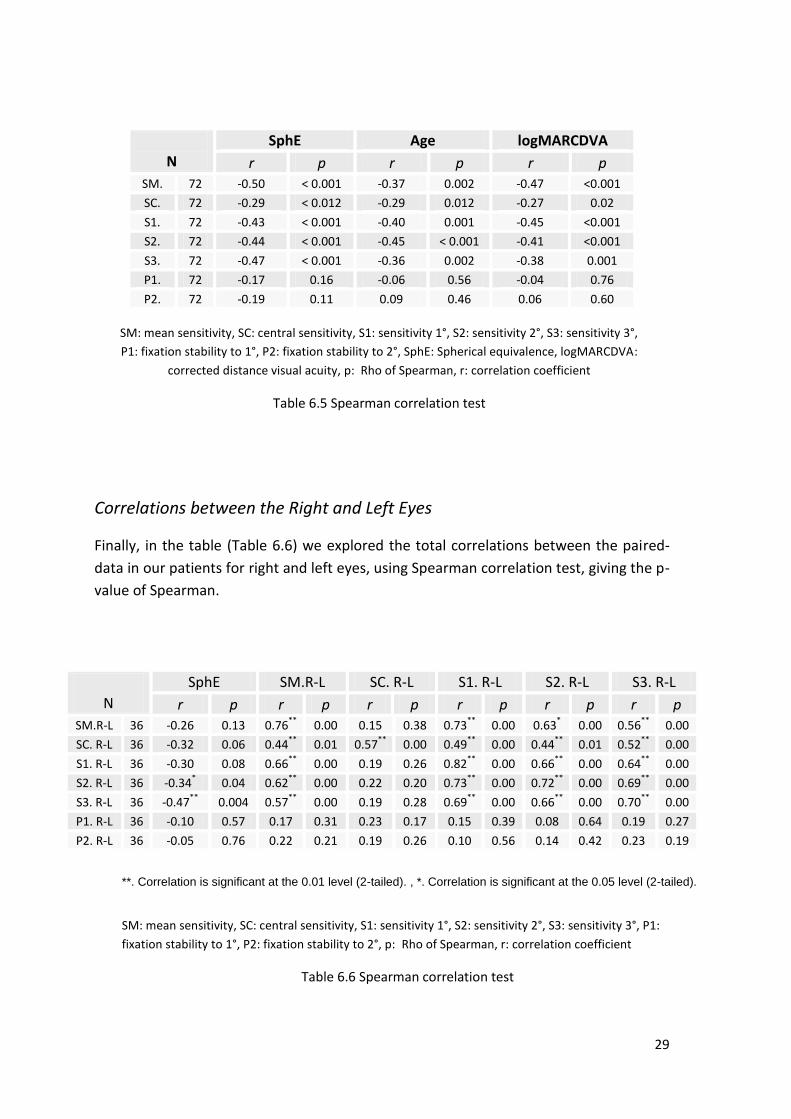
Total Correlations
Therefore, we assessed the total correlation between all parameters and the spherical
equivalent, age, and best corrected visual acuity of logMAR for distance vision (Table
6.5). This correlation was explored using Spearman correlation test, giving the p-value of
the Rho of Spearman.
Differences Percentile (dB)
N Mean SD Min. 2.5 5 25 50 75 95 97.5 Max.
SM. 36 -0.39 2.03 -4.90 -4.71 -4.22 -1.32 -0.30 0.70 2.50 4.93 5.90
SC. 36 -0.89 3.33 -10.00 -9.52 -8.30 -2.00 -1.00 0.58 5.45 7.28 8.00
S1. 36 -0.65 2.47 -6.90 -6.86 -6.73 -1.89 -0.38 1.17 2.95 3.57 3.83
S2. 36 -0.59 1.61 -4.50 -4.24 -3.56 -1.27 -0.50 0.59 1.50 1.50 1.51
S3. 36 -0.54 1.62 -4.00 -3.96 -3.83 -1.26 -0.25 0.85 1.87 2.22 2.34
P1. 36 -1.14 6.67 -21.00 -21.00 -17.60 -4.58 0.00 1.58 12.45 15.00 100.00
P2. 36 -0.44 2.57 -10.00 -10.00 -8.30 -0.58 0.00 0.00 2.45 5.00 100.00
SM: mean sensitivity, SC: central sensitivity, S1: sensitivity 1°, S2: sensitivity 2°, S3: sensitivity 3°, P1: fixation stability to
1°, and P2: fixation stability to 2°. SD: standard deviation, Min: minimum, Max: maximum, and N: number of sample.
Table 6.4 Absolute interocular differences in (S1, S2, S3), and (P1, P2)
29
Correlations between the Right and Left Eyes
Finally, in the table (Table 6.6) we explored the total correlations between the paired-
data in our patients for right and left eyes, using Spearman correlation test, giving the p-
value of Spearman.
N
SphE Age logMARCDVA
r p r p r p SM. 72 -0.50 < 0.001 -0.37 0.002 -0.47 <0.001
SC. 72 -0.29 < 0.012 -0.29 0.012 -0.27 0.02
S1. 72 -0.43 < 0.001 -0.40 0.001 -0.45 <0.001
S2. 72 -0.44 < 0.001 -0.45 < 0.001 -0.41 <0.001
S3. 72 -0.47 < 0.001 -0.36 0.002 -0.38 0.001
P1. 72 -0.17 0.16 -0.06 0.56 -0.04 0.76
P2. 72 -0.19 0.11 0.09 0.46 0.06 0.60
N
SphE SM.R-L SC. R-L S1. R-L S2. R-L S3. R-L
r p r p r p r p r p r p SM.R-L 36 -0.26 0.13 0.76
** 0.00 0.15 0.38 0.73
** 0.00 0.63
* 0.00 0.56
** 0.00
SC. R-L 36 -0.32 0.06 0.44**
0.01 0.57**
0.00 0.49**
0.00 0.44**
0.01 0.52**
0.00
S1. R-L 36 -0.30 0.08 0.66**
0.00 0.19 0.26 0.82**
0.00 0.66**
0.00 0.64**
0.00
S2. R-L 36 -0.34* 0.04 0.62
** 0.00 0.22 0.20 0.73
** 0.00 0.72
** 0.00 0.69
** 0.00
S3. R-L 36 -0.47**
0.004 0.57**
0.00 0.19 0.28 0.69**
0.00 0.66**
0.00 0.70**
0.00
P1. R-L 36 -0.10 0.57 0.17 0.31 0.23 0.17 0.15 0.39 0.08 0.64 0.19 0.27
P2. R-L 36 -0.05 0.76 0.22 0.21 0.19 0.26 0.10 0.56 0.14 0.42 0.23 0.19
SM: mean sensitivity, SC: central sensitivity, S1: sensitivity 1°, S2: sensitivity 2°, S3: sensitivity 3°,
P1: fixation stability to 1°, P2: fixation stability to 2°, SphE: Spherical equivalence, logMARCDVA:
corrected distance visual acuity, p: Rho of Spearman, r: correlation coefficient
Table 6.5 Spearman correlation test
SM: mean sensitivity, SC: central sensitivity, S1: sensitivity 1°, S2: sensitivity 2°, S3: sensitivity 3°, P1:
fixation stability to 1°, P2: fixation stability to 2°, p: Rho of Spearman, r: correlation coefficient
Table 6.6 Spearman correlation test
**. Correlation is significant at the 0.01 level (2-tailed). , *. Correlation is significant at the 0.05 level (2-tailed).
30
7. Discussion
The microperimetry (fudus related perimetry) evaluate the macular sensitivity and
provide almost an exact correlation between the fundus pathology and the
corresponding functional defects, taking into account the fixation pattern and stability,
allowing us to assess the retina in some ocular conditions, like macular oedema, age-
related macular degeneration, and diabetes retinopathy.
In the present study, we conducted an analysis of the macular sensitivity using MAIATM
microperimeter throughout confocal laser assessment, which covers the central 10° of
the macula in patients with pathological myopia.
The results provide information regarding the regional variations in the macular
function, in patients affected by pathological myopia, in which, after the best corrected
visual acuity for distance vision, the macular sensitivity is reduced.
When the central sensitivity is compared, which is reduced in subject with normal foveal
fixation, due to the absence of rod photoreceptors in the fovea, therefore increasing the
brightness of the stimulus was required to achieve the umbral detection )Notaroberto et
al., 2012).
Even though, the mean of the retinal sensitivity in the third ring was significantly
reduced in comparison with the first and second rings in patients with pathological
myopia. The macular sensitivity correlates significantly with the age and spherical
equivalent (Chen et al., 2009), and the measuring protocol is similar to the recent study
of A. Zaben (Zaben et al., 2015) in which he investigates the retinal sensitivity in the
macular region exploring the mean sensitivity. Conversely, in our study we investigated
the retinal sensitivity in three rings, in the macular region.
In this study, the mean of the retinal sensitivity was higher in the 1st ring S1 (27.97 dB for
the right eye, and 28.62 dB for the left eye) in comparison with other regions SC, S2, and
S3. As well as, the left eye has higher retinal sensitivity than the right eye (Table 6.2).
This way, these differences in the retinal sensitivity between the right and left eyes
could be due to the test-learning factor, and the darkness adaptation (hence, we started
with the right eye), thus, the left eye was appearing more sensible than the right one.
31
Besides, the Table 6.4 demonstrates the absolute interocular differences of the mean, as
well as, the maximum and minimum. The difference between both eyes in the same
subject of the SC and SM, moreover the three concentric rings of sensitivity from the
fovea, S1, S2, and S3. We also obtained the percentiles of 5%, 25%, 50%, 75%, 95%, and
97.5% to determine the physiological ranges of the interocular asymmetry in the
functionality of the retina, which is essential to detect abnormal values.
Furthermore, the major absolute interocular difference of SM gave a mean of 0.39 dB in
high myopic patients, with a minimum of -4.90 dB and a maximum of 5.90 dB, ranged
(22.90 - 33.00 in the right eye, and 24.90 – 30.30 in the left eye). Our study revealed
that, 95% of patients with pathological myopia could have interocular differences limit
of 2.50 dB, which is considered normal. In contrary, the absolute interocular differences
in S2, and S3 (0.54 dB, 0.59 dB) respectively, with a range of (-4.50 to 1.51 dB for S2),
and (-4.00 to 2.34 dB for S3). Moreover, the 97.5th percentile in our results has 95% of
the population with myopia, which may have a difference of the retinal sensitivity in the
2nd, and the 3rd rings up to (1.50 dB, 2.22 dB) respectively, in this case it is considered
normal too.
In our research, we obtained a higher difference of retinal sensitivity of the central
region of 5.45 dB, and a lower difference in the 2nd ring 3° away from the centre of the
fovea of 1.51 dB, in which it is considered that 95% of our population could have a
difference in the central sensitivity up to 5.45 dB.
The correlation coefficient using Wilcoxon test indicated significant asymmetry in retinal
sensitivity in SC (Z= -1.704 dB), and S2 (Z= -1.770 dB) i.e. the retinal sensitivity is higher
in the left eye among these regions than the right eye (Table 6.3).
In the study of Gella, she was comparing the retinal sensitivity using microperimeter and
the morphological changes in the retinal layers using SD-OCT between myopic and
emmetropic patients; she found a reduction in the retinal sensitivity in patients with
myopia. There was a positive correlation between the refractive error and the medium
of retinal sensitivity (r = 0,725, p = <0,001) (Gella et al., 2011). Also in our study, we have
got similar results, in which we found a significant negative correlation between the
refractive power and the retinal sensitivity of the macular area, and a negative
correlation between the visual acuity (logMAR) and the retinal sensitivity (see Table 6.5),
32
which goes hand in hand with the study of Zaben`s research group, as they concluded
the correlation between the retinal sensitivity and the low visual acuity associated with
high degree of myopia (Zaben et al., 2015).
As though, Zhou et al. according to our study, he found similar results in which the
retinal sensitivity differs from the centre of the macula towards the peripheral retina;
even he was using MP-1 microperimeter among normal subjects of different middle and
advanced ages, where he did not get any correlation between the retinal sensitivity and
the age (Zhou et al., 2011). In our study, we found a correlation between the age and
the retinal sensitivity.
The present study has demonstrated the correlation between both eyes (72 eyes) in
table 6.5. We noticed that, SM and S3 are correlated with the refractive power, while
the S1 and S2 are correlated with the age, whereas, the SM and S1 are correlated with
the logMAR VA, without any correlation with the fixation points P1 and P2.
Nevertheless, the correlation between the 3 rings were not evaluated before, which still
as an interesting consideration, where we found the correlation between the retinal
sensitivity of the 3 rings and the refractive power, by which with higher refractive power
there is a lower retinal sensitivity. This relationship is powerful in SM, and the three
rings, with higher correlation of the exterior one towards the centre, it conforms the
reality of the recent investigation of A. Zaben (Zaben et al, 2015).
We recognize t at it’s ne essary to perform additional studies with a larger sample to
support our conclusions in the future.
Accordingly, to determine the physiological ranges of interocular asymmetry in retinal
functions among patients with pathological myopia, it is essential to detect abnormal
values. Our study is the first to detect the physiological asymmetry of retinal sensitivity
in patients affected by pathological myopia, and we suggest that, it should not exceed
5.45 dB in the centre of the macula, and 2.50 in SM, if measured with MAIATM
microperimeter (see Figure 7.1).
The results of our study have been provided new vision about the relation between the
fixation, retinal sensitivity, age, and best corrected visual acuity of distance vision in
patients with pathological myopia (compare Table 6.2 and Table 6.5).
33
-8-6-4-202468
10
20 22 24 26 28 30 32
SC. L
- S
C.R
(SC. L + SC.R) / 2
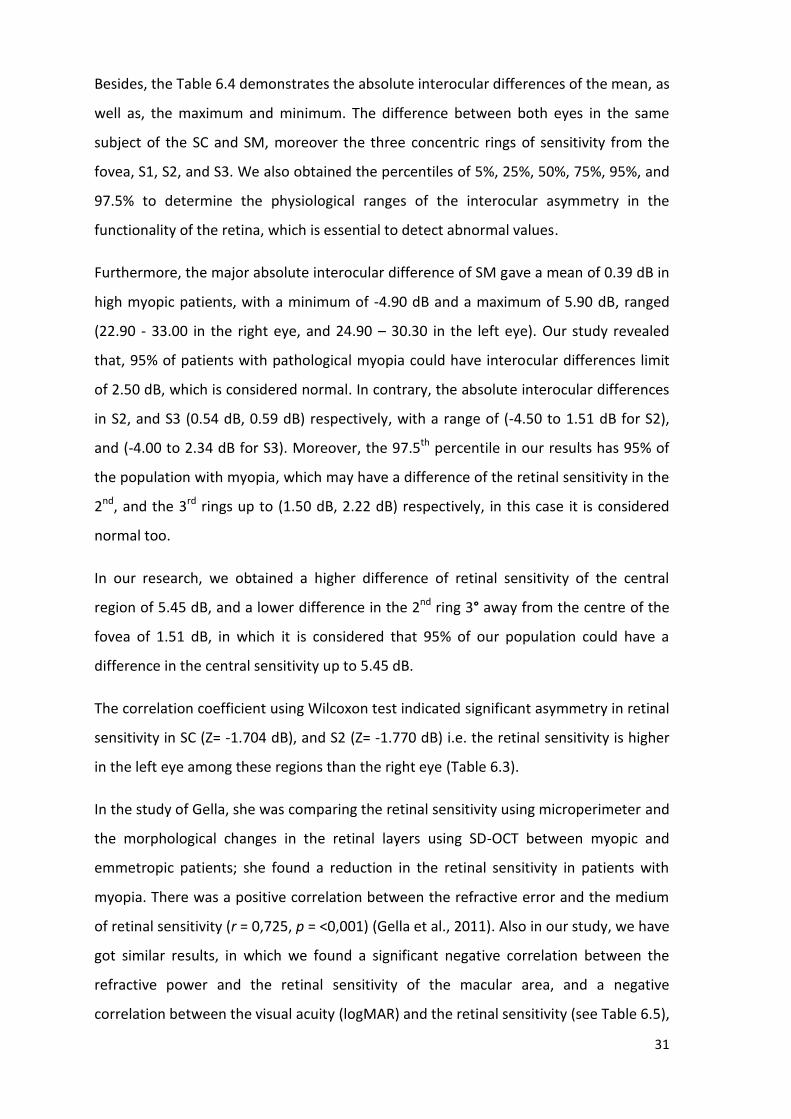
The present study has been conducted using MAIATM microperimeter, which does not
indicate the refractive error into account, despite the diagnosis of the functional
integrity of the macula could be modified depending on the refractive power, small size
of our sample, and the absence of a control group were considered of the main
limitations of our study.
In the future, we could overcome the darkness adaptation taking the first eye to be
examined randomly, instead of starting always with the right eye. Although, we have got
statistical correlations between the age and retinal sensitivity in our transversal study,
but it would be more accurate if it was a longitudinal study.
8. Conclusions
1. Interocular differences exceeding 5.45 dB in the foveal region and 2.50 dB in SM
may indicate asymmetrical macular decline typical of pathological myopia, if
measured with MAIATM microperimeter.
2. The interocular asymmetry of retinal sensitivity may be an effective approach to
understand better the physiological variations of the macula in patients affected
by pathological myopia.
3. There are significant correlations between the refractive power, age, best
corrected visual acuity for distance vision, and retinal sensitivity of the macular
area.
Figure 7.1 Significant functional asymmetry in (SC) macular
area in patients with pathological myopia
34
9. Bibliography
Alencar, L.M., Medeiros, F.A., 2011. The role of standard automated perimetry and newer functional methods for glaucoma diagnosis and follow-up. Indian J. Ophthalmol. 59, S53–S58. doi:10.4103/0301-4738.73694
Alkabes, M., Padilla, L., Salinas, C., Nucci, P., Vitale, L., Pichi, F., Burès-Jelstrup, A., Mateo, C., 2013. Assessment of OCT measurements as prognostic factors in myopic macular hole surgery without foveoschisis. Graefes Arch. Clin. Exp. Ophthalmol. Albrecht Von Graefes Arch. Für Klin. Exp. Ophthalmol. 251, 2521–2527. doi:10.1007/s00417-013-2347-y
Atchison, D.A., 2014. Relative peripheral defocus and myopic progression in children. Graefes Arch. Clin. Exp. Ophthalmol. Albrecht Von Graefes Arch. Für Klin. Exp. Ophthalmol. 252, 173. doi:10.1007/s00417-013-2506-1
Benavente-Pérez, A., Nour, A., Troilo, D., 2014. Axial eye growth and refractive error development can be modified by exposing the peripheral retina to relative myopic or hyperopic defocus. Invest. Ophthalmol. Vis. Sci. 55, 6765–6773. doi:10.1167/iovs.14-14524
Chen, F.K., Patel, P.J., Xing, W., Bunce, C., Egan, C., Tufail, A.T., Coffey, P.J., Rubin, G.S., Da Cruz, L., 2009. Test-retest variability of microperimetry using the Nidek MP1 in patients with macular disease. Invest. Ophthalmol. Vis. Sci. 50, 3464–3472. doi:10.1167/iovs.08-2926
Chui, T.Y.P., VanNasdale, D.A., Elsner, A.E., Burns, S.A., 2014. The association between the foveal avascular zone and retinal thickness. Invest. Ophthalmol. Vis. Sci. 55, 6870–6877. doi:10.1167/iovs.14-15446
Crossland, M.D., Jackson, M.-L., Seiple, W.H., 2012. Microperimetry: a review of fundus related perimetry. Optom. Rep. 2, 11–15.
Crossland, M.D., Sims, M., Galbraith, R.F., Rubin, G.S., 2004. Evaluation of a new quantitative technique to assess the number and extent of preferred retinal loci in macular disease. Vision Res. 44, 1537–1546. doi:10.1016/j.visres.2004.01.006
Dunbar, H.M.P., Crossland, M.D., Rubin, G.S., 2010. Fixation Stability: A Comparison between the Nidek MP-1 and the Rodenstock Scanning Laser Ophthalmoscope in Persons with and without Diabetic Maculopathy. Invest. Ophthalmol. Vis. Sci. 51, 4346–4350. doi:10.1167/iovs.09-4556
Flores-Moreno, I., Lugo, F., Duker, J.S., Ruiz-Moreno, J.M., 2013. The relationship between axial length and choroidal thickness in eyes with high myopia. Am. J. Ophthalmol. 155, 314–319.e1. doi:10.1016/j.ajo.2012.07.015
Gella, L., Raman, R., Sharma, T., 2011. Evaluation of in vivo human retinal morphology and function in myopes. Curr. Eye Res. 36, 943–946. doi:10.3109/02713683.2011.599105
Maduka Okafor, F.C., Okoye, O.I., Eze, B.I., 2009. Myopia: a review of literature. Niger. J. Med. J. Natl. Assoc. Resid. Dr. Niger. 18, 134–138.
Markowitz, S.N., Reyes, S.V., 2013. Microperimetry and clinical practice: an evidence-based review. Can. J. Ophthalmol. 48, 350–357. doi:10.1016/j.jcjo.2012.03.004
McBrien, N.A., Jobling, A.I., Gentle, A., 2009. Biomechanics of the sclera in myopia:
extracellular and cellular factors. Optom. Vis. Sci. Off. Publ. Am. Acad. Optom.
86, E23–30. doi:10.1097/OPX.0b013e3181940669
35
Notaroberto, N., Smolek, M., Fereday, L., 2012. What Accounts for Differences in Fellow
Eye Retinal Sensitivity. CLEVER Eye Institute. Poster 4828/D743 ARVO.
Nguyen, N.X., Besch, D., Bartz-Schmidt, K., Gelisken, F., Trauzettel-Klosinski, S., 2007.
Reading performance with low-vision aids and vision-related quality of life after macular
translocation surgery in patients with age-related macular degeneration. Acta
Ophthalmol. Scand. 85, 877–882. doi:10.1111/j.1600-0420.2007.00963.x
Nguyen, N.X., Weismann, M., Trauzettel-Klosinski, S., 2009. Improvement of reading speed after providing of low vision aids in patients with age-related macular degeneration. Acta Ophthalmol. (Copenh.) 87, 849–853. doi:10.1111/j.1755-3768.2008.01423.x
Rohrschneider, K., Bültmann, S., Springer, C., 2008. Use of fundus perimetry (microperimetry) to quantify macular sensitivity. Prog. Retin. Eye Res. 27, 536–548. doi:10.1016/j.preteyeres.2008.07.003
Saw, S.-M., 2006. How blinding is pathological myopia? Br. J. Ophthalmol. 90, 525–526. doi:10.1136/bjo.2005.087999
Saxena, R., Vashist, P., Tandon, R., Pandey, R.M., Bhardawaj, A., Menon, V., Mani, K., 2015. Prevalence of Myopia and Its Risk Factors in Urban School Children in Delhi: The North India Myopia Study (NIM Study). PloS One 10, e0117349. doi:10.1371/journal.pone.0117349
Vienola, K.V., Braaf, B., Sheehy, C.K., Yang, Q., Tiruveedhula, P., Arathorn, D.W., de Boer, J.F., Roorda, A., 2012. Real-time eye motion compensation for OCT imaging with tracking SLO. Biomed. Opt. Express 3, 2950–2963. doi:10.1364/BOE.3.002950
Virgili, G., Menchini, F., Casazza, G., Hogg, R., Das, R.R., Wang, X., Michelessi, M., 2015. Optical coherence tomography (OCT) for detection of macular oedema in patients with diabetic retinopathy. Cochrane Database Syst. Rev. 1, CD008081. doi:10.1002/14651858.CD008081.pub3
Vujosevic, S., Pilotto, E., Bottega, E., Benetti, E., Cavarzeran, F., Midena, E., 2008. Retinal fixation impairment in diabetic macular edema. Retina Phila. Pa 28, 1443–1450. doi:10.1097/IAE.0b013e318183571e
Wong, T.Y., Ohno-Matsui, K., Leveziel, N., Holz, F.G., Lai, T.Y., Yu, H.G., Lanzetta, P., Chen, Y., Tufail, A., 2015. Myopic choroidal neovascularisation: current concepts and update on clinical management. Br. J. Ophthalmol. 99, 289–296. doi:10.1136/bjophthalmol-2014-305131
Wu, Z., Ayton, L.N., Guymer, R.H., Luu, C.D., 2014. Comparison between multifocal electroretinography and microperimetry in age-related macular degeneration. Invest. Ophthalmol. Vis. Sci. 55, 6431–6439. doi:10.1167/iovs.14-14407
Zaben, A., Zapata, M.Á., Garcia-Arumi, J., 2015. Retinal sensitivity and choroidal thickness in high myopia. Retina Phila. Pa 35, 398–406. doi:10.1097/IAE.0000000000000367
Zhou, J., Liu, W., Li, X., Li, Q., Hao, J., Wang, X.-L., 2011. [Macular retinal function detected by MP-1 microperimetry in normal subjects of middle and old age]. Zhonghua Yan Ke Za Zhi Chin. J. Ophthalmol. 47, 35–38.

36
10. Annexes:
ANNEX I. INFORMED CONSENT
HOJA DE CONSENTIMIENTO INFORMADO
En cumplimiento de los artículos 8 y siguientes de la Ley 41/2002, de 14 de noviembre,
básica reguladora de la autonomía del paciente y de derechos y obligaciones en materia
de información y documentación clínica le ofrecemos por escrito y de manera
comprensible la descripción de las características de riesgo y beneficios de participar en
el proyecto de investigación cuyo objetivo es determinar la asimetría de sensibilidad
retiniana en el área macular mediante micropermetría (MAIATM).
Nombre del informador: Zeyad Alzaben (BCH, MSc) Firma:
Descripción
Este proyecto de investigación está siendo realizado por Zeyad A. Alzaben, estudiante
del máster de rehabilitación visual de la universidad de Valladolid.
El propósito de esta investigación es determinar la asimetría de sensibilidad retiniana
en el área macular en pacientes con miopía alta mediante micropermetría (MAIATM).
Usted es candidato para participar en este proyecto de investigación por miopía alta.
Si acepta participar en este proyecto de investigación se le solicitará la realización de un
conjunto de pruebas y la recolección de datos como su refracción ocular, agudeza
visual, parámetros de la retina estructural mediante la tomografía de coherencia
óptica y parámetros funcionales mediante la microperimetría para determinar su
sensibilidad a la luz en diferentes zonas de su retina central. La participación en este
estudio le tomará aproximadamente unos 30 min.
Riesgos y beneficios
37
No existen riesgos a nivel ocular durante la realización de este estudio dado que las
pruebas que se realizan son empleadas en las consultas de optometría y oftalmología de
manera cotidiana y todas ellas en este caso se realizan de manera NO invasiva.
Los beneficios esperados de esta investigación son su aportación a la ciencia, y la
realización de distintas pruebas de tipo optométrico-oftalmológicas sin coste alguno.
Confidencialidad
La identidad del participante será protegida ya que todo este proceso será totalmente
anónimo, solo se conocerá la edad y el sexo. Toda información o datos que pueda
identificar al participante serán manejados confidencialmente.
Solamente el optometrista de este trabajo y los facultativos implicados en esta
investigación tendrán acceso a los datos que puedan identificar directa o
indirectamente a un participante, incluyendo esta hoja de consentimiento.
Estos datos serán almacenados en expedientes confidenciales con la finalidad única de
esta investigación y se conservarán por un periodo de 2 años máximo después de que
concluya este estudio.
Derechos
Si ha leído este documento y ha decidido participar, por favor entienda que su
participación es completamente voluntaria y que usted tiene derecho a abstenerse de
participar o retirarse del estudio en cualquier momento, sin ninguna penalidad. También
tiene derecho a no participar en alguna prueba en particular. Además, tiene derecho a
recibir una copia de este documento.
Si tiene alguna pregunta o desea más información sobre esta investigación, por favor
comuníquese al Tel. 972506386

38
Su firma en este documento significa que ha decidido participar después de haber leído
y discutido la información presentada en esta hoja de consentimiento y que ha recibido
copia de este documento.
Nombre de el/la participante Firma Fecha
Ha discutido el contenido de esta hoja de consentimiento con el/la arriba firmante
Nombre de el/la participante Firma Fecha


