Download - FULL YEAR2016 RESULTS PRESENTATION

FULL YEAR 2016 RESULTSPRESENTATION
15 February 2017

EURONEXT PRESENTING TEAM
215 February, 2017
Giorgio ModicaStephane Boujnah
Lee Hodgkinson
Group Chief Financial
Officer
CEO & Chairman of
the Managing Board
Head of Markets &
Global Sales
Anthony Attia
Global Head of Listing

AGENDA
315 February, 2017
I 2016 Business review
II 2016 Financial highlights
III Update on Agility for Growth
IV Appendices: Financial statements

EXECUTIVE SUMMARY
415 February, 2017
IDespite pressure on volumes, strong financial performance thanks
to cost discipline and efficient yield management
IIImportant milestones achieved in the deployment of Agility for
Growth strategic plan
IIIDisciplined approach to capital deployment and significant
optionality in balance sheet
IV
Creating optionality for clearing, including through the potential
acquisition of LCH.Clearnet SA, a strong value proposition for
Euronext’s stakeholders
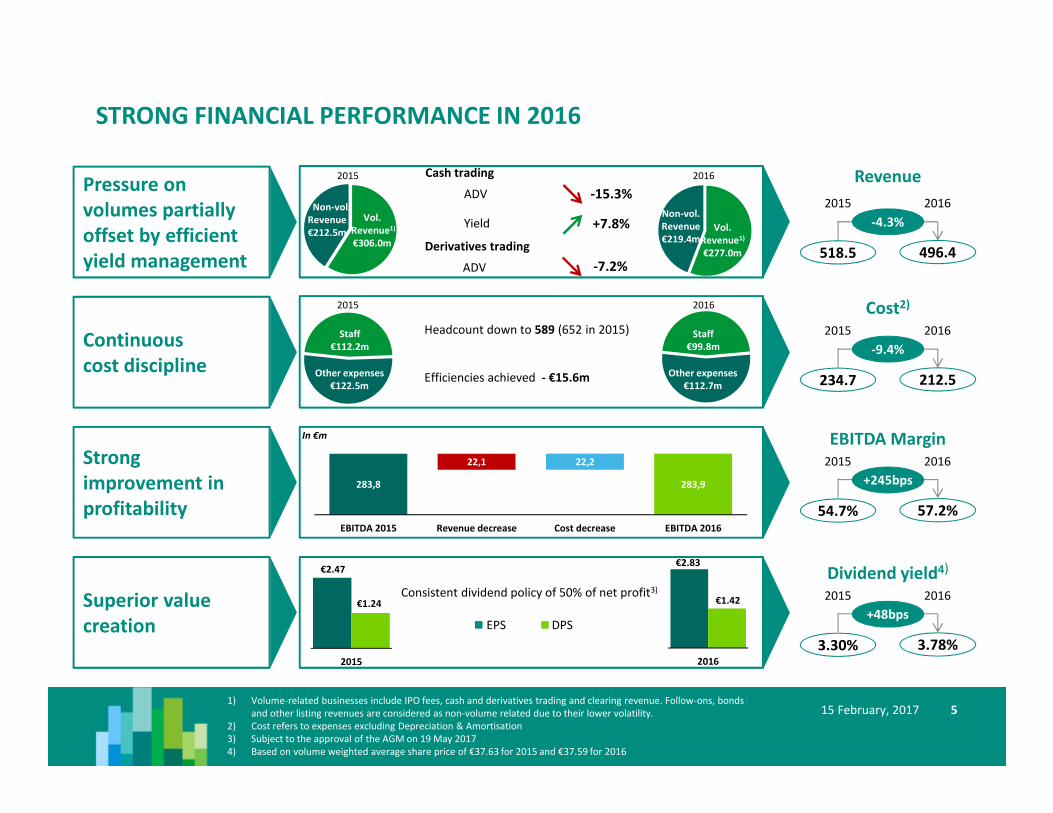
STRONG FINANCIAL PERFORMANCE IN 2016
515 February, 2017
Continuous
cost discipline
Pressure on
volumes partially
offset by efficient
yield management
Strong
improvement in
profitability
Cash trading
ADV
Yield
-15.3%
+7.8%
-7.2%
Revenue
496.4518.5
20162015
-4.3%
Derivatives trading
ADV
Superior value
creation
Cost2)
212.5234.7
20162015
-9.4%
283,8
22,1 22,2
283,9
EBITDA 2015 Revenue decrease Cost decrease EBITDA 2016
EBITDA Margin
57.2%54.7%
20162015
+245bps
Headcount down to 589 (652 in 2015)
Efficiencies achieved - €15.6m
2015 2016
Dividend yield4)
3.78%3.30%
20162015
+48bps
1) Volume-related businesses include IPO fees, cash and derivatives trading and clearing revenue. Follow-ons, bonds
and other listing revenues are considered as non-volume related due to their lower volatility.
2) Cost refers to expenses excluding Depreciation & Amortisation
3) Subject to the approval of the AGM on 19 May 2017
4) Based on volume weighted average share price of €37.63 for 2015 and €37.59 for 2016
2015 2016
2015 2016
Staff
€112.2m
Staff
€99.8m
Other expenses
€122.5m
Other expenses
€112.7m
Vol.
Revenue1)
€306.0m
Vol.
Revenue1)
€277.0m
Non-vol.
Revenue
€212.5m
Non-vol.
Revenue
€219.4m
EPS DPS
In €m
€2.47€2.83
€1.24 €1.42Consistent dividend policy of 50% of net profit3)
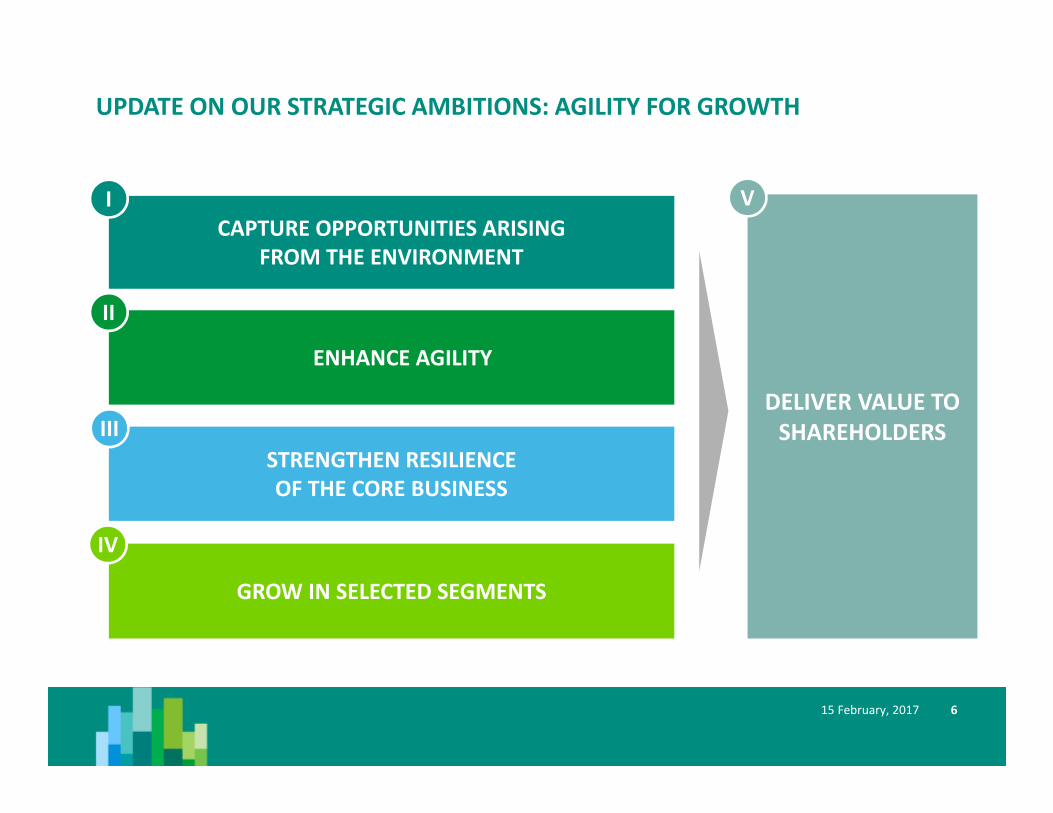
ENHANCE AGILITY
DELIVER VALUE TO
SHAREHOLDERS
CAPTURE OPPORTUNITIES ARISING
FROM THE ENVIRONMENT
STRENGTHEN RESILIENCE
OF THE CORE BUSINESS
GROW IN SELECTED SEGMENTS
UPDATE ON OUR STRATEGIC AMBITIONS: AGILITY FOR GROWTH
615 February, 2017
I
II
III
IV
V

ENHANCE AGILITY
DELIVER VALUE TO
SHAREHOLDERS
CAPTURE OPPORTUNITIES ARISING
FROM THE ENVIRONMENT
STRENGTHEN RESILIENCE
OF THE CORE BUSINESS
GROW IN SELECTED SEGMENTS
� Spikes in volumes around macro-events despite low volatility
� Launch of MAR and MiFID II compliant services
� Innovative projects: Tredzone, Algomi, Blockchain
� 70% of gross cost reduction programme already achieved
� Major steps in Optiq project and IT relocation
� Structured and pragmatic approach of M&A translating into first deals to
complement the business mix
� Client centricity intensified
� Significant milestones achieved to strengthen core business (family business
offer, new best execution service for retail investors, new fee scheme for non-
member proprietary flow, creation of a new pan-European block trading service,
launch of Euronext Chequers services, etc)
� Additional initiative identified since May 2016 in Fixed Income
� Major milestones for all growth initiatives
� On boarding of key talents & significant milestones achieved with first revenue
contribution
� Increase in shareholder value
proposition:
� 14.5% increase in dividend
in 2016 vs 2015
� Yield of 3.8% in 2016 vs
3.3% in 2015
� Significant improvement in
operational gearing
� Agility for Growth targets for
FY’2019 confirmed
� First acquisitions since IPO
UPDATE ON OUR STRATEGIC AMBITIONS: AGILITY FOR GROWTH
715 February, 2017
I
II
III
IV
V
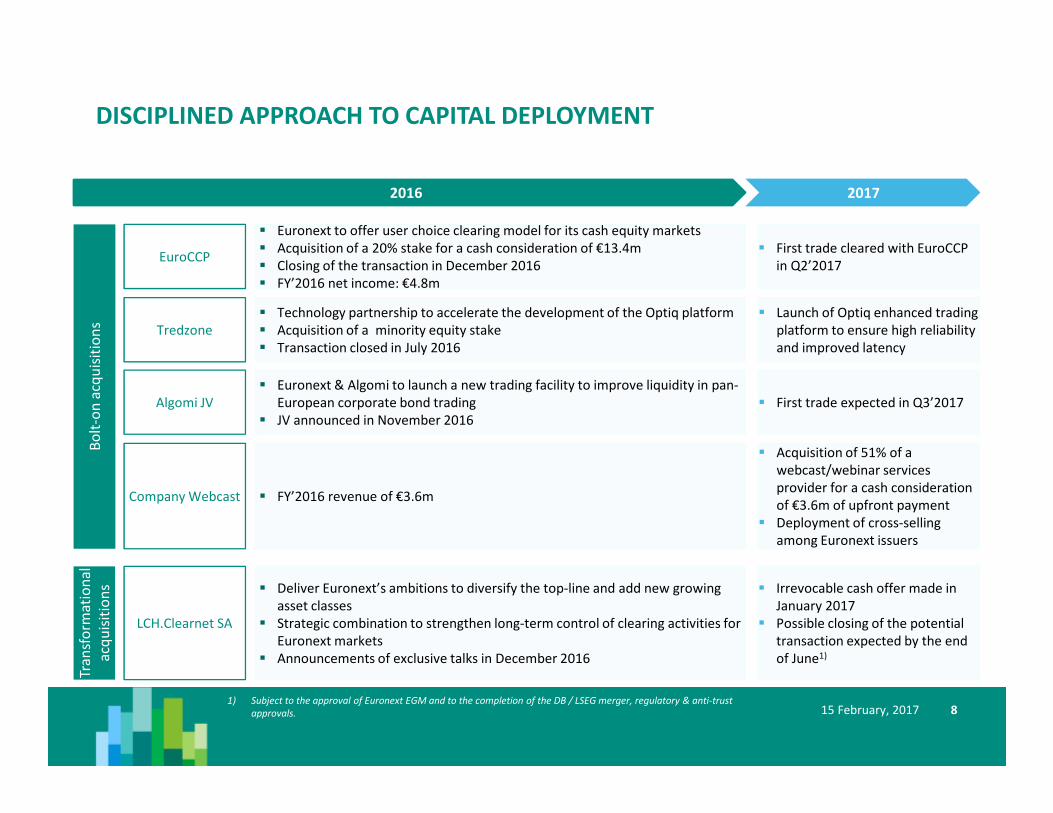
DISCIPLINED APPROACH TO CAPITAL DEPLOYMENT
815 February, 2017
20172016
Bo
lt-o
n a
cqu
isit
ion
sTr
an
sfo
rma
tio
na
l
acq
uis
itio
ns
EuroCCP
Tredzone
Algomi JV
Company Webcast
LCH.Clearnet SA
� Euronext to offer user choice clearing model for its cash equity markets
� Acquisition of a 20% stake for a cash consideration of €13.4m
� Closing of the transaction in December 2016
� FY’2016 net income: €4.8m
� First trade cleared with EuroCCP
in Q2’2017
� Irrevocable cash offer made in
January 2017
� Possible closing of the potential
transaction expected by the end
of June1)
� Technology partnership to accelerate the development of the Optiq platform
� Acquisition of a minority equity stake
� Transaction closed in July 2016
� Euronext & Algomi to launch a new trading facility to improve liquidity in pan-
European corporate bond trading
� JV announced in November 2016
� FY’2016 revenue of €3.6m
� Deliver Euronext’s ambitions to diversify the top-line and add new growing
asset classes
� Strategic combination to strengthen long-term control of clearing activities for
Euronext markets
� Announcements of exclusive talks in December 2016
� Launch of Optiq enhanced trading
platform to ensure high reliability
and improved latency
� First trade expected in Q3’2017
� Acquisition of 51% of a
webcast/webinar services
provider for a cash consideration
of €3.6m of upfront payment
� Deployment of cross-selling
among Euronext issuers
1) Subject to the approval of Euronext EGM and to the completion of the DB / LSEG merger, regulatory & anti-trust
approvals.

9
BUILDING CLEARING OPTIONALITIES
15 February, 2017
Next steps in 20172016
� Signing of definitive agreement for the acquisition of a
20% minority stake in EuroCCP
� Enables Euronext to offer user choice in clearing for the
equity markets within the Eurozone, through the
implementation of a preferred CCP model followed by
a fully interoperable service
Acquisition of 20% stake in EuroCCP(Completed December 2016)
� Euronext has signed a binding agreement to acquire
LCH.Clearnet SA
� Cash consideration: €510m1)
� Transaction to be approved by Euronext EGM
� Completion is subject to completion of the DB / LSEG
merger, regulatory & anti-trust approvals.
Potential acquisition of LCH.Clearnet SA
(Announced January 2017)
Irrespective of the
completion of the
acquisition of LCH.Clearnet
SA, Euronext remains
committed to delivering the
best long-term solution for
its post-trade activities, in
the interests of its clients
and shareholders
CASH EQUITIES CLEARING
FINANCIAL DERIVATIVES & COMMODITIES, CASH
EQUITIES CLEARINGEXPOSURE TO NEW ASSET CLASSES: CDS & FIXED
INCOME
EURONEXT IS CREATING OPTIONALITY FOR CLEARING
1) Subject to closing adjustments

2016 FINANCIAL HIGHLIGHTS
10
REVENUE
€496.4m
-4.3%
€15.6mof
cumulated
gross
efficiencies
OPERATING
EXPENSES
ex. D&A
€212.5m
-9.4%
EBITDA
MARGIN
57.2%
NET PROFIT
€197.0mEPS
€2.83(basic)
CASH
POSITION
€174.5m by 31st Dec.
2016
HEADCOUNT
589(652 as of
31th Dec.
2015)
15 February, 2017
� Record level of profitability in spite of low
volume environment
� Achievement of 70% of gross cost reduction
plan target
� Headcount at year-end lower than expected
due to faster-than-expected relocation of IT
operations from Belfast to Porto
� Agility for Growth initiative contributed
€0.8m revenue and €2.1m cost
� Operating expenses reduced by some
release of accruals (€3.3m)
� Release of €16.3m of tax provision
benefited to the net profit
� Increase in EPS translated in +14.5%
increase in DPS, subject to the AGM
approval on 19 May 2017
� Net cash position of €105.5m at year-end,
netted from €69m of long-term debt
DPS1)
€1.42
+14.5%
1) Subject to the approval of the AGM on 19 May 2017
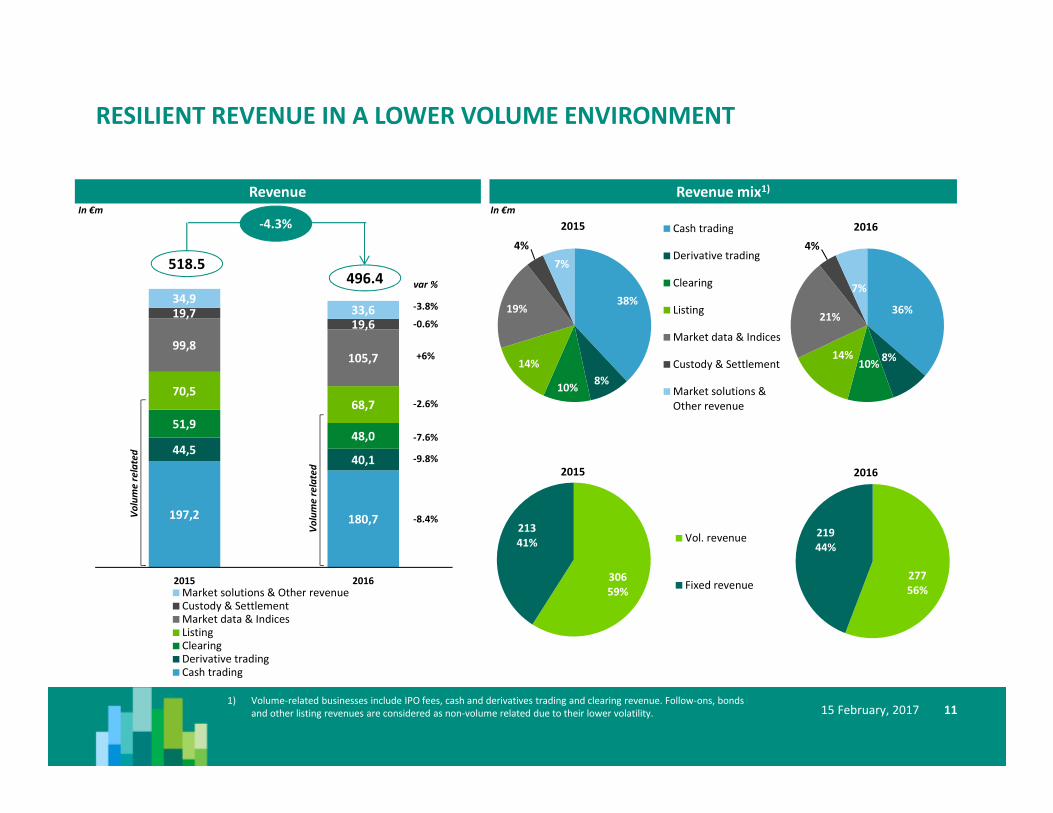
197,2 180,7
44,540,1
51,948,0
70,568,7
99,8105,7
19,719,6
34,933,6
2015 2016
Market solutions & Other revenueCustody & SettlementMarket data & IndicesListingClearingDerivative trading
Cash trading
RESILIENT REVENUE IN A LOWER VOLUME ENVIRONMENT
1115 February, 2017
518.5496.4
-4.3%
Revenue mix1)
306
59%
213
41% Vol. revenue
Fixed revenue277
56%
219
44%
1) Volume-related businesses include IPO fees, cash and derivatives trading and clearing revenue. Follow-ons, bonds
and other listing revenues are considered as non-volume related due to their lower volatility.
RevenueIn €m In €m
var %
Vo
lum
e r
ela
ted
Vo
lum
e r
ela
ted
-8.4%
-9.8%
-7.6%
-2.6%
+6%
-0.6%
-3.8%38%
8%10%
14%
19%
4%
7%
Cash trading
Derivative trading
Clearing
Listing
Market data & Indices
Custody & Settlement
Market solutions &
Other revenue
36%
8%10%
14%
21%
4%
7%
2015
2015
2016
2016

234,7
212,5212.5219.4
2015 2016
Fixed cost
Non-vol.
revenue
283,8 283,9
2015 2016
22,9 20,7
13,6 10,2
27,826,3
39,638,4
18,617,1
112,2
99,8
2015 2016
Staff Expenses
Systems and communications
Professional services
Clearing expenses
Accommodation
Other expenses
STRONG INCREASE IN EBITDA MARGIN THANKS TO COST DISCIPLINE
1215 February, 2017
234.7
212.5
-9.4%54.7% 57.2%
+245bps
Operating Expenses1) & EBITDA Cost efficiency
EPS & DPS
€1,24
€1,42
2015 2016
Dividend Per Share1)
€2,47
€2,83
2015 2016
Earnings Per Share
+14.6%
Fixed operating cost3) coverage ratio
91% 103%
70% of Agility for Growth target achieved
2)
1) Operating expenses deflated by €3.3m of release of provisions
2) Non-vol. revenue businesses include listing exc. IPO fees, Market data & indices, Custody & Settlement and Market
solutions & other revenue
3) 100% of operating expenses are considered as fixed
4) Subject to the approval of the AGM on 19 May 2017
var %
-9.6%
-24.8%
-5.2%
-3.1%
-8.0%
-11.1%
In €m
15.6
In €m
+14.5%
6
5,4
4,2
22.0
Achieved Target
Q4'16
Q3'16
Q2'16
70%

158.6 174.5
390,0 390,0
2015 2016
RCF
Cash & Cash
Equivalent
Minimum cash for
operation
283,8 283,9
140,0
181,1
2015 2016
EBITDA
Net operating
cash flow
STRONG CASH FLOW GENERATION AND LIQUIDITY POSITION
1315 February, 2017
EBITDA / operating cash flow conversion rate Balance sheet (€m)
Liquidity (€m)Debt / EBITDA Leverage
-50,5-105,5
2015 2016
Net Debt
108,2
69,0
2015 2016
Gross Debt
0.38x 0.24x
-0.18x -0.37x
49%
64%
Assets Liabilities & Equity
548.6 564.5
60%
17%
23%
72%
12%
16%
In €m
In €m
In €m
In €m
158,6 174,5
106,7 89,2
321,4 321,2
163,2 172,6
2015 2016
Other non-current assets
Goodwill & other intangibles
Other current assets
Cash & Cash equivalent
178,7 120,2
15,820,3
108,269,0
447,2548,0
2015 2016
Shareholders Equity
Borrowings
Other non-current liabilities
Current liabilities
749.9 749.9757.5 757.5
€438.6m
Available
€454.5m
Available
110

UPDATE ON AGILITY FOR GROWTH

CAPTURE OPPORTUNITIES ARISING FROM THE ENVIRONMENT
15
I
II
III
IV
V
Market
trends
Regulation
Innovation
� Number of volatility spikes expected related to several national
elections and Brexit developments
� Increased probability of US interest rates rise
� Abrupt end of ECB asset purchasing programme unlikely in Europe
� Domestic Eurozone demand improving
� MiFID II:
� Build solutions to simplify compliance with MiFID II
� Implement new market data agreements incorporating
changes required on disaggregation of data
� Benchmark: Address raising client demand for independently
administrated benchmarks
� PRIIPS: Prepare for implementation
� Deliver Optiq innovation to customers for market data and the full
cash trading chain
� Launch the company to develop a post-trade blockchain
infrastructure for SMEs in Europe
� Strengthen screening of innovative companies to partner with or
invest in
� Leverage the capability of the new innovative trading platform
Optiq to derive further value from data
2016 Achievements Next steps in 2017
15 February, 2017
� MiFID II: Detailed implementation rules published
� MAR: Updated rules implemented, launch of MAR
compliant service in July 2016
� Benchmark: rules published in June, introducing more
stringent administration rules and a tailored approach for
regulated data benchmarks
� PRIIPS1): implementation postponed to 30 December
2017
� Investment in Tredzone, a technology solution provider
specialised in developing software tools for handling
complex data with high volumes and guaranteed latency
� MoU with other financial institutions to explore the
development of a post-trade blockchain infrastructure
for SMEs in Europe
� JV with Algomi to establish an MTF for pan-European
corporate bond trading
� Long volatility down trend with spikes in volumes around
Brexit and US elections
� Strong increase in volumes at the end of the year thanks
to portfolio and index rebalancing effect
� Positive momentum for European equities and increase
in investor confidence in H2’2016
1) Packaged retail and insurance-based investment products

ENHANCE AGILITY
16
� Closing of Belfast centre to be effective at the end of Q1’2017
� Infrastructure optimization and renegotiation of database contract
� Reinforcement of vendor management and contracts
renegotiation
� Deployment of a new technology center in Porto in Q1’2017.
� Optiq:
� May 2017: major upgrade of cash and derivatives market data
infrastructure
� October 2017: completion of migration to Optiq for cash
business including MiFID II compliance
� First building block of corporate services offering through the
acquisition of a majority stake in Company Webcast
� Continue disciplined screening of acquisitions opportunities to fuel
growth initiatives
15 February, 2017
� Optiq: Customer test platform opened as scheduled in
November for market data. Customer documentation
already communicated to clients. Very positive client
feedback on proposed evolutions
� Service delivery transferred to Porto following
knowledge transfer from Belfast
� Completion of French restructuring plan
� 70% of gross cost reduction programme already
completed.
� Relocation of Belfast IT team in Porto nearly achieved
with 88 people onboarded
� Reduction of the footprint in Basildon data center
achieved
� Reduction of the network costs completed
2016 Achievements Next steps in 2017
Cost
management
discipline
Upgraded IT &
Infrastructure
M&A
Discipline
I
II
III
IV
V
� Investment in Tredzone (July 2016)
� Announced partnership with Algomi on the corporate
bonds exchange solution (November 2016)
� Closing of the 20% stake in EuroCCP (December 2016)

STRENGTHEN RESILIENCE OF THE CORE BUSINESS
LONG VOLATILITY DOWN-TREND WITH SPIKES IN VOLUMES AND VOLATILITY
17
I
II
III
IV
V
15 February, 2017
20172016
10
15
20
25
30
35
4 000
5 000
6 000
7 000
8 000
9 000
10 000
Jan Feb Mar Apr May Jun Jul Aug Sep Oct Nov Dec Jan Feb Mar Apr May Jun Jul Aug Sep Oct Nov Dec
2015 2016
Vo
lati
lity
in
de
x v
alu
e
Eu
ron
ex
t C
ash
AD
V (
€m
.)
Euronext Cash ADV and volatility
Euronext Cash ADV (€m.) Euro Stoxx 50 Volatility
Brexit
US elections
4 000
5 000
6 000
7 000
8 000
9 000
10 000
-25,0%
-20,0%
-15,0%
-10,0%
-5,0%
0,0%
5,0%
10,0%
Jan Feb Mar Apr May Jun Jul Aug Sep Oct Nov Dec Jan Feb Mar Apr May Jun Jul Aug Sep Oct Nov Dec
2015 2016
Eu
ron
ex
Ca
sh A
DV
(€
m.)
Re
turn
pre
miu
m E
uro
Sto
xx
/S&
P 5
00
Yo
Y%
EuroStoxx/S&P 500 YoY Return Premium and Euronext Volume
Euronext Cash ADV (€m.) Return premium EuroStoxx/S&P 500 YoY%
Increasing European
Equity premium
October - Germany
Latest date for elections
September- Spain
Possible Catalonia independence
referendum
11-18 June - France
Legislative elections
23 April - France
1st round of the presidential
elections
31 March - UK
Article 50 activation deadline
15 March - Netherlands
General Elections
7 May - France
2nd round of the presidential
elections
Year-end - ECB
Scheduled end of QE extension
Eurozone upturn set to continue
Likely
vo
latility
spike
s

STRENGTHEN RESILIENCE OF THE CORE BUSINESS
LISTING
18
I
II
III
IV
V
32,8 29,8
16,0 19,7
12,3 8,1
3.9 6.2
5,5 4,9
2015 2016
Annual fees Follow ons IPOs Other Bond Fees
15 February, 2017
Listing Fees
7.9 8.7
103.8
132.1
2015 2016Large Cap SME
Money raised
Next steps in 20172016
� Uncertainty and volatility resulted in low activity
on primary markets
� All time high on secondary issues from corporates
� Large increase in centralization activity
(Portuguese T-Bonds)
� ETPs fee grids revised in 2016 to boost trading,
resulting in 31% drop in listing revenues
� Improving market conditions,
first deals will be key
� Pipeline building up – 8 deals
expected in Q1’2017 vs 1 in
Q1’2016
� Jumbo follow-ons expected,
supported by M&A activity
� Launch of family business offer
� Roll out of centralization offer
leveraging on deals achieved in
Portugal in 2016. Launch of
similar offer in H2’2017 in
Belgium
� Revamp of Free Market
70.5 68.7
-2.6%# of
listings52 28
In €m In €bn
STRENGTHEN RESILIENCE OF THE CORE BUSINESS
CASH TRADING
19
I
II
III
IV
V
15 February, 2017
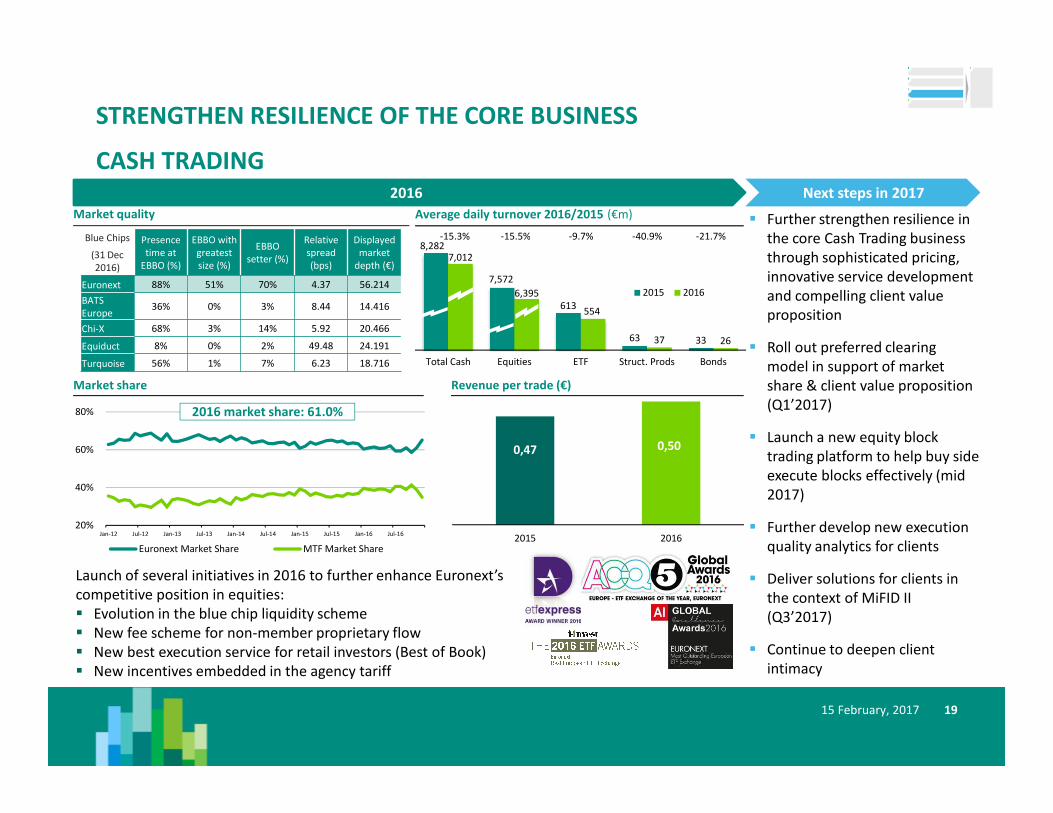
Market share
Blue Chips Presence
time at
EBBO (%)
EBBO with
greatest
size (%)
EBBO
setter (%)
Relative
spread
(bps)
Displayed
market
depth (€)(31 Dec
2016)
Euronext 88% 51% 70% 4.37 56.214
BATS
Europe36% 0% 3% 8.44 14.416
Chi-X 68% 3% 14% 5.92 20.466
Equiduct 8% 0% 2% 49.48 24.191
Turquoise 56% 1% 7% 6.23 18.716
8,282
7,572
613
63 33
7,012
6,395
554
37 26
Total Cash Equities ETF Struct. Prods Bonds
2015 2016
-15.3% -15.5% -9.7% -40.9% -21.7%
20%
40%
60%
80%
Jan-12 Jul-12 Jan-13 Jul-13 Jan-14 Jul-14 Jan-15 Jul-15 Jan-16 Jul-16
Euronext Market Share MTF Market Share
Next steps in 20172016
Market quality Average daily turnover 2016/2015 (€m) � Further strengthen resilience in
the core Cash Trading business
through sophisticated pricing,
innovative service development
and compelling client value
proposition
� Roll out preferred clearing
model in support of market
share & client value proposition
(Q1’2017)
� Launch a new equity block
trading platform to help buy side
execute blocks effectively (mid
2017)
� Further develop new execution
quality analytics for clients
� Deliver solutions for clients in
the context of MiFID II
(Q3’2017)
� Continue to deepen client
intimacy
Launch of several initiatives in 2016 to further enhance Euronext’s
competitive position in equities:
� Evolution in the blue chip liquidity scheme
� New fee scheme for non-member proprietary flow
� New best execution service for retail investors (Best of Book)
� New incentives embedded in the agency tariff
0,47 0,50
2015 2016
Revenue per trade (€)
2016 market share: 61.0%
STRENGTHEN RESILIENCE OF THE CORE BUSINESS
DERIVATIVES TRADING
2015 February, 2017
I
II
III
IV
V
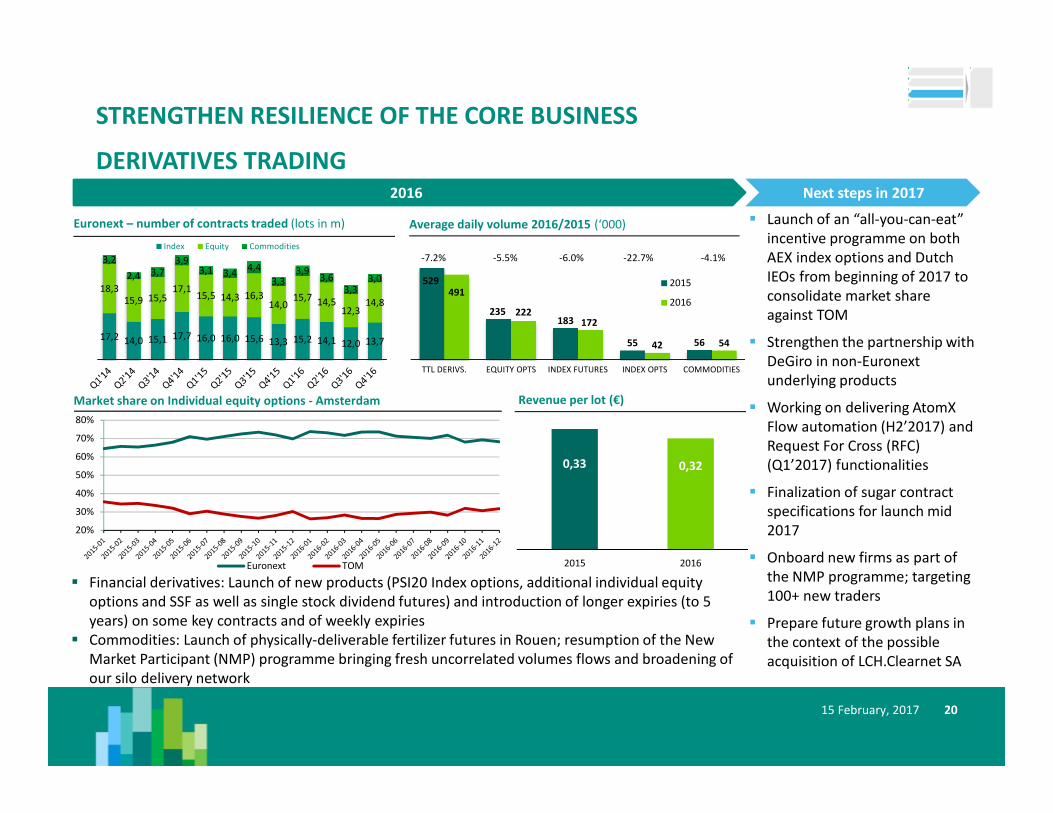
Euronext – number of contracts traded (lots in m)
17,2 14,0 15,1 17,7 16,0 16,0 15,6 13,3 15,2 14,1 12,0 13,7
18,315,9 15,5
17,115,5 14,3 16,3
14,015,7 14,5
12,314,8
3,2
2,4 3,73,9
3,1 3,44,4
3,33,9
3,6
3,33,0
Index Equity Commodities
529
235183
55 56
491
222172
42 54
TTL DERIVS. EQUITY OPTS INDEX FUTURES INDEX OPTS COMMODITIES
2015
2016
-5.5% -6.0% -22.7% -4.1%-7.2%
Average daily volume 2016/2015 (‘000)
Next steps in 20172016
0,33 0,32
2015 2016
Revenue per lot (€)
20%
30%
40%
50%
60%
70%
80%
Euronext TOM
Market share on Individual equity options - Amsterdam
� Financial derivatives: Launch of new products (PSI20 Index options, additional individual equity
options and SSF as well as single stock dividend futures) and introduction of longer expiries (to 5
years) on some key contracts and of weekly expiries
� Commodities: Launch of physically-deliverable fertilizer futures in Rouen; resumption of the New
Market Participant (NMP) programme bringing fresh uncorrelated volumes flows and broadening of
our silo delivery network
� Launch of an “all-you-can-eat”
incentive programme on both
AEX index options and Dutch
IEOs from beginning of 2017 to
consolidate market share
against TOM
� Strengthen the partnership with
DeGiro in non-Euronext
underlying products
� Working on delivering AtomX
Flow automation (H2’2017) and
Request For Cross (RFC)
(Q1’2017) functionalities
� Finalization of sugar contract
specifications for launch mid
2017
� Onboard new firms as part of
the NMP programme; targeting
100+ new traders
� Prepare future growth plans in
the context of the possible
acquisition of LCH.Clearnet SA

STRENGTHEN RESILIENCE OF THE CORE BUSINESS
NON-TRANSACTIONAL BUSINESSES
21
I
II
III
IV
V
15 February, 2017
Next steps in 20172016
Ma
rke
td
ata
an
d
ind
ice
sM
ark
et
solu
tio
ns
Po
st-t
rad
e
� Comply with MiFID II data
disaggregation requirements
� Introduce a new single agreement
and expansion of digital data
products
� Deliver a new European Index
Family in partnership with an
external 3rd party and expansion
of CSR index concepts
� Begin delivery to the first four
Optiq™ software clients
� Further expand the managed
services portfolio
� Software solution revenue down during transition to
Optiq™ platform
� Managed services business within Solutions up following
launch of MAR surveillance service
� Market data revenue up +6.0%. Increases due to higher
non-display revenue and initiatives aimed at improving
client reporting. End user numbers continue to decline
year-on-year due to continued automation of trading
functions
� Indices revenue increased by +7.6%. AUM declined but
revenue increased due new indices created under
indexmotion initiative
� Focus on delivering clearing
optionality
� Deliver connectivity to EuroCCP
� Internationalization of Interbolsa
Increase engagement with clients
and prospects
In €m
In €m
� Clearing revenue in line with derivatives trading: -7.6%
� Custody & Settlement revenue slightly down -0.6%.
� Successful adaption to T2S and optimization of Interbolsa
IT systems and services
� Industrializing the delivery capability to deliver new
product in derivatives as well as margin efficiencies
In €m
51,9
19,7
48,0
19,6
Clearing Custody and Settlement
2015
2016
10,7
7,6
15,9
8,5 7,1
17,4
Solutions SFTI/Colo Connections Fees
& Others
2015
2016
99,8 105,7
144137
50,0
100,0
150,0
2015 2016# of units '000

European
family of
indices
Specialist
content on
agricultural
commodities
GROWTH INITIATIVES: ADDING VALUE TO INVESTORS (1/2)
22
I
II
III
IV
V
15 February, 2017
One-stop-
shop pan
European ETF
platform
Fixed Income
Next steps in 20172016
� Specifications completed and included in Optiq publication
� Broad support from more than 40 key players in the industry
� Advanced discussions with the regulator (AMF)
� Services characteristics defined (RFQ & NAV trading)
� Define services characteristics with
clients for phase 2 (ETF lending &
borrowing, options on ETFs)
� IT development to start in May 2017
� Regulatory approval
� Client readiness
� Definition of the partnership model and agreement on commercial model
� Detailed discussions with index users committee to define scope of indices
� Phasing of the project defined
Launch date
Q4’2017
� Development of clearing solution
� Define derivative products
� Confirm sales plan with partner
� Technical IT development
� Prepare for phase 2 (Smart Beta)
� Client readiness
Q2’2017 with 1st
revenue
contribution in
Q3’2017
Q4’2017
� Decision to acquire a content provider: European-wide target screening process
on-going
� European OTC platform: target operating model finalized with CCP, instruments
batches and PRAs identified, IT systems in design
� Finalize and execute on the content
provider acquisition
� OTC platform : finalize PRAs
partnerships, systems integration,
regulatory approvals
� Client readiness
� JV signed with Algomi in November
� Key features of the MTF defined
� Client on boarding process agreed with Algomi
� Revenue from licensing agreement
(Jan-17)
� Filing to FCA for MTF by end of Feb-17
� Platform planned to be live in Q3’2017
� Client readiness
� Additional opportunities related to Fixed
Income under consideration
Q3’2017

GROWTH INITIATIVES: ADDING VALUE TO INVESTORS (2/2)
DEVELOPMENT OF POST-TRADE SOLUTIONS
23
I
II
III
IV
V
15 February, 2017
Next steps in 20172016 Launch date
Chequers
� Design and implementation of the new all to all asset financing platform
consisting of:
� CCI: Chequers Collateral Inventory
� CCT: Chequers Collateral Transformation
� Successful Market Trial completed for Inventory Management
� Finalize market trials with
customers
� Finalize user agreements
� Design process of warrants based
physical delivery in CCP and
warrants financing
Q1’2017 through
Q2’2017
Riskguard� The design and build of advanced pre-trade risk management features for
derivatives and cash markets
� On boarding of 10 clients
� Completion of derivatives pre-trade risk
management features
� Completion of cash markets pre-trade
risk management features
� Continue to on-board firms
� Commence billing early Q2’2017
Q1’2017 through
Q3’2017
APA/ARM� The definition, design and implementation of multi asset Trade Publication and
Transaction Reporting services required under MiFID II
� Completion of IT implementation
� On boarding of customers
� Commence commercial service ahead of
MiFID II implementation date, 3rd January
2018
Q4’2017
� Finalize user agreements
� Warrants based physical delivery
� Launch all to all asset financing in
Q2’2017

GROWTH INITIATIVES: ADDING VALUE TO ISSUERS
24
I
II
III
IV
V
15 February, 2017
Next steps in 20172016 Launch date
The modular
corporate
services
provider
� Stakeholder consultation (issuers and investors)
� Definition of the offering finalized with model agreed for the various
components (build, buy or partner)
� 1st organic launches: roll-out of pre and post listing services with 16 post listing
mandates in France and one executed mandate in pre listing
� Acquisitions: 2 targets in due diligence phase
� Partnerships: 4 agreements under negotiation
� Acquisition of Company Webcast
� Finalize due diligence process for another
acquisition
� Integrate already available services
� Define & implement marketing and
commercial roadmap.
� Execute partnerships
Q1’2016
The exchange
for European
Tech SMEs
� Further assessment of European distribution of Tech SMEs in Europe confirmed
initial assessment in terms of countries (Germany, Switzerland, Italy & Spain)
� Value proposition finalized with specific services identified to boost visibility
towards investors
� Launch of local recruitments and search for representation offices in 6 European
cities
� 7 companies already listed – pipeline building up
� Sales rep. starting on 1 Feb. in Frankfurt,
Munich and Zurich
� Communication and marketing launch
campaign
� 2 companies pre-filed for listing in
H1’2017; 6 additional prospects
identified for 2017
Q3’2016

DELIVER VALUE TO OUR SHAREHOLDERS
25
I
II
III
IV
V
2019 Ambitions1)
Re
ve
nu
eC
ost
sM
arg
in
20151) 20161)
Core
business
Selected
growth
initiatives
Total
Costs
Management
Selected
growth
initiatives
Total
EBITDA
Margin
15 February, 2017
61-63%EBITDA Margin
+1% CAGR 2015-19E
€219m
+6% CAGR 2016-19E
+€35m
-3% CAGR 2015-19E
-€22m
-0% CAGR 2016-19E
+5% CAGR 2015-19E
€575m
+9% CAGR 2016-19E
+€70m
+2% CAGR 2015-19E
+€39m
+4% CAGR 2016-19E
€466.6m
€466.6m
€447.6m
€0.8m
€448.4m
€206.9m
€206.9m
€184.1m
€2.1m
€186.2m
55.6% 58.5%
1) Excluding clearing operations
APPENDICES

INCOME STATEMENT
2715 February, 2017
Income Statement (unaudited)
in €m FY’16 FY’15 var %
Revenues
Third party revenue and other income 496.4 518.5 -4%
Listing 68.7 70.5 -3%
Trading revenue, of which
Cash Trading 180.7 197.2 -8%
Derivatives Trading 40.1 44.5 -10%
Market Data & indices 105.7 99.8 6%
Post-trade, of which
Clearing 48.0 51.9 -8%
Custody and Settlement 19.6 19.7 -1%
Market Solutions & other revenue 33.0 34.1 -3%
Other income 0.6 0.7
Total Revenues and other income €496.4 €518.5 -4%
Expenses
Salaries and employee benefits (99.8) (112.2) -11%
Depreciation & Amortisation (15.1) (17.1) -12%
Other Operational Expenses, of which
System & Communication (17.1) (18.6) -8%
Professional Services (38.4) (39.6) -3%
Clearing expense (26.3) (27.8) -5%
Accommodation (10.2) (13.6) -25%
Other Operational Expenses (20.7) (22.9) -10%
Total Expenses (€227.6) (€251.8) -10%
EBITDA margin 57.2% 54.7%
Operating profit before Exceptional items €268.8 €266.8 1%
Exceptional items (10.0) (28.7) -65%
Operating profit €258.8 €238.1 9%
Net financing income / (expense) (0.8) (4.1) -81%
Results from equity investments 6.0 4.6 30%
Profit before income tax €264.0 €238.6 11%
Income tax expense (67.0) (65.9) 2%
Profit for the period €197.0 €172.7 14%

BALANCE SHEET
2815 February, 2017
Summary Balance Sheet (unaudited)in €m 2016 2015
Non-current assets
Property, plant and equipment 27.5 28.8
Goodwill and other intangible assets 321.2 321.4
Deferred income tax assets 5.0 12.7
Investments in associates and JV 16.0 0.0
Equity investments 117.1 114.3
Other receivables 7.1 7.5
Total non-current assets 493.8 484.6
Current assets
Trade and other receivables 81.6 96.2
Income tax receivable 7.6 10.5
Derivative financial instruments 0.0 0.0
Financial investments 0.0 0.0
Cash & cash equivalents 174.5 158.6
Total current assets 263.7 265.3
Total assets 757.5 749.9
Shareholders' equity
Shareholders' equity 548.0 447.2
Total Shareholders' equity 548.0 447.2
Non-current liabilities
Borrowings 69.0 108.2
Deferred income tax liabilities 0.6 0.3
Post employment benefits 13.2 8.2
Other provisions 6.5 6.6
Other Non-current liabilities 0.0 0.7
Total Non-current liabilities 89.3 124.0
Current liabilities
Borrowings 0.1 0.1
Income tax payable 27.2 50.3
Trade and other payables 90.6 105.7
Other provisions 2.3 22.6
Total Current liabilities 120.2 178.7
Total Shareholders' equity and liabilities 757.5 749.9

CASH FLOW & LIQUIDITY
2915 February, 2017
Cash flow statement (unaudited)
(€m) FY'16 FY'15
Net cash provided by/(used in) operating activities 181.1 140.0
Net cash provided by/(used in) investing activities (29.6) (5.3)
o/w capital expenditures (14.8) (20.3)
Net cash provided by/(used in) financing activities (128.6) (220.3)
Net increase/(decrease) in cash and cash equivalents 22.9 (85.6)
Cash and cash equivalents – beginning of period 158.6 241.6
Non cash exchange gains/(losses) (7.1) 2.6
Cash and cash equivalents – end of period 174.5 158.6
Liquidity
(€m) FY’16 FY'15
Cash beginning of period 158.6 241.6
Debt repayment (40.0) (140.0)
Dividend (86.2) (58.8)
Cash accumulation 142.1 115.8
Cash end of period 174.5 158.6
Minimum Cash for operations (110.0) (110.0)
Strategic Cash 64.5 48.6
RCF 390.0 390.0
Available Liquidity 454.5 438.6

DISCLAIMER
30
This presentation is for information purposes only and is not a recommendation to engage in investment activities. The information and materials contained
in this presentation are provided ‘as is’ and Euronext does not warrant as to the accuracy, adequacy or completeness of the information and materials and
expressly disclaims liability for any errors or omissions. This presentation contains materials (including videos) produced by third parties and this content has
been created solely by such third parties with no creative input from Euronext. It is not intended to be, and shall not constitute in any way a binding or legal
agreement, or impose any legal obligation on Euronext. All proprietary rights and interest in or connected with this publication shall vest in Euronext. No part
of it may be redistributed or reproduced without the prior written permission of Euronext.
This presentation may include forward-looking statements, which are based on Euronext’s current expectations and projections about future events. By their
nature, forward-looking statements involve known and unknown risks, uncertainties, assumptions and other factors because they relate to events and
depend on circumstances that will occur in the future whether or not outside the control of Euronext. Such factors may cause actual results, performance or
developments to differ materially from those expressed or implied by such forward-looking statements. Accordingly, no undue reliance should be placed on
any forward-looking statements. Forward-looking statements speak only as at the date at which they are made. Euronext expressly disclaims any obligation or
undertaking to update, review or revise any forward-looking statements contained in this presentation to reflect any change in its expectations or any change
in events, conditions or circumstances on which such statements are based unless required to do so by applicable law.
Financial objectives are internal objectives of the Company to measure its operational performance and should not be read as indicating that the Company is
targeting such metrics for any particular fiscal year. The Company’s ability to achieve these financial objectives is inherently subject to significant business,
economic and competitive uncertainties and contingencies, many of which are beyond the Company’s control, and upon assumptions with respect to future
business decisions that are subject to change. As a result, the Company’s actual results may vary from these financial objectives, and those variations may be
material.
Efficiencies are net, before tax and on a run-rate basis, ie taking into account the full-year impact of any measure to be undertaken before the end of the
period mentioned. The expected operating efficiencies and cost savings were prepared on the basis of a number of assumptions, projections and estimates,
many of which depend on factors that are beyond the Company’s control. These assumptions, projections and estimates are inherently subject to significant
uncertainties and actual results may differ, perhaps materially, from those projected. The Company cannot provide any assurance that these assumptions are
correct and that these projections and estimates will reflect the Company's actual results of operations
Euronext refers to Euronext N.V. and its affiliates. Information regarding trademarks and intellectual property rights of Euronext is located at
https://www.euronext.com/terms-use.
© 2016, Euronext N.V. - All rights reserved.
15 February, 2017


