
Ted Miller
Manager – Energy Storage and Materials Research
Ford Motor Company
Full Electric Vehicles:
Just How Big is the Niche?
NAATBatt Annual Meeting & Conference
Indian Wells, CA
March 3, 2016

Ford Electrified Vehicles: The Power of Choice
HEV PHEVBEVFusion Hybrid C-Max Hybrid
Fusion EnergiC-Max Energi
Focus Electric
1
• There is no single electrification solution that satisfies all customer requirements
• The right solution depends on individual usage profiles and needs

• First Ford Production EV: 1999 Ford Electric Ranger
− Low Volume (~1,500)
− Most leased for fleet use (few private leases)
− All leases were terminated by 2004, vehicles returned
• Generation I: Hybrid Technology Introductions
− October 2004: Ford Escape Hybrid
− October 2005: Mercury Mariner Hybrid
• Generation II: Hybrid Technology Introductions
− March 2009: 2Ford Fusion Hybrid
− March 2009: 2Mercury Milan Hybrid
− September 2012: Lincoln MKZ Hybrid
− Note: 2009 MY Escape Hybrid updated to 2.5L Atkinson,
but c/o trans- GEN 1.5
Ford’s Recent Electrified Vehicle History
1998 Ford Electric Ranger 2004 Ford Escape Hybrid 2009 Fusion Hybrid 2013 C-Max Hybrid
• Generation III: Hybrid Technology Introductions
− 2013 C-Max Hybrid
− 2013 Fusion Hybrid
− 2013 C-Max Energi
− 2013 Fusion Energi
• Battery EV: 2013 Ford Focus Electric
• Start-Stop: 2013 Fusion 1.6L Ecoboost (first application in
NA) and various applications in Europe (gas, diesel, manual
and automatic transmissions)
2

US Sales Status (CYTD sales as of August 2015)
3
0 10,000 20,000 30,000
Honda Insight
Nissan Pathfinder
Lexus NX
Honda CR-Z
Infiniti QX60
Infiniti Q50
Toyota Highlander
Buick LaCrosse
Honda Civic
Lexus RX
Subaru XV Crosstrek
Lincoln MKZ
Lexus ES
Kia Optima
Toyota Avalon
Honda Accord
Lexus CT
Hyundai Sonata
Toyota Camry
Ford C-MAX/Fusion
Toyota Prius/Prius C
HEV YTD Sales
0 5000 10000 15000
Toyota RAV4
Mercedes GLE
Honda Accord
Mitsubishi I
Porsche 918 Spyder
Porsche Panamera
Porsche Cayenne
Smart ForTwo
Ford Focus
BMW i8
Chevrolet Spark
Volkswagen Golf
Fiat 500
Toyota Prius
BMW i3
Chevrolet Volt/Cadillac ELR
Ford C-MAX/Fusion
Nissan Leaf
Tesla Model S
PHEV and BEV YTD Sales
BEV
PHEV
• Ford has the second highest selling HEV and the best selling PHEV in the US today
122k sales
Source : WardsAuto.com Reference Center

Global Electrified Vehicle Mix
FHEV
48%PHEV
39%
BEV
11%
MHEV
2%
2024
Source: 2015 LMC Automotive
2015 U.S. EV Sales
FHEV,
386,393
PHEV,
38,555
BEV,
53,641
Global Projected Sales Volume
FHEV
58%
PHEV
23%
BEV
7%
MHEV
12%
2019
4
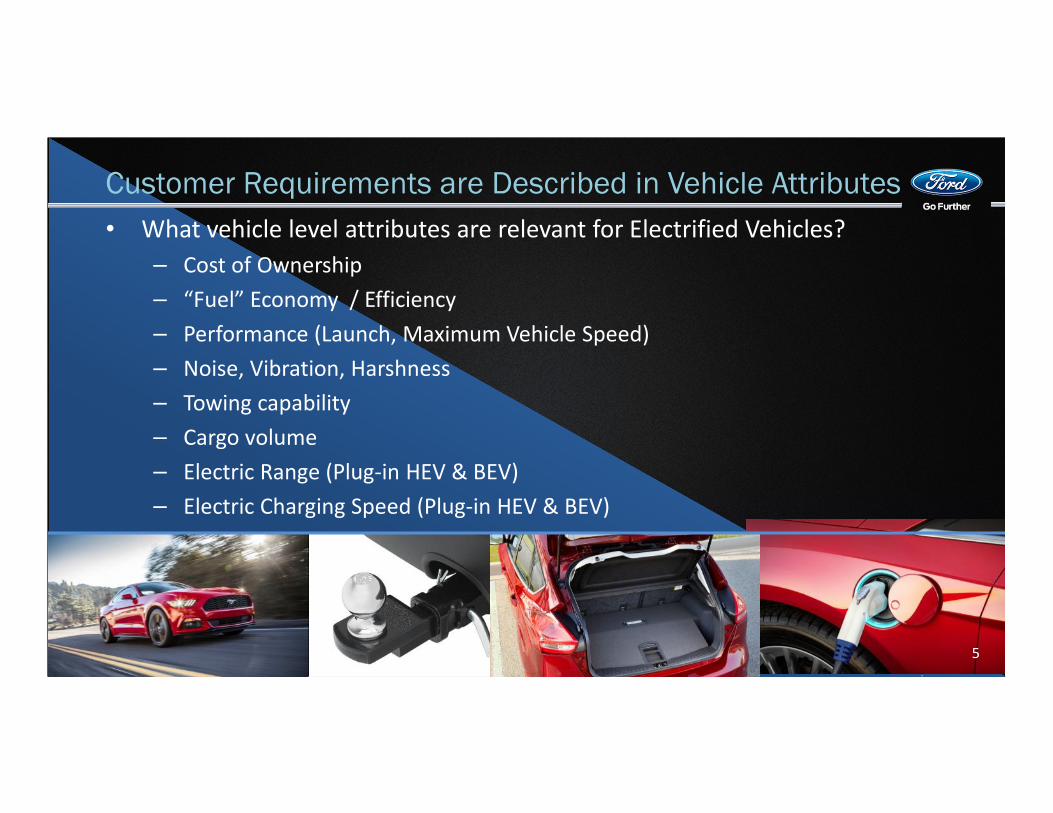
Customer Requirements are Described in Vehicle Attributes
5
• What vehicle level attributes are relevant for Electrified Vehicles?
– Cost of Ownership
– “Fuel” Economy / Efficiency
– Performance (Launch, Maximum Vehicle Speed)
– Noise, Vibration, Harshness
– Towing capability
– Cargo volume
– Electric Range (Plug-in HEV & BEV)
– Electric Charging Speed (Plug-in HEV & BEV)

0
5
10
15
20
1200 1400 1600 1800 2000 2200 2400
Ba
tte
ry I
nst
all
ed
Ca
pa
city
(k
Wh
)
Curb Weight (kg)
• For PHEVs, the battery is sized to deliver EV range
FHEV
PHEV
Range Extender PHEVs
Battery Installed Capacity vs. Curb Weight
6
Higher Cost

Global Regulations
US
CAN
EU
Brazil
China
4.7%
4.7%
5.1%
3.4%
5.5%
Average Annual FE / CO2 Improvement
Required by Regulation (2015-20)
• Global CO2 Regulations are becoming ever more stringent
• The average rate of improvement through 2020 is nearly 5% annually 7

0
5
10
15
20
1200 1400 1600 1800 2000 2200 2400
Ba
tte
ry I
nst
all
ed
Ca
pa
city
(k
Wh
)
Curb Weight (kg)
FHEV
PHEV
Range Extender PHEVs
• Global regulations and competitive landscape are driving increased battery capacity
• Increased battery capacity yields more EV range and reduced CO2 emissions
• Luckily, battery energy and power density are continuously improving
Impact of Global Regulations
8
Future

Vehicle Package
• Package of a large High Voltage battery entails a trade-off with other attributes
– Cargo area, ride height, 5 person seating, etc. are all attributes impacted
– An acceptable trade-off on one application, such as cargo space in 5-door, may not be
acceptable in 4-door application
• Future vehicle platform architectures aim to package the HV battery with
minimal attribute tradeoffs
9
Caradvice.comKbb.com
Wot.motortrend.comMad4wheels.com
Guideautoweb.comMotorauthority.com
Automobilemag.com Automobilereporter.com 9

40%
50%
60%
70%
80%
90%
100%
0 10 20 30 40 50 60 70 80 90 100
Ca
rgo
Ca
pa
city
xE
V
(% o
f C
on
ve
nti
on
al
cap
aci
ty)
EV Range (miles)
• Battery capacity is often traded off against cargo capacity
and fuel tank size in BEVs and PHEVs
PHEV
BEV
10
100% = No Impact on Cargo Capacity
Worse
Better
EV Range vs. Cargo Capacity – Products in the Market

Distance Between Fuel Fill-ups
11
• Long distance between fill-ups yields better customer satisfaction than overall range
• PHEVs can significantly increase distance between fill-ups

0%
10%
20%
30%
40%
50%
60%
70%
80%
90%
100%
600 800 1,000 1,200 1,400 1,600 1,800 2,000 2,200 2,400 2,600 2,800 3,000 3,200
Cu
sto
me
r P
erc
en
tile
Distance Between Fill-ups (km)
32 km EV Range
48 km EV Range
64 km EV Range
80 km EV Range
• The average distance between fuel fill-ups for our
Ford C-Max PHEV customers is more than 670 miles
• More EV range means fewer fill-ups
Based on EUROFOT customer data
Assumes 38 MPG and 14 gallon tank
Assumes 1 charge per day
PHEVs with Electric EV Range Need Less Fuel Fill-ups
12

The Power of Choice 2016
HEV Plug-InBEVFusion Hybrid
C-Max HybridFusion Energi
C-Max EnergiFocus Electric
There is no one solution that satisfies all customer
requirements – the right solution depends on
individual usage profiles and needs.13


