
From vulnerability to resilience:New (big) data and methods to characterize
tourism in European regions
Filipe BATISTAEuropean Commission, Joint Research Centre, Territorial Development unit
Science Meets Regions event on “Coastal and Maritime Tourism & Sustainable Growth”
Pori, Finland
26 September 2019

The JRC at a glance
European Commission's science and knowledge service.
Supports EU policies with independent scientific evidence.
3000 staff (3/4 research staff)
Headquarters in Brussels + research facilities in 5 Member States
+1400 scientific publications yearly

The JRC at a glance
Economy, finance and markets Energy and transport
Education, skills and employment
Innovation systems and processes
Food, nutrition and health
Resource scarcity, climate change and sustainability
People, governance in multicultural and
networked societies
Civil security
Migration and territorial development
Data and digital transformations

The Knowledge Centre for Territorial Policies
Part of a wider European Commission strategy on “Knowledge 4 Policy” aiming at improving communication and interaction between science and policy.
The KCTP aims at supporting territorial (urban & regional) development policies by promoting better holistic knowledge management and dissemination.
Key components:
Knowledge base (data, indicators)
Analytical and modelling capacity
Community of Practice on Cities (CoP-Cities)
Field studies (City-labs)
Urban Data Platform
http://ec.europa.eu/knowledge4policy/territorial

Tourism – key characteristics
Important economic sector in Europe
Travel and tourism sector contributed with 9.7% to the EU GDP and Employment in 2018 (direct, indirect, induced contributions) (source: World Travel and Tourism Council).
Strong spatial dimension
Tourism sector is not evenly distributed across countries and regions owing to geographic, cultural and socio-economic features and characteristics.
Important regional and local impacts.
Strong temporal dimension
Tourism is affected by seasonality (uneven tourism demand across seasons) due to climate patterns, holiday calendar, events.

Spatiotemporal patterns of tourism
Objectives of the study
Systematically assess the spatial and temporal patterns of tourism in Europe (EU28) at high resolution;
Obtain new insights regarding spatial patterns of tourism in Europe regionally.
Materials & Methods
Emerging sources of big geospatial data(i.e. online booking platforms);
Official statistics (Eurostat, NSIs);
GIS & data fusion.

Nights-spent, annual, NUTS2 (Eurostat)
Nights-spent,NUTS3, monthly
Temporaldisaggregation
Online booking platforms data,
point-based
Nights-spent or arrivals, NUTS2/3,
quarterly/monthly(NSIs)
Spatialdisaggregation
Tourists,pixel (100m),
monthly
ProcessingRoom density,pixel (100m)
Workflow

Data sources
Booking.com
Location of touristic accommodation establishments and their capacity (no. of rooms) for Europe (0.53M records).
TripAdvisor.com
Location of tourist accommodation establishments, restaurants (and bars, pubs, etc.) and attractions (e.g. museums, parks, sightseeing spots).
No. of reviews, seasonal breakdown, costumer rating for each location (1.2M records).
Tourism capacity

Nights-spent, annual, NUTS2 (Eurostat)
Nights-spent,NUTS3, monthly
Temporaldisaggregation
Online booking platforms data,
point-based
Nights-spent or arrivals, NUTS2/3,
quarterly/monthly(NSIs)
Spatialdisaggregation
Tourists,pixel (100m),
monthly
ProcessingRoom density,pixel (100m)
Workflow

Nights-spent, annual, NUTS2 (Eurostat)
Nights-spent,NUTS3, monthly
Temporaldisaggregation
Online booking platforms data,
point-based
Nights-spent or arrivals, NUTS2/3,
quarterly/monthly(NSIs)
Spatialdisaggregation
Tourists,pixel (100m),
monthly
ProcessingRoom density,pixel (100m)
Workflow
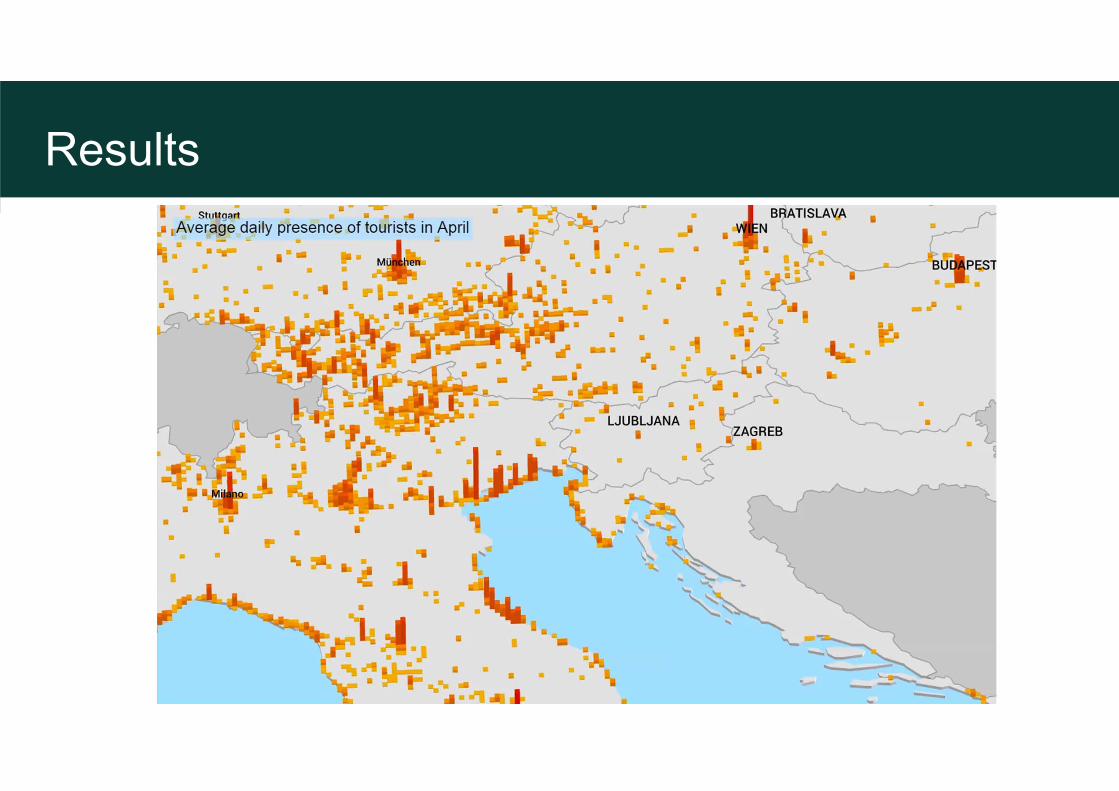
Results

Results – different spatial patterns
London Paris Rimini
Santorini Venice

Results – seasonal fluctuations
Monthly tourism density in Croatia
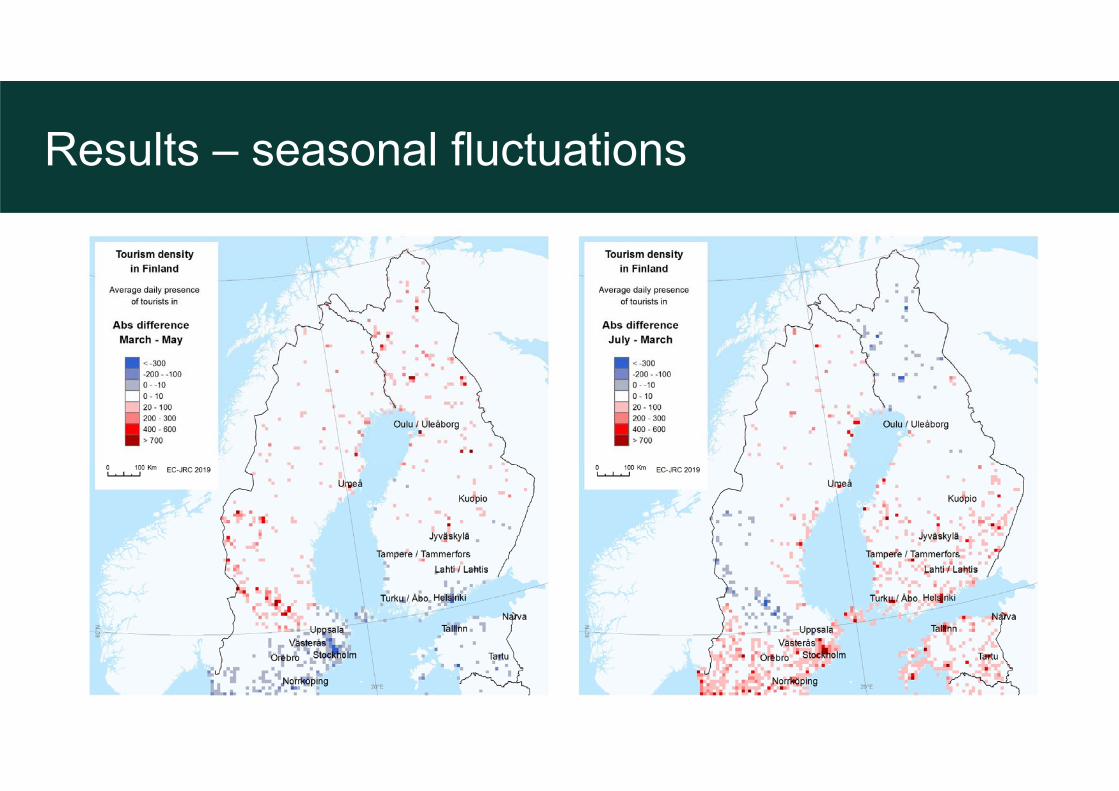
Results – seasonal fluctuations
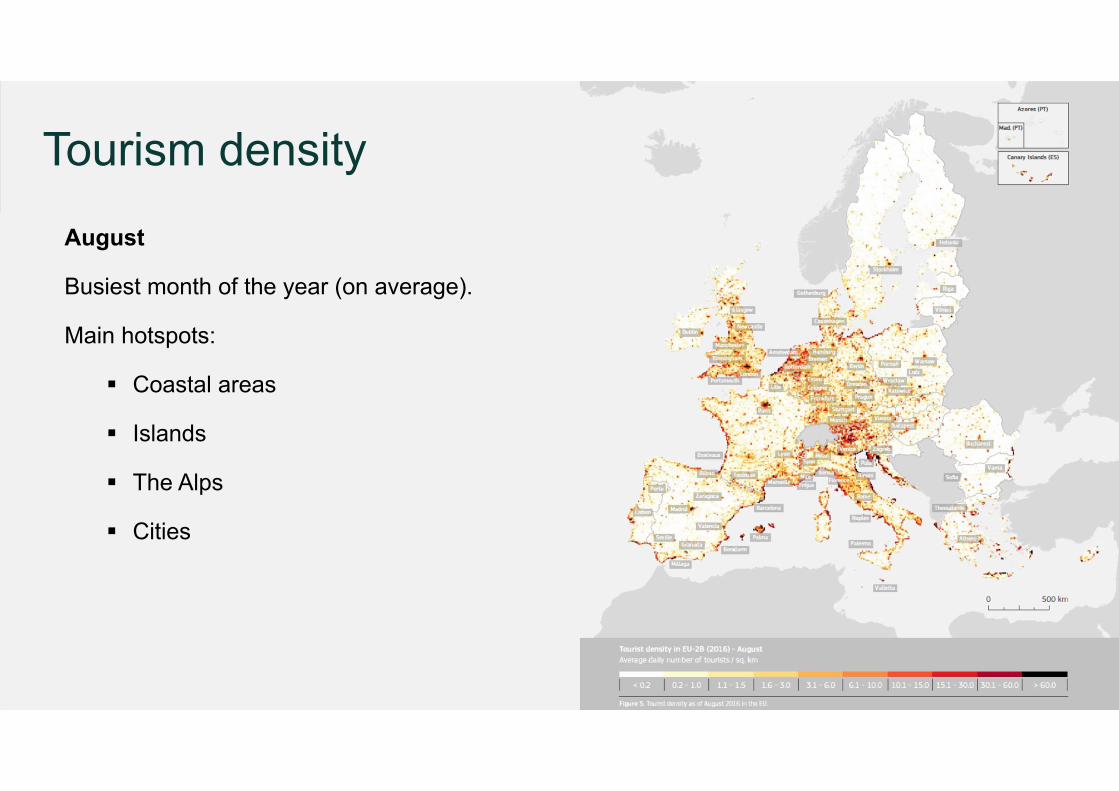
Tourism density
August
Busiest month of the year (on average).
Main hotspots:
Coastal areas
Islands
The Alps
Cities

Tourism density
November
One of the quietest months of the year (on average).
Main hotspots:
Major cities (Paris, London, Berlin, Rome, Madrid, Stockholm, Hamburg…);
Spanish coastal areas and islands remain comparatively popular.

Tourism popularity
Many areas are popular year-round.
Central Europe (high population and firm density, business destinations)
Cities, the Alps and some coastal areas.
Overall low tourism density and low popularity:
Eastern Europe
Northern Europe
Sparse locations in Ireland, Scandinavia and Eastern Europe become relatively popular in Autumn and Winter.

Seasonality is a result of uneven temporal demand for tourism. Driven by climate conditions, holiday calendar, events.
Regions mostly affected by seasonality:
Coastal
Islands
Mediterranean basin
Cities are less affected by seasonality.
Seasonality determines fluctuation of revenues, employment, under/over utilization of infrastructure, services and resources.
Tourism seasonality

Intra-regional variation
The province of Barcelona shows very distinct patterns of seasonality between the city and the nearby coastal areas (just a few kilometers apart).
Fine-scale estimates based on time-tagged customer reviews of tourist accommodation establishments.
Tourism seasonality

Relates the number of inbound tourists with size of regional population.
May indicate economic dependence of a region on the tourism sector and/or pressure on local resources and services.
Typically, cities score low, despite being major touristic hotspots.
Higher intensity in islands and some mountainous and coastal regions.
Territories with low tourism demand may still score high intensity (e.g. Northern Scandinavia).
Tourism intensity

Susceptibility of a region to be affected in case of shocks in the tourism sector (e.g. economic crises, terrorism, transport or environmental disruptions).
Combines tourism seasonality with tourism intensity.
Other factors may affect actual vulnerability.
Tourism vulnerability

Regions scoring high in both seasonality and intensity are deemed more vulnerable.
Countries like Italy, Austria, Denmark have a large share of regions scoring high vulnerability.
To become more resilient, vulnerable countries/regions may consider:
Diversifying tourist supply throughout the year;
Attract tourists from multiple origins;
Promote other viable sectors.
Tourism vulnerability

Tourism, new platforms and housing pressure
AirBnB listings (year 2018) have a lower average pricethan more traditional accommodation options (e.g. hotels).This makes it a competitive alternative.
AirBnB generates up to 2.2 times more gross income than longterm rental. The competitive advantage over hotels,combined with higher rental profits, may becontributing to shortage of housing for long termrentals. This is especially relevant in touristic destinations.
AirBnB vs. Booking.com AirBnB vs. Rental

1. Tourism management policies must underpin sound data and knowledge.
2. Combining emerging sources of geospatial data with official statistics improves our knowledge regarding tourism at regional and local levels:
Territories can be characterized and compared according to their tourism intensity and tourism concentration (spatial and temporal), at multiple scales;
Helps detect emerging tourist destinations, as well as hotspots of potential environmental and/or social stress;
Can be used to monitor and manage accommodation supply levels.
Key takeaways

3. Issues regarding emerging sources of big data cannot be ignored:
(un)Sustained data production and/or access (technical / legal barriers);
Quality (e.g. consistency, completeness, accuracy) cannot be guaranteed (and sometimes not assessed).
4. Way forward
Institutional agreements / partnerships with private operators to streamline data exchange.
Key takeaways


