
500 μm
TMS Tutorial on TMS Tutorial on Biology for Materials Scientists and EngineersBiology for Materials Scientists and Engineers
February 25, 2007February 25, 2007
Fracture and Fatigue of Biological Fracture and Fatigue of Biological Materials: Bone and Teeth Materials: Bone and Teeth
Robert O. RitchieRobert O. Ritchie
Work supported at the Lawrence Berkeley National Laboratory Work supported at the Lawrence Berkeley National Laboratory by the National Institutes of Health under Grant Nos. 5R01DE0156by the National Institutes of Health under Grant Nos. 5R01DE015633 and 33 and P01DE09859P01DE09859
and by the Department of Energy under Contract No. DEand by the Department of Energy under Contract No. DE--AC03AC03--76SF0009876SF00098www.LBL.govwww.LBL.gov/Ritchie/Ritchie
Materials Sciences Division,Materials Sciences Division, Lawrence Berkeley National LaboratoryLawrence Berkeley National Laboratoryand Department of Materials Science and Engineeringand Department of Materials Science and Engineering
University of California, BerkeleyUniversity of California, Berkeley
150 μm
The Problem!The Problem!
•• 1 in 2 women & 1 in 4 men over 50 will have an osteoporosis1 in 2 women & 1 in 4 men over 50 will have an osteoporosis--related related bone fracture over their remaining lifetimebone fracture over their remaining lifetime
•• problem treated in terms of loss of bone mass (problem treated in terms of loss of bone mass (bone quantitybone quantity), but this is ), but this is only a part of the problem only a part of the problem –– the other issue is the other issue is bone qualitybone quality
1010--fold increase in fracture fold increase in fracture risk foundrisk found with aging, independent of bone mineral densitywith aging, independent of bone mineral density
(from: www.emedx.com)
10 μm
failures in failures in bone from bone from impact or impact or fatigue fatigue (stress (stress fractures)fractures)
500 μm
osteoporoticosteoporotic trabeculartrabecular bonebone
bone damaged bone damaged by steroidsby steroids
CXTCXT
mCTmCT
SEMSEM
•• 10 million people in the U.S. have osteoporosis10 million people in the U.S. have osteoporosis

bone turnoverbone turnoverfatigue damagefatigue damage
abnormal abnormal mineralization, etcmineralization, etc.
Bone Quality?Bone Quality?
AgingAgingDiseaseDiseaseTherapyTherapy
Risk of Risk of Fracture?Fracture?
Structure Structure of Boneof Bone(molecular to
macro)
?Physical Physical mechanismsmechanisms of of
damagedamagefracturefracture
tougheningtoughening
Quantitatively Quantitatively assess in terms assess in terms of the fracture of the fracture toughness, toughness, KKcc
OutlineOutline
•• IntroductionIntroduction-- structural length scales in bonestructural length scales in bone
•• Criteria for fractureCriteria for fracture-- fracture toughnessfracture toughness
-- toughening mechanismstoughening mechanisms
•• Aging, disease and treatmentAging, disease and treatment-- effect of aging & diseaseeffect of aging & disease
-- therapeutic treatmentstherapeutic treatments
•• Assessment of bone qualityAssessment of bone quality-- fracture mechanics testingfracture mechanics testing
-- crack path (in bone biopsies)crack path (in bone biopsies)
hydrated collagen (40 MPa)
acetone (1.2 GPa)
rehydrated collagen (30 MPa)
0 100 200 300 400 500DEPTH (nm)
0
20
40
60
80
100
LOA
D (μ
Ν)
1 μm 0.1 μm
AFMAFM--based based picoindentationpicoindentation
10 μm
GC
M
M5 μm
150 μm
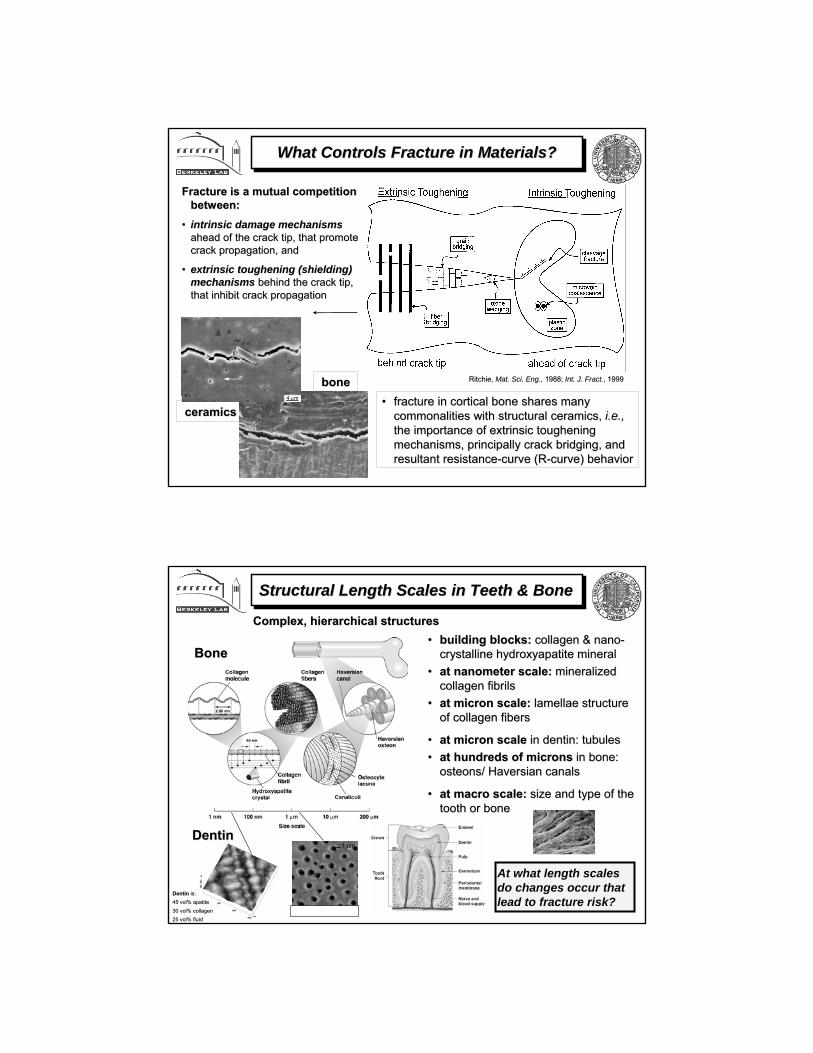
What Controls Fracture in Materials?What Controls Fracture in Materials?
10 μm
ceramicsceramics
bonebone•• fracture in cortical bone shares many fracture in cortical bone shares many
commonalities with structural ceramics, commonalities with structural ceramics, i.e.,i.e.,the importance of extrinsic toughening the importance of extrinsic toughening mechanisms, principally crack bridging, and mechanisms, principally crack bridging, and resultant resistanceresultant resistance--curve (Rcurve (R--curve) behaviorcurve) behavior
4 μm
Fracture is a mutual competition Fracture is a mutual competition between:between:
•• intrinsic damage mechanismsintrinsic damage mechanismsahead of the crack tip, that promote ahead of the crack tip, that promote crack propagation, andcrack propagation, and
•• extrinsic toughening (shielding) extrinsic toughening (shielding) mechanismsmechanisms behind the crack tip, behind the crack tip, that inhibit crack propagationthat inhibit crack propagation
Ritchie, Ritchie, Mat. Sci. EngMat. Sci. Eng., 1988; ., 1988; Int. J. Fract.Int. J. Fract., 1999, 1999
•• building blocks:building blocks: collagen & nanocollagen & nano--crystalline hydroxyapatite mineral crystalline hydroxyapatite mineral
•• at nanometer scale:at nanometer scale: mineralized mineralized collagen fibrils collagen fibrils
•• at micron scale:at micron scale: lamellae structure lamellae structure of collagen fibersof collagen fibers
•• at micron scaleat micron scale in dentinin dentin:: tubulestubules•• at hundreds of micronsat hundreds of microns in bonein bone::
osteonsosteons/ Haversian canals/ Haversian canals
•• at macro scale:at macro scale: size and type of the size and type of the tooth or bonetooth or bone
Structural Length Scales in Teeth & BoneStructural Length Scales in Teeth & Bone
Complex, hierarchical structuresComplex, hierarchical structures
At what length scales At what length scales do changes occur that do changes occur that lead to fracture risk?lead to fracture risk?
1 μm
BoneBone
DentinDentin
DentinDentin is:is:45 45 volvol% apatite% apatite30 30 volvol% collagen% collagen25 25 volvol% fluid% fluid
1 μm
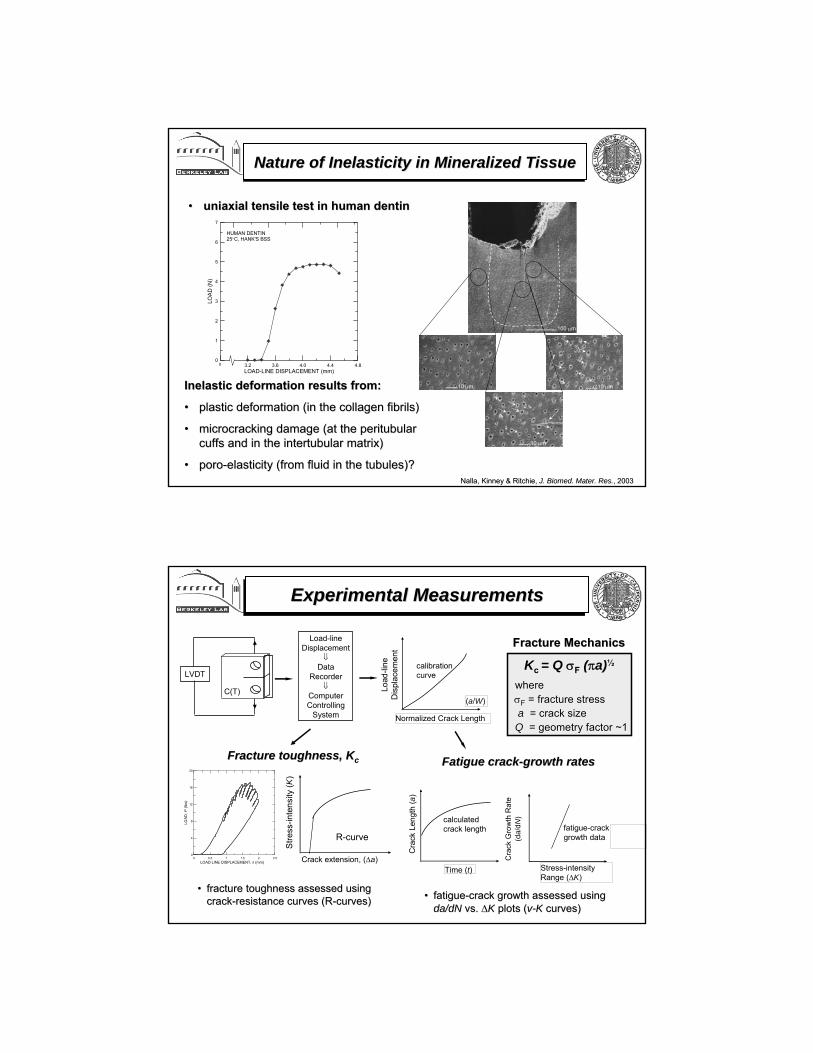
Nature of Inelasticity in Mineralized TissueNature of Inelasticity in Mineralized Tissue
Inelastic deformation results from:Inelastic deformation results from:
•• plastic deformation (in the collagen fibrils)plastic deformation (in the collagen fibrils)
•• microcrackingmicrocracking damage (at the damage (at the peritubularperitubularcuffs and in the cuffs and in the intertubularintertubular matrix)matrix)
•• poroporo--elasticity (from fluid in the tubules)?elasticity (from fluid in the tubules)?
2.8 3.2 3.6 4.0 4.4 4.8LOAD-LINE DISPLACEMENT (mm)
0
1
2
3
4
5
6
7
LOAD
(N)
HUMAN DENTIN25o C, HANK'S BSS
0
NallaNalla, Kinney & Ritchie, , Kinney & Ritchie, J. J. BiomedBiomed. Mater. Res.. Mater. Res., 2003, 2003
•• uniaxialuniaxial tensile test in human dentintensile test in human dentin (a)
100 μm
10 μm
10 μm 10 μm
•• fracture toughness assessed using fracture toughness assessed using crackcrack--resistance curves (Rresistance curves (R--curves)curves)
Time (t)
calculatedcrack length
Cra
ck L
engt
h (a
)
Stress-intensity Range (∆K)
fatigue-crack growth data
Cra
ck G
row
th R
ate
(da/
dN)
Experimental MeasurementsExperimental Measurements
0 0.5 1 1.5 2 2.5LOAD LINE DISPLACEMENT, δ (mm)
0
4
8
12
16
20
LOAD
, P (l
bs)
Stre
ss-in
tens
ity (K
)
Crack extension, (∆a)
R-curve
Load-line Displacement
⇓Data
Recorder⇓
Computer Controlling
System
LVDT
Normalized Crack Length
(a/W)
calibrationcurve
Load
-line
D
ispl
acem
ent
Fatigue crackFatigue crack--growth ratesgrowth ratesFracture toughness, Fracture toughness, KKcc
C(T)
•• fatiguefatigue--crack growth assessed using crack growth assessed using da/dNda/dN vs. vs. ΔΔKK plots (plots (vv--KK curves)curves)
Kc = Q σF (πa)½
where where σσFF = fracture stress= fracture stressaa = crack size= crack sizeQQ = geometry factor ~1= geometry factor ~1
Fracture MechanicsFracture Mechanics
Mechanisms of Fracture InitiationMechanisms of Fracture Initiation•• two identical notches in a two identical notches in a
fourfour--point bend barpoint bend bar•• constant bending moment constant bending moment
on both notcheson both notches•• one notch breaks one notch breaks -- the other the other
freezes freezes local fracture events local fracture events just prior to fracturejust prior to fracture
•• crack initiation directly crack initiation directly atat the notch root implies that the notch root implies that initiation initiation of fractureof fracture in human cortical bone and dentin is locally in human cortical bone and dentin is locally strainstrain--controlledcontrolled Nalla, Kinney & Ritchie, Nalla, Kinney & Ritchie, Nature MatNature Mat., 2003; ., 2003; J. J. BiomedBiomed. Mater. Res.. Mater. Res., 2003, 2003
with inelasticity, stresses peak ahead of notch, strains peak atwith inelasticity, stresses peak ahead of notch, strains peak at notchnotch
doubledouble--notch fournotch four--point bend testpoint bend test 1 mm
1 μm
Notch surface
1 μm
Notch surface
SEMSEM
Distance ahead of notch, normalized by the notch-root radius
PD:PD: pressurepressure--insensitive insensitive plasticityplasticity
BD:BD: pressurepressure--sensitive sensitive microcrackingmicrocrackinginelasticityinelasticity
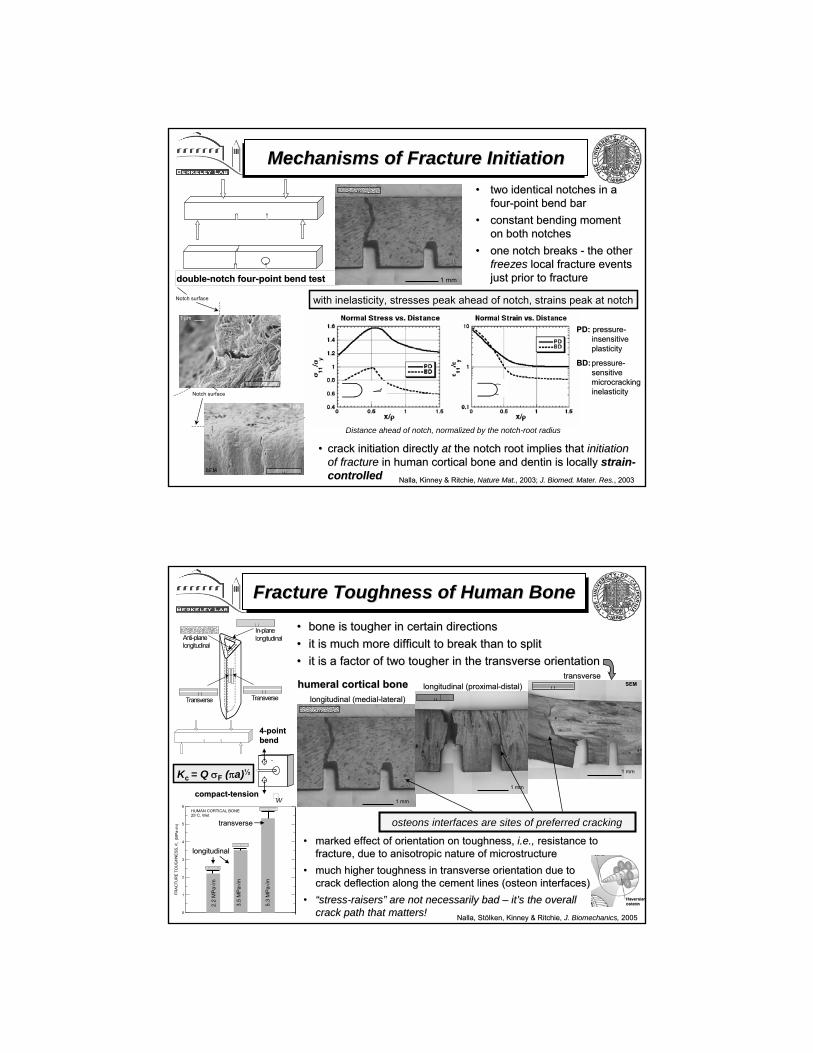
Fracture Toughness of Human BoneFracture Toughness of Human Bone
•• marked effect of orientation on toughness, marked effect of orientation on toughness, i.e.,i.e., resistance to resistance to fracture, due to anisotropic nature of microstructure fracture, due to anisotropic nature of microstructure
•• much higher toughness in transverse orientation due to much higher toughness in transverse orientation due to crack deflection along the cement lines (crack deflection along the cement lines (osteonosteon interfaces)interfaces)
•• ““stressstress--raisersraisers”” are not necessarily bad are not necessarily bad –– itit’’s the overall s the overall crack path that matters!crack path that matters! Nalla, StNalla, Stöölken, Kinney & Ritchie, lken, Kinney & Ritchie, J. Biomechanics,J. Biomechanics, 20052005
Anti-planelongitudinal
In-planelongitudinal
Transverse Transverse
1 mm
1 mm
1 mm
transversetransverse
longitudinal (mediallongitudinal (medial--lateral)lateral)longitudinal (proximallongitudinal (proximal--distal)distal) SEMSEM
•• bone is tougher in certain directionsbone is tougher in certain directions•• it is much more difficult to break than to splitit is much more difficult to break than to split•• it is a factor of two tougher in the transverse orientationit is a factor of two tougher in the transverse orientation
44--point point bendbend
osteonsosteons interfaces are sites of preferred crackinginterfaces are sites of preferred cracking
W
Kc = Q σF (πa)½
0
1
2
3
4
5
6
FRAC
TUR
E TO
UG
HN
ESS,
Kc
(MPa
√m)
HUMAN CORTICAL BONE25°C, Wet
2.2
MP
a√m
3.5
MPa
√m
5.3
MPa
√m
compactcompact--tensiontension
transversetransverse
longitudinallongitudinal
humeral cortical bonehumeral cortical bone
0 100 200 300 400 500 6000
2
4
6
8
10
ST
RES
S IN
TEN
SITY
, K, (
MPa
√m)
CRACK EXTENSION, Δa, (μm)
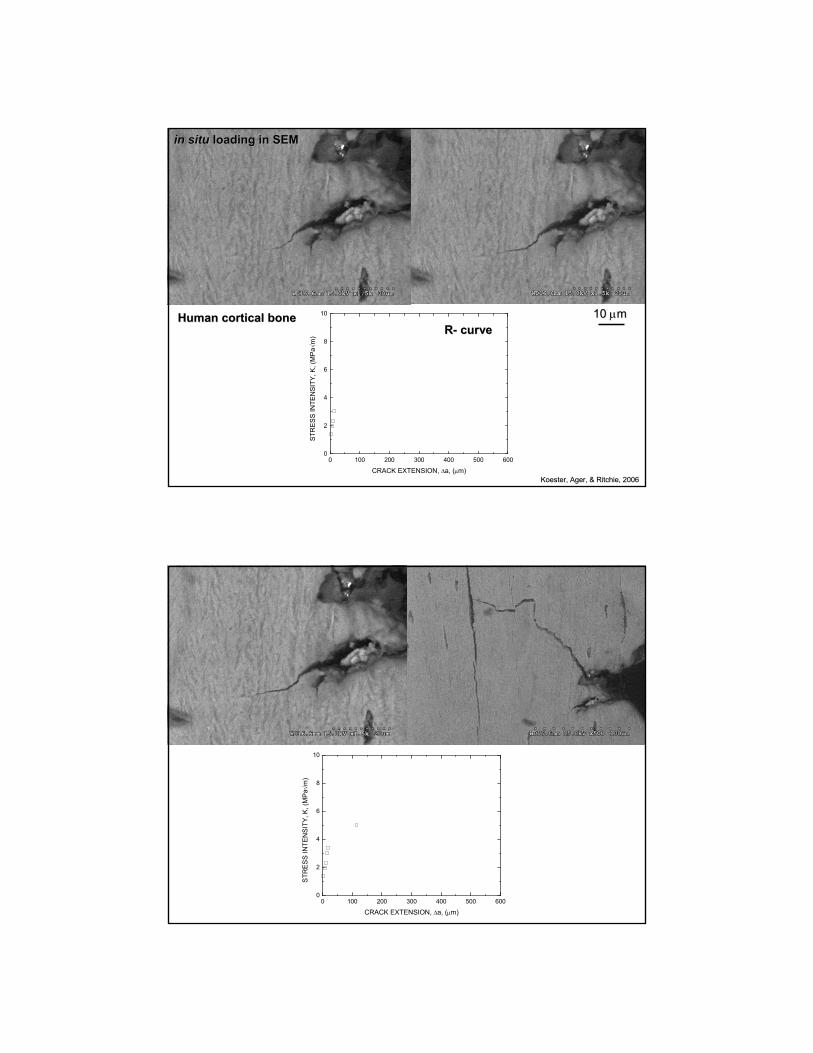
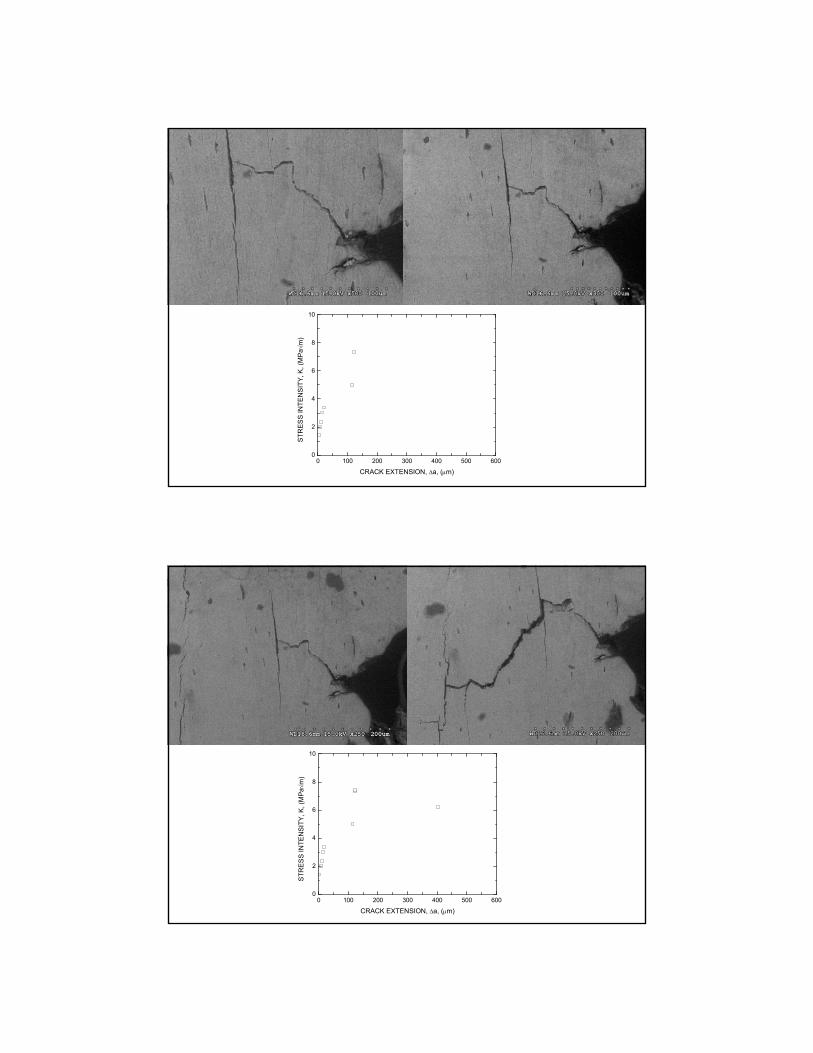
in situin situ loading in SEMloading in SEM
RR-- curvecurve
Koester, Koester, AgerAger, & Ritchie, 2006, & Ritchie, 2006
10 10 μμmmHuman cortical boneHuman cortical bone
0 100 200 300 400 500 6000
2
4
6
8
10
STR
ESS
INTE
NSI
TY, K
, (M
Pa√m
)
CRACK EXTENSION, Δa, (μm)
0 100 200 300 400 500 6000
2
4
6
8
10
ST
RES
S IN
TEN
SITY
, K, (
MPa
√m)
CRACK EXTENSION, Δa, (μm)
0 100 200 300 400 500 6000
2
4
6
8
10
STR
ESS
INTE
NSI
TY, K
, (M
Pa√m
)
CRACK EXTENSION, Δa, (μm)
0 100 200 300 400 500 6000
2
4
6
8
10
ST
RES
S IN
TEN
SITY
, K, (
MPa
√m)
CRACK EXTENSION, Δa, (μm)
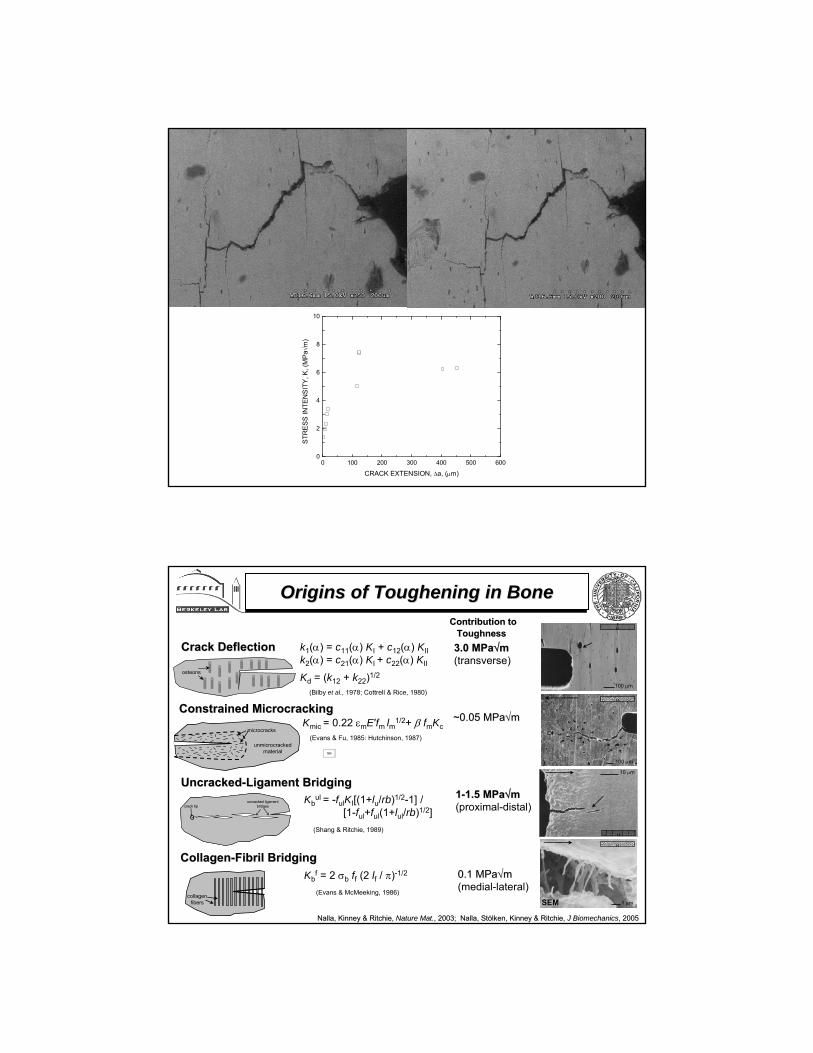
Crack DeflectionCrack Deflection
Constrained Constrained MicrocrackingMicrocracking
UncrackedUncracked--Ligament BridgingLigament Bridging
CollagenCollagen--FibFibrilril BridgingBridging
3.0 3.0 MPaMPa√√mm(transverse)
k1(α) = c11(α) KI + c12(α) KIIk2(α) = c21(α) KI + c22(α) KII
Kd = (k12 + k22)1/2
(Bilby et al., 1978; Cottrell & Rice, 1980)
Kmic = 0.22 εmE′fm lm1/2+ β fmKc(Evans & Fu, 1985: Hutchinson, 1987)
Kbul = -fulKI[(1+lu/rb)1/2-1] /
[1-ful+ful(1+lul/rb)1/2] (Shang & Ritchie, 1989)
Kbf = 2 σb ff (2 lf / π)-1/2
(Evans & McMeeking, 1986)
Contribution to Contribution to ToughnessToughness
0.1 0.1 MPaMPa√√mm(medial-lateral)
11--1.5 1.5 MPaMPa√√mm(proximal-distal)
~0.05 ~0.05 MPaMPa√√mm
Nalla, Kinney & Ritchie, Nalla, Kinney & Ritchie, Nature Mat.Nature Mat., 2003; , 2003; NallaNalla, , StStöölkenlken, Kinney & Ritchie, , Kinney & Ritchie, J BiomechanicsJ Biomechanics, 2005, 2005
collagenfibers
crack tipuncracked ligament
bridgescrack tipuncracked ligament
bridges
microcracks
unmicrocrackedmaterial
osteons
100 μm
1 μm
10 μm
100 μm)
SEMSEM
Origins of Toughening in BoneOrigins of Toughening in Bone
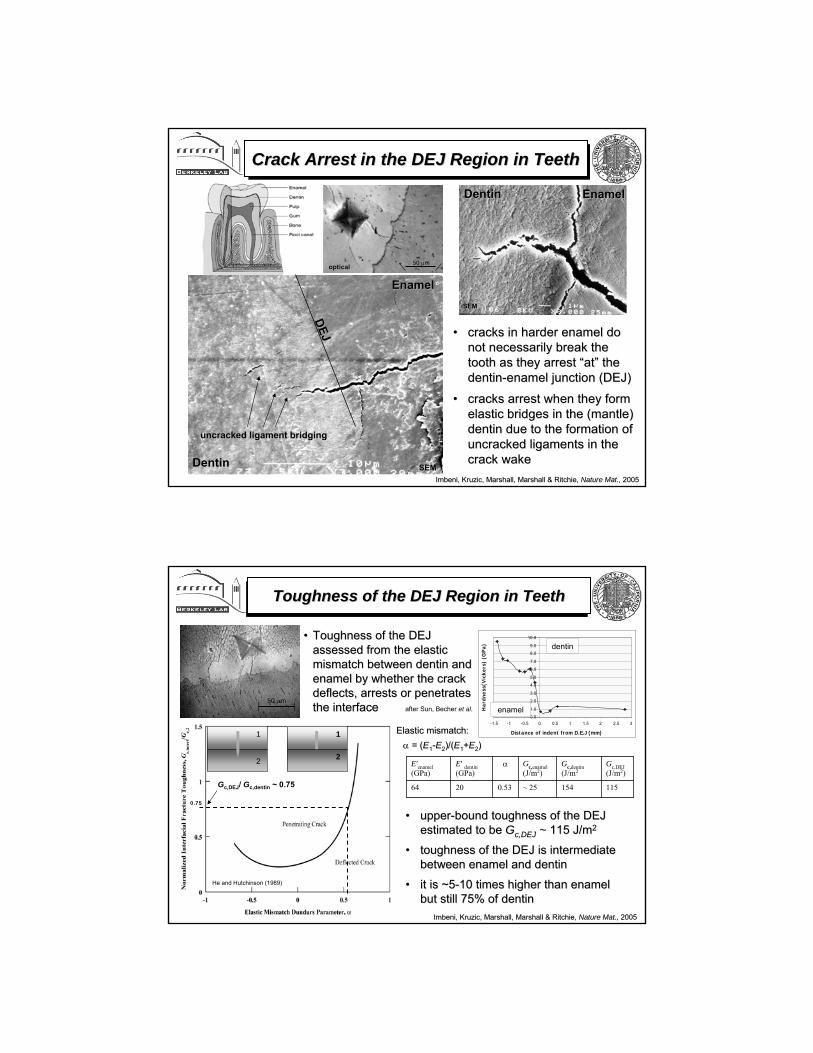
•• cracks in harder enamel do cracks in harder enamel do not necessarily break the not necessarily break the tooth as they arrest tooth as they arrest ““atat”” the the dentindentin--enamel junction (DEJ) enamel junction (DEJ)
•• cracks arrest when they form cracks arrest when they form elastic bridges in the (mantle) elastic bridges in the (mantle) dentin due to the formation of dentin due to the formation of uncrackeduncracked ligaments in the ligaments in the crack wakecrack wake
EnamelEnamel
DentinDentin
DEJDEJ
uncracked ligament bridginguncracked ligament bridging
ImbeniImbeni, , KruzicKruzic, Marshall, Marshall & Ritchie, , Marshall, Marshall & Ritchie, Nature Mat.,Nature Mat., 20052005
DentinDentin EnamelEnamel
SEMSEM
SEMSEM
50 μmopticaloptical
Crack Arrest in the DEJ Region in TeethCrack Arrest in the DEJ Region in Teeth
Toughness of the DEJ Region in TeethToughness of the DEJ Region in Teeth
•• upperupper--bound toughness of the DEJ bound toughness of the DEJ estimated to beestimated to be GGc,DEJc,DEJ ~ ~ 115 J/m115 J/m22
•• toughness of the DEJ is intermediate toughness of the DEJ is intermediate between enamel and dentin between enamel and dentin
•• it is ~5it is ~5--10 times higher than enamel 10 times higher than enamel but still 75% of dentinbut still 75% of dentin
•• Toughness of the DEJ Toughness of the DEJ assessed from the elastic assessed from the elastic mismatch between dentin and mismatch between dentin and enamel by whether the crack enamel by whether the crack deflects, arrests or penetrates deflects, arrests or penetrates the interfacethe interface after Sun, Becher et al.
1
2
1
2
0.75
He and Hutchinson (1989)
0.0
1.0
2.0
3.0
4.0
5.0
6.0
7.0
8.0
9.0
10.0
-1.5 -1 -0.5 0 0.5 1 1.5 2 2.5 3
Distance of indent from D.E.J (mm)
Har
dnes
s(V
icke
rs)
(GP
a) dentin
enamel
115154~ 250.532064
Gc,DEJ(J/m2)
Gc,dentin(J/m2
Gc,enamel(J/m2)
α E′ dentin(GPa)
E′enamel(GPa)
Elastic mismatch:Elastic mismatch:αα = (= (EE11--EE22)/()/(EE11++EE22))
ImbeniImbeni, , KruzicKruzic, Marshall, Marshall & Ritchie, , Marshall, Marshall & Ritchie, Nature Mat.,Nature Mat., 20052005
Gc,DEJ/ Gc,dentin ~ 0.75
50 μm

Experimental Proof of Crack BridgingExperimental Proof of Crack Bridging
Pbr
Experimental: crack
2.88 2.92 2.96 3.00LOAD-LINE DISPLACEMENT (mm)
1
2
3
4
5
6
7
8
APPL
IED
LO
AD (N
)Experimental: mechanical slot Theoretical: traction-free crack
human cortical bonehuman cortical bone
•• compliance of actual crack is measured before and after machinincompliance of actual crack is measured before and after machining the wake; g the wake; results compared to theoretical compliance of tractionresults compared to theoretical compliance of traction--free crack (of same length)free crack (of same length)
•• bbridging contribution to toughnessridging contribution to toughness of bone measured atof bone measured at KKbrbr ~ 0.5 ~ 0.5 –– 1 1 MPaMPa√√mm, and , and occurs over large length scales (hundreds of microns)occurs over large length scales (hundreds of microns)
Kruzic, Nalla, Kinney & Ritchie, Kruzic, Nalla, Kinney & Ritchie, Biomaterials, Biomaterials, 20042004
multimulti--cutting compliancecutting compliance500 μm
500 μm
crack bridging in human crack bridging in human cortical bone verified using a cortical bone verified using a ccomplianceompliance--based techniquebased technique
22--D D tomographictomographic slices slices of of uncrackeduncracked--ligament ligament bridged cracks in dentinbridged cracks in dentin
CXTCXT
Crack Bridging vs. Constrained Crack Bridging vs. Constrained MicrocrackingMicrocracking
•• microcracking based explanation for toughening prevalent in the microcracking based explanation for toughening prevalent in the literatureliterature•• crack bridging will reduce compliance, crack bridging will reduce compliance, CC;; microcracking will increase compliancemicrocracking will increase compliance•• supports bridging as the main toughening mechanism, rather than supports bridging as the main toughening mechanism, rather than microcrackingmicrocracking
Nalla, Kruzic, Kinney & Ritchie, Nalla, Kruzic, Kinney & Ritchie, Bone, Bone, 20042004
LOAD LINE DISPLACEMENT, δ
LOAD
, P
bridged crack(less compliant)
bridge andmicrocrack free crack
microcracktoughened crack(more compliant)
1/C
bridged crack(less compliant)
bridge and microcrack free crack
microcracktoughened crack(more compliant)
1/C microcracks
unmicrocracked material
crack tipuncracked ligament
bridgescrack tipuncracked ligament
bridges
0 0.1 0.2 0.3 0.4LOAD LINE DISPLACEMENT, δ (mm)
0
10
20
30
40
LOA
D ,
P (l
bs)
computed tractionfree compliance
Δa = 4.8 mm
measured complianceΔa = 4.8 mmmeasured compliance
Δa = 4.8 mm
computed traction free complianceΔa = 4.8 mm

TomographicTomographic Evidence of Crack BridgingEvidence of Crack Bridging
Nalla, Kruzic, Kinney & Ritchie, Nalla, Kruzic, Kinney & Ritchie, BiomaterialsBiomaterials, 2005, 2005Kruzic, Nalla, Kinney & Ritchie, Kruzic, Nalla, Kinney & Ritchie, Biomaterials, Biomaterials, 2003;2003;
XX--Ray Computed Tomography, Ray Computed Tomography, performed at the Stanford performed at the Stanford Linear Accelerator Center and Linear Accelerator Center and Advanced Light Source (LBNL) Advanced Light Source (LBNL)
human dentinhuman dentin human cortical bonehuman cortical bone
Haversiancanals
crack
uncrackedligaments
20 μm CXTCXT
250 μm CXTCXT
1mm (ii) (iii) (iv) (i)
500 μm (ii)
500 μm (iii) 500 μm (iv)
(i) 500 μm
1mm
(i) (ii) (iv)(iii)
(i) 500 μm
(iv) 500 μm
500 μm(ii)
(iii) 500 μm
hydrated dentinhydrated dentin dehydrated dentindehydrated dentin
uncrackedligaments
ResistanceResistance--Curve Toughness BehaviorCurve Toughness Behavior
•• presence of crackpresence of crack--bridging does result in bridging does result in crackcrack--size dependent size dependent behavior:behavior:
-- rising Rrising R--curves curves
-- smallsmall--crack effectscrack effects
0 2 4 6 8CRACK EXTENSION, Δa (mm)
0
2
4
6
STR
ESS
INTE
NSI
TY, K
(MPa
√m)
HUMAN CORTICAL BONEHBSS, 25oCDonor: 34-41yrs.
cortical bone 0 2 4 6CRACK EXTENSION, Δa (mm)
0
1
2
3
4
STR
ESS
INTE
NSI
TY, K
(MPa
√m)
hydrated in Hank's solution
dehydrated in vacuo
hydrated in HBSS
dentin
(a)
traction-free crack
zone of nonlinear,damaged material
(b)
idealized planar cracktractions p(u)
2ωb(x1)
x1a00
bridging or cohesive zoneλb
crack tip2u
A
a
A
•• as bridging zones are ~hundreds of as bridging zones are ~hundreds of microns in size, they can be microns in size, they can be comparable with the size of the bone comparable with the size of the bone (or tooth) (or tooth) -- quoted (singlequoted (single--value) value) KKIcIcfracture toughness values are thus fracture toughness values are thus likely sizelikely size-- and geometry dependentand geometry dependent
CohesiveCohesive--zone zone modelingmodeling
ResistanceResistance--curves curves
NallaNalla, , KruzicKruzic & Ritchie, & Ritchie, BoneBone, 2004, 2004KruzicKruzic, , NallaNalla, Kinney & Ritchie, , Kinney & Ritchie, Biomaterials, Biomaterials, 20032003 QangQang, Cox, , Cox, NallaNalla & Ritchie,& Ritchie, Biomaterials, 2006; BoneBiomaterials, 2006; Bone, 2006, 2006
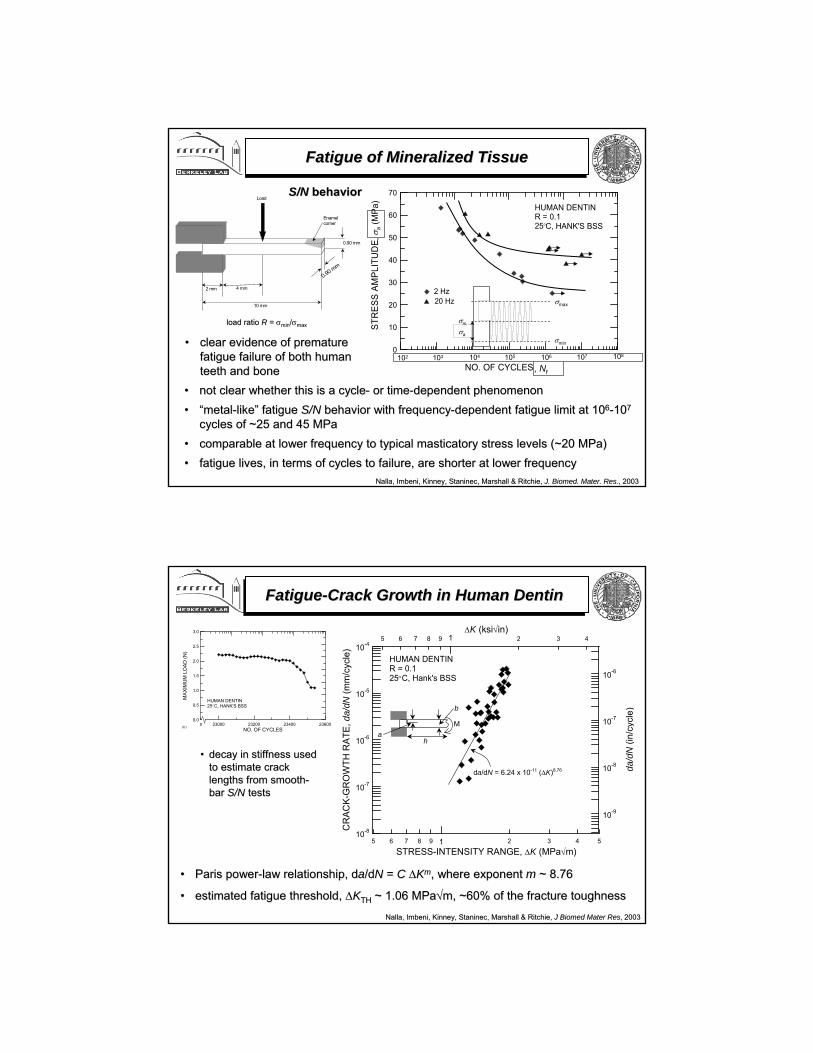
Fatigue of Mineralized TissueFatigue of Mineralized Tissue
•• not clear whether this is a cyclenot clear whether this is a cycle-- or timeor time--dependent phenomenon dependent phenomenon
•• ““metalmetal--likelike”” fatigue fatigue S/NS/N behavior with frequencybehavior with frequency--dependent fatigue limit at 10dependent fatigue limit at 1066--101077
cycles of ~25 and 45 cycles of ~25 and 45 MPaMPa
•• comparable at lower frequency to typical comparable at lower frequency to typical masticatorymasticatory stress levels (~20 stress levels (~20 MPaMPa) ) •• fatigue lives, in terms of cycles to failure, are shorter at lowfatigue lives, in terms of cycles to failure, are shorter at lower frequencyer frequency
100 1000 10000 100000 1000000 10000000100000000NO. OF CYCLES (log)
0
10
20
30
40
50
60
70
STR
ESS
AMPL
ITU
DE
(MPa
)
2 Hz20 Hz
HUMAN DENTINR = 0.1 25oC, HANK'S BSS
σa
σmax
σmin
σm
102 103 104 105 106 107 108
, Nf, σ
a (M
Pa)
NallaNalla, , ImbeniImbeni, Kinney, , Kinney, StaninecStaninec, Marshall & Ritchie, , Marshall & Ritchie, J. J. BiomedBiomed. Mater. Res.. Mater. Res., 2003, 2003
4 mm2 mm
Load
Enamelcorner
10 mm
0.90 mm
0.90 mm
load ratio load ratio RR = = σσminmin//σσmaxmax
•• clear evidence of premature clear evidence of premature fatigue failure of both human fatigue failure of both human teeth and boneteeth and bone
S/NS/N behaviorbehavior
•• Paris powerParis power--law relationship, dlaw relationship, daa/d/dN N == C C ΔΔKKmm, where exponent , where exponent mm ~ 8.76~ 8.76
•• estimated fatigue threshold, estimated fatigue threshold, ΔΔKKTHTH ~ 1.06 ~ 1.06 MPaMPa√√mm, ~60% of the fracture toughness, ~60% of the fracture toughness
23000 23200 23400 23600NO. OF CYCLES
0.0
0.5
1.0
1.5
2.0
2.5
3.0
MA
XIM
UM
LO
AD (N
)
HUMAN DENTIN25o C, HANK'S BSS
(b) 0
h
M
b
a
da/dN = 6.24 x 10⁻¹¹ (ΔK)8.76
5 6 7 8 9 2 3 4 51STRESS-INTENSITY RANGE, ΔK (MPa√m)
10-8
10-7
10-6
10-5
10-4
CR
ACK-
GR
OW
TH R
ATE,
da/
dN (m
m/c
ycle
)
10-9
10-8
10-7
10-6
da/d
N (i
n/cy
cle)
5 6 7 8 9 2 3 41ΔK (ksi√in)
HUMAN DENTINR = 0.125°C, Hank's BSS
•• decay in stiffness used decay in stiffness used to estimate crack to estimate crack lengths from smoothlengths from smooth--bar bar S/NS/N teststests
NallaNalla, , ImbeniImbeni, Kinney, , Kinney, StaninecStaninec, Marshall & Ritchie, , Marshall & Ritchie, J J BiomedBiomed Mater ResMater Res, 2003, 2003
FatigueFatigue--Crack Growth in Human DentinCrack Growth in Human Dentin

FatigueFatigue--Crack Growth Data in DentinCrack Growth Data in Dentin
• effect of frequency seen in effect of frequency seen in ““per cycleper cycle”” & & ““per timeper time”” data from 1data from 1--50 Hz50 Hz
•• as in many materials, growth rates depend upon both as in many materials, growth rates depend upon both ΔΔKK and and KKmaxmax
10-4
10-5
10-6
10-7
10-8
10-9
10-10
10.90.80.70.60.5
STRESS-INTENSITY RANGE, ΔK (MPa√m)
CR
AC
K G
RO
WTH
RAT
E, d
a/dN
(m/c
ycle
)
ELEPHANT DENTIN37OC, HBSS, R=0.1
10 Hz1 Hz
50 Hz
10.90.80.70.60.5
MAXIMUM STRESS INTENSITY, Kmax (MPa√m)
CR
AC
K G
RO
WTH
RA
TE, d
a/dt
(m/s
)
ELEPHANT DENTIN37OC, HBSS, R=0.1
10 Hz1 Hz
50 Hz
10-4
10-5
10-6
10-7
10-8
10-9
10-10
da/dN ∝ ΔKm
m ~ 12-30
KruzicKruzic, , NallaNalla, Kinney & Ritchie, , Kinney & Ritchie, Biomaterials, Biomaterials, 20052005
•• crack tends to blunts under static loadingcrack tends to blunts under static loading•• crack crack ““sharpenssharpens”” under cyclic loadingunder cyclic loading
Cyclic/Static Loading Experiments in DentinCyclic/Static Loading Experiments in Dentin
ELEPHANT DENTIN37OC, HBSSKmax=1 MPa√m
0 2000 4000 6000 8000TIME (s)
0
0.25
0.5
0.75
1
CR
AC
K E
XTE
NS
ION
(mm
)
A B
C 1
0.9
fati-gue
sustainedload
fatigue
A
50 μm
B
50 μm
C
50 μm
KruzicKruzic, , NallaNalla, Kinney & Ritchie, , Kinney & Ritchie, Biomaterials, Biomaterials, 20052005
•• at constant at constant KKmaxmax, crack barely propagates when unloading cycle is removed, crack barely propagates when unloading cycle is removed
•• clear evidence of clear evidence of cyclecycle--dependent dependent fatigue mechanismfatigue mechanism
•• also evidence of a also evidence of a deterioration in the deterioration in the fraction of bridging fraction of bridging ligaments ligaments
50 μm
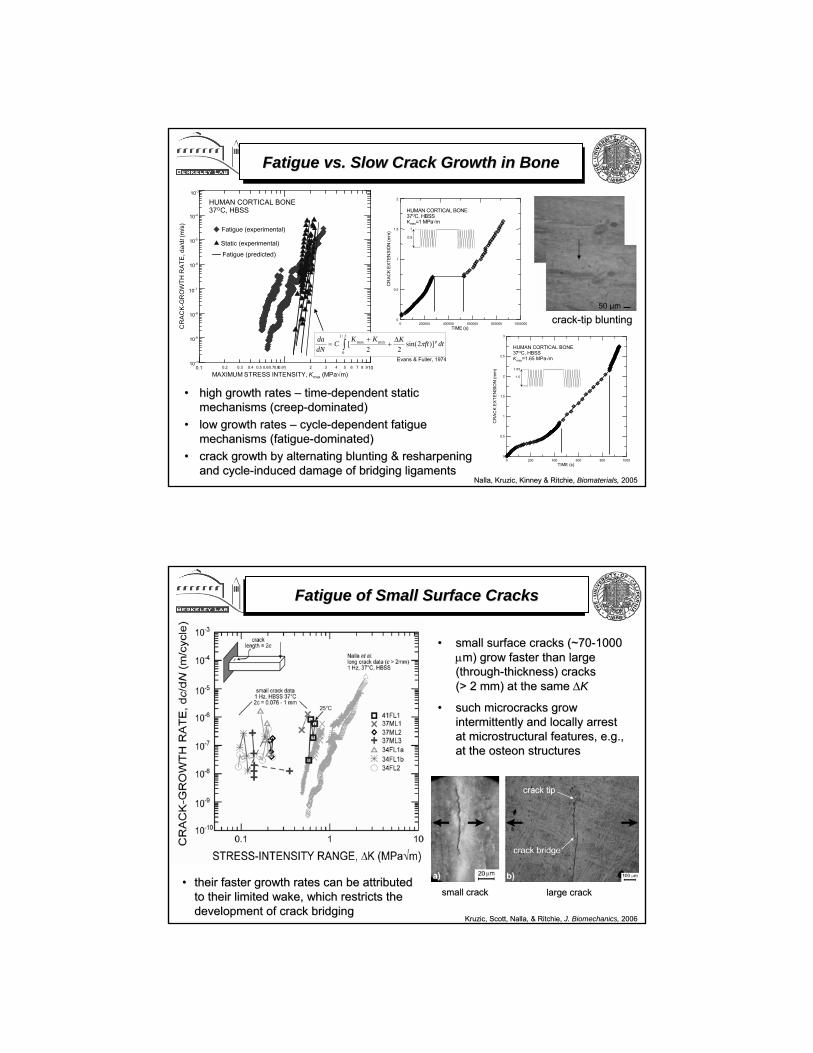
Fatigue vs. Slow Crack Growth in BoneFatigue vs. Slow Crack Growth in Bone
•• high growth rates high growth rates –– timetime--dependent static dependent static mechanisms (creepmechanisms (creep--dominated) dominated)
•• low growth rates low growth rates –– cyclecycle--dependent fatigue dependent fatigue mechanisms (fatiguemechanisms (fatigue--dominated)dominated)
•• crack growth by alternating blunting & crack growth by alternating blunting & resharpeningresharpeningand cycleand cycle--induced damage of bridging ligamentsinduced damage of bridging ligaments
Nalla, Kruzic, Kinney & Ritchie, Nalla, Kruzic, Kinney & Ritchie, Biomaterials, Biomaterials, 20052005
1.65
1.5
HUMAN CORTICAL BONE37OC, HBSSKmax=1.65 MPa√m
0 200 400 600 800 1000TIME (s)
0
0.5
1
1.5
2
2.5
3
CR
AC
K E
XTE
NS
ION
(mm
)
1
0.9
0 200000 400000 600000 800000 1000000TIME (s)
0
0.5
1
1.5
2
CR
ACK
E XT E
NSI
ON
( mm
)
HUMAN CORTICAL BONE37OC, HBSSKmax=1 MPa√m
crackcrack--tip bluntingtip blunting
10-3
10-4
10-5
10-6
10-7
10-8
10-9
10-10
0.1 1 100.2 0.3 0.4 0.5 0.60.70.80.9 2 3 4 5 6 7 8 9
MAXIMUM STRESS INTENSITY, Kmax (MPa√m)
CR
AC
K-G
RO
WTH
RA
TE, d
a/dt
(m/s
)
HUMAN CORTICAL BONE37OC, HBSS
Fatigue (experimental)
Static (experimental)
Fatigue (predicted)
dtftKKKCdNda p
f
)]2sin(22
[/1
0
minmax πΔ+
+= ∫
Evans & Fuller, 1974
•• small surface cracks (~70small surface cracks (~70--1000 1000 μμm) grow faster than large m) grow faster than large (through(through--thickness) cracks thickness) cracks (> 2 mm) at the same (> 2 mm) at the same ΔΔKK
•• such microcracks grow such microcracks grow intermittently and locally arrest intermittently and locally arrest at microstructural features, e.g., at microstructural features, e.g., at the at the osteonosteon structuresstructures
Fatigue of Small Surface CracksFatigue of Small Surface Cracks
KruzicKruzic, Scott, , Scott, NallaNalla, & Ritchie, , & Ritchie, J. Biomechanics, J. Biomechanics, 20062006
•• their faster growth rates can be attributed their faster growth rates can be attributed to their limited wake, which restricts the to their limited wake, which restricts the development of crack bridgingdevelopment of crack bridging
small cracksmall crack large cracklarge crack

•• limiting conditions for fatigue failure limiting conditions for fatigue failure can be defined by the fatigue can be defined by the fatigue threshold threshold ΔΔKKTHTH at large crack sizes at large crack sizes (> 150 (> 150 μμm) and by the smoothm) and by the smooth--bar bar fatigue limit fatigue limit ΔσΔσfatfat at small crack at small crack sizessizes
Kitagawa Diagram for Fatigue of DentinKitagawa Diagram for Fatigue of Dentin
KruzicKruzic & Ritchie, & Ritchie, J. Biomedical Materials Research, J. Biomedical Materials Research, 20062006
100 1000 10000 100000 1000000 10000000100000000NO. OF CYCLES (log)
0
10
20
30
40
50
60
70ST
RES
S AM
PLIT
UD
E (M
Pa)
2 Hz20 Hz
HUMAN DENTINR = 0.1 25oC, HANK'S BSS
σa
σma
x
σmin
σm
102 103 104 105 106 107 108
, Nf
, σa (
MP
a)
CRACK LENGTH, a (μm)
10
100
STR
ESS
RAN
GE,
Δσ
(MPa
)
ΔKTH/(πa)0.5
ΔKTH/(π(a+a0))0.5
0.1 1 10 102 103 104 105
no fatigue failure
fatigue failureΔσfat
h
M
b
a
da/dN = 6.24 x 10⁻¹¹ (ΔK)8.76
5 6 7 8 9 2 3 4 51STRESS-INTENSITY RANGE, ΔK (MPa√m)
10-8
10-7
10-6
10-5
10-4
CR
ACK-
GR
OW
TH R
ATE,
da/
dN (m
m/c
ycle
)
10-9
10-8
10-7
10-6
da/d
N (i
n/cy
cle)
5 6 7 8 9 2 3 41ΔK (ksi√in)
HUMAN DENTINR = 0.125°C, Hank's BSS
2TH0
fat
1( )σ
KaY πΔ
=Δ
“immortal”
“mortal”
Effect of Aging on Dentin Effect of Aging on Dentin -- TransparencyTransparency
Porter, Porter, NallaNalla, Minor, , Minor, JinschekJinschek, , KisielowskiKisielowski, , RadmilovicRadmilovic, Kinney, , Kinney, TomsiaTomsia & Ritchie, & Ritchie, BiomaterialsBiomaterials, 2005, 2005
10 μm10 μm 10 μm10 μm
Young (normal) Old (transparent)
AtomicAtomic--Force MicroscopyForce Microscopy
FIB & Transmission FIB & Transmission Electron MicroscopyElectron Microscopy
•• reconstructed exitreconstructed exit--wave lattice images wave lattice images imagesimages of of intratubularintratubularmineral in transparent dentin showing evidence of nanometermineral in transparent dentin showing evidence of nanometer--sized sized singlesingle--crystal apatite grains (crystal apatite grains (& Mg& Mg--rich rich ββ--tricalciumtricalcium phosphatephosphate))
•• aging leads to an altered form of dentin aging leads to an altered form of dentin ––transparent dentintransparent dentin
•• mineral concentration increases and distribution mineral concentration increases and distribution changes, due to filling up of tubules with mineralchanges, due to filling up of tubules with mineral
•• concentration differences due to crystallite size being concentration differences due to crystallite size being slightly smaller in transparent dentinslightly smaller in transparent dentin
•• collagen environment is changed in terms of collagen environment is changed in terms of intrafibrillarintrafibrillar mineral & overall density of fibrilsmineral & overall density of fibrils
P P
Healthy Root Transparent Root
concentration XX--ray Computed ray Computed TomographyTomographyof mineral
UV Raman SpectroscopyUV Raman Spectroscopy

Effect of Aging in Dentin: Property ChangesEffect of Aging in Dentin: Property Changes
•• YoungYoung’’s and shear modulus s and shear modulus unchanged with transparencyunchanged with transparency
•• normal dentin normal dentin ““yieldsyields””, with , with extensive postextensive post--yield deformationyield deformation
•• transparent (old) dentin is brittle transparent (old) dentin is brittle --no yieldingno yielding
•• fracture toughness is ~20% lower fracture toughness is ~20% lower in transparent dentinin transparent dentin
•• fatigue resistance generally lower fatigue resistance generally lower in transparent dentinin transparent dentin
Kinney, Kinney, NallaNalla, , PoplePople, , BreunigBreunig & Ritchie, & Ritchie, BiomaterialsBiomaterials, 2005, 2005
Resonance Ultrasound SpectroscopyResonance Ultrasound Spectroscopy
Elastic Elastic modulimoduli
0
0.5
1
1.5
2
FRA
CTU
RE
TO
UG
HN
ES
S (M
Pa√
m)
NORMAL TRANSPARENT
aver
age
age
80 y
rs
aver
age
age
24 y
rs
Fracture toughnessFracture toughness
UniaxialUniaxial stressstress--strain behaviorstrain behavior
0 0.2 0.4 0.6 0.8 1 1.2LOAD-LINE DISPLACEMENT (mm)
0
1
2
3
4
5
6
LOAD
(N)
HUMAN DENTIN25OC, HBSS
NormalTransparent
young
old
NO. OF CYCLES, Nf
0102030405060708090
100110120
STR
ES
S A
MP
LITU
DE
, σa (
MP
a) HUMAN DENTINR = 0.1, 10 Hz37OC, HBSS
NormalTransparent
102 103 104 105 106 107 108
FatigueFatiguetest samples
young
old
youn
g
youn
g
old
old
Effect of Aging on the Toughness of DentinEffect of Aging on the Toughness of Dentin
•• aging leads to reduced crack bridging, consistent with reductionaging leads to reduced crack bridging, consistent with reduction in fracture toughnessin fracture toughness•• filled tubules in aged dentin become less effective stressfilled tubules in aged dentin become less effective stress--concentratorsconcentrators
Kinney, Kinney, NallaNalla, , PoplePople, , BreunigBreunig & Ritchie, & Ritchie, BiomaterialsBiomaterials, 2005, 2005
old dentinold dentin
uncracked ligament bridges
tubules
filled-up tubules
young dentinyoung dentin
250 μm
500 μm
Young (normal)Young (normal)Old (transparent)Old (transparent)Soft XSoft X--Ray MicroscopyRay Microscopy
•• with aging, mineral concentration in dentin increases due to filwith aging, mineral concentration in dentin increases due to filling ling up of tubules with up of tubules with nanocrystallinenanocrystalline apatite (transparent dentin)apatite (transparent dentin)
•• postpost--yield stress/strain behavior eliminatedyield stress/strain behavior eliminated•• fracture toughness and fatigue resistance is reducedfracture toughness and fatigue resistance is reduced
Young (normal)
Old (transparent)
Environmental SEMEnvironmental SEM CX TomographyCX Tomography
Porter, Porter, NallaNalla, Minor, , Minor, RadmilovicRadmilovic, Kinney, , Kinney, TomsiaTomsia & Ritchie, & Ritchie, BiomaterialsBiomaterials, 2005;, 2005;
J.W. Ager
5 μm
J.W. Ager
crack path follows tubulescrack path follows tubules
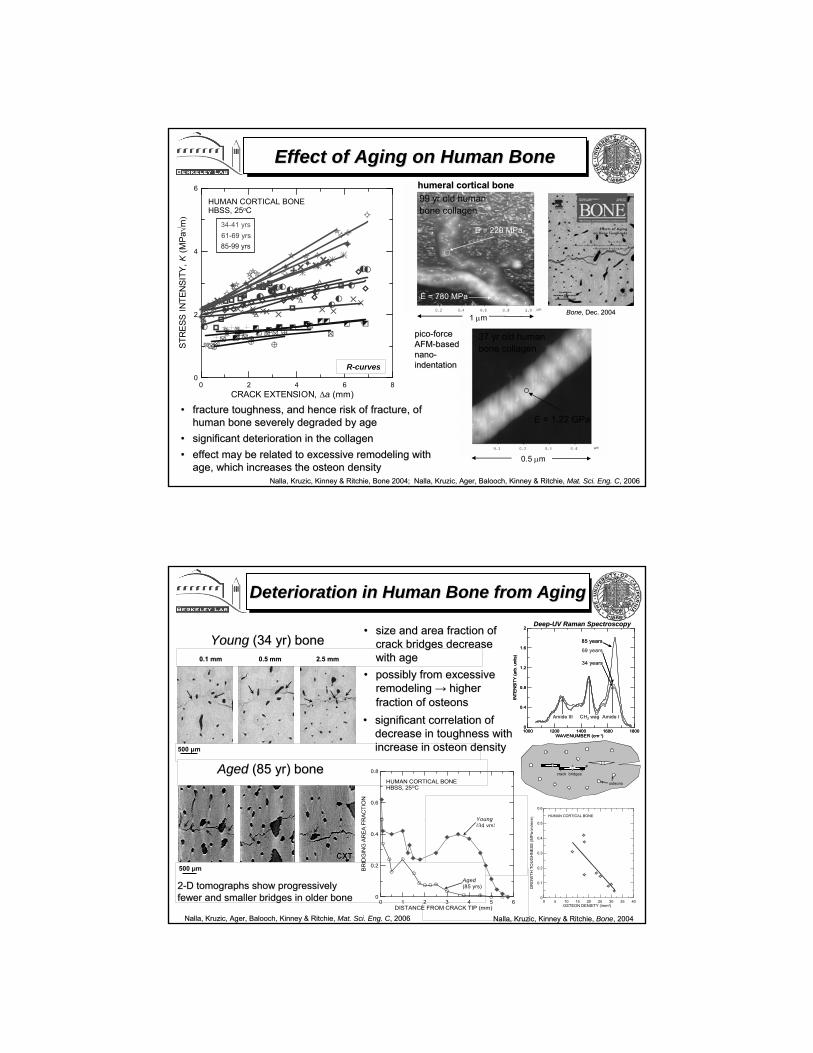
Effect of Aging on Human BoneEffect of Aging on Human Bone
•• fracture toughness, and hence risk of fracture, of fracture toughness, and hence risk of fracture, of human bone severely degraded by agehuman bone severely degraded by age
•• significant deterioration in the collagensignificant deterioration in the collagen•• effect may be related to excessive remodeling with effect may be related to excessive remodeling with
age, which increases the age, which increases the osteonosteon densitydensity
0 2 4 6 8CRACK EXTENSION, Δa (mm)
0
2
4
6ST
RES
S IN
TEN
SITY
, K (M
Pa√m
)
34-41 yrs61-69 yrs
HUMAN CORTICAL BONEHBSS, 25oC
85-99 yrs
E = 780 MPa
E = 220 MPa
E = 780 MPa
E = 220 MPa
E = 1.22 GPa
37 yr old human bone collagen
picopico--force force AFMAFM--based based nanonano--indentationindentation
0.5 μm
1 μm
99 yr old human bone collagen
R-curves
Bone, Bone, Dec. 2004Dec. 2004
NallaNalla, , KruzicKruzic, Kinney & Ritchie, Bone 2004; , Kinney & Ritchie, Bone 2004; NallaNalla, , KruzicKruzic, , AgerAger, , BaloochBalooch, Kinney & Ritchie, , Kinney & Ritchie, Mat. Mat. SciSci. Eng. C. Eng. C, 2006, 2006
humeral cortical bonehumeral cortical bone
YoungYoung (34 yr) bone(34 yr) bone0.1 mm 0.5 mm 2.5 mm
500 μm
Deterioration in Human Bone from AgingDeterioration in Human Bone from Aging
Aged (85yr) bone
0.1 mm 0.5 mm 2.5 mm
NallaNalla, , KruzicKruzic, , AgerAger, , BaloochBalooch, Kinney & Ritchie, , Kinney & Ritchie, Mat. Mat. SciSci. Eng. C. Eng. C, 2006, 2006
0 5 10 15 20 25 30 35 40OSTEON DENSITY (/mm2)
0
0.5
1
1.5
2
2.5
3
INIT
IATI
ON
TO
UG
HN
ES
S, K
o (M
Pa√
m) HUMAN CORTICAL BONE
0 5 10 15 20 25 30 35 40OSTEON DENSITY (/mm2)
0
0.1
0.2
0.3
0.4
0.5
0.6
GR
OW
TH T
OU
GH
NES
S (M
Pa√m
/mm
) HUMAN CORTICAL BONE
•• size and area fraction of size and area fraction of crack bridges decrease crack bridges decrease with agewith age
•• possibly from excessive possibly from excessive remodeling remodeling →→ higher higher fraction of fraction of osteonsosteons
•• significant correlation of significant correlation of decrease in toughness with decrease in toughness with increase in increase in osteonosteon densitydensity
500 μm
Young (34 yrs)
Aged (85 yrs)
0 1 2 3 4 5 6DISTANCE FROM CRACK TIP (mm)
0
0.2
0.4
0.6
0.8
BR
IDG
ING
AR
EA
FR
AC
TIO
N
HUMAN CORTICAL BONEHBSS, 25OC
AgedAged (85 yr) bone(85 yr) bone
22--D D tomographstomographs show progressively show progressively fewer and smaller bridges in older bonefewer and smaller bridges in older bone
CXTCXT
NallaNalla, , KruzicKruzic, Kinney & Ritchie, , Kinney & Ritchie, BoneBone, 2004, 2004
crack bridges
osteons
Amide ICH2 wag
85 years
Amide III
69 years
34 years
1000 1200 1400 1600 1800WAVENUMBER (cm-1)
0
0.4
0.8
1.2
1.6
2
INTE
NS
ITY
(arb
. uni
ts)
Amide ICH2 wag
85 years
Amide III
69 years
34 years
1000 1200 1400 1600 1800WAVENUMBER (cm-1)
0
0.4
0.8
1.2
1.6
2
INTE
NS
ITY
(arb
. uni
ts)
DeepDeep--UV Raman SpectroscopyUV Raman Spectroscopy
500 μm
0.1 mm 0.5 mm 2.5 mm0.1 mm 0.5 mm 2.5 mm
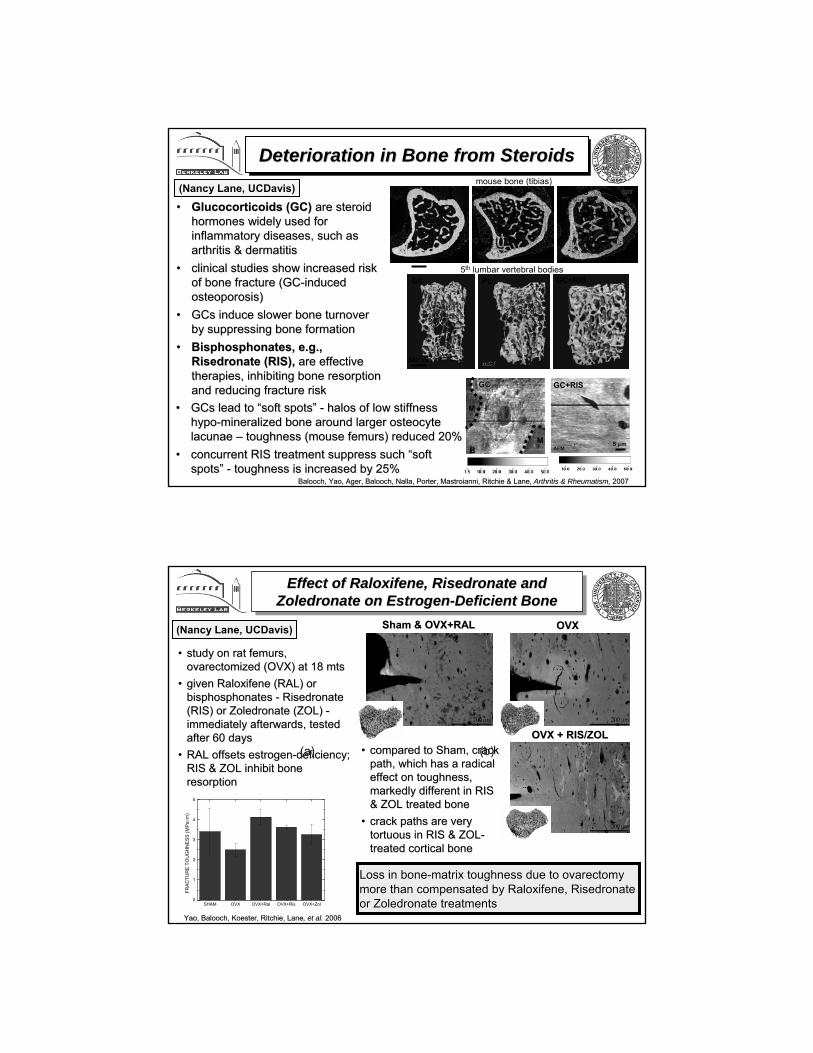
Deterioration in Bone from SteroidsDeterioration in Bone from Steroids
•• GlucocorticoidsGlucocorticoids (GC)(GC) are steroid are steroid hormones widely used for hormones widely used for inflammatory diseases, such as inflammatory diseases, such as arthritis & dermatitisarthritis & dermatitis
•• clinical studies show clinical studies show increased risk increased risk of bone fracture (GCof bone fracture (GC--induced induced osteoporosis)osteoporosis)
•• GCs induce slower bone turnover GCs induce slower bone turnover by suppressing bone formationby suppressing bone formation
•• BisphosphonatesBisphosphonates, e.g., , e.g., RisedronateRisedronate (RIS),(RIS), are effective are effective therapies, inhibiting bone therapies, inhibiting bone resorptionresorptionand reducing fracture riskand reducing fracture risk
PLGC GC+RIS
150 μm
CXTCXT
GC PL GC+RIS
500 μm
GC+RISGC+RIS
5 μm
GCGC
M
BM
•• GCs lead to GCs lead to ““soft spotssoft spots”” -- halos of low stiffness halos of low stiffness hypohypo--mineralized bone around larger mineralized bone around larger osteocyteosteocytelacunae lacunae –– toughness (mouse femurs) reduced 20%toughness (mouse femurs) reduced 20%
•• concurrent RIS treatment suppress such concurrent RIS treatment suppress such ““soft soft spotsspots”” -- toughness is increased by 25%toughness is increased by 25%
(Nancy Lane, (Nancy Lane, UCDavisUCDavis))
Balooch, Yao, Balooch, Yao, AgerAger, , BaloochBalooch, , NallaNalla, Porter, , Porter, MastroianniMastroianni, Ritchie & Lane, , Ritchie & Lane, Arthritis & Rheumatism,Arthritis & Rheumatism, 20072007
mouse bone (tibias)
5th lumbar vertebral bodies
mCTmCT
AFMAFM
Effect of Effect of RaloxifeneRaloxifene, , RisedronateRisedronate and and ZoledronateZoledronate on Estrogenon Estrogen--Deficient BoneDeficient Bone
(a) (b)
(c)
•• study on study on rat femursrat femurs, , ovarectomizedovarectomized (OVX) at 18 (OVX) at 18 mtsmts
•• given given RaloxifeneRaloxifene (RAL) or (RAL) or bisphosphonatesbisphosphonates -- RisedronateRisedronate(RIS) or (RIS) or ZoledronateZoledronate (ZOL) (ZOL) --immediately afterwards, tested immediately afterwards, tested after 60 daysafter 60 days
•• RAL offsets estrogenRAL offsets estrogen--deficiency; deficiency; RIS & ZOL inhibit bone RIS & ZOL inhibit bone resorptionresorption
(Nancy Lane, (Nancy Lane, UCDavisUCDavis))
Yao, Yao, BaloochBalooch, Koester, Ritchie, Lane, Koester, Ritchie, Lane, et al. , et al. 20062006
SHAM OVX OVX+Ral OVX+Ris OVX+Zol0
1
2
3
4
5
FRA
CTU
RE
TO
UG
HN
ES
S (M
Pa√
m)
Sham & OVX+RALSham & OVX+RAL OVXOVX
OVX + RIS/ZOLOVX + RIS/ZOL•• compared to Sham, crack compared to Sham, crack
path, which has a radical path, which has a radical effect on toughness, effect on toughness, markedly different in RIS markedly different in RIS & ZOL treated bone& ZOL treated bone
•• crack paths are very crack paths are very tortuous in RIS & ZOLtortuous in RIS & ZOL--treated cortical bonetreated cortical bone
Loss in boneLoss in bone--matrix toughness due to matrix toughness due to ovarectomyovarectomymore than compensated by more than compensated by RaloxifeneRaloxifene, , RisedronateRisedronateor or ZoledronateZoledronate treatmentstreatments

Fracture Risk Assessment from BiopsiesFracture Risk Assessment from Biopsies
•• we can induce stable we can induce stable cracks in cortical bone cracks in cortical bone
•• crack path, crack path, c.f.,c.f., micromicro--structure, used to structure, used to assess toughening or assess toughening or deteriorationdeterioration
•• we believe that we can we believe that we can measure a measure a KKcc as a as a quantitative measure quantitative measure of bone quality for of bone quality for living patientsliving patients
Koester, Ritchie Koester, Ritchie et alet al.., , 20062006
•• microcrackingmicrocracking, at cement lines, promotes toughness via bridging, at cement lines, promotes toughness via bridging•• cracks often follow cracks often follow osteocyteosteocyte lacunae lacunae
iliac crest biopsiesiliac crest biopsies(supplied by (supplied by Juliet Juliet CompstonCompston ((CambCamb) via ) via Nancy LaneNancy Lane (UC Davis)(UC Davis)
Alcohol Strengthens Teeth Alcohol Strengthens Teeth –– at least temporarily!at least temporarily!
•• but you do need to keep the alcohol in your mouth, as the but you do need to keep the alcohol in your mouth, as the effect is reversible!effect is reversible!
•• effect associated with direct collageneffect associated with direct collagen--collagen Hcollagen H--bonding bonding in polar solvantsin polar solvants
NallaNalla, Kinney, , Kinney, TomsiaTomsia & Ritchie, & Ritchie, Journal of Dental ResearchJournal of Dental Research, 2006, 2006
0 2 4 6CRACK EXTENSION, Δa (mm)
0
1
2
3
4
5
STR
ESS
INTE
NSI
TY, K
(MPa
√m)
ELEPHANT DENTINWHISKEY, 25oC
initiation toughness
growth toughness
plateau toughness
HBSS
Ethanol
0 2 4 6 8 10CRACK EXTENSION, Δa (mm)
0
1
2
3
4
5
STR
ESS
INTE
NSI
TY, K
(MPa
√m)
dehydrated with whiskey
dehydrated with whiskey
re-hydrated with HBSS
8686--proof Black & White scotch whiskeyproof Black & White scotch whiskey
•• compared to water compared to water (HBSS), whiskey (HBSS), whiskey increases the increases the stiffness, strength stiffness, strength & toughness of & toughness of dentindentin
hydrated collagen (40 MPa)
acetone (1.2 GPa)
rehydrated collagen (30 MPa)
0 100 200 300 400 500DEPTH (nm)
0
20
40
60
80
100
LOAD
(μΝ
)
1 μm 0.1 μm
AFM-based pico-indentation
collagen stiffness
R-curves
tensile tests
R-curves
NallaNalla, , BaloochBalooch, , AgerAger, , KruzicKruzic, Kinney & Ritchie, , Kinney & Ritchie, ActaActa BiomaterialiaBiomaterialia, 2005, 2005

Bone Quality: Transforming Growth FactorsBone Quality: Transforming Growth Factors
•• TGFTGF--ββ is a family of proteins (cytokine) is a family of proteins (cytokine) that can regulate behavior in bone that can regulate behavior in bone
•• TGFTGF--ββ can inhibit can inhibit osteoblastosteoblast formation formation --osteoclastsosteoclasts are unaffectedare unaffected
•• too much TGFtoo much TGF--ββ (over(over--expression) expression) leads to (27%) lower bone toughness leads to (27%) lower bone toughness (and osteoporosis) (and osteoporosis)
•• underunder--expressing TGFexpressing TGF--ββ leads to leads to increased bone deposition, enhanced increased bone deposition, enhanced mineral content, mineral content, 50% higher bone 50% higher bone toughness and more tortuous crack pathstoughness and more tortuous crack paths
Role of TGFRole of TGF--ββ on mouse boneon mouse bone
over
-exp
Balooch, Balooch, BaloochBalooch, , NallaNalla, Schilling, , Schilling, FilvaroffFilvaroff, Marshall, Marshall, Ritchie, , Marshall, Marshall, Ritchie, DerynckDerynck & & AllistonAlliston, , PNASPNAS, Dec. 2005, Dec. 2005
0.00
1.00
2.00
3.00
4.00
5.00
Fra
ctu
re T
ou
gh
ness
(M
Pam
-1/
2)
D4
D5
WT
E1
Smad3 +/-
Smad3 -/-
wild
-type
over
-exp
over
-exp
unde
r-exp
(rec
epto
r)
unde
r-exp
(par
tial k
-o)
k-o
Fracture ToughnessFracture Toughness
S = 5.5 mm
500 μm
50 μm 500 nm
500 μm 50 μm 500 nm
poor minerali-zation
unde
r-ex
pres
sed
o
ver-
expr
esse
d
Mouse bone and TGF-β
possible new possible new therapy to treat therapy to treat bone disorders?bone disorders?
SEMSEMCXTCXT
((RikRik DerynckDerynck, UCSF), UCSF)
mouse mouse femursfemurs
•• One measure of One measure of bone qualitybone quality is the fracture toughness. This requires an is the fracture toughness. This requires an understanding of fracture mechanisms and how they are affected bunderstanding of fracture mechanisms and how they are affected by microstructurey microstructure
•• Whereas fracture Whereas fracture initiationinitiation in bone is strainin bone is strain--controlled, (crackcontrolled, (crack--growth) toughness is growth) toughness is derived from derived from extrinsicextrinsic toughening mechanisms, which promote Rtoughening mechanisms, which promote R--curve behaviorcurve behavior
•• For crack For crack propagationpropagation, the salient extrinsic toughening mechanisms are:, the salient extrinsic toughening mechanisms are:•• crack bridging by crack bridging by uncrackeduncracked ““ligamentsligaments”” (and by individual collagen fibrils)(and by individual collagen fibrils)•• crack deflection along cement lines (transverse orientation)crack deflection along cement lines (transverse orientation)
•• Although mechanisms are controlled by the hierarchy of structureAlthough mechanisms are controlled by the hierarchy of structure, features at , features at coarse lengthcoarse length--scales, ~100scales, ~100--200 200 μμm, are most important for fracture toughnessm, are most important for fracture toughness
•• Aging of dentin and bone identified with a loss in toughness, asAging of dentin and bone identified with a loss in toughness, associated in part with sociated in part with a deterioration in crack bridging (consistent in bone with excesa deterioration in crack bridging (consistent in bone with excessive remodeling)sive remodeling)
•• Regulation of growth factors (e.g., TGFRegulation of growth factors (e.g., TGF--ββ) can have a significant and positive effect ) can have a significant and positive effect on the mechanical properties of bone on the mechanical properties of bone -- at at nanonano to macro lengthto macro length--scales scales
•• Whereas Whereas ovarectomiesovarectomies & steroids can prematurely degrade fracture toughness, & steroids can prematurely degrade fracture toughness, RaloxifeneRaloxifene or or bisphosphonatebisphosphonate treatments act to restore, or even enhance, fracture treatments act to restore, or even enhance, fracture resistance resistance -- mechanically due to microstructuremechanically due to microstructure--induced changes in crack pathinduced changes in crack path
ConclusionsConclusions

PersonnelPersonnel
• UCB: Ravi Nalla (Intel), Kurt KoesterValentina Imbeni (SRI) Jay Kruzic (Oregon State)
• LBNL: Joel Ager, Alex Porter (Camb.) Eduardo Saiz, Tony Tomsia
• LLNL: John Kinney, James Stölken
• UCSF: Guive Balooch, Medhi BaloochRik DerynckBill & Sally Marshall
• UC Davis: Nancy Lane, Wei Yao,Dave Fyhrie
• Rockwell: Brian Cox
AcknowledgmentsAcknowledgments
FundingFunding• Dept. of Energy – BES• LBNL – LDRD• NIH – Bioengineering
Research Partnership• NIH - Dental & Craniofacial
Research FacilitiesFacilities•• Advanced Light Source Advanced Light Source
(LBNL)(LBNL)•• Stanford Synchrotron Stanford Synchrotron
Radiation Lab. (SSRL)Radiation Lab. (SSRL)•• National Center for Electron National Center for Electron
Microscopy (LLBL) Microscopy (LLBL)
Web pageWeb page•• www.LBL.govwww.LBL.gov/Ritchie/Ritchie


