Four Point Bending Test in Thermal Barrier Coating System
Yasuhiro YAMAZAKI
February 2005
Copyright© IfW TU-Darmstadt
Niigata Institute of Technology
All Right Reserved.
Contents
page
1. Introduction ................................................................................................................................................. 2
2. Literature Assessment ................................................................................................................................. 2
3. Design and Preparation of the Test Rig....................................................................................................... 7
3. 1 Determination of spring constant of the spring unit ............................................................................ 7
3. 2 Design of the Test Rig ......................................................................................................................... 7
4. Material and Specimen Preparation .......................................................................................................... 13
5. Analytical Considerations ......................................................................................................................... 17
5. 1 Model and parameters........................................................................................................................ 17
5. 2 Instruction and Expansion of the Equation of the Energy Release Rate for k-Layer Composites..... 19
5.3 Results and Discussion of Analytical Calculation .............................................................................. 24
6. Experimental Procedure ............................................................................................................................ 28
6.1 Procedure of Bonding the Stiffener to the Top Coat .......................................................................... 28
6.2 Procedure of Four Point Bending Test ............................................................................................... 33
7. Establishment of bonding procedure and evaluation of infiltration depth of adhesive ............................. 37
8. Confirmation of Reproducibility by using Dummy specimens................................................................. 44
9. Results and Discussions ............................................................................................................................ 47
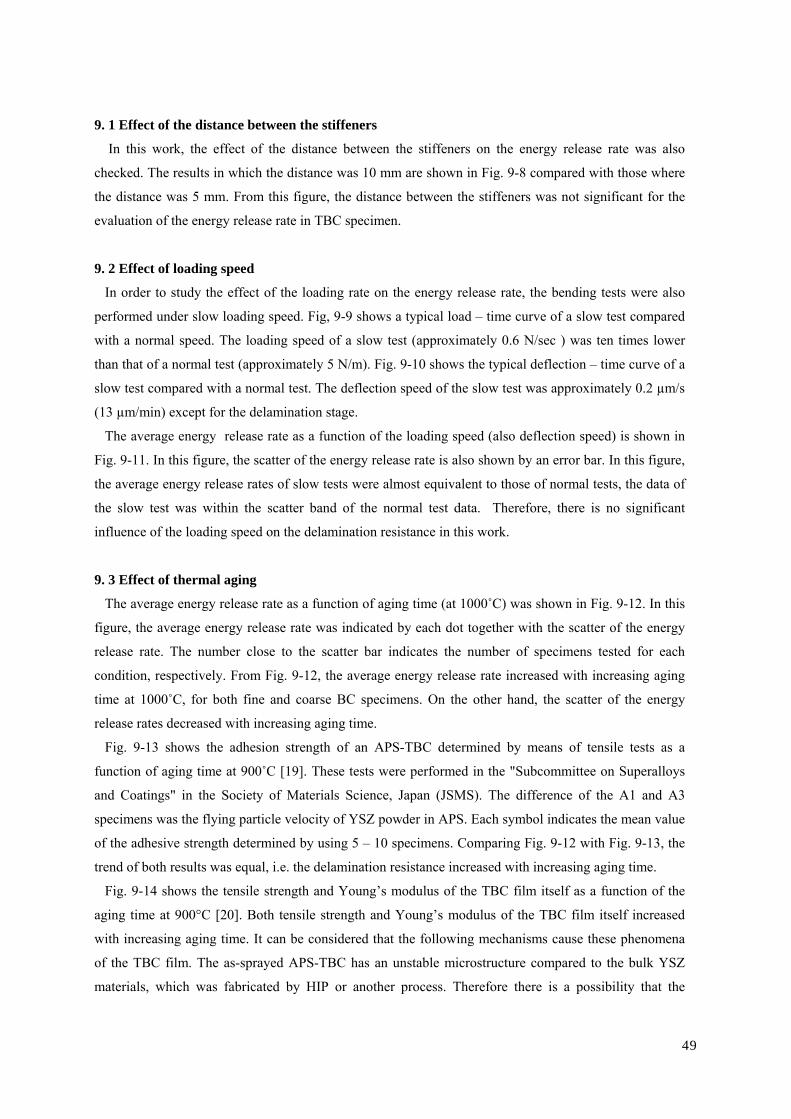
9. 1 Effect of the distance between the stiffeners ..................................................................................... 49
9. 2 Effect of loading speed ...................................................................................................................... 49
9. 3 Effect of thermal aging ...................................................................................................................... 49
9. 4 Effect of TC/BC interface roughness on the delamination resistance ............................................... 50
9. 5 Propagation rate of delamination crack ............................................................................................. 50
10. Summary and Conclusions...................................................................................................................... 65
Future work ................................................................................................................................................... 65
Acknowledgements ....................................................................................................................................... 66
References ..................................................................................................................................................... 66
1
Four Point Bending Test in Thermal Barrier Coating Systems
Yasuhiro YAMAZAKI*
*Guest researcher from Niigata Institute of Technology, JAPAN
This is the report of my work at Institute of Materials Technology, Darmstadt University of
Technology (Sep., 2, 2004 - Feb., 27, 2005). The aim of my work was to evaluate and investigate of the
delamination resistance for thermal barrier coating systems by means of the four point bending test.
1. Introduction
Industrial gas turbines are used as electrical generators by both utilities and private industrial
companies [1-10]. Nowadays so called 1500˚C level combined cycle gas turbines have been developed,
which can provide thermal efficiencies greater than 55% [3]. The durability of a gas turbine is principally
limited by those components operating at high temperatures in the turbine sections because those are
exposed to hot gas. Thermal barrier coatings (TBC), that reduce the temperature in the underlying
substrate material, are an essential requirement for the hot section components. A typical TBC system is
composed of an oxidation resistant metallic bond coat (BC) on the superalloy substrate and a thermal
insulating ceramic top coat (TC) attached to the BC. To take full advantage of the potential of TBC
systems, the evaluation and the prediction of the lifetime of TBC systems are important. Therefore
experimental and the analytical investigations in the TBC systems have been performed by many authors
[4-10]. As a result of these energetic studies, it has clearly been shown that the adherence of TC is the
most important parameter for the durability of TBC system [6-8, 14]. It was also cleared by recent
investigations that thermal grown oxide (TGO) grows at the TC/BC interface due to the thermal aging as
well as thermal cycle. In addition, it was believed that the TGO prays the important role in the spallation
of TBC systems.
The final goal in this project is the development of a reliable life time model for the TBC systems. The
object of the present work was to evaluate and investigate the delamination resistance of TBC systems by
means of four point bending tests. The effects of thermal aging and TC/BC interface roughness on the
delamination resistance were also discussed.
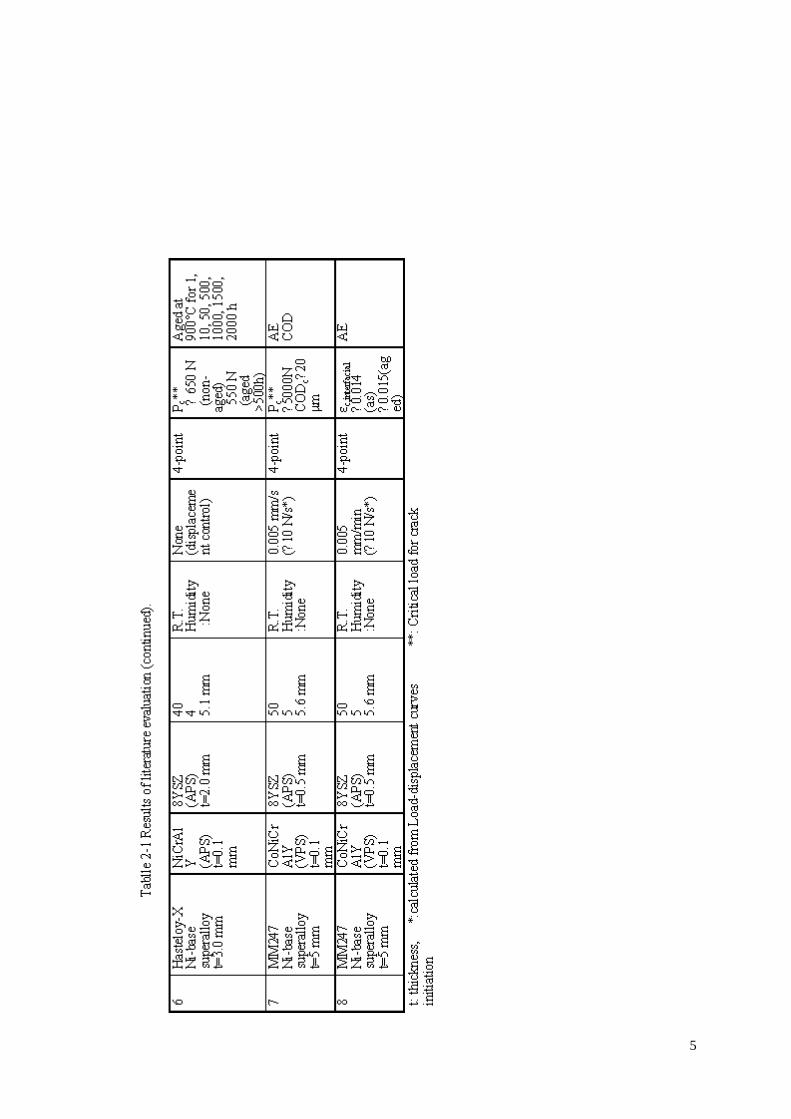
2. Literature Assessment
Before the tests, the literature, that reported about the evaluation and the investigation of the interfacial
properties of coated materials by means of four point bending tests, was investigated and evaluated [11-
18]. A summary of the literature evaluation is listed in Table 2-1 and Table 2-2.
Charalambides et al. proposed and discussed the evaluation of the critical energy release rate at the
metal/ceramic interface by means of four-point bending tests [13]. This method has the advantage that
2
the specimen geometry and test technique are simple. The critical energy release rate by delamination at
the metal-ceramic interface can be determined easily by using this method. However, this method is
applicable to only for thick coated materials that have relatively high fracture toughness to prevent the
vertical cracking. If it is applied to thin brittle coated material such as TBC systems, the vertical cracking
and segmentation decrease the stored elastic energy and make the evaluation of the interface fracture
energy significantly more difficult.
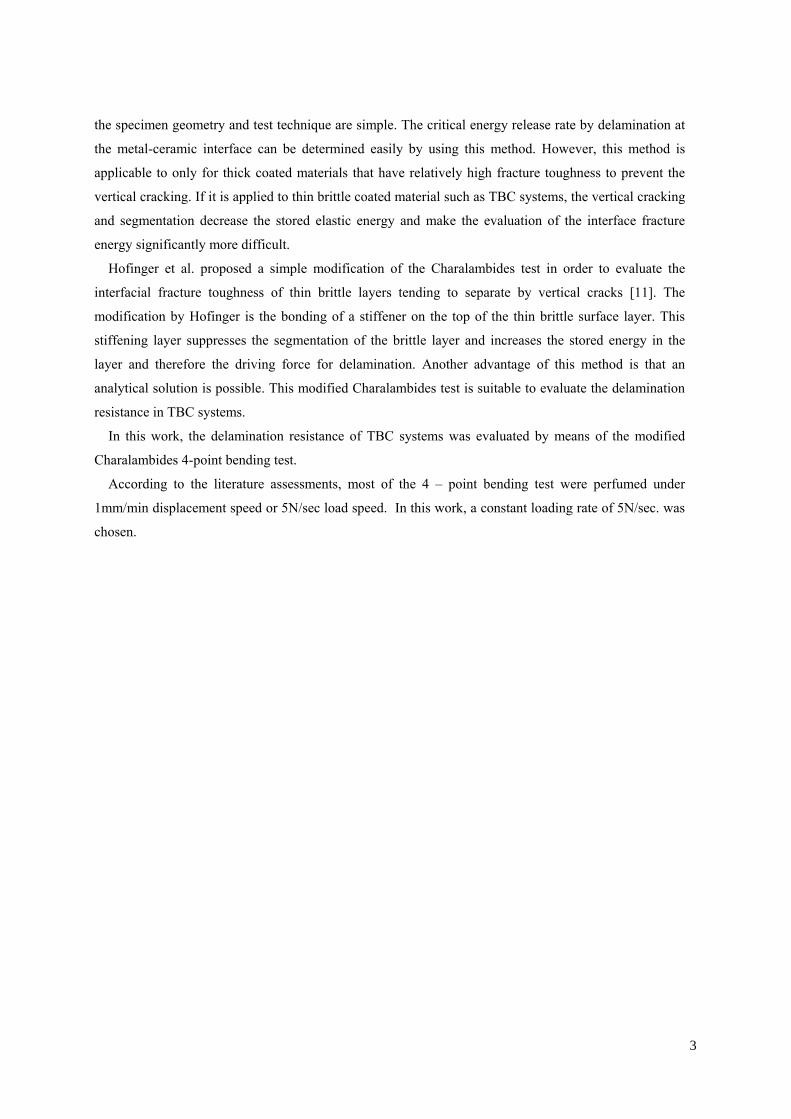
Hofinger et al. proposed a simple modification of the Charalambides test in order to evaluate the
interfacial fracture toughness of thin brittle layers tending to separate by vertical cracks [11]. The
modification by Hofinger is the bonding of a stiffener on the top of the thin brittle surface layer. This
stiffening layer suppresses the segmentation of the brittle layer and increases the stored energy in the
layer and therefore the driving force for delamination. Another advantage of this method is that an
analytical solution is possible. This modified Charalambides test is suitable to evaluate the delamination
resistance in TBC systems.
In this work, the delamination resistance of TBC systems was evaluated by means of the modified
Charalambides 4-point bending test.
According to the literature assessments, most of the 4 – point bending test were perfumed under
1mm/min displacement speed or 5N/sec load speed. In this work, a constant loading rate of 5N/sec. was
chosen.
3

4
5

6
3. Design and Preparation of the Test Rig
3. 1 Determination of spring constant of the spring unit
In the present work, a creep machine was used to apply the loading to the specimen (see section 6-2).
Since this machine can apply only a constant displacement which is 7 mm/min, a spring unit that can convert the constant displacement speed into a constant loading rate was designed and used.
δ&
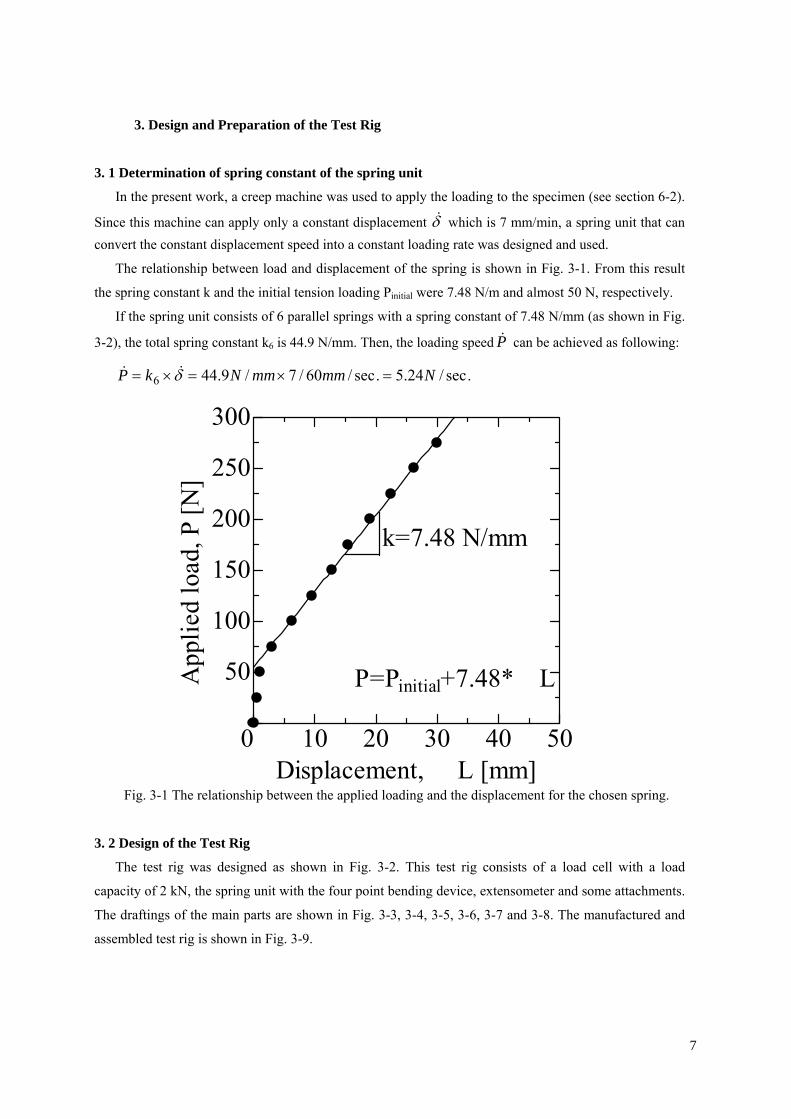
The relationship between load and displacement of the spring is shown in Fig. 3-1. From this result
the spring constant k and the initial tension loading Pinitial were 7.48 N/m and almost 50 N, respectively.
If the spring unit consists of 6 parallel springs with a spring constant of 7.48 N/mm (as shown in Fig.
3-2), the total spring constant k6 is 44.9 N/mm. Then, the loading speed P& can be achieved as following:
.sec/24.5.sec/60/7/9.446 NmmmmNkP =×=×= δ&&
10 20 30 40 50
50
100
150
200
250
300
0Displacement, ΔL [mm]
App
lied
load
, P [N
]
P=Pinitial+7.48*ΔL
k=7.48 N/mm
Fig. 3-1 The relationship between the applied loading and the displacement for the chosen spring.
3. 2 Design of the Test Rig
The test rig was designed as shown in Fig. 3-2. This test rig consists of a load cell with a load
capacity of 2 kN, the spring unit with the four point bending device, extensometer and some attachments.
The draftings of the main parts are shown in Fig. 3-3, 3-4, 3-5, 3-6, 3-7 and 3-8. The manufactured and
assembled test rig is shown in Fig. 3-9.
7
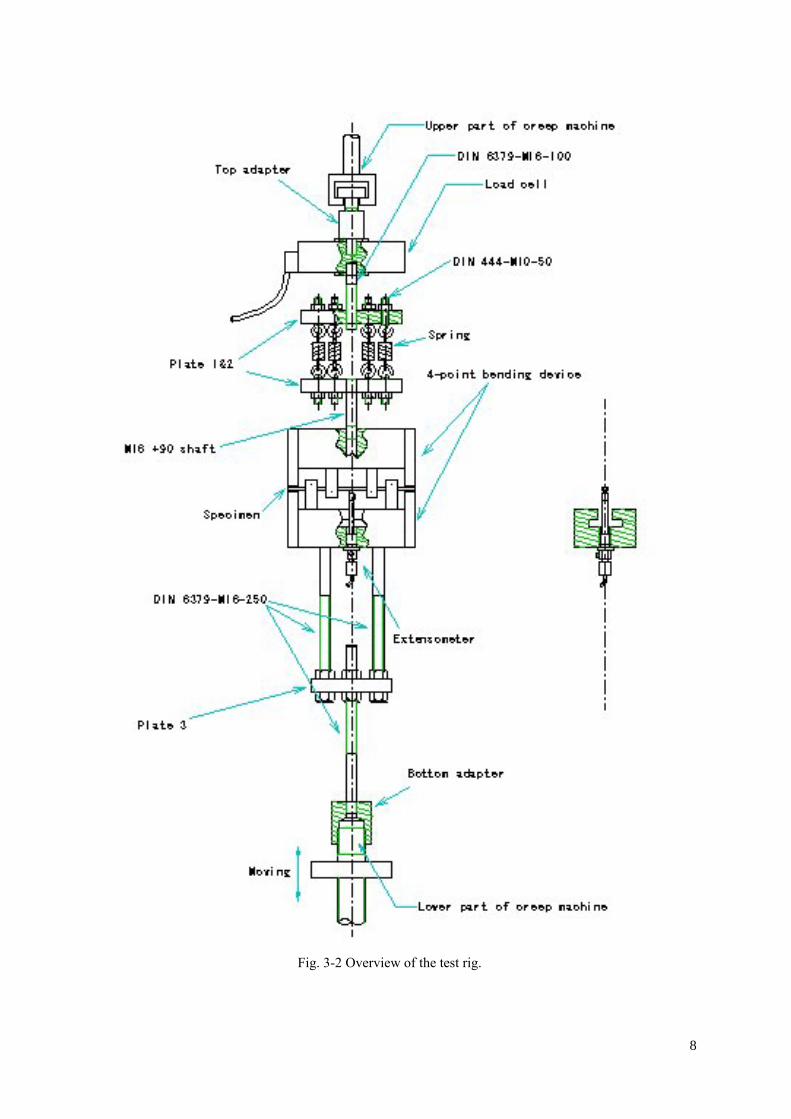
Fig. 3-2 Overview of the test rig.
8
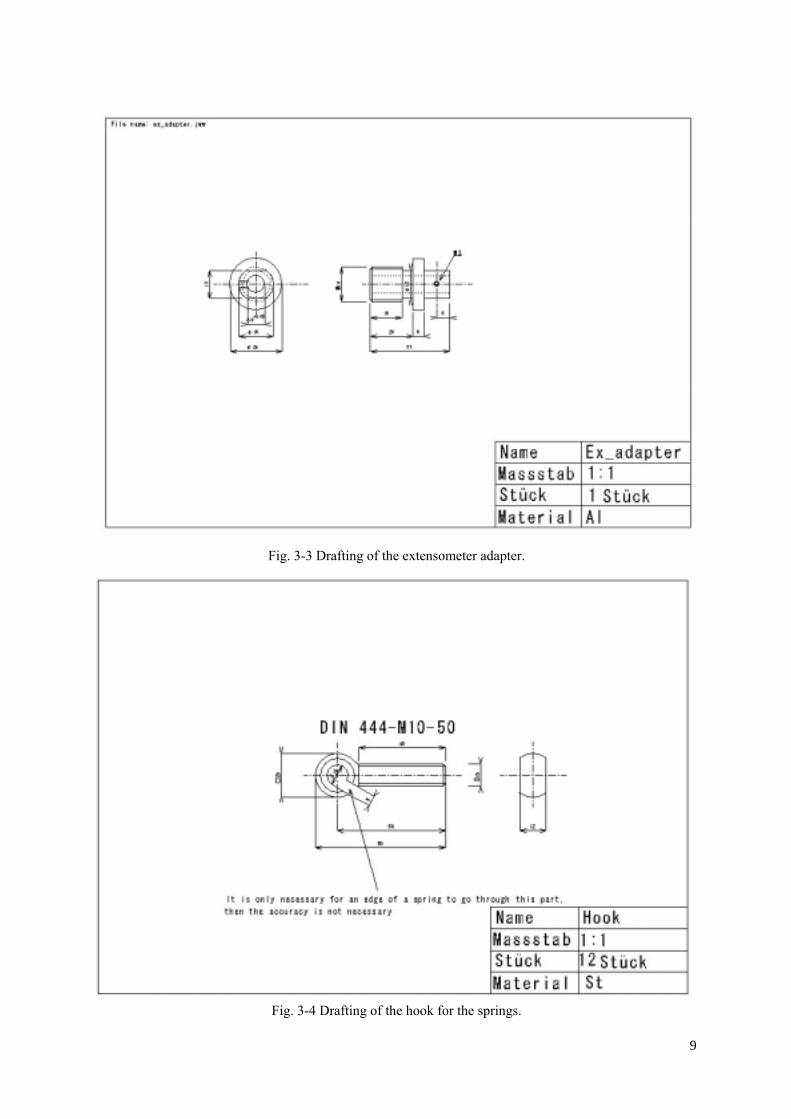
Fig. 3-3 Drafting of the extensometer adapter.
Fig. 3-4 Drafting of the hook for the springs.
9
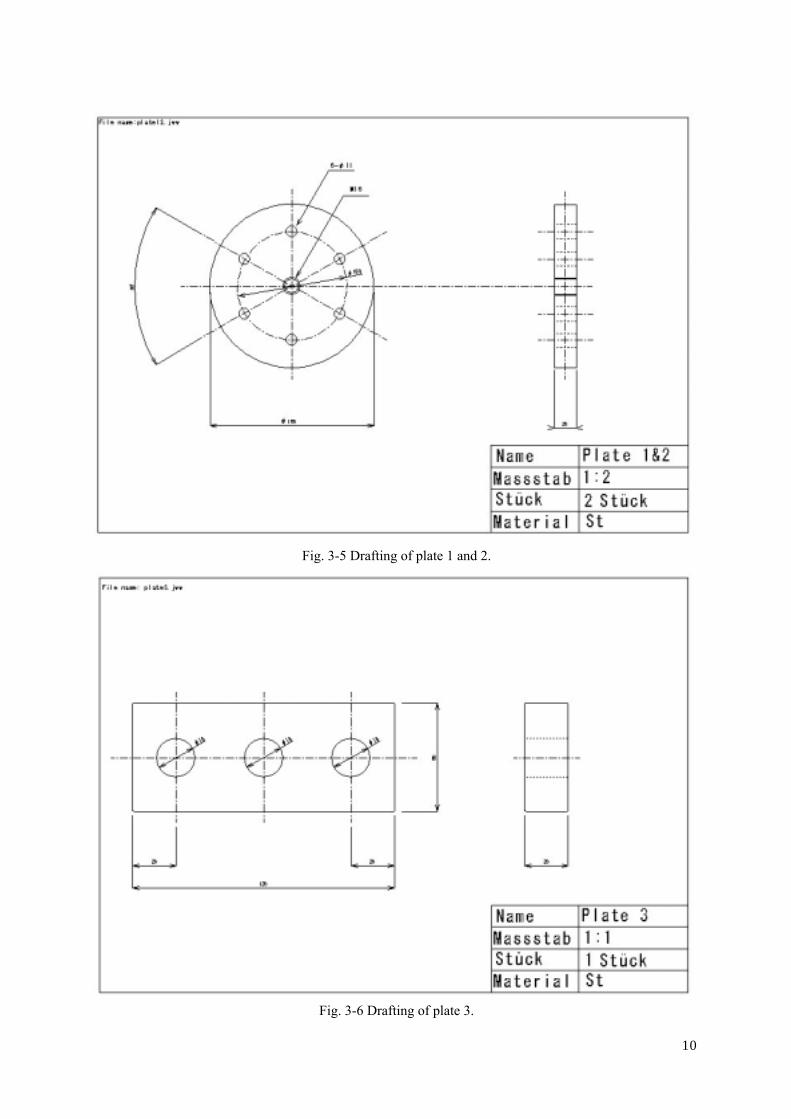
Fig. 3-5 Drafting of plate 1 and 2.
Fig. 3-6 Drafting of plate 3.
10

Fig. 3-7 Drafting of adapter 1 (to connect creep machine and load cell).
Fig. 3-8 Drafting of bottom adapter (to connect the test rig to creep machine).
11

Fig. 3-9 Photograph of the test rig.
12

4. Material and Specimen Preparation
The 8wt.% yttria partially stabilized zirconia, 8YSZ, was used as top coat (TC) layer and was
deposited on the bond coat by air plasma spraying. The single crystal Ni-base superalloy CMSX-4
prismatic bar of 5 mm in thickness and 10 mm in width was used as the substrate. The CoNiCrAlY alloy,
LCO22, was selected as the bond coat (BC) layer between TC and substrate. In the present work, in order
to study the effect of the interface roughness between BC and TC, two kinds of the LCO22 powder with
different particle size were used. In this work, the specimens which were sprayed with fine grain LCO22
powder are called fine BC specimens, and those which were sprayed with coarse powder are called
coarse BC specimens. The typical surface morphology of the BC is shown in Fig. 4-1. The surface
profile and surface roughness of the BC for each specimen are shown in Fig. 4-2 and Table 4-1,
respectively.
It was revealed by recent investigations that thermal grown oxide (TGO) grows at the TC/BC
interface due to the thermal aging as well as thermal cycling. In addition, TGO prays an important role in
spallation fracture in TBC system. In this work, the effect of the TGO thickness on the delamination
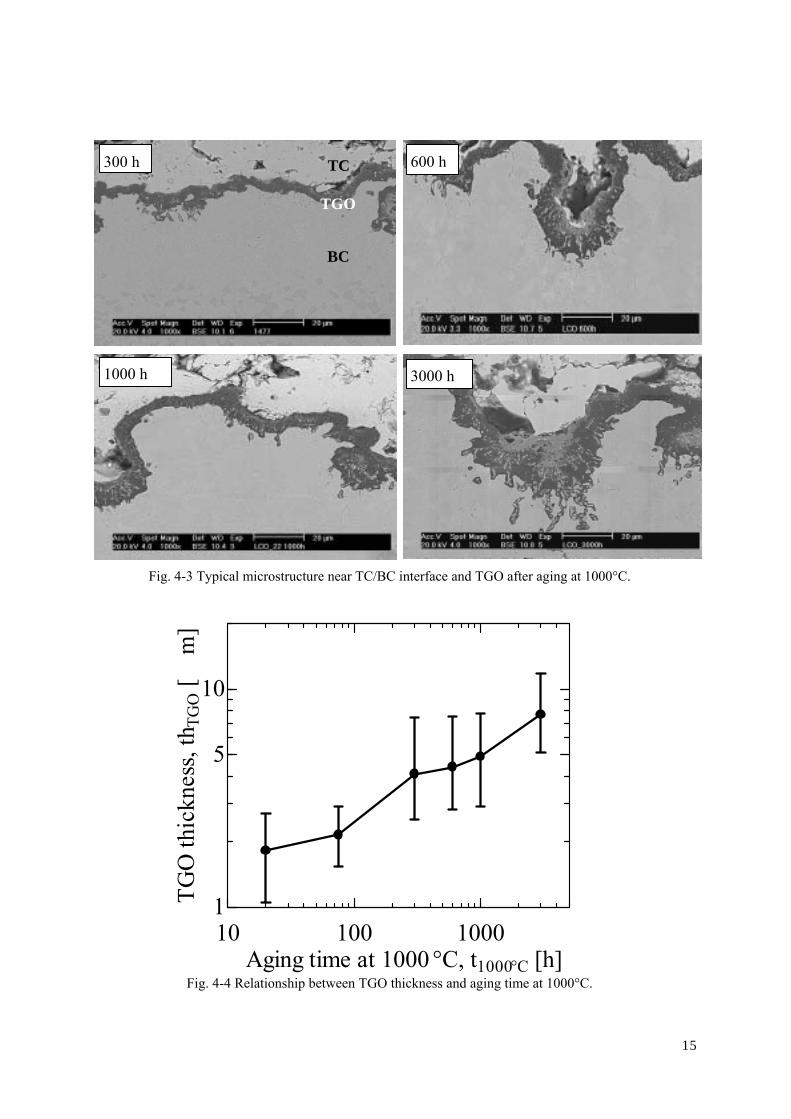
resistance of the TBC system was also studied. Typical microstructures near the TC/BC interface after
thermal exposure at 1000˚C are shown in Fig. 4-3. From these microstructural observations, the TGO
thickness was measured and compared with the aging time. The TGO thickness as a function of aging
time is shown in Fig. 4-4. In this figure, the TGO thickness increased with increasing aging time. It can
be estimated from Fig. 4-4 that the thickness of the TGO is approximately 3, 5 and 7µm after aging for
200, 1000 and 2000 h, respectively. Then, some bending specimens were exposed at 1000˚C for 200 hr,
1000 hr and 2000 hr. The parameters of the specimens are summarized in Table 4-2.
The prismatic notched bar specimens that were 130 mm in length, 10 mm in width and approximately
9.9 mm in thickness (including stiffener), were prepared as shown in Fig. 4-5. The thicknesses of the top
coat and the bond coat were approximately 350 µm. The mechanical notch with a width of 2 - 3 mm was
induced in the top coat of the specimen’s center after the thermal exposures.
In this work, in order to prevent vertical cracking in the top coat, namely to inhibit the segmentation of
the top coat, the stiffener with the size of 60×10×4.2 mm was bonded on top coat by adhesion (Araldite
AT1), as shown in Fig. 4-5. The material of the stiffener was structural steel. The details of the bonding
procedure will be explained in section 6. 1.
The mechanical and thermal properties of substrate, bond coat, top coat, stiffener and TGO are
summarized in Table 4-3.
13

Fig. 4-1 Typical result of an optical measurement of bond coating surface roughness: fine bond coat
specimen.
(a) for fine bond coat specimen (b) for coarse bond coat specimen
Fig. 4-2 Surface profiles of bond coat surface.
Table 4-1 Surface roughness of bond coat surface, Ra (unit in µm)
Specimen Average Measurement value
Fine bond coat 8.71 7.14 7.67 9.68 10.36
Coarse bond coat 9.52 10.27 9.89 8.36 9.55
14
300
1000
TGO
BC
TC 600 hh
3000 h h
Fig. 4-3 Typical microstructure near TC/BC interface and TGO after aging at 1000°C.
Fig. 4-4 Relationship between TGO thickness and aging time at 1000°C.
10 100 10001
5
10
Aging time at 1000 °C, t1000°C [h]
TGO
thic
knes
s, th
TGO
[μm
]
15
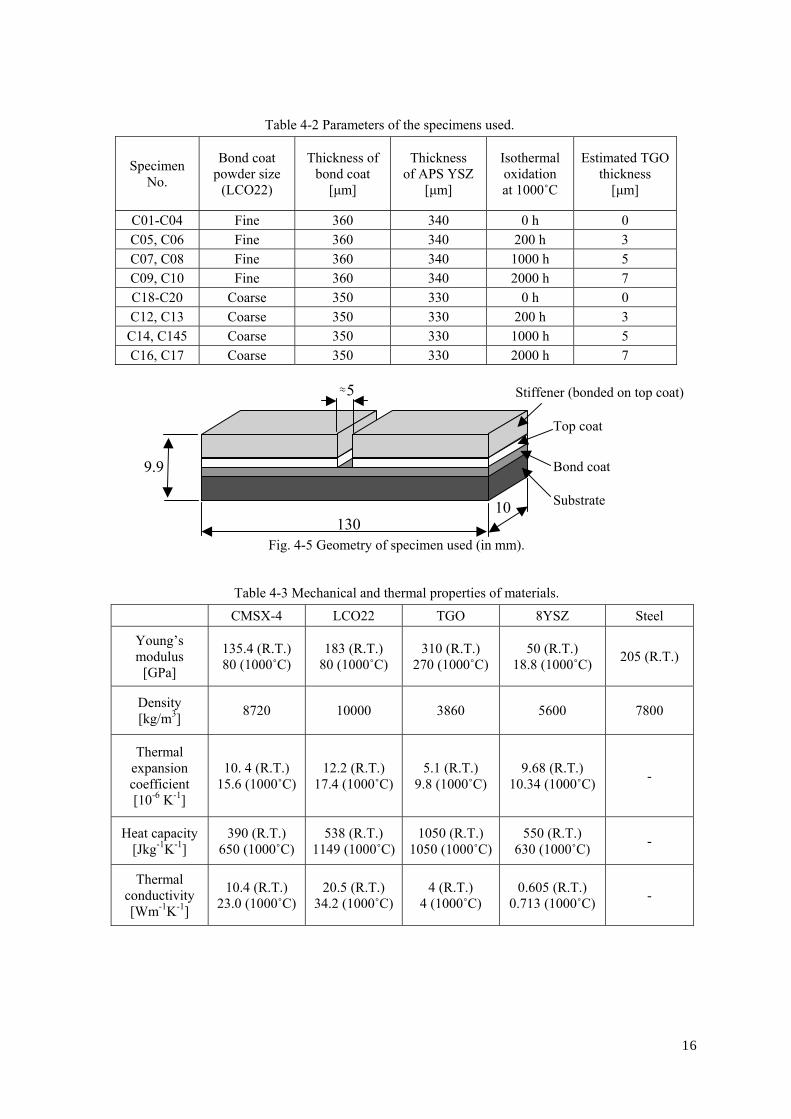
Table 4-2 Parameters of the specimens used.
Specimen No.
Bond coat powder size
(LCO22)
Thickness ofbond coat
[µm]
Thickness of APS YSZ
[µm]
Isothermal oxidation at 1000˚C
Estimated TGOthickness
[µm]
C01-C04 Fine 360 340 0 h 0 C05, C06 Fine 360 340 200 h 3 C07, C08 Fine 360 340 1000 h 5 C09, C10 Fine 360 340 2000 h 7 C18-C20 Coarse 350 330 0 h 0 C12, C13 Coarse 350 330 200 h 3
C14, C145 Coarse 350 330 1000 h 5 C16, C17 Coarse 350 330 2000 h 7
Fig. 4-5 Geometry of specimen used (in mm).
Substrate
Bond coat
Top coat
Stiffener (bonded on top coat)
9.9
10
≈5
130
Table 4-3 Mechanical and thermal properties of materials.
CMSX-4 LCO22 TGO 8YSZ Steel
Young’s modulus
[GPa]
135.4 (R.T.) 80 (1000˚C)
183 (R.T.) 80 (1000˚C)
310 (R.T.) 270 (1000˚C)
50 (R.T.) 18.8 (1000˚C) 205 (R.T.)
Density [kg/m3] 8720 10000 3860 5600 7800
Thermal expansion coefficient [10-6 K-1]
10. 4 (R.T.) 15.6 (1000˚C)
12.2 (R.T.) 17.4 (1000˚C)
5.1 (R.T.) 9.8 (1000˚C)
9.68 (R.T.) 10.34 (1000˚C) -
Heat capacity [Jkg-1K-1]
390 (R.T.) 650 (1000˚C)
538 (R.T.) 1149 (1000˚C)
1050 (R.T.) 1050 (1000˚C)
550 (R.T.) 630 (1000˚C) -
Thermal conductivity [Wm-1K-1]
10.4 (R.T.) 23.0 (1000˚C)
20.5 (R.T.) 34.2 (1000˚C)
4 (R.T.) 4 (1000˚C)
0.605 (R.T.) 0.713 (1000˚C) -
16

5. Analytical Considerations
5. 1 Model and parameters
For the composite which consists of k layers, with the Euler-Bernoulli beam theory, it can be assumed
that each layer is deformed in the same curvature by the applid bending moment, M, as shon in Fig. 5-1.
φ
M M
1 layer
k layer
Fig. 5-1 Schematic illustration of bending deformasion in k-layer composite.
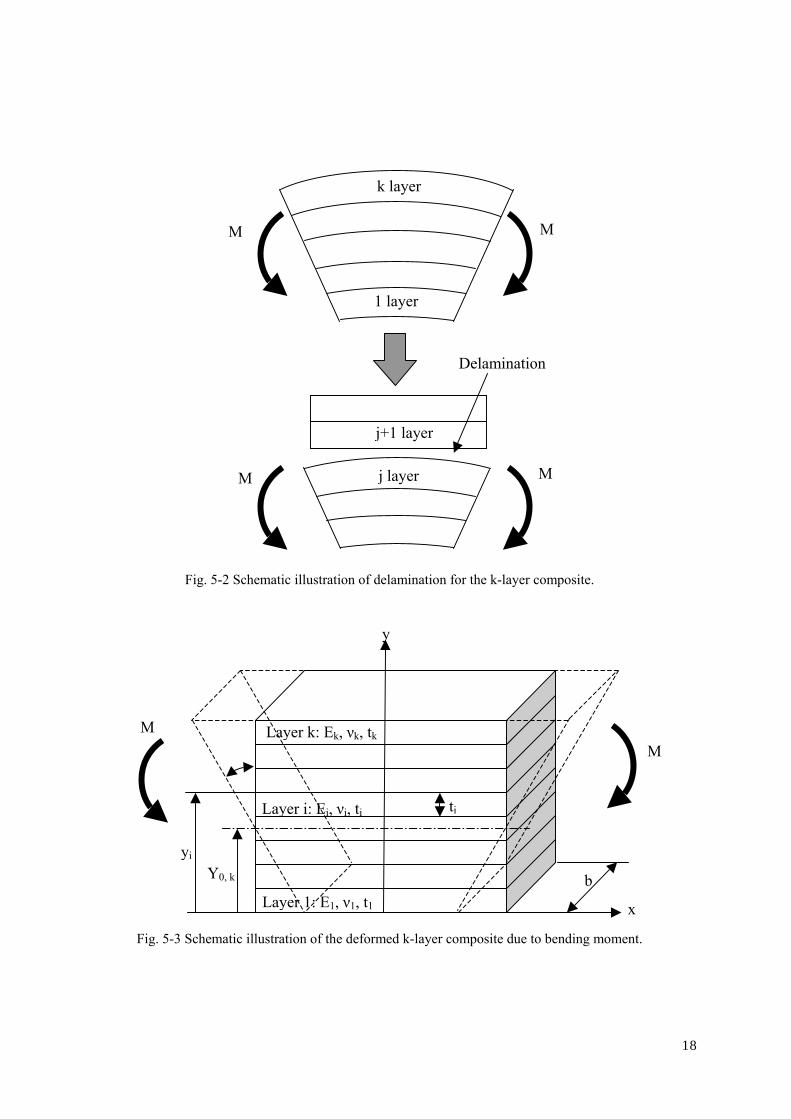
With the applied bending moment M, when the delamination occurrs between the layers j and j+1 of
the k-layer composite, as shown in Fig. 5-2, the strain energy per unit crosscection before and after
delamination are as follows;
for befor deramination,
*,
*,
2
2 kckc
bk
IEM
=U Eq. 1
after deramination,
*,
*,
2
2 jcjc
bj
IEM
=U Eq. 1
where, E*c, k and E*c, j are the Young’s moduli for the composite which consists of k layers I*c, k and I*c, j
are second moments per unit width for the composite which consists of k layers, and Mb is the applied
bending moment per unit width shown by
Eq. 3 bMM b /=
Therefore when the delamination occurrs between j and j+1 layers in the k-layer composite, the energy
releace rate by delamination is
G Eq. 4 kjc UUU −=∆−=
17
M M j layer
j+1 layer
Delamination
M M
1 layer
k layer
Fig. 5-2 Schematic illustration of delamination for the k-layer composite.
y
φ
Y0, k b
yi
ti
Layer k: Ek, νk, tk
Layer i: Ei, νi, ti
Layer 1: E1, ν1, t1 x
M M
Fig. 5-3 Schematic illustration of the deformed k-layer composite due to bending moment.
18
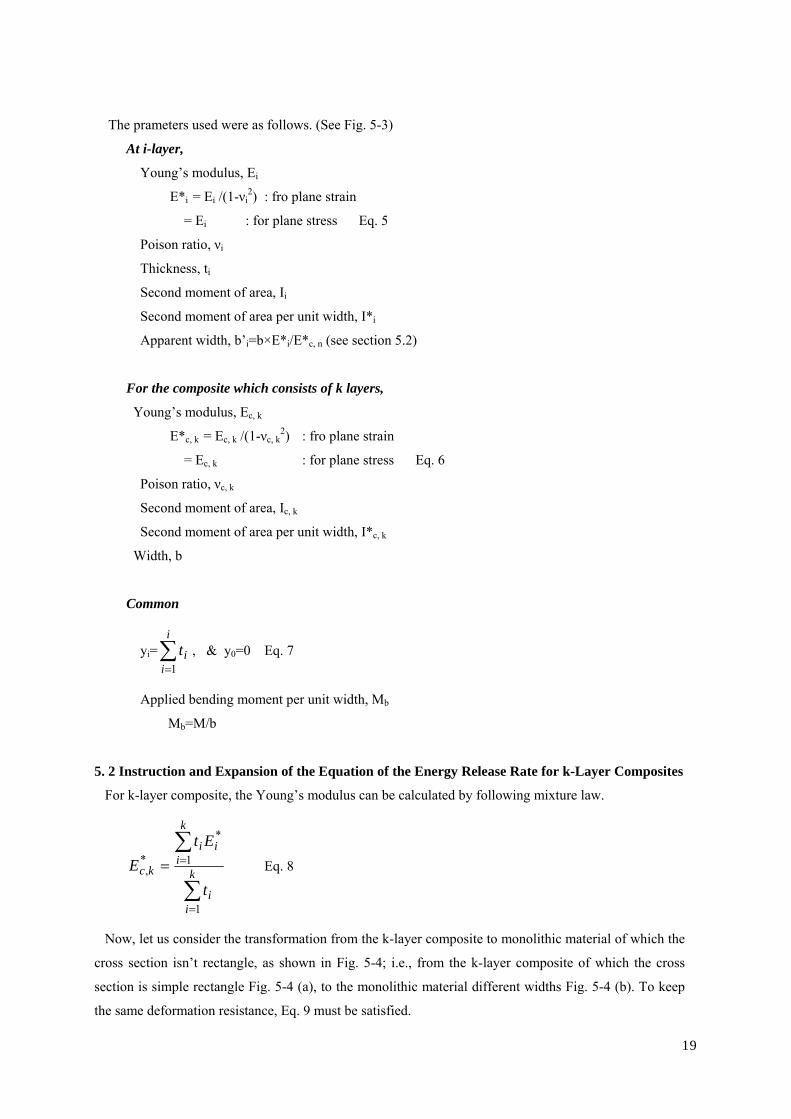
The prameters used were as follows. (See Fig. 5-3)
At i-layer,
Young’s modulus, Ei
E*i = Ei /(1-νi2) : fro plane strain
= Ei : for plane stress Eq. 5
Poison ratio, νi
Thickness, ti
Second moment of area, Ii
Second moment of area per unit width, I*i
Apparent width, b’i=b×E*i/E*c, n (see section 5.2)
For the composite which consists of k layers,
Young’s modulus, Ec, k
E*c, k = Ec, k /(1-νc, k2) : fro plane strain
= Ec, k : for plane stress Eq. 6
Poison ratio, νc, k
Second moment of area, Ic, k
Second moment of area per unit width, I*c, k
Width, b
Common
yi= , & y∑=
i
iit
10=0 Eq. 7
Applied bending moment per unit width, Mb
Mb=M/b
5. 2 Instruction and Expansion of the Equation of the Energy Release Rate for k-Layer Composites
For k-layer composite, the Young’s modulus can be calculated by following mixture law.
∑
∑
=
== k
ii
k
iii
kc
t
EtE
1
1
*
*, Eq. 8
Now, let us consider the transformation from the k-layer composite to monolithic material of which the
cross section isn’t rectangle, as shown in Fig. 5-4; i.e., from the k-layer composite of which the cross
section is simple rectangle Fig. 5-4 (a), to the monolithic material different widths Fig. 5-4 (b). To keep
the same deformation resistance, Eq. 9 must be satisfied.
19

y
b
Samedeformation resistance
E*c, k, b’1
E*c, k, b’i
E*c, k, b’k
y
E*k, b
E*i, b
E*1, b b
z z
Constant width, b Variable width, b’i
Variable Young’s modulus, E*i Constant Young’s modulus, E*c, k
(a) (b)
Fig. 5-4 Relationship between the original width and the apparent width.
*,
*'
kc
i
EE
bb= Eq. 9
Therefore, the statical moment of the area for the k-layer composite Sk is
∑∑∑∫∫=
−==
−=
===
−−
k
iiii
k
i
y
yi
k
i
y
y iAk yybybdyybydASi
i
i
i 1
21
2
11)('
21
2''
11
Eq. 10
Then the position of neutral axis for the k-layer composite Y0,k
∑
∑
∑
∑
=
=−
=−
=− −
=
−
−
== k
iii
k
iiii
k
iiii
k
iiii
kko
tb
yyb
yyb
yyb
AS
Y
1
1
21
2
11
1
21
2
,
'2
)('
)('
)('21
Eq. 11
From Eq. 9, Eq. 11 becomes
∑
∑
=
=−−
= k
iii
k
iiii
ko
tE
yyEY
1
*
1
21
2*
,
2
)( Eq. 12
On the other hand, the second moment of area for the i-layer in the k-layer composite Ik,i is,
2,0
13
, )2
('12
' kii
iii
iik Yyy
tbt
bI −+
+= − Eq. 13
Then, second moment of area for k-layer composite Ic,k is
20

∑=
−
−+
+=k
ik
iiii
iikc YyytbtbI
1
2,0
13
, )2
('12
' Eq. 14
Therefore per unit width,
∑=
−
−+
+=k
ik
iii
iikc Yyyttb
bI
1
2,0
13
*, )
2(
12'1
∑=
−
−+
+=k
ik
iii
ii
kckc YyyttE
EI
1
2,0
13
**,
*, )
2(
121
Eq. 15
Consequently, if the delamination occurred between the layers j and j+1 of the k-layer composite, the
energy release rate Gc is:
−= *,
*,
*,
*,
2 112 kckcjcjc
bc
IEIEM
G Eq. 16
where,
, ybMM b /2 = i= , ∑=
i
iit
1
∑
∑
=
== k
ii
k
iii
kc
t
EtE
1
1
*
*, ,
∑=
−
−+
+=k
ik
iii
ii
kckc YyyttE
EI
1
2,0
13
**,
*, )
2(
121
,
∑
∑
=
=−−
= k
iii
k
iiii
ko
tE
yyE
1
*
1
21
2*
,
2
)(Y
21

For 2 layers composite, the Eq. 16 equals the Charalambides’s equation [1], when h1=t2, h2=t1 and the
indexes are changed, 1 2, 2 1.
For 3 layers composites, the relationship between the normalized energy release rate and the
normalized stiffener thickness is shown in Fig. 5-5, where for 3 layers composite the energy release rate
was calculated by Eq. 16 with t2=0 and t3=0. In Fig. 5-5, the result from the equation proposed by
Hofinger [2], Eq. 17, is also shown.
−
−=
comsubsub
subbc IIE
MG 11
2)1( 22 ν
Eq, 17 [2]
with
12
3sub
subt
I = ,
{ })(4
)2(333
222222
333
stifcoatsub
stifcoatstifcoatsubstifcoatcoatstif
stifcoatsubcom ttt
ttttttttt
tttI
µκ
µκµκ
++
+−−−
++++=
)1()1(
2
2
coatsub
subcoat
EE
ν
νκ
−
−= ,
)1(
)1(2
2
stifsub
substif
E
E
ν
νµ
−
−=
where, Mb is the bending moment per unit width (Eq. 3), E and ν are Young’s modulus and Poison’s ratio,
t is thickness of layer, while the subscripts, sub, coat and stif indicate substrate, coating and stiffener,
respectively. From Fig. 5-5, the results from Eq. 16 were same to the results reported by Hofinger.
22
0 0.2 0.4 0.6 0.8 10
1
2
Normalized thickness of Stiffener, t 5/t1 or tstif/tsub
GcE
1b2 (t 1
+t4)
3 /(P2 L2 (1
-ν12 ))
orG
cEsu
bb2 (t s
ub+t
coat
)3 /(P2 L2 (1
-νsu
b2 ))
3 layer model (Literature) : Esub/Ecoat=1 : Esub/Ecoat=2 : Esub/Ecoat=3
k-layer model (Present work) : E1/E4=1 : E1/E4=2 : E1/E4=3
Fig. 5-5 The relationship between normalized energy release rate and the normalized stiffener thickness;
E1=E5, Esub=Esitf, t4/t1=tcoat/tsub=0.1, all of Poison ratio were 0.3.

For TBC specimens, i.e., for 5-layers composite, the energy release rate calculated by Eq. 16 is shown
in Fig. 5-6, compared with that calculated by Hofinger’s equation (Eq. 17). The results were calculated
by using the actual material constants listed in Table 5-1, in the case of t3=0, and
Esub=(t1E1+ t2E2)/(t1+t2) (mixture law), Ecoat=E4, Estif=E5,
νsub=ν1, νcoat=ν4, νstiff=ν5, tsub=(t1+t2), tcoat=t4, tstiff=t5
for calculating by Eq. 17. From Fig. 5-6, the difference of the energy release rates calculated increased by
increasing the critical load of delamination Pc. These results indicate that for TBC specimens the energy
release rate must be calculated by Eq. 16, in other words, the bond coating can’t be neglected even if the
mixture law was considered.
0 1000 20000
200
400
600
800
Critical load, Pc [N]
Ener
egy
rele
ase
rate
, Gc [
N/m
] : by Eq. 16 (present work)
: by Eq. 17 (Hofinger etal. [2])
Fig. 5-6 Relationship between energy release rate and critical load calculated by Eq. 16 and Eq. 17.
23
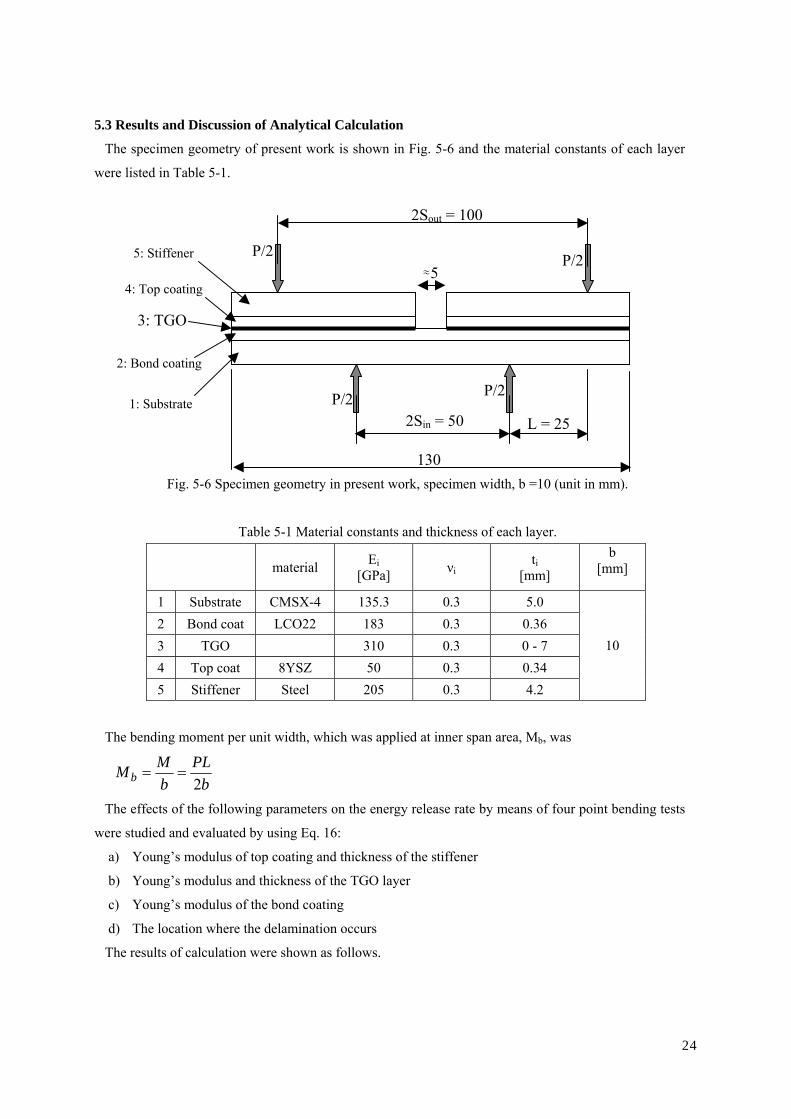
5.3 Results and Discussion of Analytical Calculation
The specimen geometry of present work is shown in Fig. 5-6 and the material constants of each layer
were listed in Table 5-1.
P/2P/2
P/2 P/2
130
L = 25 2Sin = 50
2Sout = 100
≈5
1: Substrate
2: Bond coating
5: Stiffener
4: Top coating
3: TGO
Fig. 5-6 Specimen geometry in present work, specimen width, b =10 (unit in mm).
Table 5-1 Material constants and thickness of each layer.
material Ei [GPa] νi
ti [mm]
b [mm]
1 Substrate CMSX-4 135.3 0.3 5.0 2 Bond coat LCO22 183 0.3 0.36 3 TGO 310 0.3 0 - 7 4 Top coat 8YSZ 50 0.3 0.34 5 Stiffener Steel 205 0.3 4.2
10
The bending moment per unit width, which was applied at inner span area, Mb, was
b
PLbMMb 2
==
The effects of the following parameters on the energy release rate by means of four point bending tests
were studied and evaluated by using Eq. 16:
a) Young’s modulus of top coating and thickness of the stiffener
b) Young’s modulus and thickness of the TGO layer
c) Young’s modulus of the bond coating
d) The location where the delamination occurs
The results of calculation were shown as follows.
24

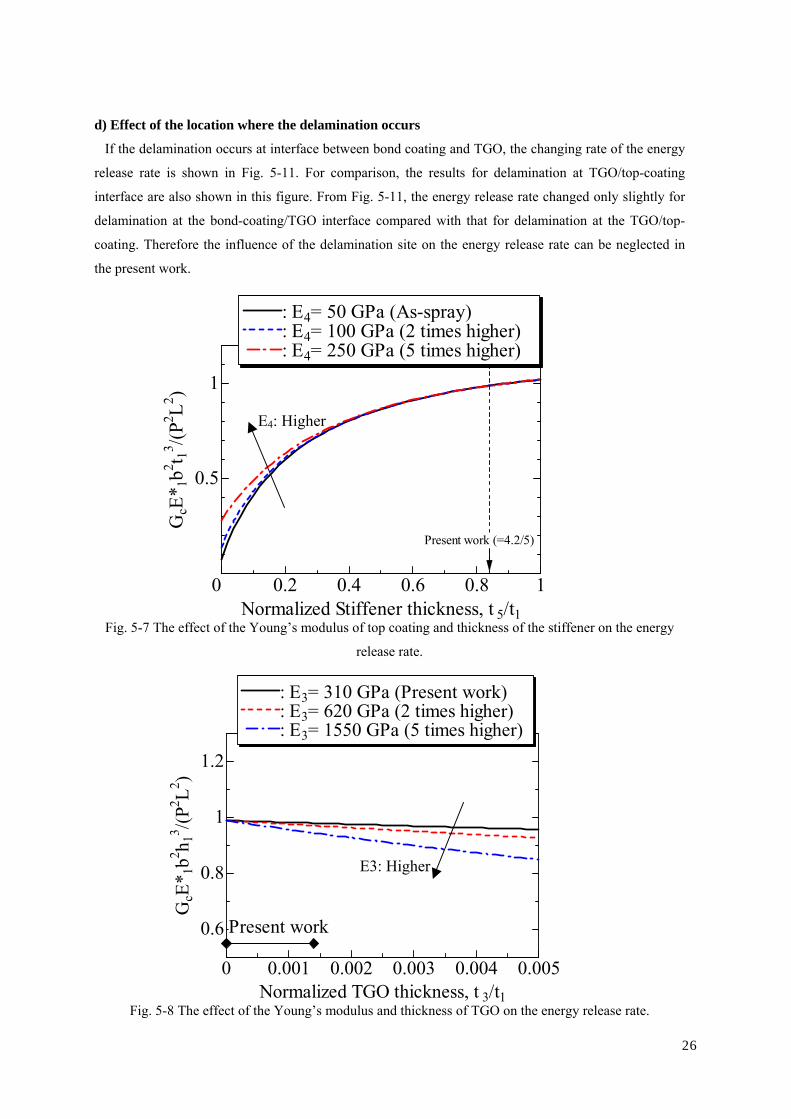
a) Effects of Young’s modulus of top coating and thickness of the stiffener
The effect of the thickness of the stiffener on the energy release rate is shown in Fig. 5-7. In this figure,
the horizontal indicates the thickness of the stiffener normalized by that of substrate t5/t1, while the
vertical axis shows the normalized energy release rate,
)/( 2231
2*1 LPtbEGc
where Gc is energy release rate, E*1=E1/ (1-ν12), E1 is the Young’s modulus of the substrate, b is the
width of the specimen, t1 and t5 are the thickness of the substrate and stiffener, P is the applied load,
L=Sout-Sin (see Fig. 5-7), respectively. In this figure, the energy release rate increased with the stiffener
thickness. However the increasing rate of the energy release rate decreased with the increasing of the
stiffener thickness.
The result for the Young’s modulus of 50 GPa as the as-sprayed condition, is shown in Fig. 5-7,
compared with those for two or five times higher Young’s moduli. From these results, the energy release
rate depends on the Young’s modulus of the top coating if the thickness of the stiffener is relatively thin.
However, it was independent of the stiffener thickness if the normalized stiffener thickness is larger than
almost 0.6. In the present work, the value of the normalized stiffener thickness was 0.84. Therefore, in
the present work, the effect on the energy release rate can be neglected even if Young’s modulus of the
top coating is changed during thermal oxidation exposure.
b) Effects of Young’s modulus and thickness of the TGO layer
Fig. 5-8 shows the relationship between the normalized energy release rate and the normalized TGO
thickness for the case that the Young’s modulus of the TGO was the original value (310GPa) and for the
case of two to five times higher values. The normalized energy release rate decreased with increasing not
only of the TGO thickness but also of Young’s modulus of the TGO.
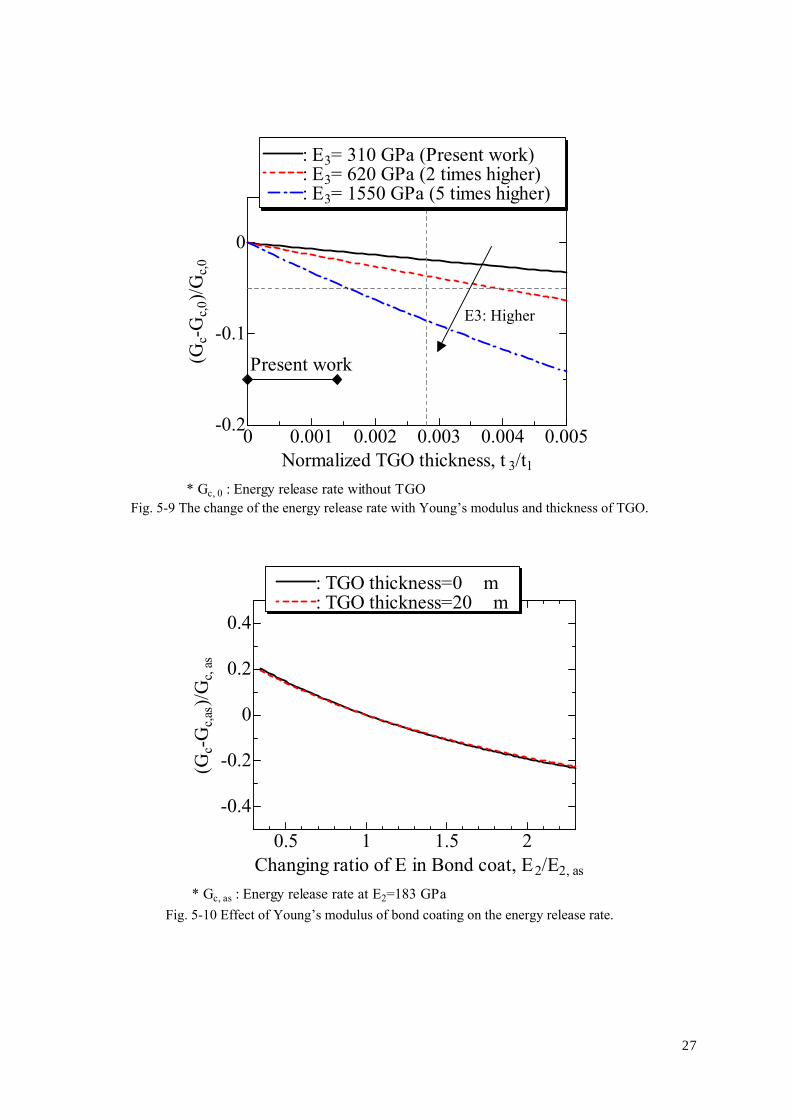
Fig. 5-9 shows the changing rate of the energy release rate as a function of the normalized thickness
and Young’s modulus of the TGO. In Fig. 5-9, the energy release rate was changed less than 5% if the
thickness and Young’s modulus were 2 times higher than those of the present work. Therefore, the effect
of thickness and Yong’s modulus of TGO can be neglected in the present work.
c) Effect of Young’s modulus of the bond coating
The Effect of the Young’s modulus of the bond coating on the energy release rate is shown in Fig. 5-10.
In Fig. 5-10, the energy release rate was changed less than 5% if the Young’s modulus of bond coating
was changed 20%. In the present work, it can be considered that the effect of the Young’s modulus of the
bond coating is neglected, because the bond coating is stable and the mechanical properties of it don’t
change during oxidation exposure. However if the Young’s modulus of the bond coating is changed more
than 20%, the effect of it becomes large and can’t be neglected.
25
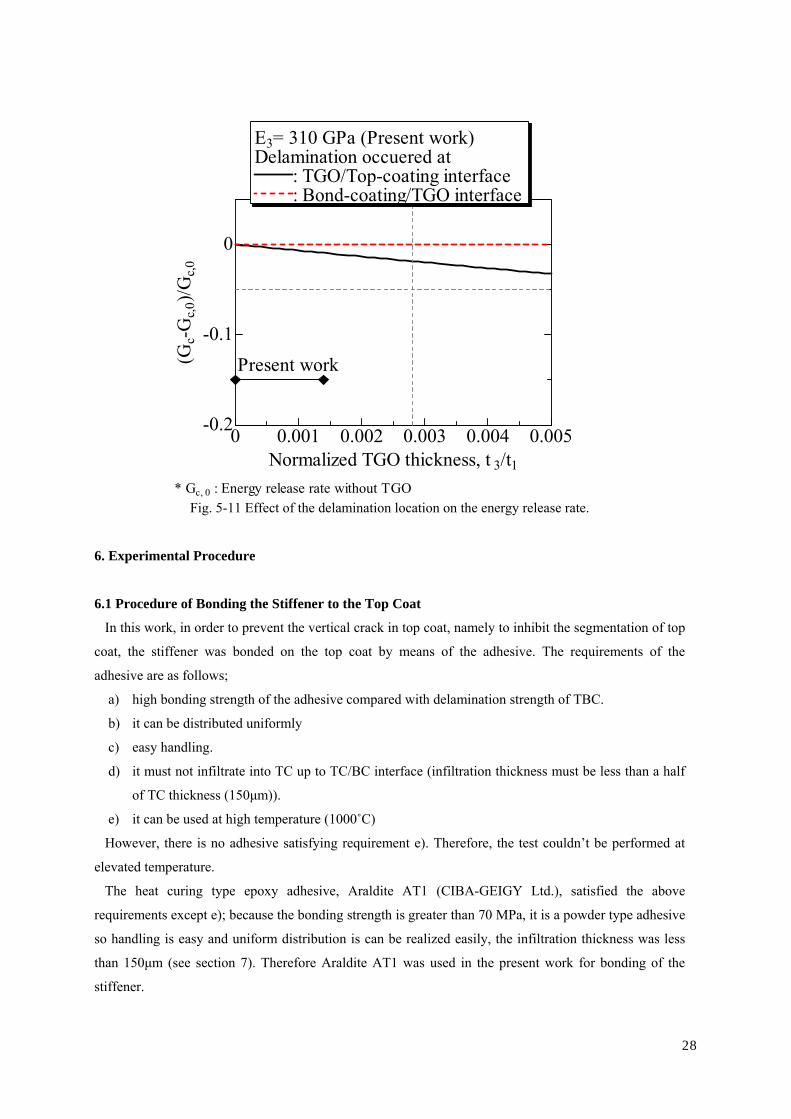
d) Effect of the location where the delamination occurs
If the delamination occurs at interface between bond coating and TGO, the changing rate of the energy
release rate is shown in Fig. 5-11. For comparison, the results for delamination at TGO/top-coating
interface are also shown in this figure. From Fig. 5-11, the energy release rate changed only slightly for
delamination at the bond-coating/TGO interface compared with that for delamination at the TGO/top-
coating. Therefore the influence of the delamination site on the energy release rate can be neglected in
the present work.
26
0 0.001 0.002 0.003 0.004 0.005
0.6
0.8
1
1.2
Normalized TGO thickness, t 3/t1
GcE
* 1b2 h 1
3 /(P2 L2 )
: E3= 310 GPa (Present work): E3= 620 GPa (2 times higher) : E3= 1550 GPa (5 times higher)
Present work
Fig. 5-7 The effect of the Young’s modulus of top coating and thickness of the stiffener on the energy
release rate.
0.2 0.4 0.6 0.8 1
0.5
1
0Normalized Stiffener thickness, t 5/t1
GcE
* 1b2 t 13 /(P
2 L2 )
: E4= 50 GPa (As-spray): E4= 100 GPa (2 times higher) : E4= 250 GPa (5 times higher)
Present work (=4.2/5)
E4: Higher
E3: Higher
Fig. 5-8 The effect of the Young’s modulus and thickness of TGO on the energy release rate.
0 0.001 0.002 0.003 0.004 0.005-0.2
-0.1
0
Normalized TGO thickness, t 3/t1
(Gc-G
c,0)/G
c,0
: E3= 310 GPa (Present work): E3= 620 GPa (2 times higher) : E3= 1550 GPa (5 times higher)
Present work
* Gc, 0 : Energy release rate without TGO
E3: Higher
Fig. 5-9 The change of the energy release rate with Young’s modulus and thickness of TGO.
27
0.5 1 1.5 2
-0.4
-0.2
0
0.2
0.4
Changing ratio of E in Bond coat, E2/E2, as
(Gc-G
c,as
)/Gc,
as
* Gc, as : Energy release rate at E2=183 GPa
: TGO thickness=0μm: TGO thickness=20μm
Fig. 5-10 Effect of Young’s modulus of bond coating on the energy release rate.
0 0.001 0.002 0.003 0.004 0.005-0.2
-0.1
0
Normalized TGO thickness, t 3/t1
(Gc-G
c,0)/G
c,0
E3= 310 GPa (Present work)Delamination occuered at
: TGO/Top-coating interface : Bond-coating/TGO interface
Present work
* Gc, 0 : Energy release rate without TGO
Fig. 5-11 Effect of the delamination location on the energy release rate.
6. Experimental Procedure
6.1 Procedure of Bonding the Stiffener to the Top Coat
In this work, in order to prevent the vertical crack in top coat, namely to inhibit the segmentation of top
coat, the stiffener was bonded on the top coat by means of the adhesive. The requirements of the
adhesive are as follows;
a) high bonding strength of the adhesive compared with delamination strength of TBC.
b) it can be distributed uniformly
c) easy handling.
d) it must not infiltrate into TC up to TC/BC interface (infiltration thickness must be less than a half
of TC thickness (150µm)).
e) it can be used at high temperature (1000˚C)
However, there is no adhesive satisfying requirement e). Therefore, the test couldn’t be performed at
elevated temperature.
The heat curing type epoxy adhesive, Araldite AT1 (CIBA-GEIGY Ltd.), satisfied the above
requirements except e); because the bonding strength is greater than 70 MPa, it is a powder type adhesive
so handling is easy and uniform distribution is can be realized easily, the infiltration thickness was less
than 150µm (see section 7). Therefore Araldite AT1 was used in the present work for bonding of the
stiffener.
28
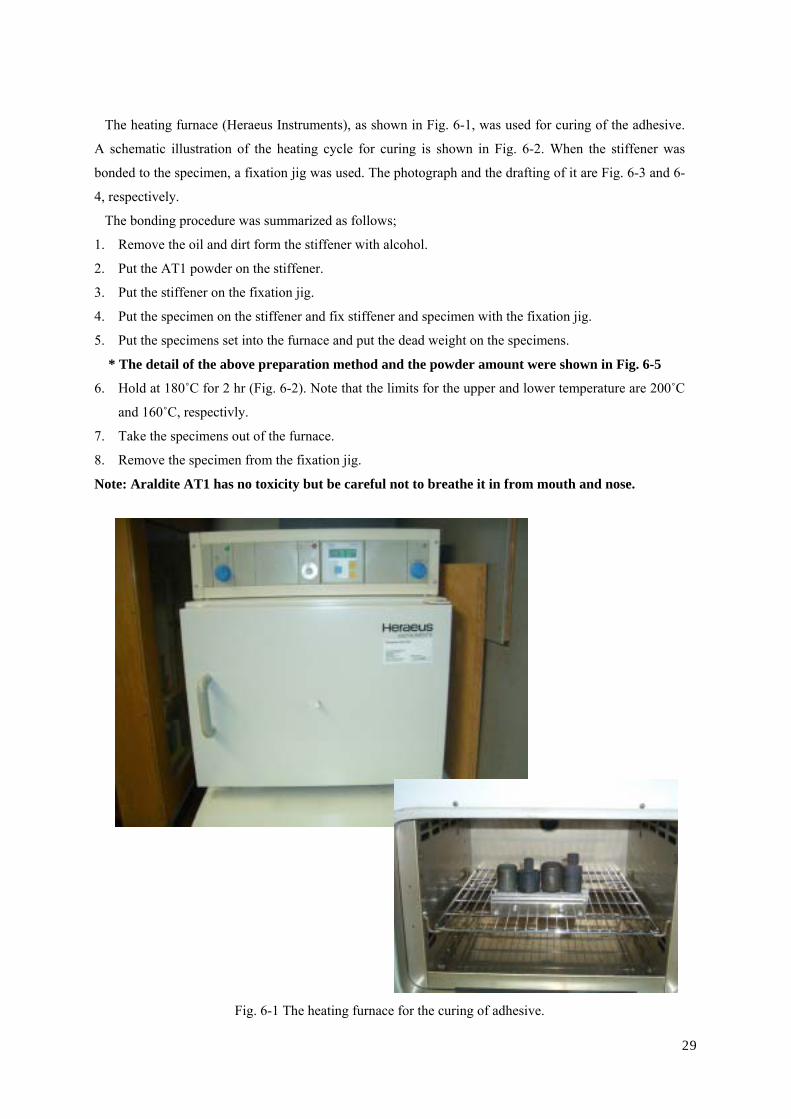
The heating furnace (Heraeus Instruments), as shown in Fig. 6-1, was used for curing of the adhesive.
A schematic illustration of the heating cycle for curing is shown in Fig. 6-2. When the stiffener was
bonded to the specimen, a fixation jig was used. The photograph and the drafting of it are Fig. 6-3 and 6-
4, respectively.
The bonding procedure was summarized as follows;
1. Remove the oil and dirt form the stiffener with alcohol.
2. Put the AT1 powder on the stiffener.
3. Put the stiffener on the fixation jig.
4. Put the specimen on the stiffener and fix stiffener and specimen with the fixation jig.
5. Put the specimens set into the furnace and put the dead weight on the specimens.
* The detail of the above preparation method and the powder amount were shown in Fig. 6-5
6. Hold at 180˚C for 2 hr (Fig. 6-2). Note that the limits for the upper and lower temperature are 200˚C
and 160˚C, respectivly.
7. Take the specimens out of the furnace.
8. Remove the specimen from the fixation jig.
Note: Araldite AT1 has no toxicity but be careful not to breathe it in from mouth and nose.
Fig. 6-1 The heating furnace for the curing of adhesive.
29
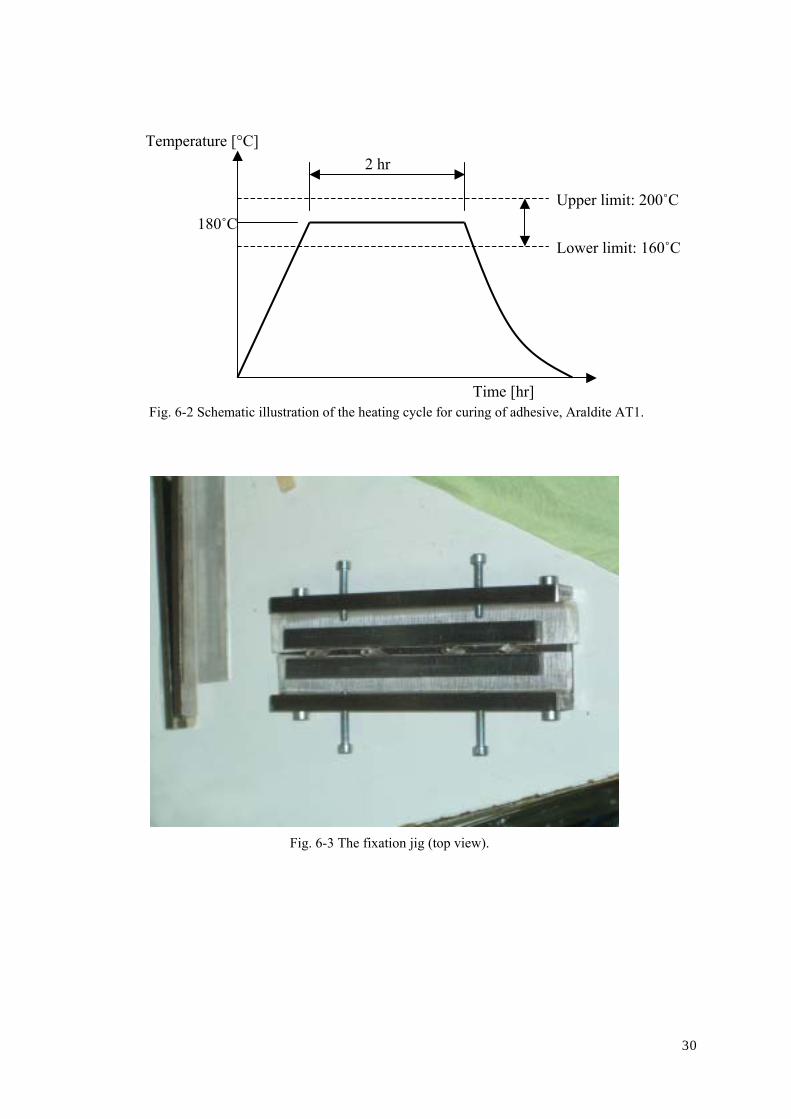
Temperature [°C]
Lower limit: 160˚C
Upper limit: 200˚C 180˚C
2 hr
Time [hr]
Fig. 6-2 Schematic illustration of the heating cycle for curing of adhesive, Araldite AT1.
Fig. 6-3 The fixation jig (top view).
30
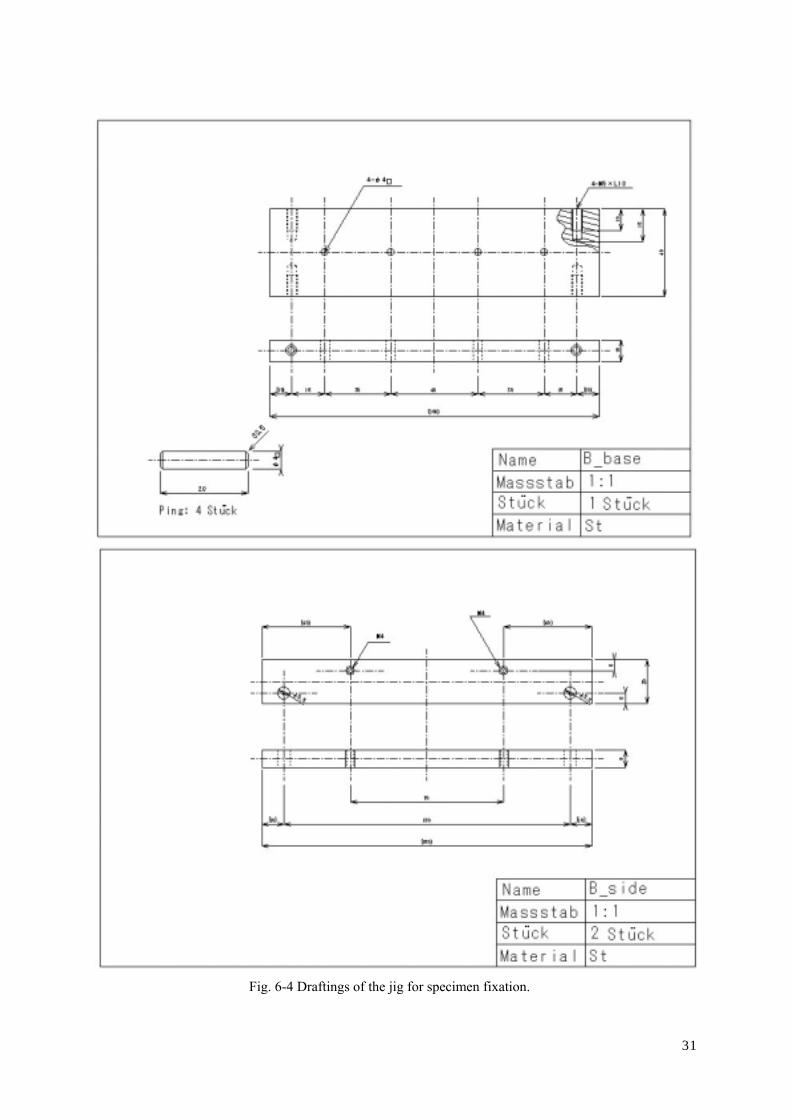
Fig. 6-4 Draftings of the jig for specimen fixation.
31

1. Put the powder on the edge of the stiffener (only one side).
2. Sprinkle powder uniformly.
3. The amount of the powder (a lot of the powder on the edge A )
4. Put the stiffeners on the fixation jig.
5. Put the specimen on the stiffener (Top coating side : Downward)
6. Fix the specimen with the screw, and set next specimen.
7. Over view after the preparation.
8. Put in the furnace put on the dead weight unscrew heating hold cooling
Edge A side
Edge A side
Edge A side
Distance betwee the stiffeners ≈ 5mm
Fig. 6-5 The preparation method of the bonding and the amount of the AT1 powder on the stiffeners.
32

6.2 Procedure of Four Point Bending Test
The creep testing machine, as shown in Fig. 6-5, was used in the present work to apply the bending
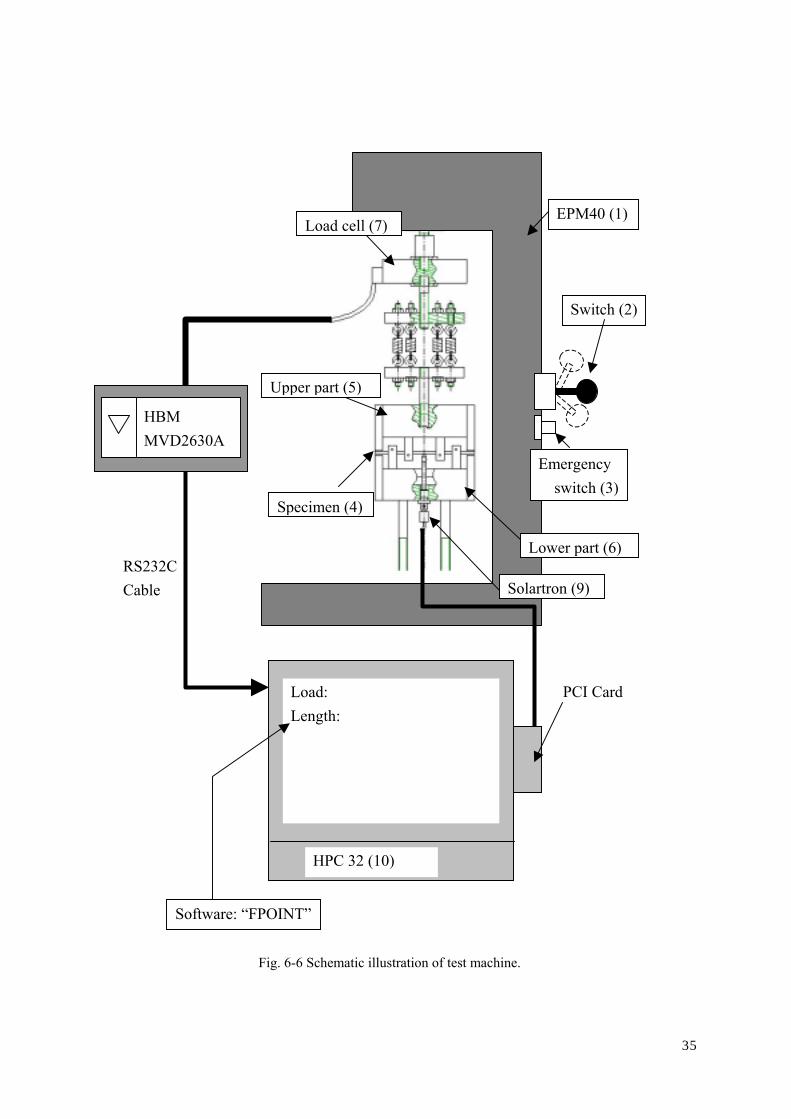
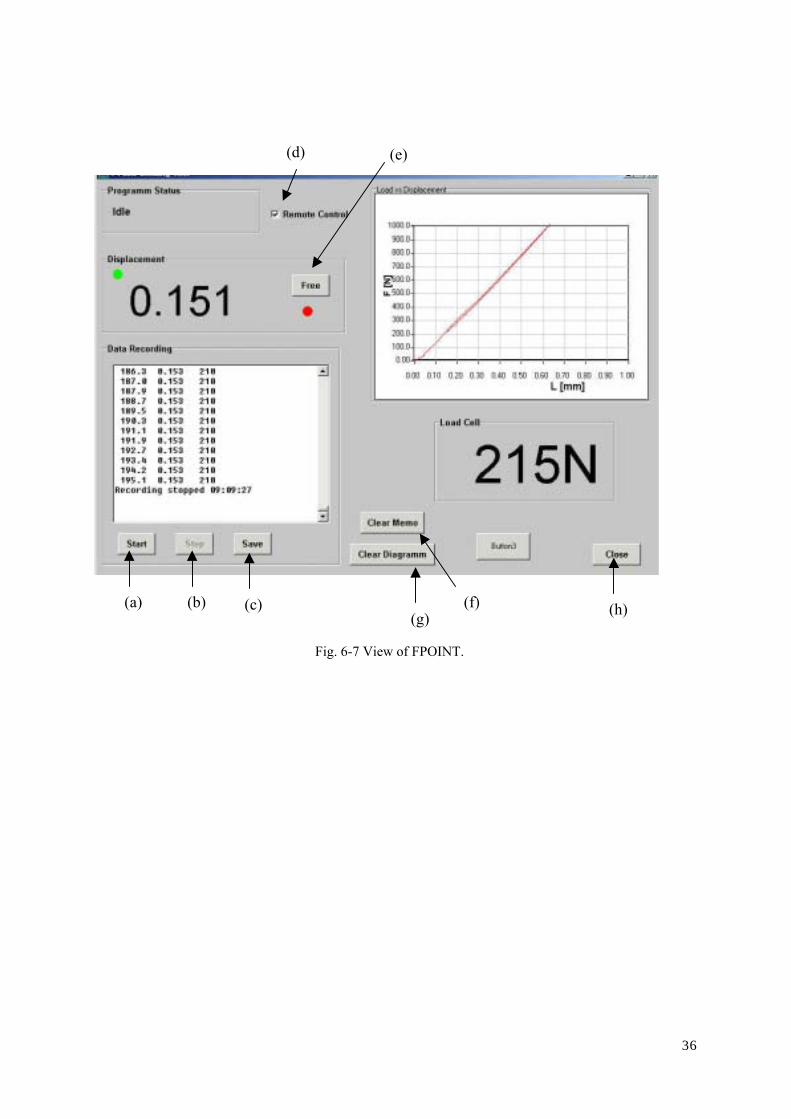
force. Fig. 6-6 and Fig. 6-7 show schematic illustration of the test system and the view of recording
software. The piston of the creep testing machine (Fig. 6-5) can be moved at a constant speed of 7
mm/min.. The load cell with a capacity of 20kN and a Solartron extensometer were used in the present
tests. The personal computer, HPC 32, was used for recoding the applied load and the deflection of the
specimen. The software, so called FPOINT, was programmed for recoding the data (FPOINT was
programmed by S. Linn).
The testing procedure (including usage of the recording software) was summarized as follows;
1. Set the upper parts of test rig (5)
2. Set the lower parts of test rig (6)
3. Warm up the Amplifier (8) (for 30 min.)
4. Adjust position by the lever switch (2)
Note: Down the lever Cylinder moves up (Compressive)
Up the lever Cylinder moves down (Tensile)
5. Insert specimen (4) (Note, Coating upwards)
6. Start software “FPOINT”
7. Set the extensometer (9), around 1 mm in displacement (indicator)
8. Click the button “Zero” (e) on the display to set zero displacement
9. Push “zero” button of the Load cell amplifier (8) to set zero load
10. Click the window of “Remote control” (d) (on the display)
11. Finally check the status of all the equipment
12. Click the button “Start” (a) to start recording
13. Apply the constant load, Turn up the lever (2)
Note: Emergency stop Push the button (3)
14. If the stiffness of the specimen is changed; turn the lever to neutral to stop testing
15. Click the button “Stop” (b) to stop recording
16. Click the button “Save” (c) to save the data
17. Remove the applied loading; Down the lever (2)
Note: Don’t move the piston too far prevent damage of the test rig
18. Remove the specimen from the test rig
19. Click the “Clean memo” (f) and “Clean diagram”(g) button.
20. Click the “Close” (h) button
21. Clear everything
22. Check the roller of bending equipment
33

Piston
Fig. 6-5 The creep testing machine, EPM 40.
34
Load: Length:
HPC 32 (10)
PCI Card
HBM MVD2630A
RS232C Cable
Software: “FPOINT”
Solartron (9)
Lower part (6)
Specimen (4)
Upper part (5)
Load cell (7)
Emergency switch (3)
Switch (2)
EPM40 (1)
Fig. 6-6 Schematic illustration of test machine.
35
(e) (d)
(h) (f) (g)
(c) (b) (a)
Fig. 6-7 View of FPOINT.
36
7. Establishment of bonding procedure and evaluation of infiltration depth of adhesive
By using dummy TBC specimens, the bonding conditions were confirmed and the infiltration depth of
adhesive into the top coat was also measured. The procedure of preparation and observation was as
follows:
i) The steel stiffener, with a size of 50 mm in length and 10 mm width and 4.2 mm in thickness, was
bonded to the ceramic coat of the 8YSZ air plasma sprayed on steel specimen, with a size of 50 mm
in length and 10 mm width and 5 mm in thickness, by means of above bonding procedures (see
Section 6.1).
ii) The bonded TBC/steel specimen was cut across the bonding interface and the cross section was
polished.
iii) The morphology of the bonding condition was observed by metal microscope and the depth of the
infiltration of the adhesive was measured by means of SEM (EDX analysis).
Typical optical photographs of the cross section of the bonded TBC/steel specimen are shown in Fig. 8-
1. In this figure, the thickness of the adhesive was approximately 0.1mm, which equals to
recommendation thickness of the adhesive. In addition, pores in the adhesive layer can be observed. The
pore ratio in the adhesive layer was almost 30% however this can be permitted because the bonding
strength of the adhesion is higher than delamination strength of the TBC.
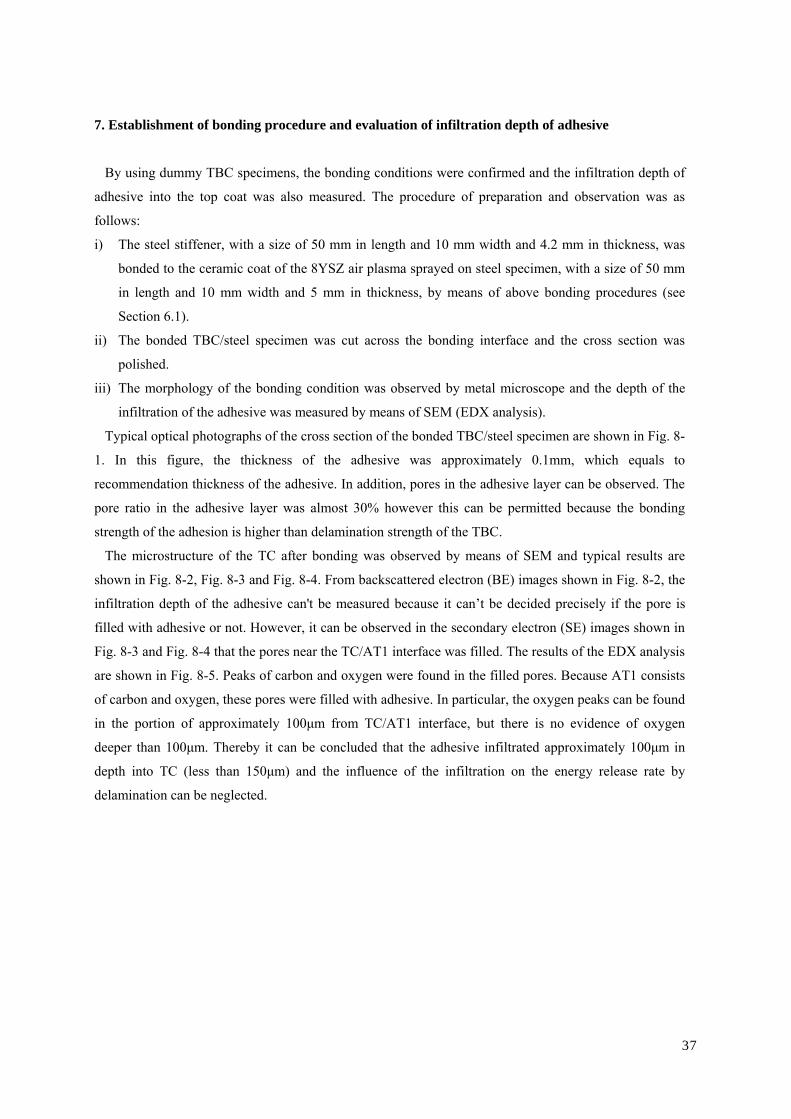
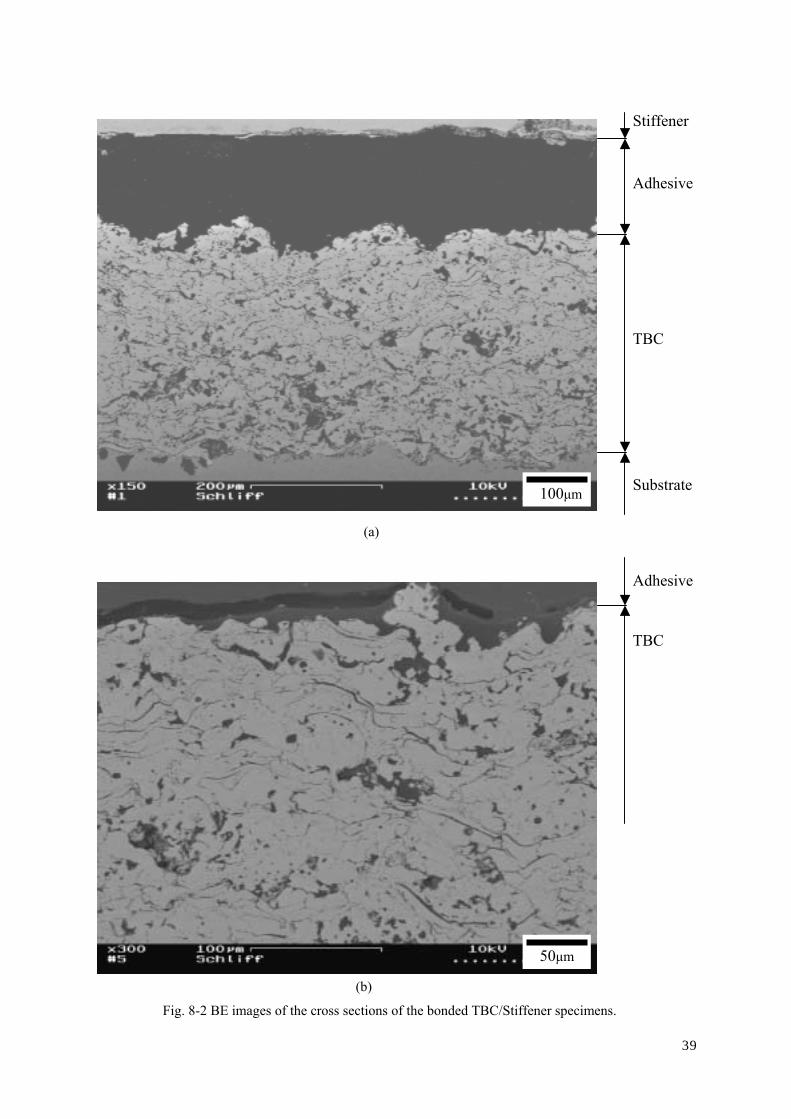
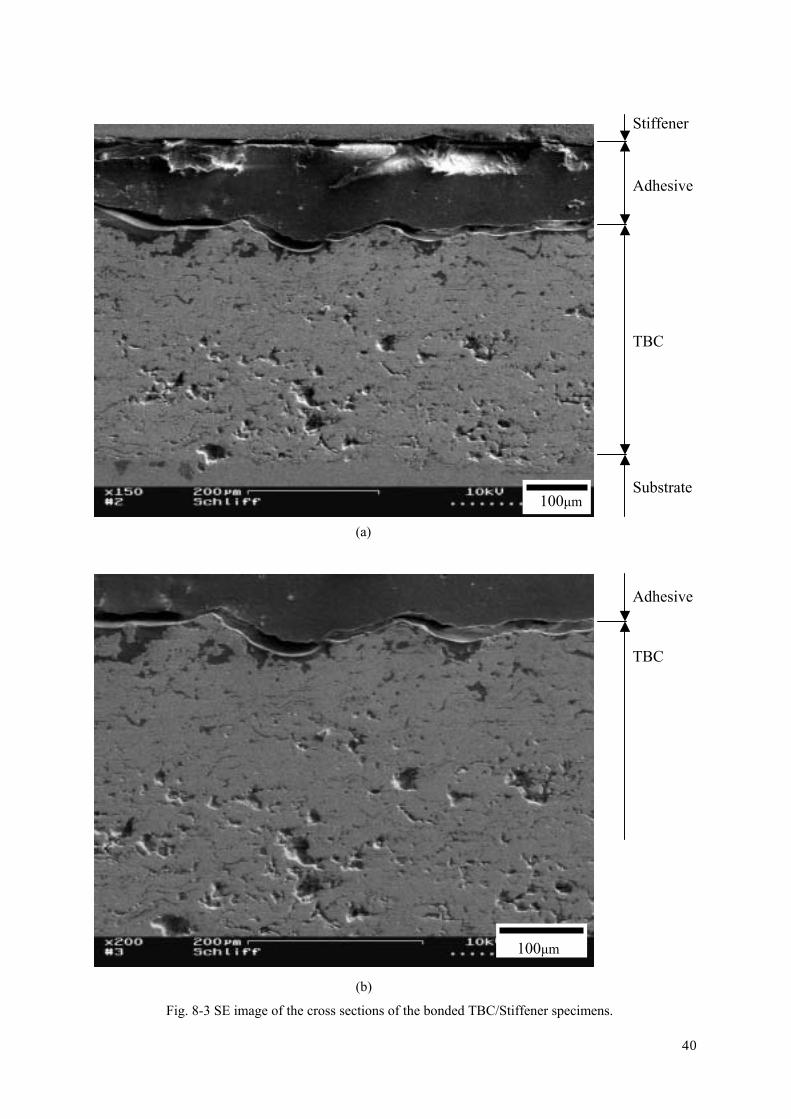
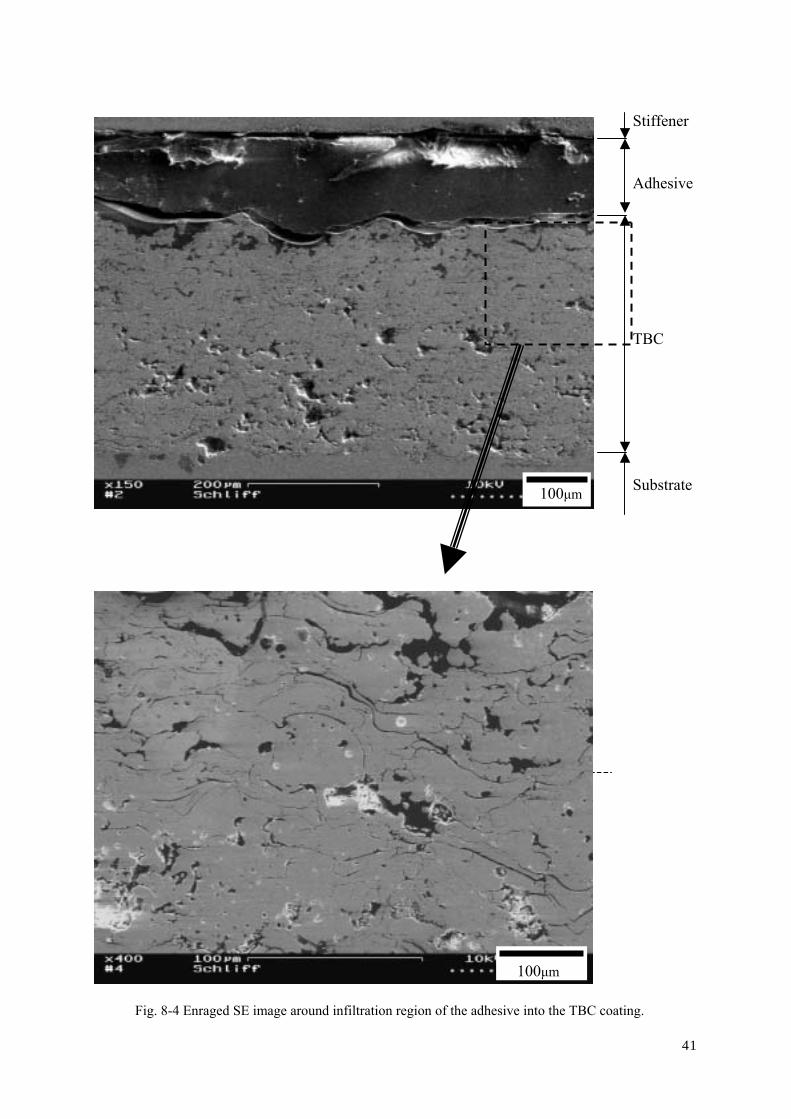
The microstructure of the TC after bonding was observed by means of SEM and typical results are
shown in Fig. 8-2, Fig. 8-3 and Fig. 8-4. From backscattered electron (BE) images shown in Fig. 8-2, the
infiltration depth of the adhesive can't be measured because it can’t be decided precisely if the pore is
filled with adhesive or not. However, it can be observed in the secondary electron (SE) images shown in
Fig. 8-3 and Fig. 8-4 that the pores near the TC/AT1 interface was filled. The results of the EDX analysis
are shown in Fig. 8-5. Peaks of carbon and oxygen were found in the filled pores. Because AT1 consists
of carbon and oxygen, these pores were filled with adhesive. In particular, the oxygen peaks can be found
in the portion of approximately 100µm from TC/AT1 interface, but there is no evidence of oxygen
deeper than 100µm. Thereby it can be concluded that the adhesive infiltrated approximately 100µm in
depth into TC (less than 150µm) and the influence of the infiltration on the energy release rate by
delamination can be neglected.
37

(a)
Adhesive
Adhesive Pore
Pore
Stiffener
Adhesive
TBC coating
Substrate
Stiffener
Adhesive
TBC coating
Substrate
(b)
Fig. 8-1 Microphotograph of the cross section of bonded TBC/Stiffener dummy specimens.
38
Stiffener
39
(a)
50µm
100µm
Adhesive
TBC
Substrate
Adhesive
TBC
(b)
Fig. 8-2 BE images of the cross sections of the bonded TBC/Stiffener specimens.
Stiffener
40
(a)
100µm
100µm
Adhesive
TBC
Substrate
Adhesive
TBC
(b)
Fig. 8-3 SE image of the cross sections of the bonded TBC/Stiffener specimens.
100µm
100µm Substrate
TBC
Adhesive
Stiffener
Fig. 8-4 Enraged SE image around infiltration region of the adhesive into the TBC coating.
41

(a) SE image
100µm
100µm
100µm
TBC
Adhesive 100µm
(b) Zr map
Fig. 8-5 EDX analysis results of the bonded TBC/Stiffener specimens.
42

43
(c) C map
100µm
100µm
100µm
100µm
(d) O map
Fig. 8-5 EDX analysis results of the bonded TBC/Stiffener specimens (continued).
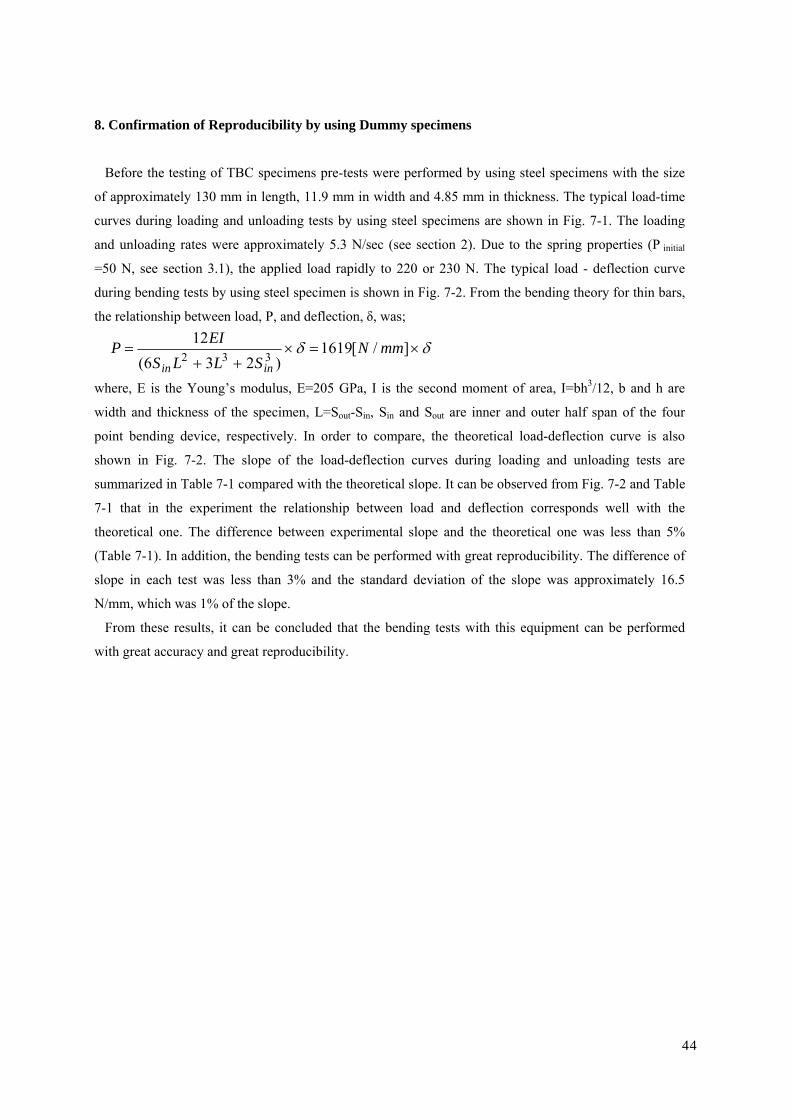
8. Confirmation of Reproducibility by using Dummy specimens
Before the testing of TBC specimens pre-tests were performed by using steel specimens with the size
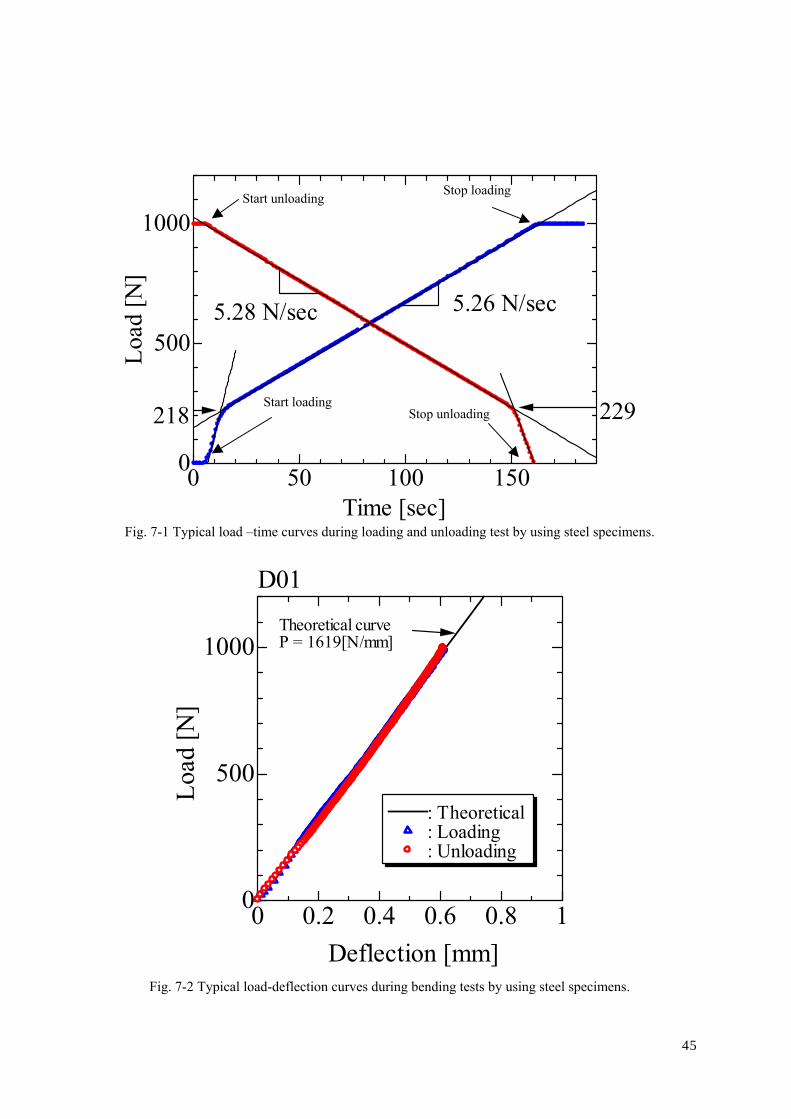
of approximately 130 mm in length, 11.9 mm in width and 4.85 mm in thickness. The typical load-time
curves during loading and unloading tests by using steel specimens are shown in Fig. 7-1. The loading
and unloading rates were approximately 5.3 N/sec (see section 2). Due to the spring properties (P initial
=50 N, see section 3.1), the applied load rapidly to 220 or 230 N. The typical load - deflection curve
during bending tests by using steel specimen is shown in Fig. 7-2. From the bending theory for thin bars,
the relationship between load, P, and deflection, δ, was;
δδ ×=×++
= ]/[1619)236(
12332
mmNSLLS
EIPinin
where, E is the Young’s modulus, E=205 GPa, I is the second moment of area, I=bh3/12, b and h are
width and thickness of the specimen, L=Sout-Sin, Sin and Sout are inner and outer half span of the four
point bending device, respectively. In order to compare, the theoretical load-deflection curve is also
shown in Fig. 7-2. The slope of the load-deflection curves during loading and unloading tests are
summarized in Table 7-1 compared with the theoretical slope. It can be observed from Fig. 7-2 and Table
7-1 that in the experiment the relationship between load and deflection corresponds well with the
theoretical one. The difference between experimental slope and the theoretical one was less than 5%
(Table 7-1). In addition, the bending tests can be performed with great reproducibility. The difference of
slope in each test was less than 3% and the standard deviation of the slope was approximately 16.5
N/mm, which was 1% of the slope.
From these results, it can be concluded that the bending tests with this equipment can be performed
with great accuracy and great reproducibility.
44
0 50 100 1500
500
1000
5.26 N/sec
Time [sec]
Load
[N]
5.28 N/sec
218 229Stop unloading
Stop loadingStart unloading
Start loading
Fig. 7-1 Typical load –time curves during loading and unloading test by using steel specimens.
45
0 0.2 0.4 0.6 0.8 10
500
1000
Deflection [mm]
Load
[N]
Theoretical curveP = 1619[N/mm] ×δ
: Theoretical: Loading: Unloading
D01
Fig. 7-2 Typical load-deflection curves during bending tests by using steel specimens.

Table 7-1 The slopes of the load-deflection curve in the dummy tests using steel specimen.
Slope of curve in the test[N/mm]
Error* [%] Specimen No.
Loading Unloading
Theoretical value of the
slope [N/mm] Loading Unloading
D01 1627 1664 1619 0.45 2.74
1 1665 1681 1619 2.83 3.79
2 1640 1673 1619 1.28 3.34
3 1664 1687 1619 2.75 4.19 D02
4 1646 1664 1619 1.68 2.79
1 1636 1645 1619 1.03 1.58
2 1643 1668 1619 1.46 3.01 D03
3 1628 1650 1619 0.56 1.89
D04 1667 1682 1619 2.94 3.87
D05 1670 1698 1619 3.12 4.84
Average 1649 1671 1619 1.81 3.82
Max. 1670 1698
Min. 1627 1645
Standard deviation 16.52 16.39
* Error = (experimental slope - theoretical slope) / theoretical slope×100
46

9. Results and Discussions
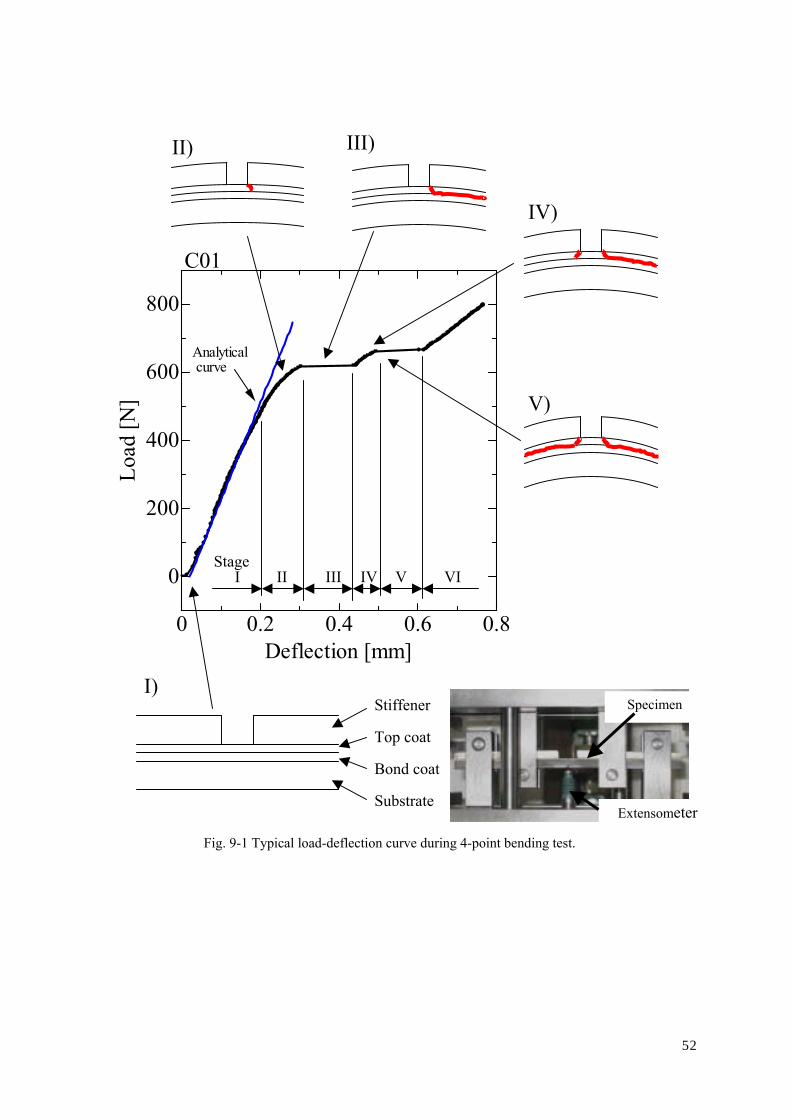
A typical load – deflection curve during the 4-point bending test is shown in Fig. 9-1. In this figure, the
analytical load – deflection curve which was calculated by Eq. 9-1 is also shown.
δ=PL/ (-L/3Ec,5I c,5+(Sout-D)2/ E c,5I c,5+(2SoutD-D2)/E c,3I c,3)/4 Eq. 9-1
where, E c,5 and E c,3 are the Young’s moduli without and with stiffener, I c,5 and I c,3 are the second
moments of area without and with stiffener, P is the Load, Sin and Sout are the inner and outer half span,
L= Sout - Sin , D is half of the distance between the stiffeners, respectively. In Fig. 9-1, the load –
deflection curve consists of 6 stages. At stage I, the load – deflection curve of the specimen was linear.
The experimental curve was equivalent to the analytical one. After the linear stage in the load –
deflection curve, at stage II, the slope of the load - deflection curve decreased with increasing deflection.
At stage IV the same behavior can be observed. The plateaus of the curve can be observed at stage III
and at stage V. At stage VI, the deflection increased again in proportion to the load.
Photographs of delamination crack initiation and propagation during the test are shown in Fig. 9-2. For
the shown specimen (C01), the crack initiated from the edge of the right side stiffener and propagated
through the TC to the TC/BC interface. After the vertical crack propagated to the TC/BC interface, the
crack propagated along the TC/BC interface, in other words, the delamination occurred. At left side, the
same crack initiation and propagation process was observed. Note that the delamination didn't always
occur on right side first, sometimes it occurred first on left side, or on both sides simultaneously. In other
words, the delamination from either side occurred at random. These delamination processes correlated
with each stage are also shown in Fig. 9-1 schematically. At stage II and stage IV, the vertical cracks
were initiated at edge of stiffener and propagated through the TC to the TC/BC interface. In response to
that, the deformation resistance of the specimen decreased. At stage III and stage V, the delamination
crack propagated rapidly until the crack tip approached the inner loading lines. Accordingly, the plateaus
of the curve were observed in the load – deflection curve. The energy release rate for delamination was
calculated from the critical load value corresponding to these plateaus.
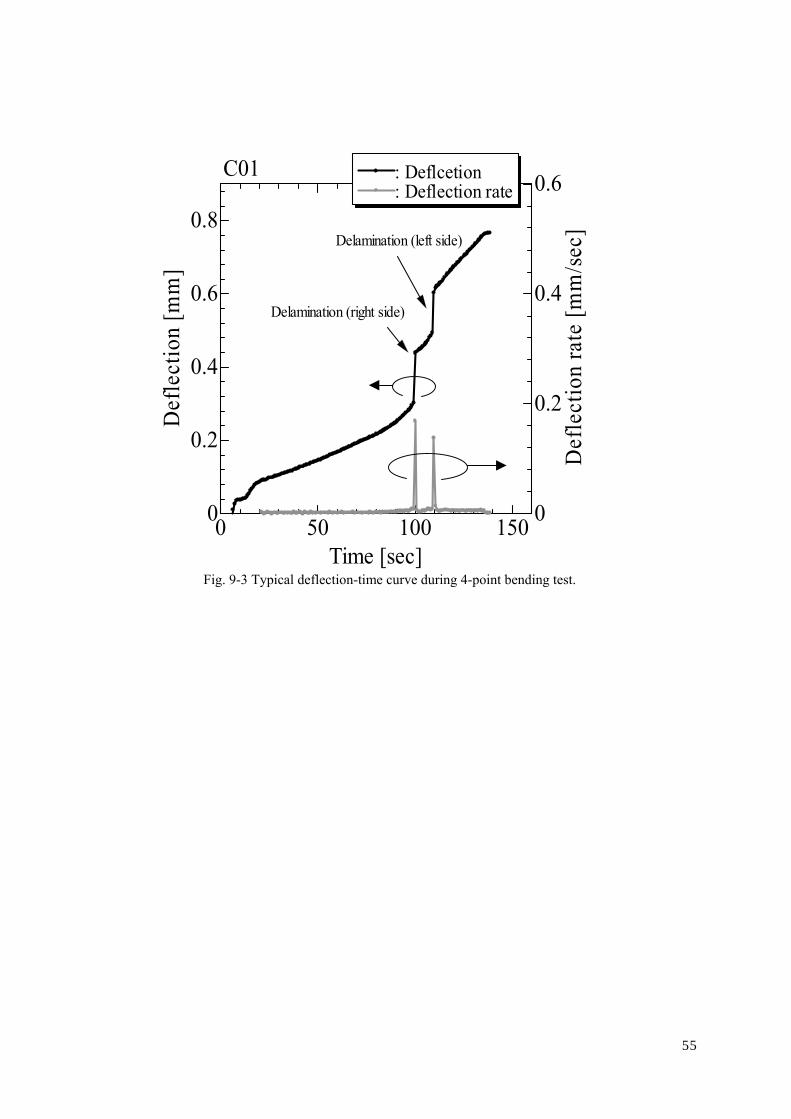
A typical deflection – time curve is shown in Fig. 9-3. The deflection rate of the specimen (in other
words, the slope of the deflection – time curve) is also shown in Fig. 9-3. The peak deflection rate may
correspond to the delamination crack growth rate. The influence of thermal aging on the deflection rate
will be discussed later (Sec. 9-5).
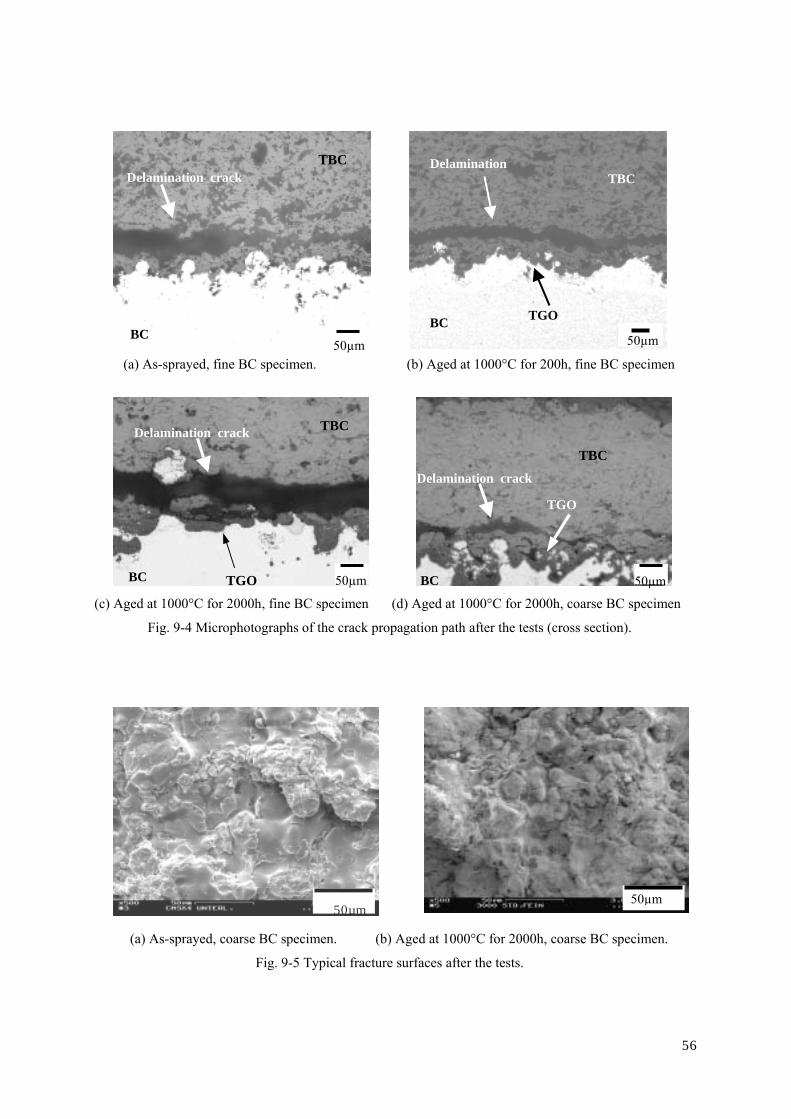
Typical microphotographs of crack propagation path after the test are shown in Fig. 9-4. It is revealed
from Fig. 9-4(a) that the crack mainly propagated in the TC for the as-sprayed specimen. On the other
hand, after the thermal aging for 2000h, the crack propagated partially at the TC/BC interface as shown
in Fig. 9-4(c) and (d). It can be also observed from these figures that the TGO grew at the TC/BC
interface after the thermal. In the 200h and 1000h aged specimens, as shown in Fig. 9-4(b), although the
TGO also grew at the TC/BC interface, the crack however mainly propagated in the TC. Typical fracture
surfaces for the as-sprayed and the aged specimens are represented in Fig. 9-5. The fracture surface of the
47

as-sprayed specimen exhibits mainly inter-splats fracture mode, on the other hand, the aged specimen
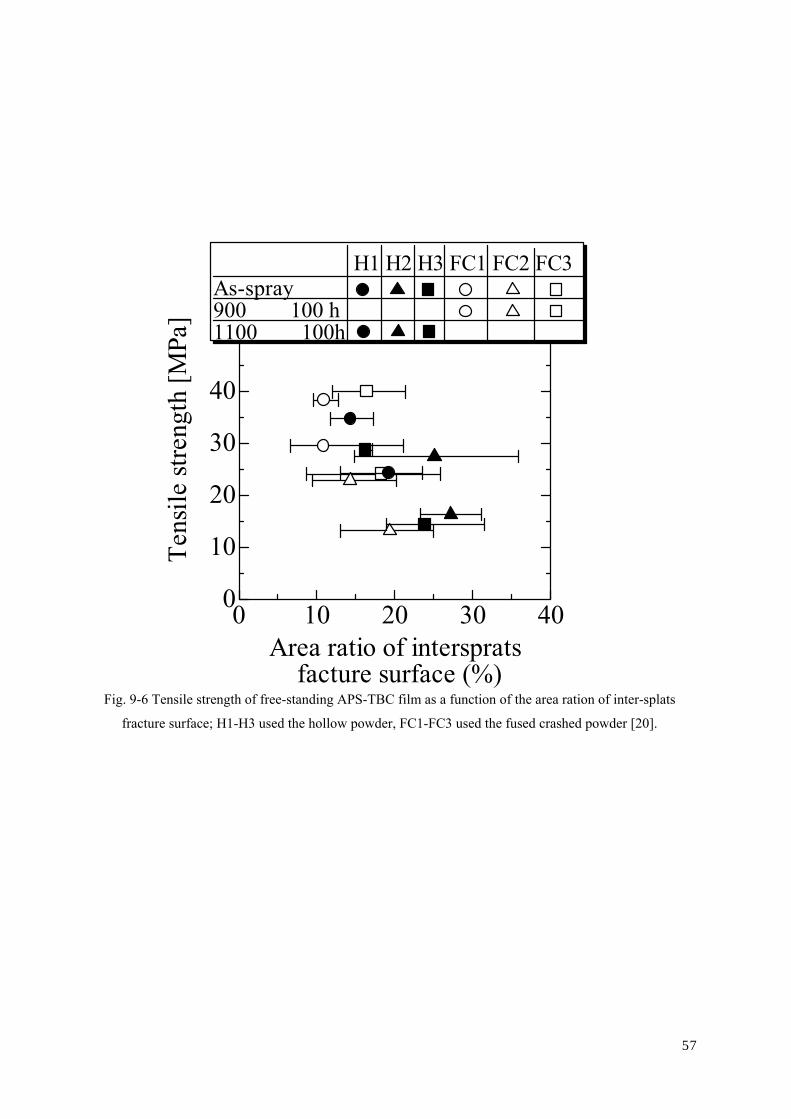
takes the mixed mode of transgranular and inter-splats fractures. The relationship between the fracture
strength and the inter-splats fracture of the free-standing APS-TBC film was reported in Ref. 18. Fig. 9-6
represents the tensile strength of the free-standing APS-TBC film as a function of the area ratio of the
inter-splats fracture surface [20]. From Fig. 9-6 the tensile strength increased with decreased inter-splats
fracture mode. These results indicate that the inter-splats strength of TBC was increased by the sintering.
It can be also considered in this work that the TC sintered during the thermal aging. The crack path in the
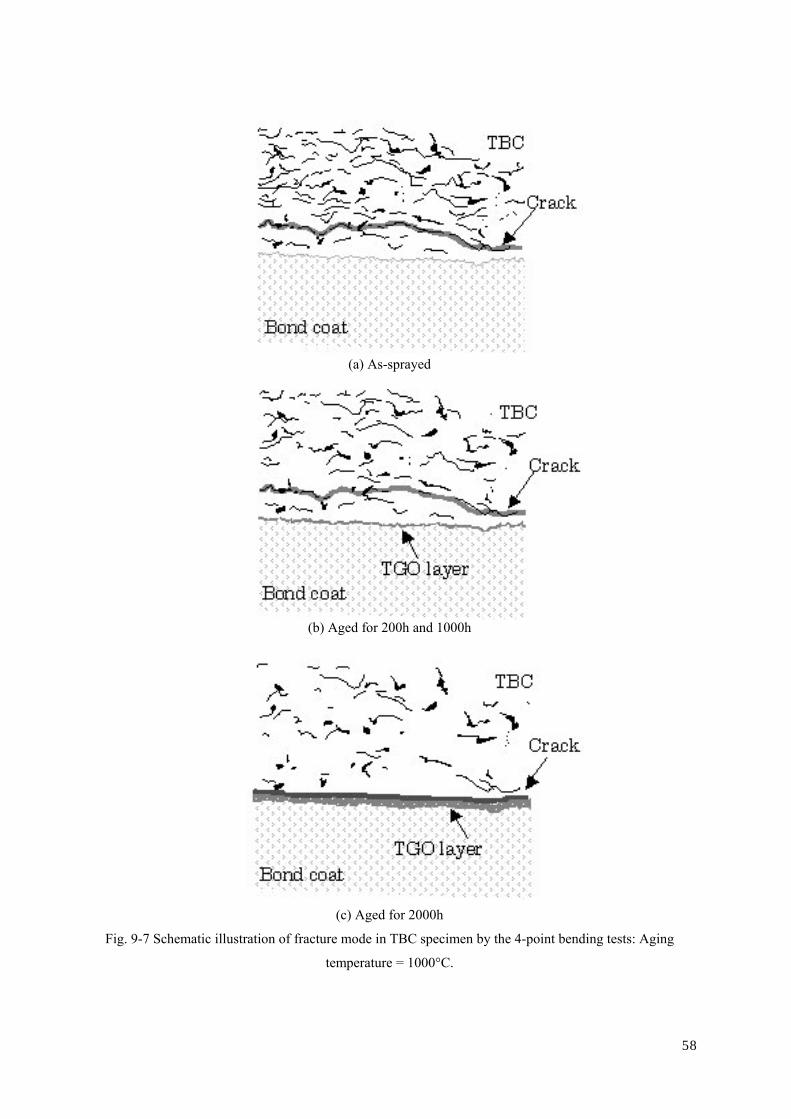
specimen by the four-point bending test is summarized in Fig. 9-7 schematically. For the as-spray
condition, because the TC has lower fracture strength compared with the TC/BC interfacial strength, the
crack mainly propagated in the TC. After aging at 1000˚C for 2000h, the fracture strength of the TC
became high by the sintering. On the other hand, the TC/BC interfacial strength decreased with the aging
time due to the TGO nucleation and growth. Therefore the crack propagated partially at the TC/BC
interface. The crack mainly propagated in the TC after the thermal aging for 200h and 1000h because the
TC/BC interface maintained high strength in comparison with the TC.
The results in present work are summarized in Table 9-1. The details of experimental results are as
follows.
48
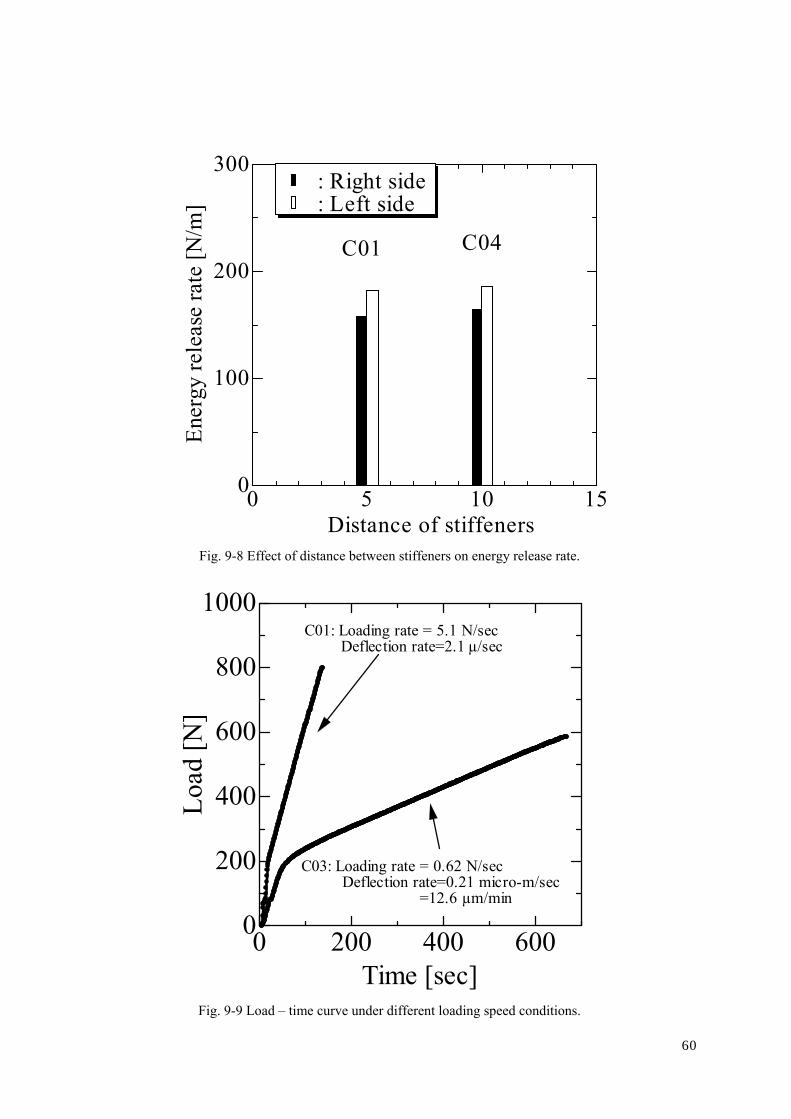
9. 1 Effect of the distance between the stiffeners
In this work, the effect of the distance between the stiffeners on the energy release rate was also
checked. The results in which the distance was 10 mm are shown in Fig. 9-8 compared with those where
the distance was 5 mm. From this figure, the distance between the stiffeners was not significant for the
evaluation of the energy release rate in TBC specimen.
9. 2 Effect of loading speed
In order to study the effect of the loading rate on the energy release rate, the bending tests were also
performed under slow loading speed. Fig, 9-9 shows a typical load – time curve of a slow test compared
with a normal speed. The loading speed of a slow test (approximately 0.6 N/sec ) was ten times lower
than that of a normal test (approximately 5 N/m). Fig. 9-10 shows the typical deflection – time curve of a
slow test compared with a normal test. The deflection speed of the slow test was approximately 0.2 µm/s
(13 µm/min) except for the delamination stage.
The average energy release rate as a function of the loading speed (also deflection speed) is shown in
Fig. 9-11. In this figure, the scatter of the energy release rate is also shown by an error bar. In this figure,
the average energy release rates of slow tests were almost equivalent to those of normal tests, the data of
the slow test was within the scatter band of the normal test data. Therefore, there is no significant
influence of the loading speed on the delamination resistance in this work.
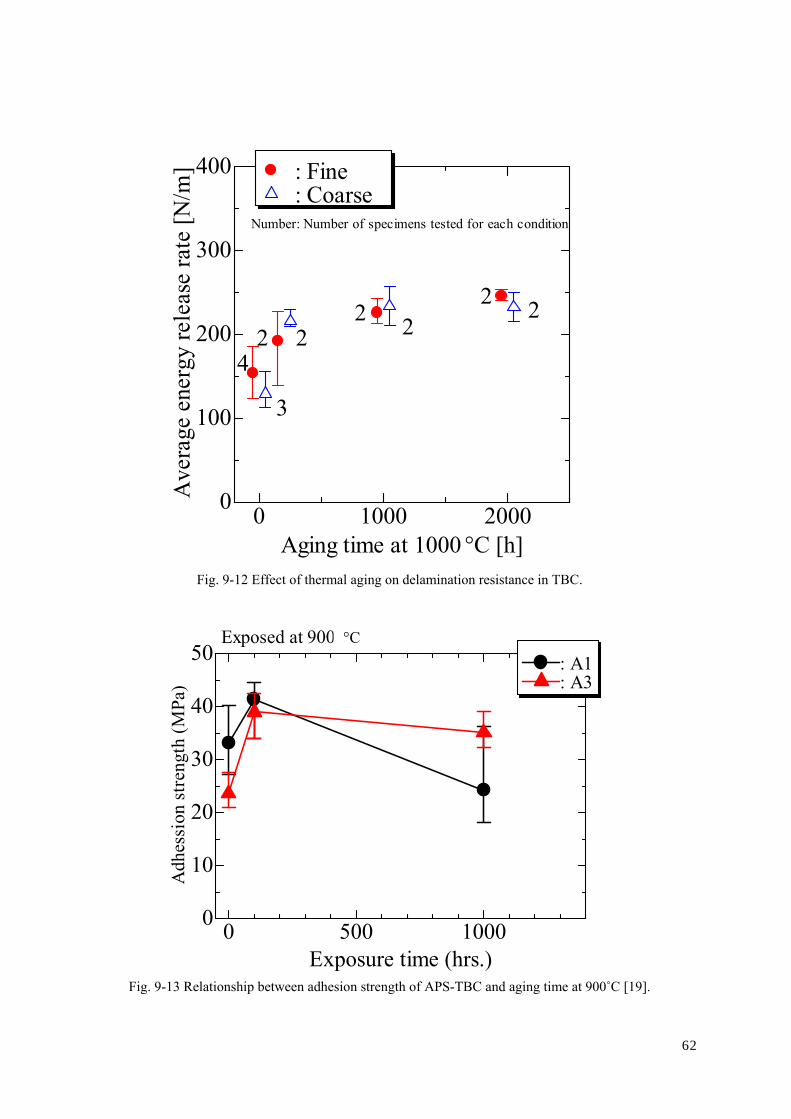
9. 3 Effect of thermal aging
The average energy release rate as a function of aging time (at 1000˚C) was shown in Fig. 9-12. In this
figure, the average energy release rate was indicated by each dot together with the scatter of the energy
release rate. The number close to the scatter bar indicates the number of specimens tested for each
condition, respectively. From Fig. 9-12, the average energy release rate increased with increasing aging
time at 1000˚C, for both fine and coarse BC specimens. On the other hand, the scatter of the energy
release rates decreased with increasing aging time.
Fig. 9-13 shows the adhesion strength of an APS-TBC determined by means of tensile tests as a
function of aging time at 900˚C [19]. These tests were performed in the "Subcommittee on Superalloys
and Coatings" in the Society of Materials Science, Japan (JSMS). The difference of the A1 and A3
specimens was the flying particle velocity of YSZ powder in APS. Each symbol indicates the mean value
of the adhesive strength determined by using 5 – 10 specimens. Comparing Fig. 9-12 with Fig. 9-13, the
trend of both results was equal, i.e. the delamination resistance increased with increasing aging time.
Fig. 9-14 shows the tensile strength and Young’s modulus of the TBC film itself as a function of the
aging time at 900°C [20]. Both tensile strength and Young’s modulus of the TBC film itself increased
with increasing aging time. It can be considered that the following mechanisms cause these phenomena
of the TBC film. The as-sprayed APS-TBC has an unstable microstructure compared to the bulk YSZ
materials, which was fabricated by HIP or another process. Therefore there is a possibility that the
49

strength of the APS-TBC can be changed by thermal aging at lower temperatures compared of the bulk
YSZ. However there is no evidence, therefore further investigation must be performed.
The fracture toughness KIc of the TBC film itself and also GIc, which was calculated from KIc, are
shown in Fig. 9-15 [21]. Comparing Fig. 9-15 with Fig. 9-12 the GIC of TBC film itself was almost
equivalent to the average energy release rate in this work for as-spray specimen. In addition, the
influence of aging time of GIC of TBC film itself was similar to results in this work.
From the above discussion, the effect of the thermal aging on the energy release rate is summarized in
Fig. 9-16 schematically. In as-sprayed TBC specimen, the TC/BC interface has the higher strength
compared with the TC. The fracture strength of the TC increases with the thermal aging by the sintering,
on the other hand, the TC/BC interfacial strength decreases due to TGO growth. When the thermal aging
time becomes longer than the critical certain time, the TC/BC interfacial strength becomes lower than the
fracture strength of the TC. The energy release rate Gc evaluated by the four-point bending test is
correlated with the fracture strength of the weakest parts of the TBC specimen. Therefore it increases
with the thermal aging time until the critical time. In addition, it is easily expected that the Gc decreases
with the thermal aging after the critical aging time. The critical aging time in this TBCs is approximately
2000h. The thermal aging for 10000h is now being applied to TBC specimens, which will be presented
elsewhere.
The Young’s modulus of the TC may also be changed during thermal aging in this work. However, it
was revealed from analytical work (Sec. 5.3 a)) that the influence of the Young’s modulus of TC on the
energy release rate is negligible even if it is changed during thermal aging.
9. 4 Effect of TC/BC interface roughness on the delamination resistance
Comparing the energy release rate of fine and coarse BC specimens in Fig. 9-12, the influence of the
TC/BC interface roughness on delamination resistance wasn’t significant.
9. 5 Propagation rate of delamination crack
Fig. 9-17 shows the relationship between the peak deflection rate (i.e. crack growth rate) and the aging
time. In this figure, the scatter of the peak deflection rate was also shown by an error bar. From Fig. 9-7
the peak deflection rate, i.e. delamination crack growth rate, increased with increasing aging time. During
the 4-point bending test, different behaviors of crack initiation and propagation were observed. Since this
observation, it was also seen that the delamination crack growth rate for as-sprayed specimens was much
lower than that for aged specimens, for both of fine and coarse bond coat specimens.
The mechanism of this phenomenon was not clear. However, following possibilities can be considered.
1. The delamination of aged specimen occurred at higher critical load compared with as-spray
specimen. Therefore the higher load may induce the higher crack propagation rate.
2. If the connection of splats for as-spray TBC was looser than that for aged TBC, the crack
propagation may be disturbed by the shielding effects produced by micro-crack nucleation near
the delamination crack-tip.
50

However, there is no evidence for above consideration, therefore further investigations, such as
metallurgical ones, must be performed.
51
III) II)
0 0.2 0.4 0.6 0.8
0
200
400
600
800
Deflection [mm]
Load
[N]
C01
Analytical curve
VIVIVIIIII IStage
Extensometer
Specimen
V)
IV)
Top coat
Bond coat
Substrate
Stiffener I)
Fig. 9-1 Typical load-deflection curve during 4-point bending test.
52

Extensometer
Specimen
(a) before test: Corresponding to i) in Fig. 9-1
(b) Delamination crack initiated and propagated (right side only) : Corresponding to iii) in Fig. 9-1
Fig. 9-2 Initiation and propagation morphologies of delamination crack during test (continued).
53

(c) Delamination crack initiated and propagated (other side) : Corresponding to v) in Fig. 9-1
(d) Aspect of delamination
Fig. 9-2 Initiation and propagation morphologies of delamination crack during test.
54
0 50 100 1500
0.2
0.4
0.6
0.8
0
0.2
0.4
0.6
Time [sec]
Def
lect
ion
[mm
]C01
Delamination (right side)
Delamination (left side)
Def
lect
ion
rate
[mm
/sec
]
: Deflcetion: Deflection rate
Fig. 9-3 Typical deflection-time curve during 4-point bending test.
55
50µmBC
TBC Delamination crack
TGO
Delamination TBC
BC50µm
(a) As-sprayed, fine BC specimen. (b) Aged at 1000°C for 200h, fine BC specimen
TGO 50µmBC
TBC Delamination crack
TGO
50µmBC
TBC Delamination crack
(c) Aged at 1000°C for 2000h, fine BC specimen (d) Aged at 1000°C for 2000h, coarse BC specimen
Fig. 9-4 Microphotographs of the crack propagation path after the tests (cross section).
50µm 50µm
(a) As-sprayed, coarse BC specimen. (b) Aged at 1000°C for 2000h, coarse BC specimen.
Fig. 9-5 Typical fracture surfaces after the tests.
56
0 10 20 30 400
10
20
30
40
Area ratio of intersprats facture surface (%)
Tens
ile st
reng
th [M
Pa]
As-spray900℃×100 h1100℃×100h
H1 H2 H3 FC1 FC2 FC3
Fig. 9-6 Tensile strength of free-standing APS-TBC film as a function of the area ration of inter-splats
fracture surface; H1-H3 used the hollow powder, FC1-FC3 used the fused crashed powder [20].
57
(a) As-sprayed
(b) Aged for 200h and 1000h
(c) Aged for 2000h
Fig. 9-7 Schematic illustration of fracture mode in TBC specimen by the 4-point bending tests: Aging
temperature = 1000°C.
58

Table 9-1 Summary of 4-point bending test .
(a) Fine BC specimen
Aging TGO Gc P dL/dt max notestime thickness [N/m] [N] [μm/sec][h] [μm]
Right 0 0 158,8 621 168,8Left 0 0 182,7 666 138,8Right 0 0 ErrorLeft 0 0 125,5 552 43,8Right 0 0 134,3 571 lower rateLeft 0 0 123,2 547 lower rateRight 0 0 165,0 633 107,5 DS=10mmLeft 0 0 185,4 671 87,5 DS=10mmRight 200 3 201,6 701 124,4Left 200 3 201,6 701 124,4Right 200 3 139,4 583 38,8Left 200 3 227,0 744 200,0Right 1000 5 242,5 770 217,5Left 1000 5 233,8 756 201,3Right 1000 5 213,2 722 116,3Left 1000 5 214,4 724 77,5Right 2000 7 240,0 767 128,1Left 2000 7 240,0 767 128,1Right 2000 7 253,9 789 196,3Left 2000 7 250,7 784 124,4
DS: Distance between stiffeners
C09
TP Side
C01
C02
C03
C04
C05
C06
C10
C07
C08
(b) Coarse BC specimen
Aging time TGO Gc P dL/dt max notes[h] thickness [N/m] [N] [μm/sec]
[μm]Right 200 3 230,0 746 50,8Left 200 3 214,2 720 148,8Right 200 3 209,5 712 156,3Left 200 3 209,5 712 156,3Right 1000 5 210,7 715 173,8Left 1000 5 ErrorRight 1000 5 256,5 789 176,3Left 1000 5 ErrorRight 2000 7 215,4 724 161,3Left 2000 7 217,2 727 122,0Right 2000 7 249,4 779 207,5Left 2000 7 248,1 777 223,8Right 0 0 122,8 544 96,3Left 0 0 ErrorRight 0 0 132,4 565 65,0Left 0 0 155,9 613 66,3Right 0 0 112,6 521 lower rateLeft 0 0 121,4 541 lower rate
C19
C20
C15
C16
C17
C18
C12
C13
C14
TP Side
59
0 5 10 150
100
200
300
C01 C04
Ener
gy re
leas
e ra
te [N
/m]
Distance of stiffeners
: Right side: Left side
Fig. 9-8 Effect of distance between stiffeners on energy release rate.
0 200 400 6000
200
400
600
800
1000
Time [sec]
Load
[N]
C01: Loading rate = 5.1 N/sec Deflection rate=2.1 µ/sec
C03: Loading rate = 0.62 N/sec Deflection rate=0.21 micro-m/sec =12.6 µm/min
Fig. 9-9 Load – time curve under different loading speed conditions.
60

200 400 600
0.2
0.4
0.6
0.8
1
0
Delamination
Time [sec]
Def
lect
ion
[mm
]C01: Loading rate = 5.1 N/sec
2.1 µm/sec
C03: Loading rate = 0.62 N/sec
0.21 micro-m/sec =12.6 µm/min
Fig, 9-10 Deflection – time curve under different loading speed conditions
100 1010
100
200
300
Loading rate [N/s]Ave
rage
ene
rgy
rele
ase
rate
[N/m
]
: Fine: Coarse
10-4 10-3
Deflection rate [mm/s]
Fig. 9-11 Effect of loading speed on the energy release rate of TBC specimen.
61
0 1000 20000
100
200
300
400
Aging time at 1000 °C [h]
Ave
rage
ene
rgy
rele
ase
rate
[N/m
] : Fine: Coarse
4
3
2 22 2
2 2
Number: Number of specimens tested for each condition
Fig. 9-12 Effect of thermal aging on delamination resistance in TBC.
62
0 500 10000
10
20
30
40
50
Exposure time (hrs.)
Exposed at 900℃
Adh
essi
on st
reng
th (M
Pa)
: A1: A3
°C
Fig. 9-13 Relationship between adhesion strength of APS-TBC and aging time at 900˚C [19].

0 500 10000
1
2
Exposure time (hrs.)
Exposed at 900℃
Tnsi
le st
reng
th n
orm
aliz
edby
σB,
A1,
As-
spra
y
: A1: A3
0 500 10000
1
2
3
4
Exposure time (hrs.)
Exposed at 900℃
Yon
g's m
odul
us n
orm
aliz
edby
E, A
1, A
s-sp
ray(
R.T.
)
: A1: A3
°C °C
(a) tensile strength (b) Young’s modulus
Fig. 9-14 Tensile strength and Young’s modulus of TBC film itself correlated with aging time [20].
0 100 200 300 400 50001
0
100
200
Aging time at 1316 °C [h]Frac
ture
Tou
ghne
ss, K
Ic [M
Pa m
1/2 ]
GIc
=KIc
2 /E [N
/m]
2
3
Fig. 9-15 Fracture toughness as a function of aging time for APS-8YSZ film itself at 1316°C in air [21];
by means of bending test of single-edge-precracked-beam specimen.
63

3000
1000 2000 4000 50000Aging time at 1000℃ [h]
Ener
gy re
leas
e ra
te [N
/m]
Interfacial strength of TBC system
Fracture strength of TBC film
: Fine BC specimen : Coarse BC specimen : Energy release rate
by 4-point bending tests
Fig. 16 Schematic illustration of the energy release rate of the TBC specimen evaluated by the 4-point
bending tests.
0 1000 20000
0.1
0.2
0.3
Aging time at 1000°C [h]
Peak
def
lect
ion
rate
[mm
/sec
]
: Fine: Coarse
3
3
22
2 22
2
Number: Number of specimens tested for each condition
Fig. 9-17 Effect of thermal aging on peak deflection rate.
64
10. Summary and Conclusions
In this study, the evaluation of the delamination resistance in TBC systems was carried out by means of
four point bending tests. The effects of thermal aging and top-coat/bond-coat interface roughness on the
delamination resistance were also discussed. The following conclusions were made:
1. The 4 – point test rig was designed and manufactured. The 4–point bending tests by using this
equipment can be performed with great accuracy and great reproducibility.
2. The heat curing type epoxy adhesive, Araldite AT1, was selected and used for bonding the
stiffener on the top coating. From SEM and EDX analyses, the adhesive infiltrated approximately
100µm in depth into top coat and there is no significant influence of the infiltration on the energy
release rate by delamination.
3. The equation of estimating energy release rate was modified and extended for TBC systems.
From analytical considerations, the effect of the Young’s modulus of the top coating on the
energy release rate is negligible even if it was changed during thermal aging.
4. The energy release rate Gc, which was estimated by the four-point bending tests, was independent
with the loading rate and the top-coat/bond-coat interface roughness
5. The energy release rates estimated under slow loading condition were almost equivalent to those
under higher loading conditions. Therefore, the energy release rate of TBC specimen was
independent of the loading rate.
6. Comparing energy release rates in between fine and coarse bond coating specimens, the effect of
top-coat/bond-coat interface roughness wasn’t significant on the delamination resistance.
7. The crack mainly propagated in the top coating for as-spray condition, however the crack
propagated partially at the top-coat/bond-coat interface after the thermal aging for 2000h.
8. The Gc was correlated with fracture strength of weakest parts of the TBC specimen. The Gc
increases with the thermal aging until the critical time due to the sintering of the top-coating. It
can be expected that the Gc decreases with the thermal aging after the critical aging time because
the top-coat/bond-coat interfacial strength decreases by the TGO growth. The critical aging time
in the present work is approximately 2000h.
9. The delamination crack growth rate increased with increasing aging time.
Future work
Following articles must be investigated in near future.
(a) Effect of thermal cycle on delamination resistance
In this work, the delamination resistance increased with increasing iso-thermal aging time because of
the increasing fracture resistance of TBC film itself. However it can be considered that the thermal cycle
induce the micro delamination crack near the interface due to thermal stress cycle. Therefore the
delamination resistance may be reduced by thermal cycle.
65
(b) Effect of test temperature on the delamination resistance
The influence of the test temperature on the delamination resistance must be investigated because TBC
systems undergo thermal cycle between room temperature and elevated temperature (up to 900°C). If the
delamination resistance is estimated by modified Charallambides four-point bending test, the adhesive
that is applicable at elevated temperature is necessary. Other bonding methods, such as brazing, must be
used because usual adhesives can't be applied at elevated temperature. Even if the stiffener is bonded by
braze, the test results may be affected by residual stress because the brazing temperature must be higher
than test temperature. Therefore other test methods may be necessary.
(c) Effect of loading mode on delamination resistance
Mode I loading is dominant near the delamination crack tip in the tensile test. In modified
Charallambides four-point bending test (present study), the stress condition near the delamination crack
tip is mixed mode of I and II, but Mode I may be dominant because the stiffing layer is thick enough
(FEM analysis is necessary). On the other hand, the Mode II stress condition, which is produced by
thermal stress due to the mismatch of the thermal expansion coefficient, may be dominant in the actual
turbine brad and vane. Therefore the effect of loading mode on the delamination resistance must be
investigated. A modified or a new test method may be necessary.
Acknowledgements
The author is grateful to Prof. Dr.–Ing. C. Berger, Dr.–Ing. A. Scholz, Mr. A. Schmidt and Mr. S. Linn
of Institute of Materials Technology, Darmstadt University of Technology. The author is also grateful to
helpful discussions with Prof. Dr. –Ing. H. W. Grünling and Dr.-Ing. W. Stamm. The author gratefully
thanks all of the staff of the department of high temperature material and all of the staff in the work shop
of the Institute of Materials Technology, Darmstadt University of Technology.
References
1. Bernstein, H. L., Grant, T. S., McClung, R.C., and Allen, J.M., “Prediction of Thermal-Mechanical
Fatigue Life for Gas Turbine Blades in Electric Power Generation,” ASTM STP1186, American
Society for Testing and Materials, Philadelphia, 1993, pp. 212–238.
2. National Research Council, Coatings for High Temperature Structural Materials —Trends and
Opportunities—, National Academy Press, Washington, D.C., 1996.
3. Seth, B.B., “Superalloys: The Utility Gas Turbine Perspective,” Superalloy 2000, TMS, Warrendale,
PA, 2000, pp. 3-16.
4. Schneider, K. and Grunling, H.W., “Mechanical Aspects of High Temperature Coatings,” Thin
Solid Films, Vol. 107, 1983, pp. 395–416.
5. Hocking, M.G., Vasantathan, V., and Sidky, P.S., Metallic and Ceramic Coatings, Longsman
Scientific & Technical Publishers, London, 1989.
66
6. H. Echosler, D. Renusch and M. Schütze, “Kinetics of the Evaluation of Physical Defects in the
TGO and its Vicinity for Life Time Prediction of TBC Systems”, Proc. of Turbomat Symposium
(2002) pp. 17-19
7. D. Renusch, H. Echosler and M. Schütze, Progress in Life Time Modeling of APS-TBC Part I:
Critical strains Macro-Cracking, and Thermal Fatigue (2002)
8. H. Echosler, D. Renusch and M. Schütze, “Bond coat oxidation and its significance for life
expectancy of thermalk barrier coating systems”, Material Science and Technology, vol. 20 (2004)
pp. 307-318.
9. T. Xu, S. Faulhaber, C. Mercer, M. Maloney and A. Evans, “Observation and analyses of failure
mechanisms in thermal barrier systems with two phase bond coats based on NiCoCrAlY”, Acta
Materialia, Vol 52 (2004) pp. 1439-1450.
10. M. S, Ali, S. Song and P. Xiao, “Degradation of thermal barrier coatings due to thermal cycling up
to 1150˚C”, J. of Material Science, Vol. 37 (2002) pp. 2097-2102.
11. I. Hofinger, M. Oechsner, H. Barhr and M. V. Swain, “Modified four-point bending specimen for
determining the interface fracture energy for thin, brittle layers”, Int. J. of Fracture, vol. 92 (1998)
pp. 213-220.
12. A. K. Ray, N. Roy, and K. M. Godiwalla, “Crack propagation studies and bond coat properties in
thermal barrier coatings under bending”, Bull. Mater. Sci. Vol. 24, No. 2 (2001) pp.203-208.
13. P. G. Charallambides, J. Lund, A. G. Evans and R. M. McMeeking, “A Test Specimen for
Determining the Fracture Resistance of Bimaterial Interface”, J. of Applied Mechanics, vol. 56,
March (1989) pp. 77-82
14. D. Renusch, H. Echsler and M. Schütze, “New approaches to the understanding of failure and life
time prediction of thermal barrier coating systems”, Conf. Proc. in Life Time Modeling of High
Temperature Corrosion Process (M. Schütze, W. J. Quadakkers and J. R. Nicholls Edts), EFC-
Publication No.34 (2001) pp.324-338.
15. T. Onoki, K. Ogawa, T. Shoji and H. Torigoe, “Influence of thermal aging on interface delamination
of thermal barrier coatings”
16. M. Arai, U. Iwata, T. Sakuma and M. Saitoh, “Effect of a delamination initiation strength between
thermal barrier coating and base metal on thermal aging“, J. Soc. Mat. Sci., Japan, Vol. 49, No. 8
(2000) pp.912-918.
17. K. Takaki, K. Kubo and K. Fujiyama, Report of sub-committee “Superalloy and coatings”, no-
printed.
18. K. Ogawa, Report of sub-committee “Superalloy and coatings”, no-printed.
19. Subcommittee on Superalloys and Coatings JSMS, Proceedings of the Symposium on Strength of
Materials at High Temperature (2005) 157 (in Japanese).
20. K. Kaise, Y. Yamazaki, M. Okazaki and H. Fukanuma, Proceedings of the 2004 Annual Meeting of
the JSME/MMD (2004) 219 (in Japanese).
67

68
21. S. R Choi, D. Zhu and R. A. Miller “Mode I, Mode II, and Mixed-Mode Fracture of Plasma-
Sprayed Thermal Barrier Coatings at Ambient and Elevated Temperatures”, NASA/TM-2003-
212185 (2003).


