5/14/2019
1
Julia Ryan, AICP
City of Fort Worth
Transportation and Public Works
Fort Worth Active Transportation Plan
Data Driven Analysis
Presentation Overview
• Overview of Active Transportation Plan
• Review data driven approach to measuring pedestrian and bicycle comfort
• Overview of prioritization criteria and outputs
2
5/14/2019
2
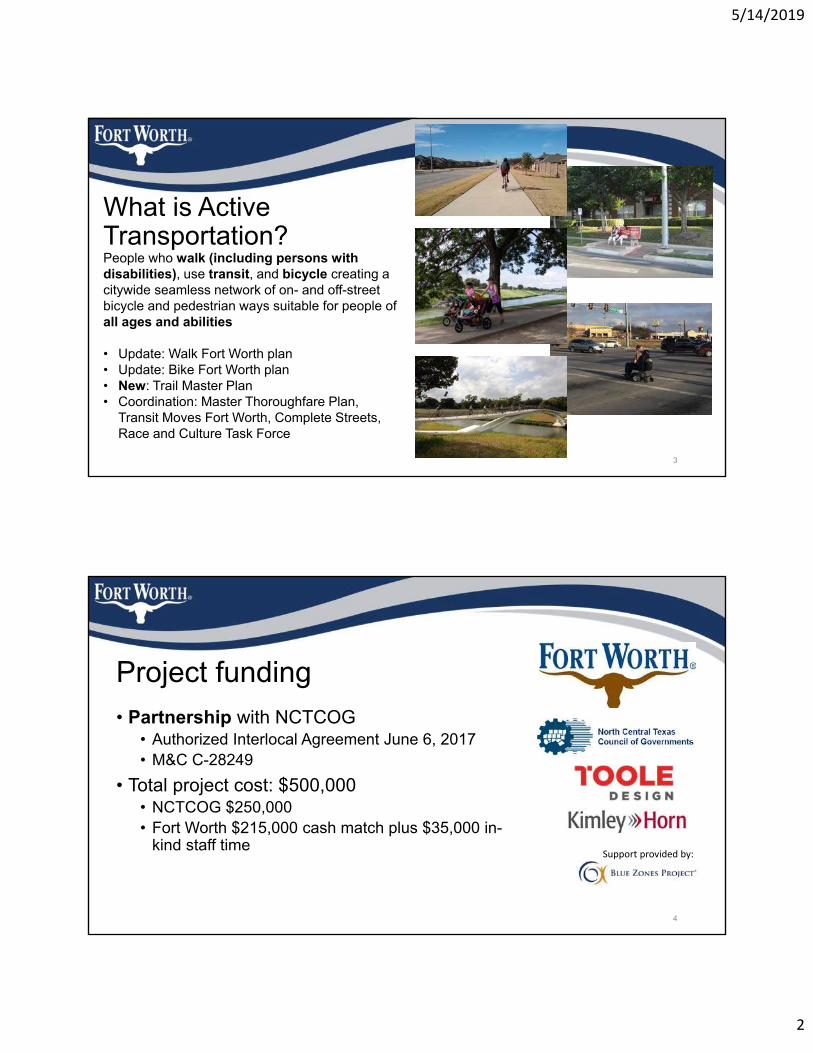
What is Active Transportation?
3
People who walk (including persons with disabilities), use transit, and bicycle creating a citywide seamless network of on- and off-street bicycle and pedestrian ways suitable for people of all ages and abilities
• Update: Walk Fort Worth plan• Update: Bike Fort Worth plan• New: Trail Master Plan• Coordination: Master Thoroughfare Plan,
Transit Moves Fort Worth, Complete Streets, Race and Culture Task Force
Project funding
• Partnership with NCTCOG • Authorized Interlocal Agreement June 6, 2017• M&C C-28249
• Total project cost: $500,000• NCTCOG $250,000 • Fort Worth $215,000 cash match plus $35,000 in-
kind staff time
4
Support provided by:
5/14/2019
3
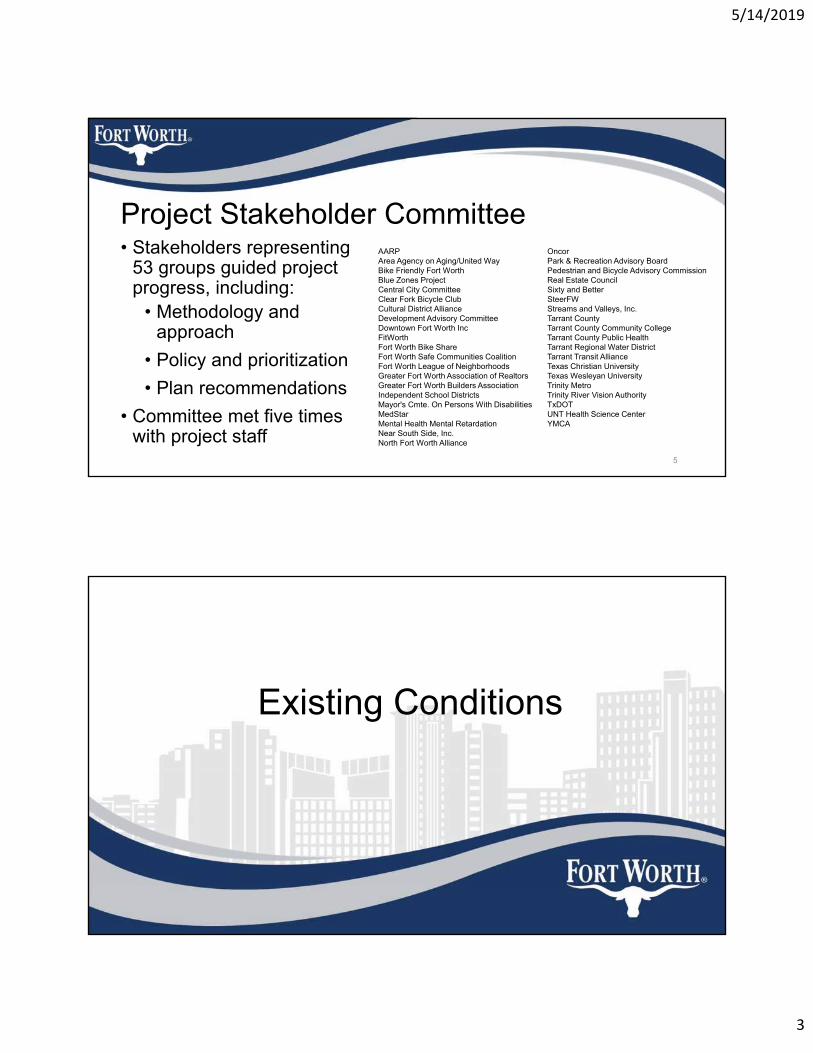
Project Stakeholder Committee• Stakeholders representing
53 groups guided project progress, including:
• Methodology and approach
• Policy and prioritization
• Plan recommendations
• Committee met five times with project staff
5
AARPArea Agency on Aging/United WayBike Friendly Fort WorthBlue Zones ProjectCentral City CommitteeClear Fork Bicycle ClubCultural District AllianceDevelopment Advisory CommitteeDowntown Fort Worth IncFitWorthFort Worth Bike ShareFort Worth Safe Communities CoalitionFort Worth League of NeighborhoodsGreater Fort Worth Association of RealtorsGreater Fort Worth Builders AssociationIndependent School DistrictsMayor's Cmte. On Persons With DisabilitiesMedStarMental Health Mental RetardationNear South Side, Inc.North Fort Worth Alliance
OncorPark & Recreation Advisory BoardPedestrian and Bicycle Advisory CommissionReal Estate CouncilSixty and BetterSteerFWStreams and Valleys, Inc.Tarrant CountyTarrant County Community CollegeTarrant County Public HealthTarrant Regional Water DistrictTarrant Transit AllianceTexas Christian UniversityTexas Wesleyan UniversityTrinity MetroTrinity River Vision AuthorityTxDOTUNT Health Science CenterYMCA
Existing Conditions
5/14/2019
4
7
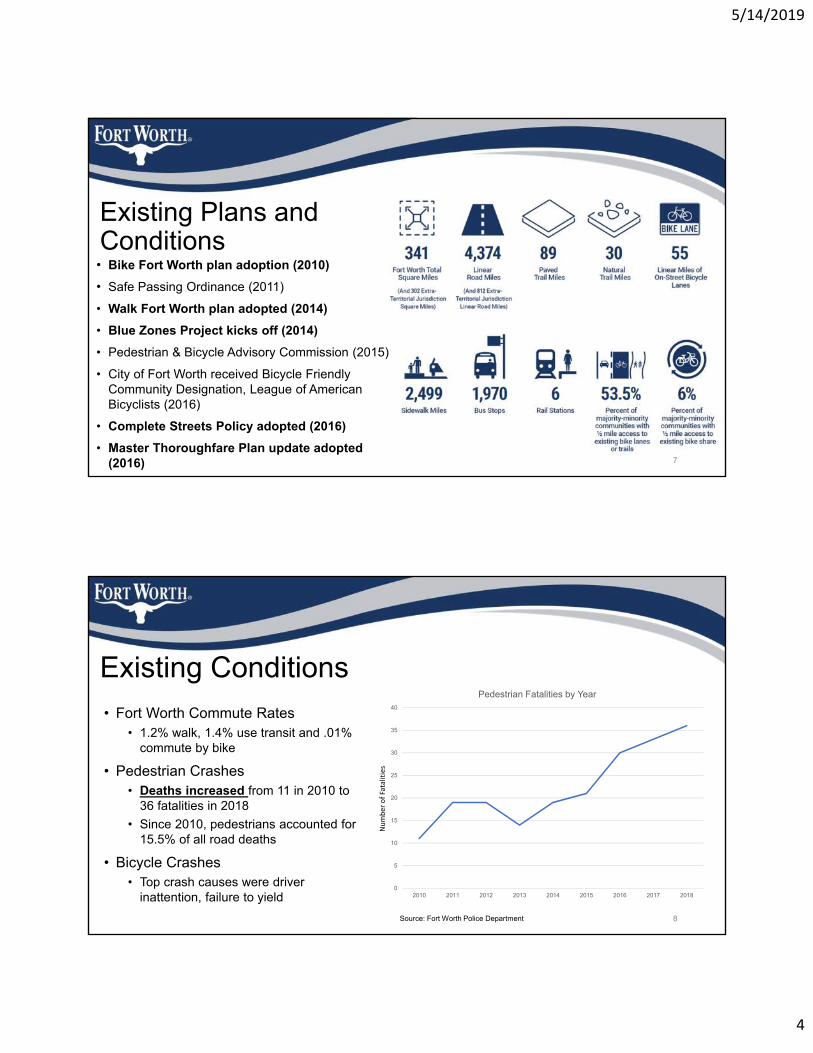
Existing Plans and Conditions• Bike Fort Worth plan adoption (2010)
• Safe Passing Ordinance (2011)
• Walk Fort Worth plan adopted (2014)
• Blue Zones Project kicks off (2014)
• Pedestrian & Bicycle Advisory Commission (2015)
• City of Fort Worth received Bicycle Friendly Community Designation, League of American Bicyclists (2016)
• Complete Streets Policy adopted (2016)
• Master Thoroughfare Plan update adopted (2016)
8
Existing Conditions• Fort Worth Commute Rates
• 1.2% walk, 1.4% use transit and .01% commute by bike
• Pedestrian Crashes• Deaths increased from 11 in 2010 to
36 fatalities in 2018
• Since 2010, pedestrians accounted for 15.5% of all road deaths
• Bicycle Crashes• Top crash causes were driver
inattention, failure to yield0
5
10
15
20
25
30
35
40
2010 2011 2012 2013 2014 2015 2016 2017 2018
Pedestrian Fatalities by Year
Number of Fatalities
Source: Fort Worth Police Department
5/14/2019
5
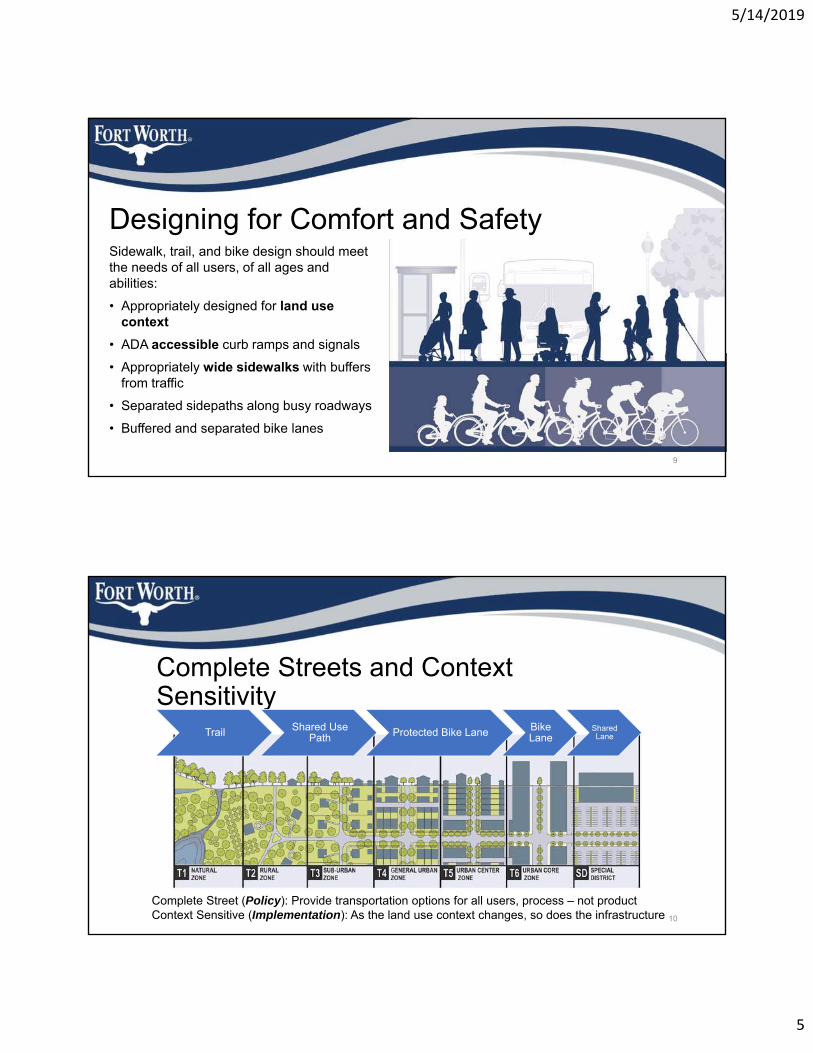
Designing for Comfort and SafetySidewalk, trail, and bike design should meet the needs of all users, of all ages and abilities:
• Appropriately designed for land use context
• ADA accessible curb ramps and signals
• Appropriately wide sidewalks with buffers from traffic
• Separated sidepaths along busy roadways
• Buffered and separated bike lanes
9
Complete Streets and Context Sensitivity
Trail Shared Use Path Protected Bike Lane Bike
LaneShared Lane
Complete Street (Policy): Provide transportation options for all users, process – not productContext Sensitive (Implementation): As the land use context changes, so does the infrastructure 10
5/14/2019
6
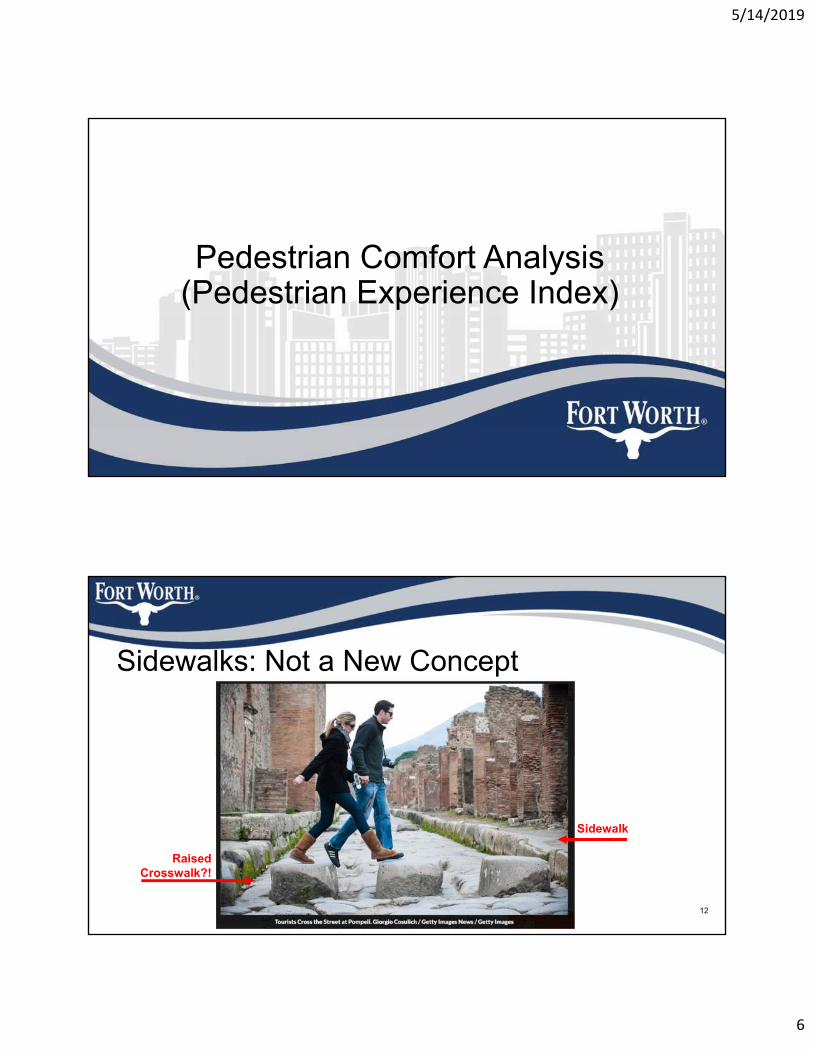
Pedestrian Comfort Analysis (Pedestrian Experience Index)
Sidewalks: Not a New Concept
12
Raised Crosswalk?!
Sidewalk
5/14/2019
7
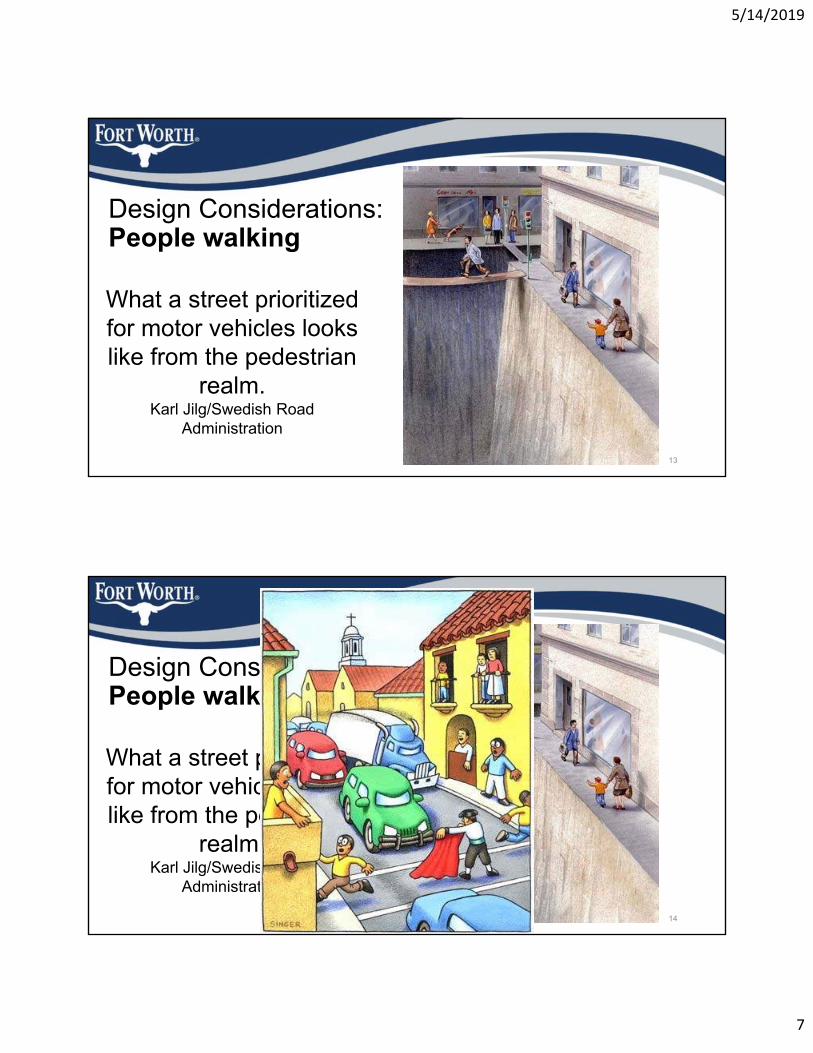
What a street prioritized for motor vehicles looks like from the pedestrian
realm.Karl Jilg/Swedish Road
Administration
13
Design Considerations: People walking
What a street prioritized for motor vehicles looks like from the pedestrian
realm.Karl Jilg/Swedish Road
Administration
14
Design Considerations: People walking
5/14/2019
8
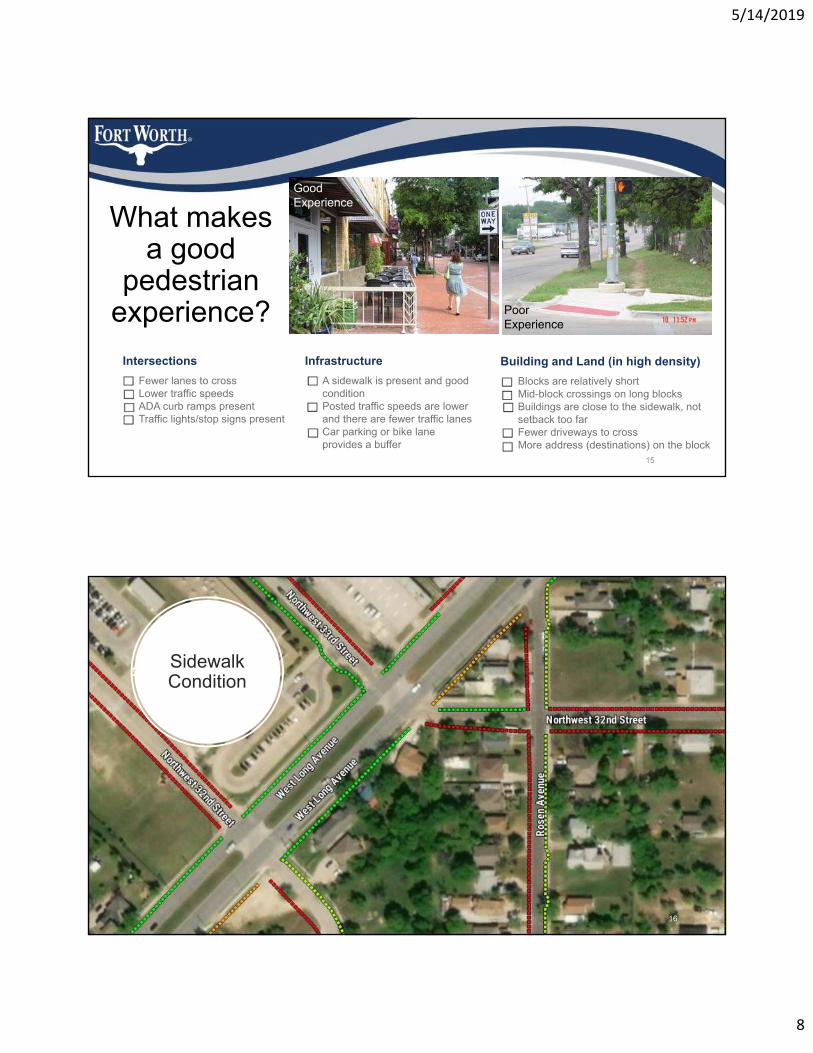
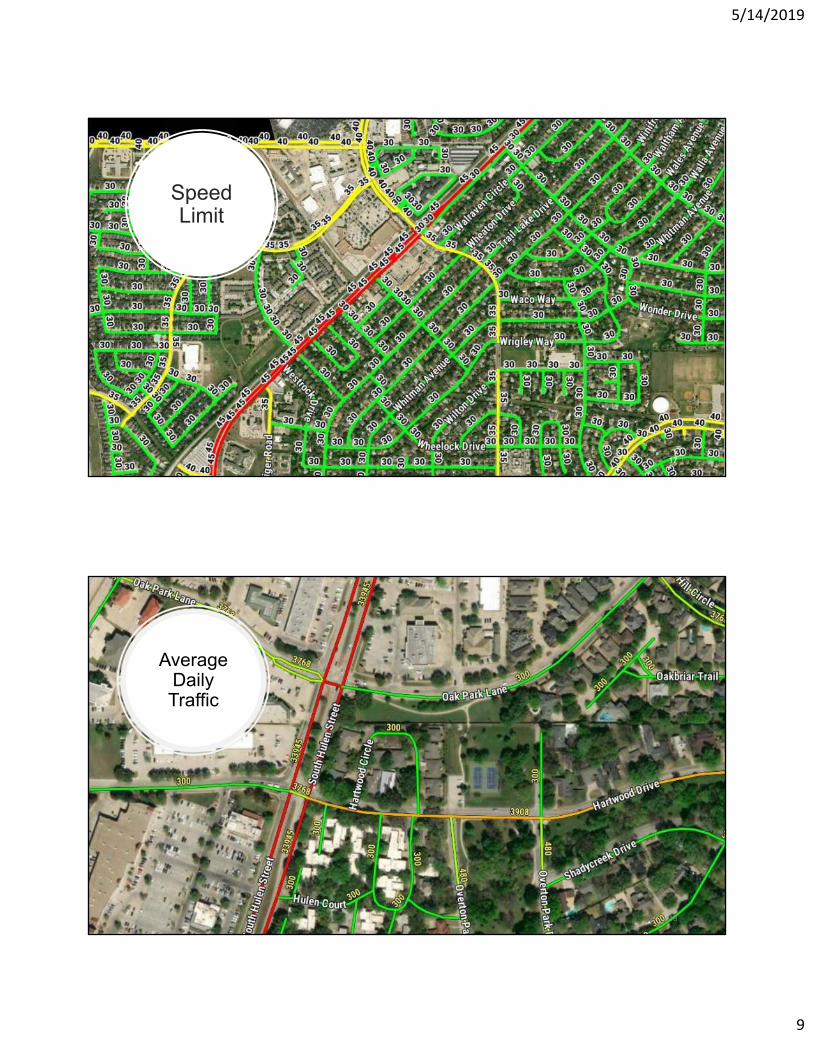
What makes a good
pedestrian experience?
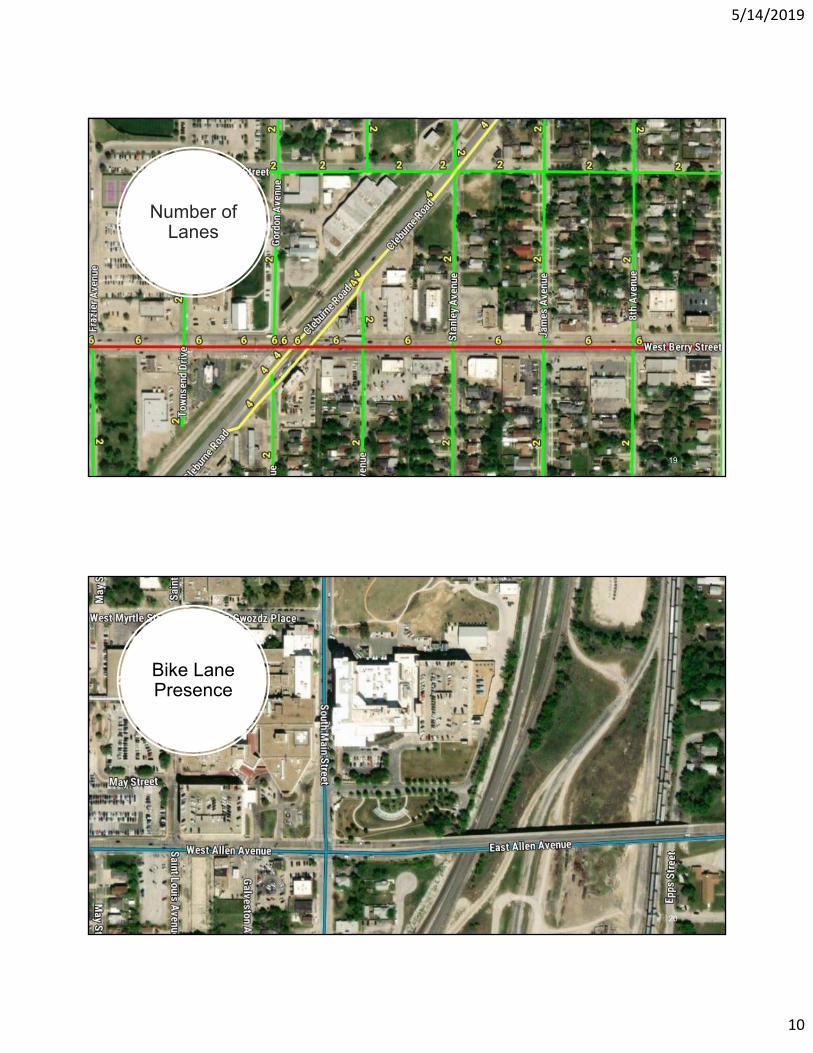
Fewer lanes to crossLower traffic speedsADA curb ramps presentTraffic lights/stop signs present
Intersections
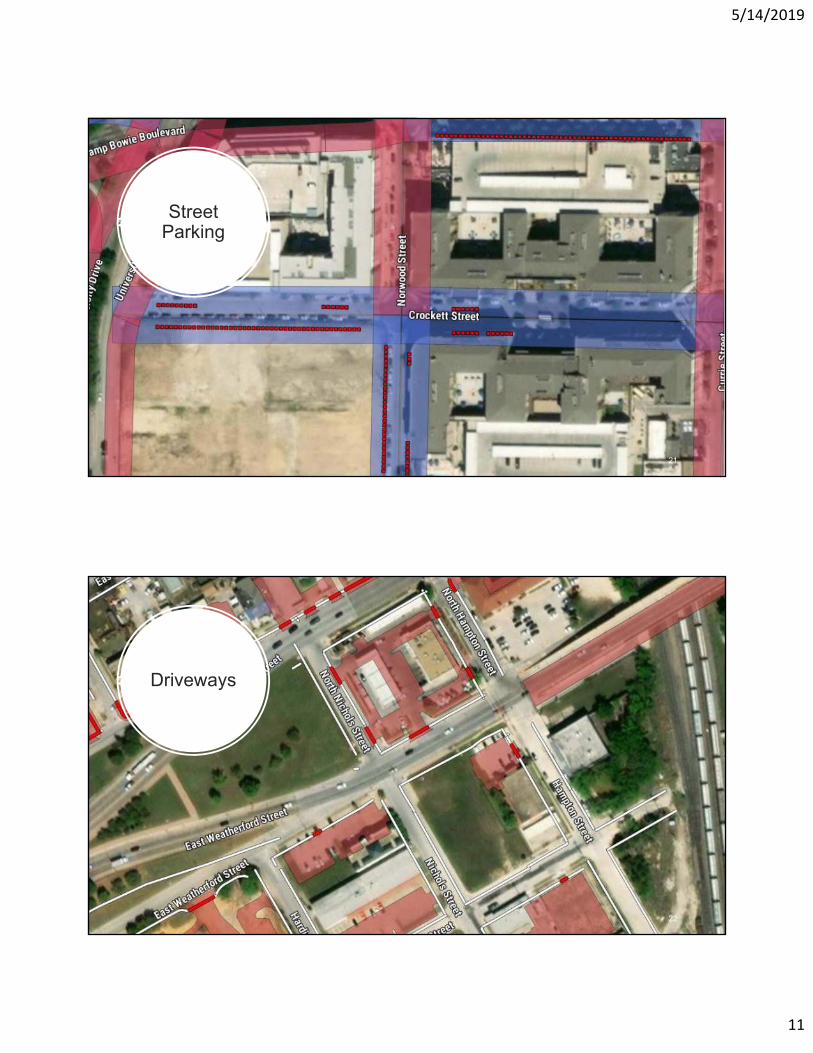
A sidewalk is present and good conditionPosted traffic speeds are lower and there are fewer traffic lanesCar parking or bike lane provides a buffer
Infrastructure
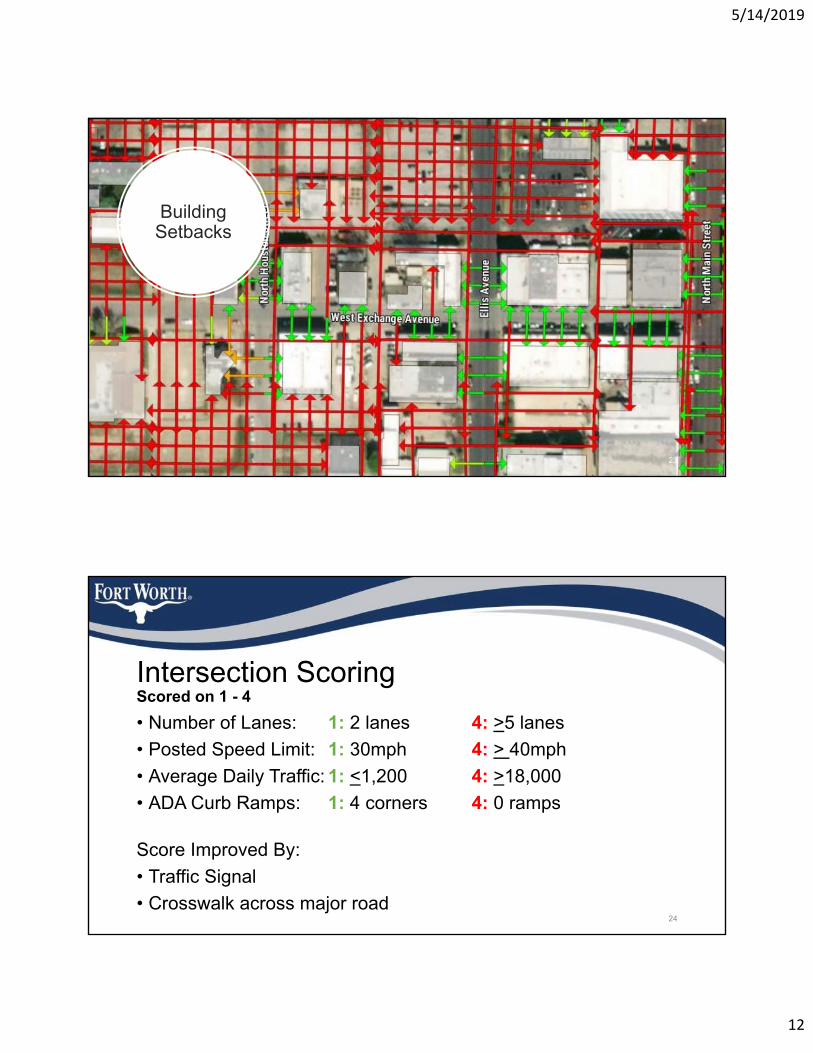
Blocks are relatively shortMid-block crossings on long blocksBuildings are close to the sidewalk, not setback too farFewer driveways to crossMore address (destinations) on the block
Building and Land (in high density)
15
Good Experience
PoorExperience
Sidewalk Condition
16
5/14/2019
9
17
Speed Limit
Average DailyTraffic
18
5/14/2019
10
Number of Lanes
19
Bike Lane Presence
20
5/14/2019
11
Street Parking
21
Driveways
22
5/14/2019
12
Building Setbacks
23
Intersection Scoring
24
• Number of Lanes: 1: 2 lanes 4: >5 lanes
• Posted Speed Limit: 1: 30mph 4: > 40mph
• Average Daily Traffic: 1: <1,200 4: >18,000
• ADA Curb Ramps: 1: 4 corners 4: 0 ramps
Score Improved By:
• Traffic Signal
• Crosswalk across major road
Scored on 1 - 4
5/14/2019
13
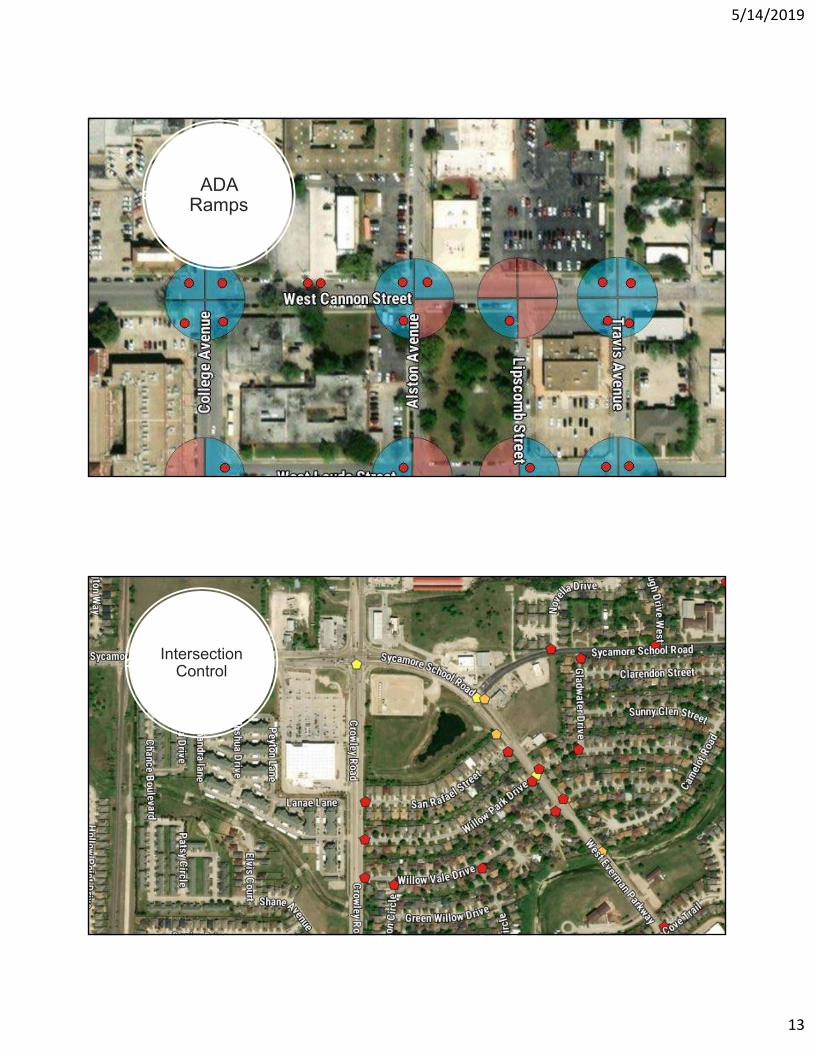
ADA Ramps
25
26
Intersection Control
5/14/2019
14
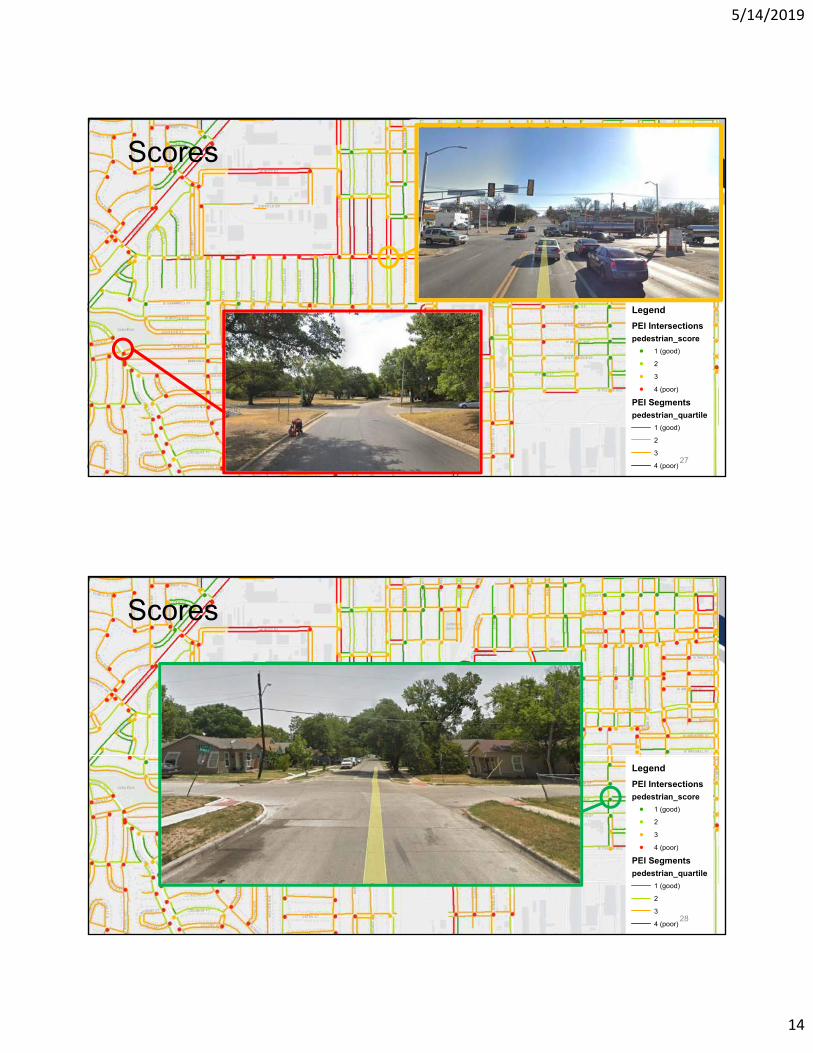
Scores
Legend
PEI Intersections
pedestrian_score
! 1 (good)
! 2
! 3
! 4 (poor)
PEI Segments
pedestrian_quartile
1 (good)
2
3
4 (poor)27
Scores
Legend
PEI Intersections
pedestrian_score
! 1 (good)
! 2
! 3
! 4 (poor)
PEI Segments
pedestrian_quartile
1 (good)
2
3
4 (poor)28
5/14/2019
15
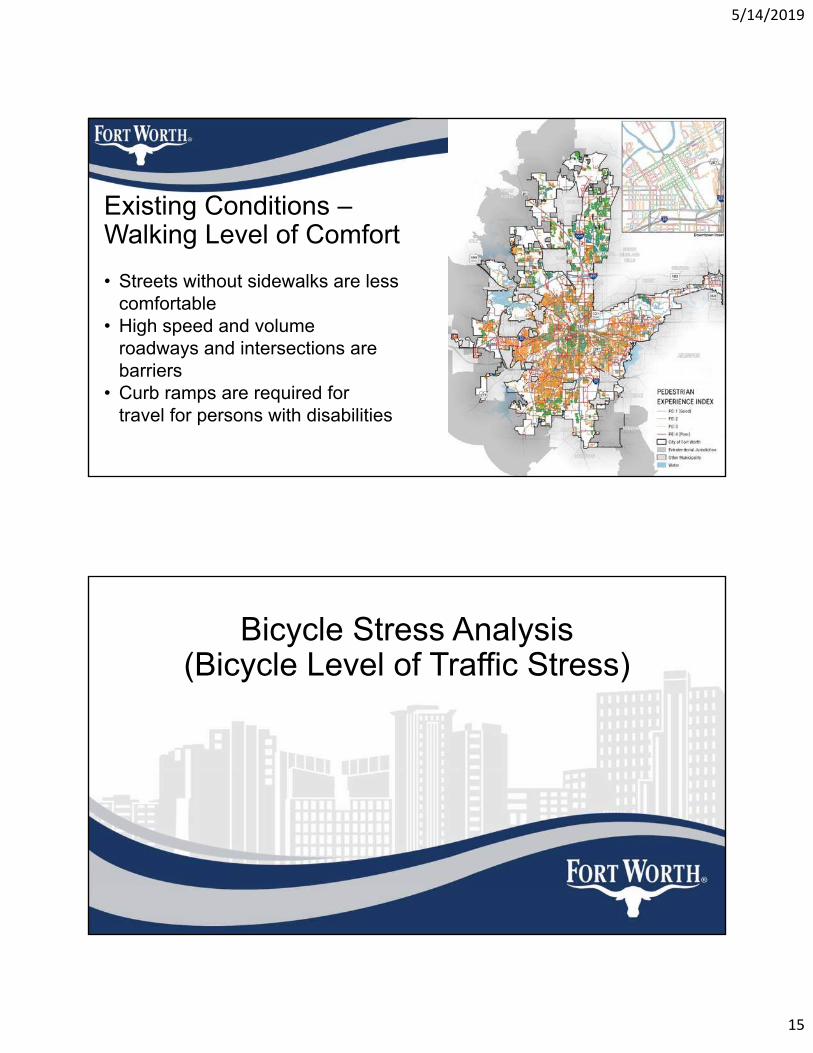
Existing Conditions –Walking Level of Comfort
29
• Streets without sidewalks are less comfortable
• High speed and volume roadways and intersections are barriers
• Curb ramps are required for travel for persons with disabilities
Bicycle Stress Analysis(Bicycle Level of Traffic Stress)
5/14/2019
16
31
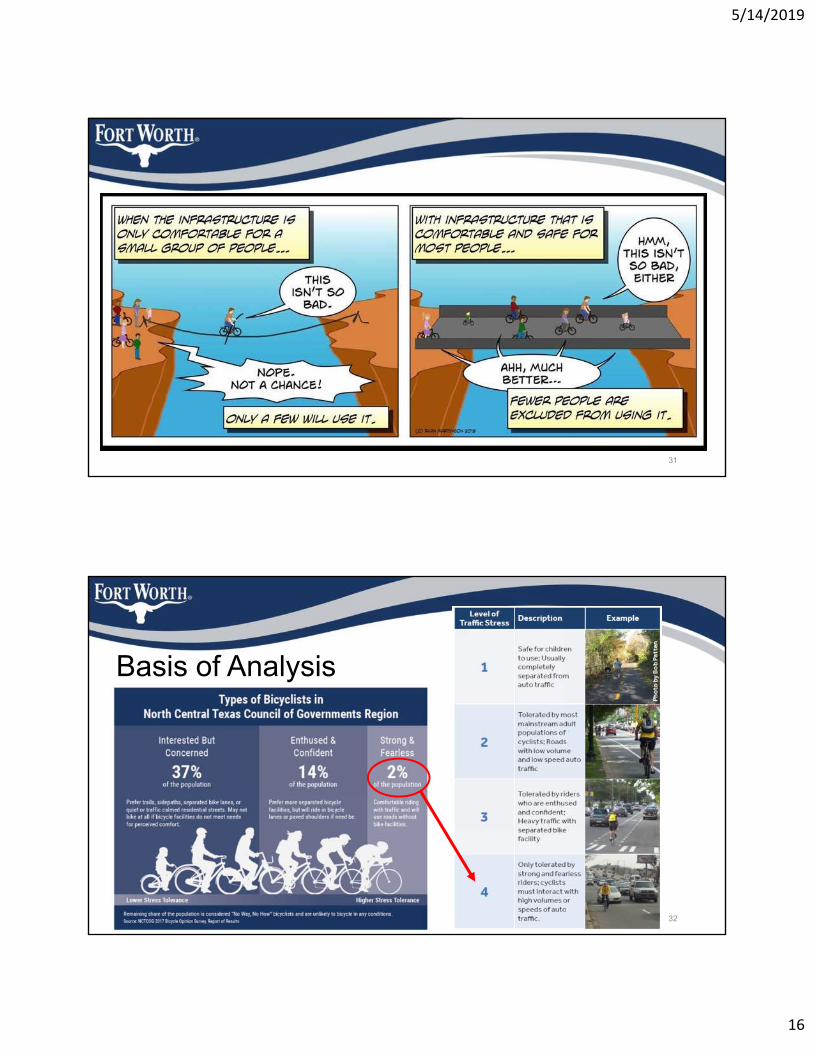
Basis of Analysis
32
5/14/2019
17
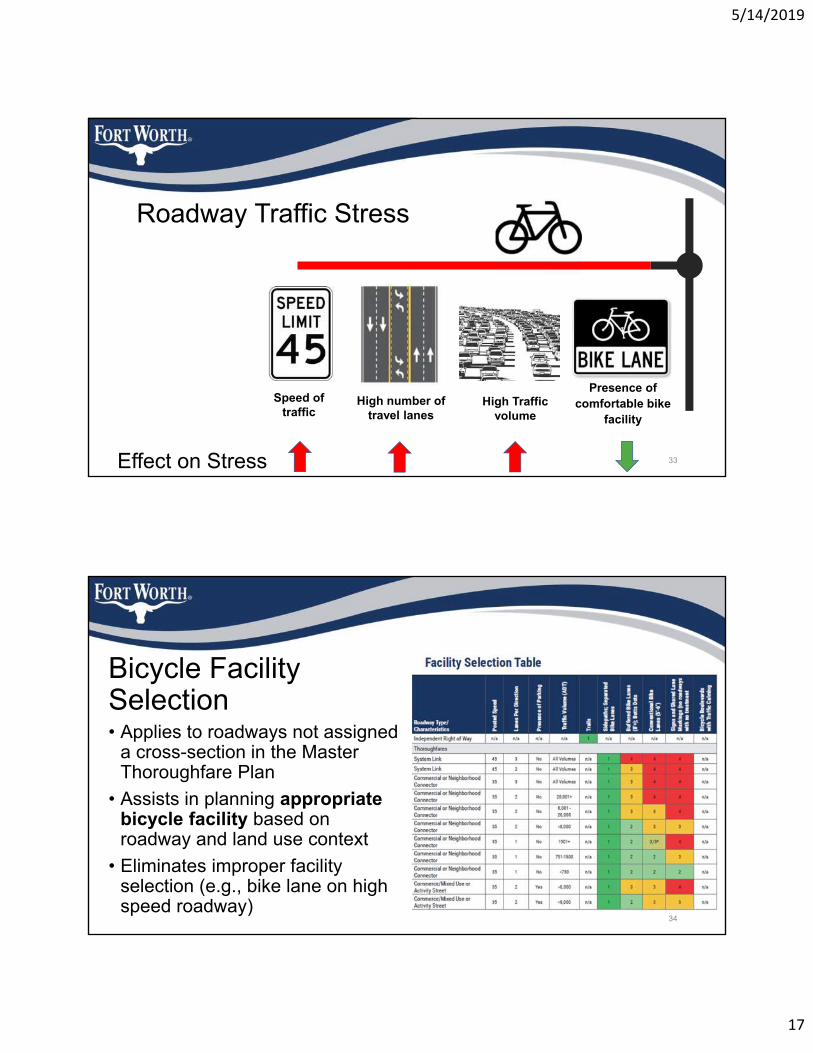
Roadway Traffic Stress
33
Presence of comfortable bike
facility
High number of travel lanes
High Traffic volume
Effect on Stress
Speed of traffic
Bicycle Facility Selection
34
• Applies to roadways not assigned a cross-section in the Master Thoroughfare Plan
• Assists in planning appropriate bicycle facility based on roadway and land use context
• Eliminates improper facility selection (e.g., bike lane on high speed roadway)
5/14/2019
18
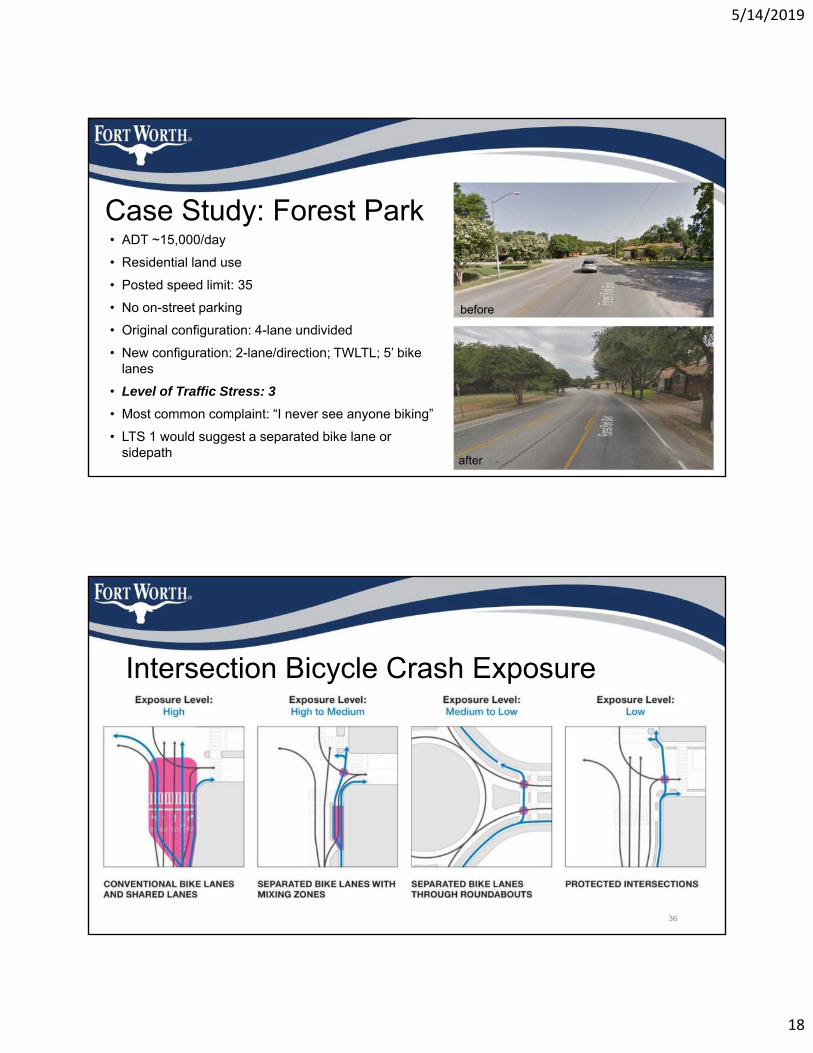
Case Study: Forest Park
35
• ADT ~15,000/day
• Residential land use
• Posted speed limit: 35
• No on-street parking
• Original configuration: 4-lane undivided
• New configuration: 2-lane/direction; TWLTL; 5’ bike lanes
• Level of Traffic Stress: 3
• Most common complaint: “I never see anyone biking”
• LTS 1 would suggest a separated bike lane or sidepath
before
after
Intersection Bicycle Crash Exposure
36
5/14/2019
19
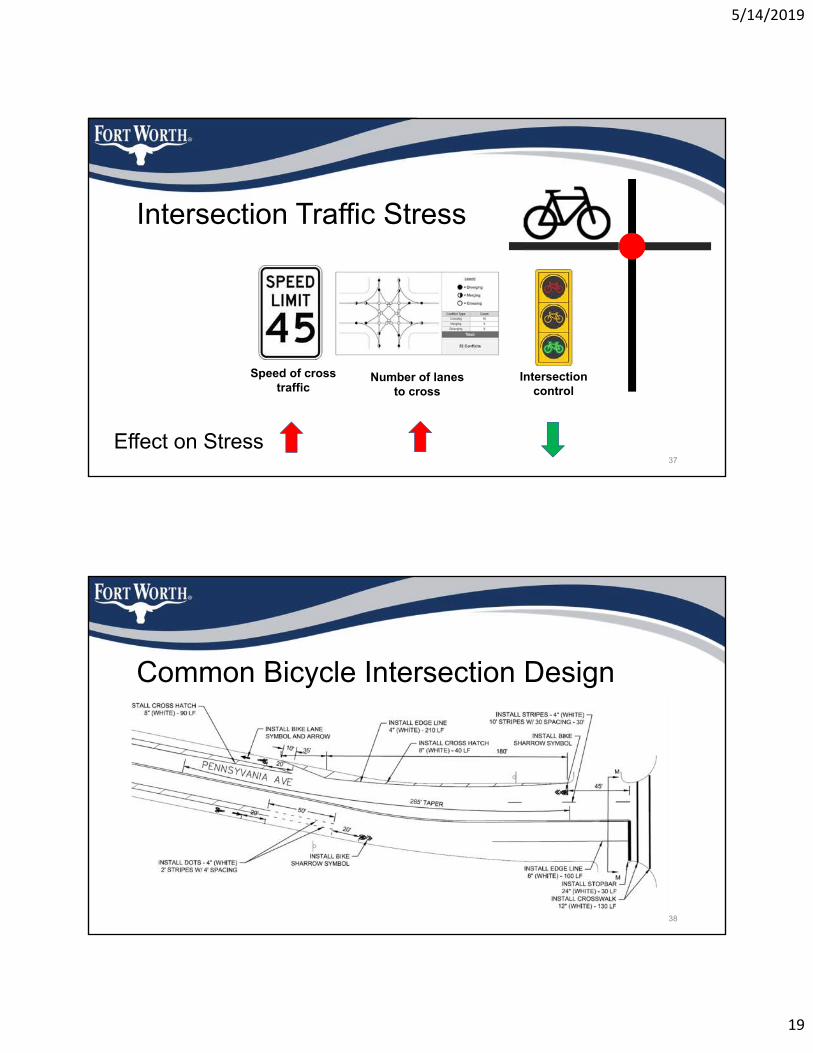
Intersection Traffic Stress
37
Number of lanes to cross
Intersection control
Effect on Stress
Speed of cross traffic
Common Bicycle Intersection Design
38
5/14/2019
20
39
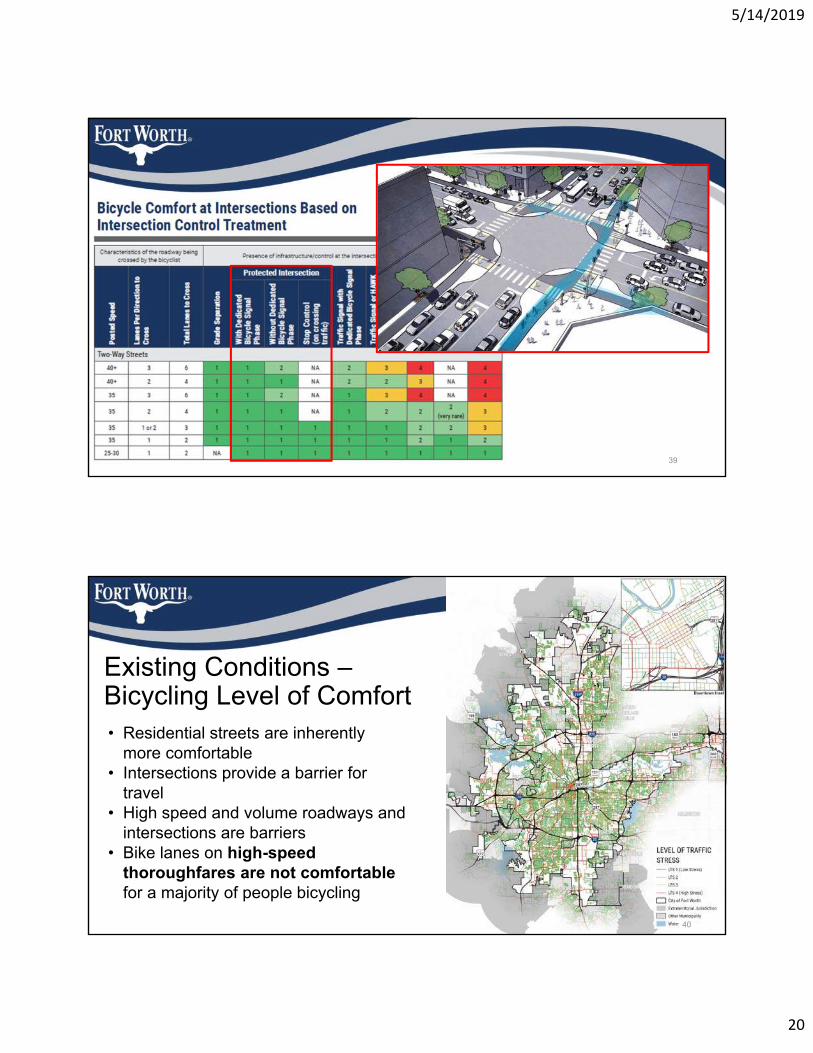
Existing Conditions –Bicycling Level of Comfort
40
• Residential streets are inherently more comfortable
• Intersections provide a barrier for travel
• High speed and volume roadways and intersections are barriers
• Bike lanes on high-speed thoroughfares are not comfortablefor a majority of people bicycling
5/14/2019
21
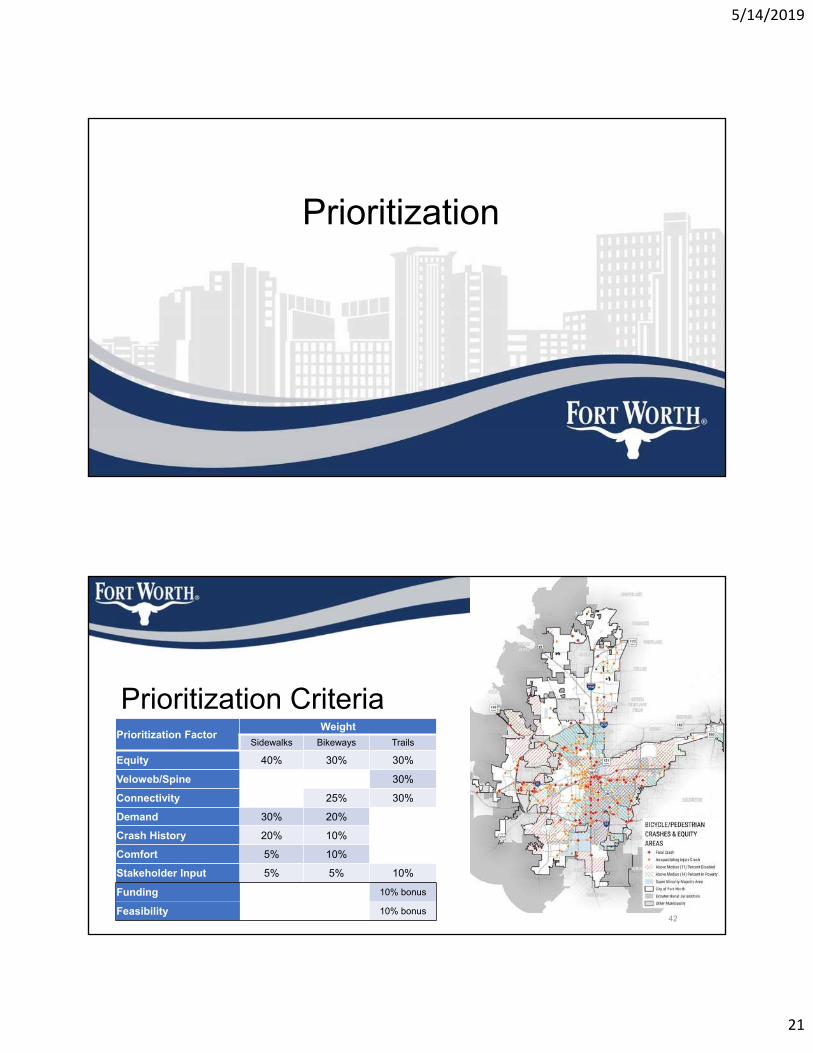
Prioritization
Prioritization Criteria
42
Prioritization FactorWeight
Sidewalks Bikeways Trails
Equity 40% 30% 30%
Veloweb/Spine 30%
Connectivity 25% 30%
Demand 30% 20%
Crash History 20% 10%
Comfort 5% 10%
Stakeholder Input 5% 5% 10%
Funding 10% bonus
Feasibility 10% bonus
5/14/2019
22
43
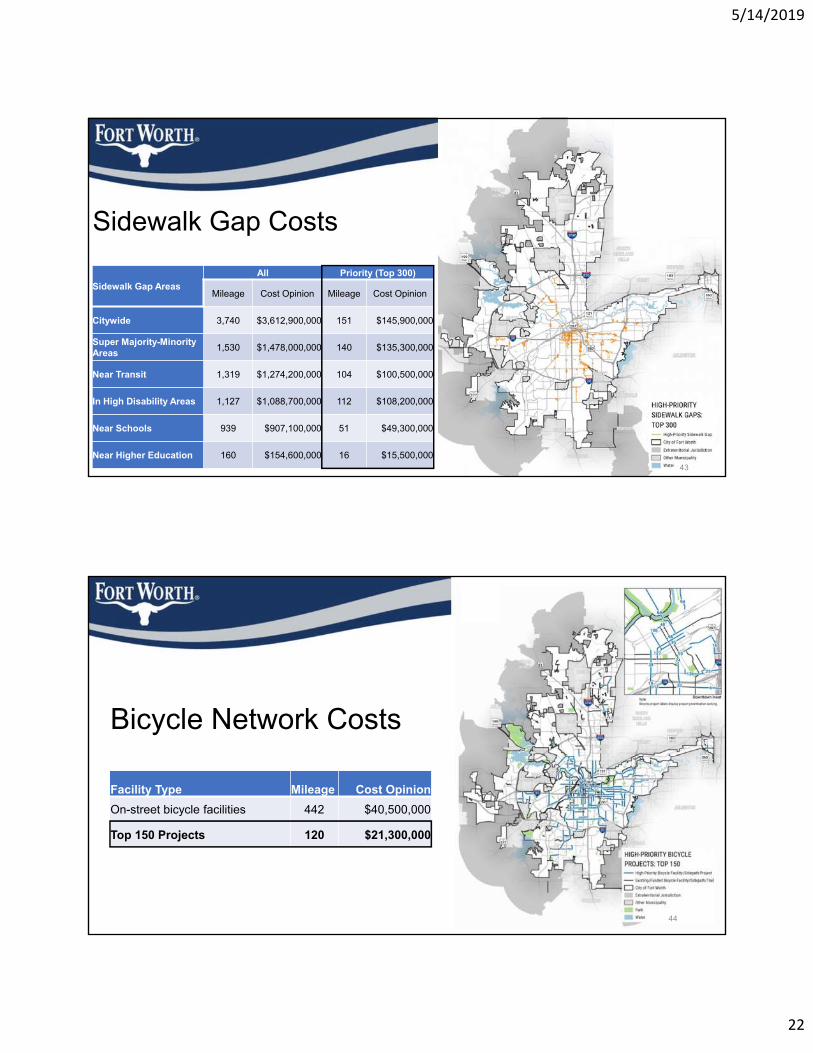
Sidewalk Gap Costs
Sidewalk Gap Areas
All Priority (Top 300)
Mileage Cost Opinion Mileage Cost Opinion
Citywide 3,740 $3,612,900,000 151 $145,900,000
Super Majority-Minority Areas
1,530 $1,478,000,000 140 $135,300,000
Near Transit 1,319 $1,274,200,000 104 $100,500,000
In High Disability Areas 1,127 $1,088,700,000 112 $108,200,000
Near Schools 939 $907,100,000 51 $49,300,000
Near Higher Education 160 $154,600,000 16 $15,500,000
Bicycle Network Costs
44
Facility Type Mileage Cost Opinion
On-street bicycle facilities 442 $40,500,000
Top 150 Projects 120 $21,300,000
5/14/2019
23
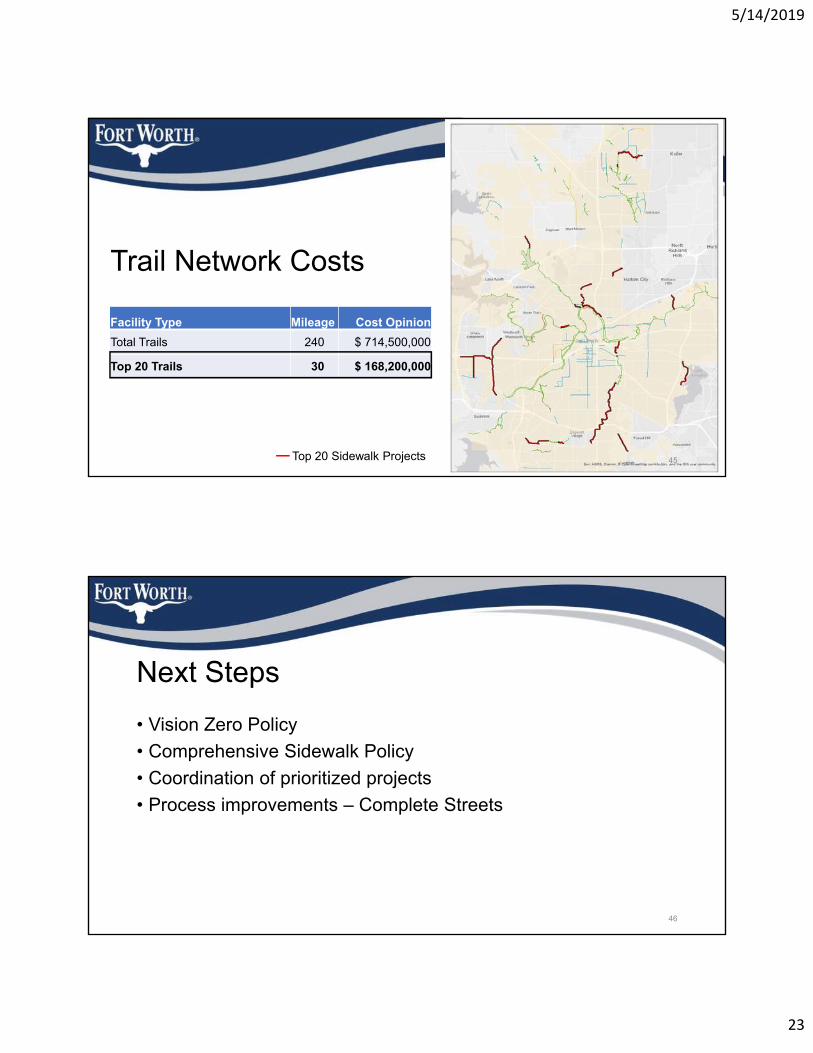
Trail Network Costs
45
Facility Type Mileage Cost Opinion
Total Trails 240 $ 714,500,000
Top 20 Trails 30 $ 168,200,000
Top 20 Sidewalk Projects
Next Steps
• Vision Zero Policy
• Comprehensive Sidewalk Policy
• Coordination of prioritized projects
• Process improvements – Complete Streets
46
5/14/2019
24
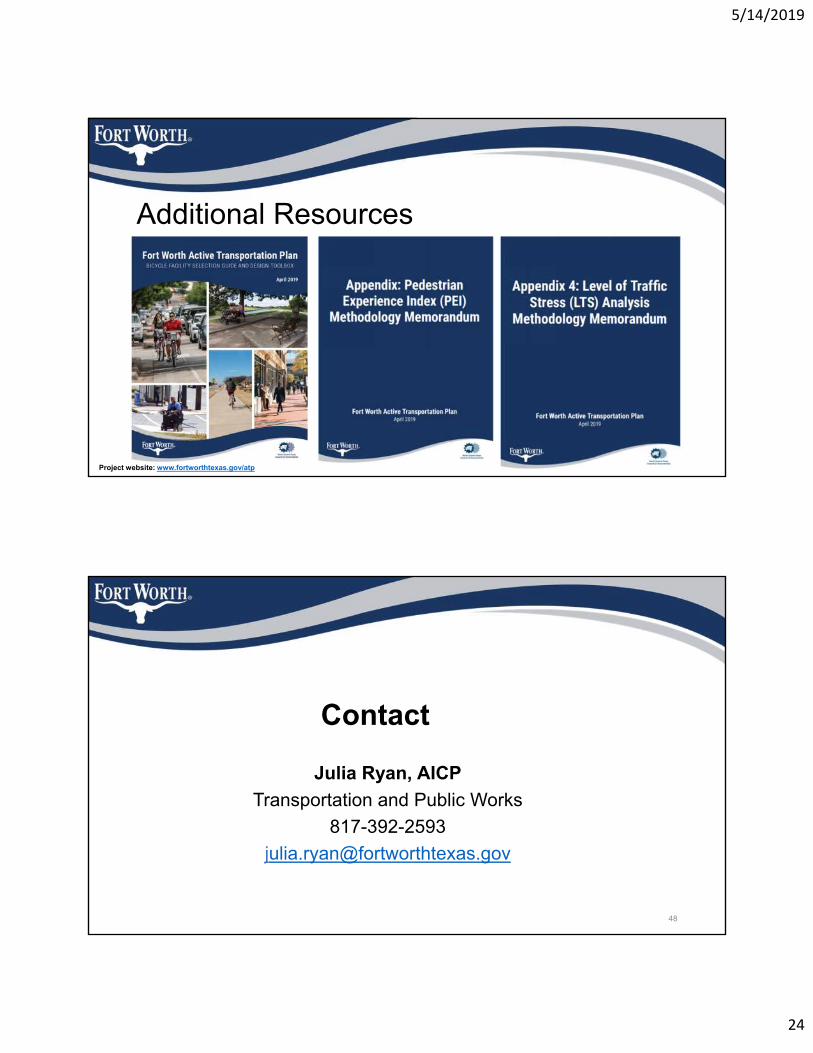
Additional Resources
47Project website: www.fortworthtexas.gov/atp
48
Julia Ryan, AICP
Transportation and Public Works
817-392-2593
Contact
5/14/2019
25
Questions?


