Download - Formation Damage – Effects and Overview

Formation Damage – Effects and Overview
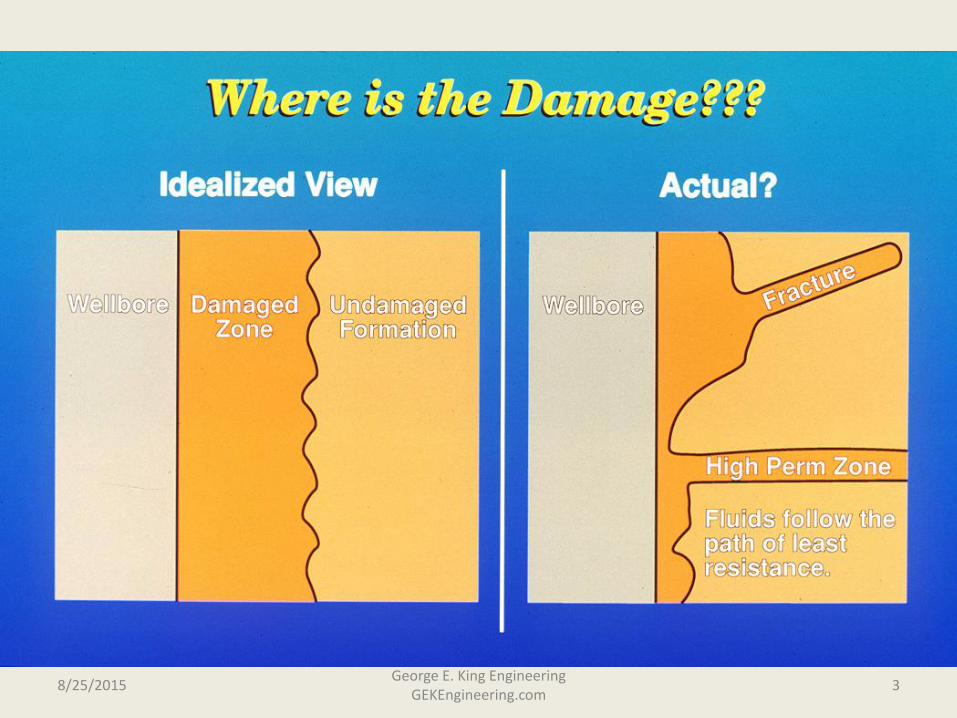
• Where is the damage?
• How does it affect production?
8/25/2015 1 George E. King Engineering
GEKEngineering.com
Impact of Damage on Production
• Look at Effect of Damage
• Type of Damage
• Severity of Plugging
• Depth of Damage
• Ability to Prevent/Remove/By-Pass
8/25/2015 2 George E. King Engineering
GEKEngineering.com
8/25/2015 3 George E. King Engineering
GEKEngineering.com
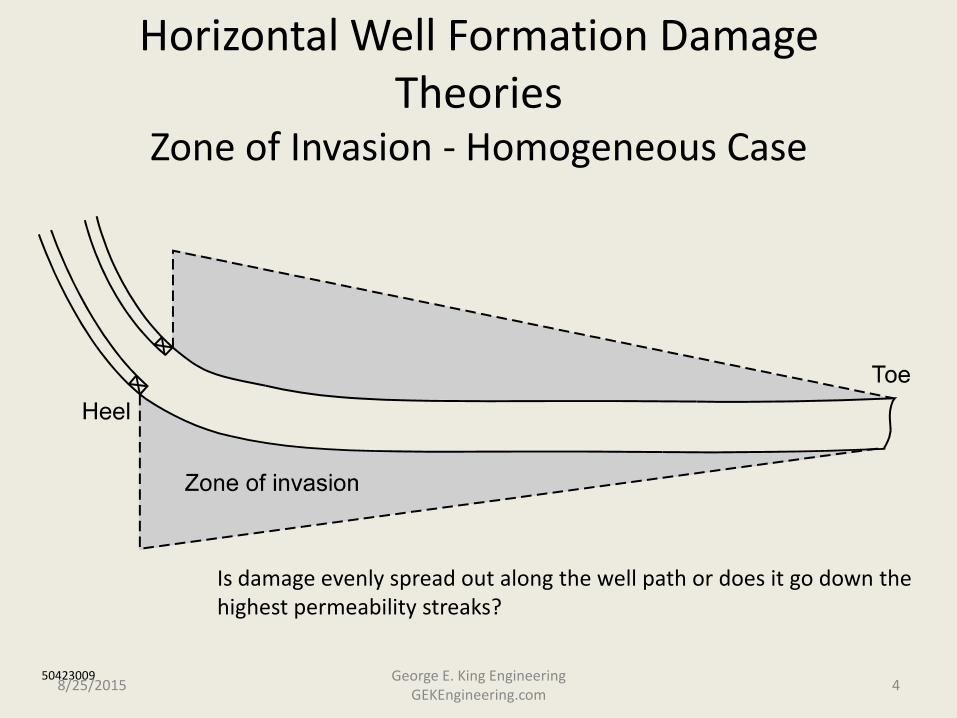
Horizontal Well Formation Damage Theories
Zone of Invasion - Homogeneous Case
50423009
Is damage evenly spread out along the well path or does it go down the highest permeability streaks?
8/25/2015 4 George E. King Engineering
GEKEngineering.com

Horizontal Well Formation Damage Theories Zone of Invasion - Heterogeneous Case
50423010 8/25/2015 5
George E. King Engineering GEKEngineering.com

Observations on Damage
1. Shallow damage is the most common and makes the biggest impact on production.
2. It may take significant damage to create large drops in production
3. The problem, however, is that the highest permeability zones are the easiest to damage, and that can have a major impact on productivity.
8/25/2015 6 George E. King Engineering
GEKEngineering.com
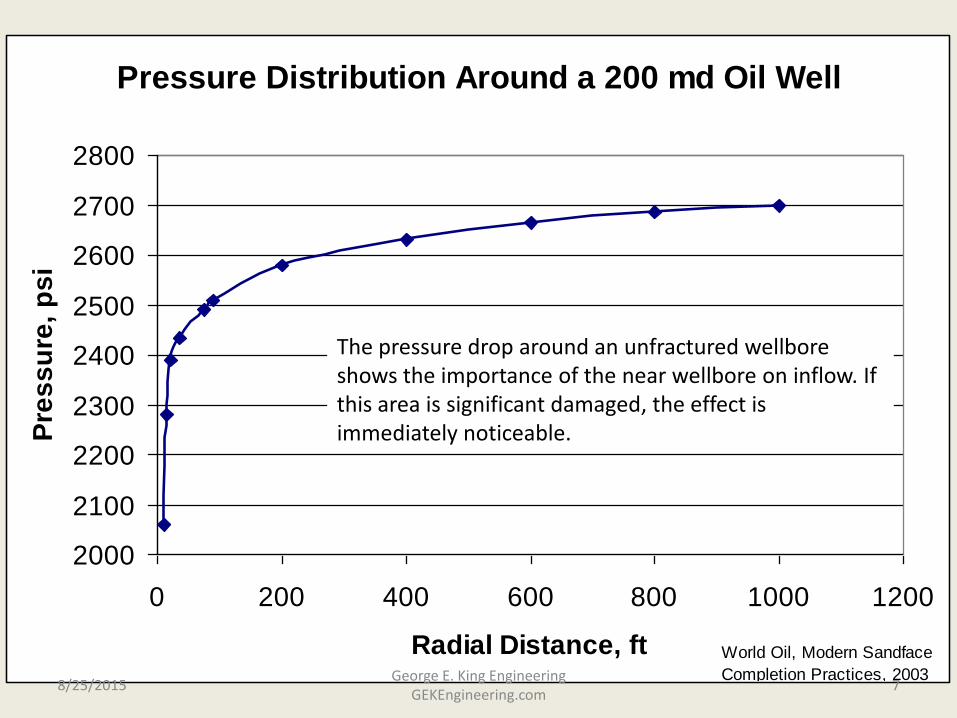
Pressure Distribution Around a 200 md Oil Well
2000
2100
2200
2300
2400
2500
2600
2700
2800
0 200 400 600 800 1000 1200
Radial Distance, ft
Pre
ss
ure
, p
si
World Oil, Modern Sandface
Completion Practices, 2003
The pressure drop around an unfractured wellbore shows the importance of the near wellbore on inflow. If this area is significant damaged, the effect is immediately noticeable.
8/25/2015 7 George E. King Engineering
GEKEngineering.com
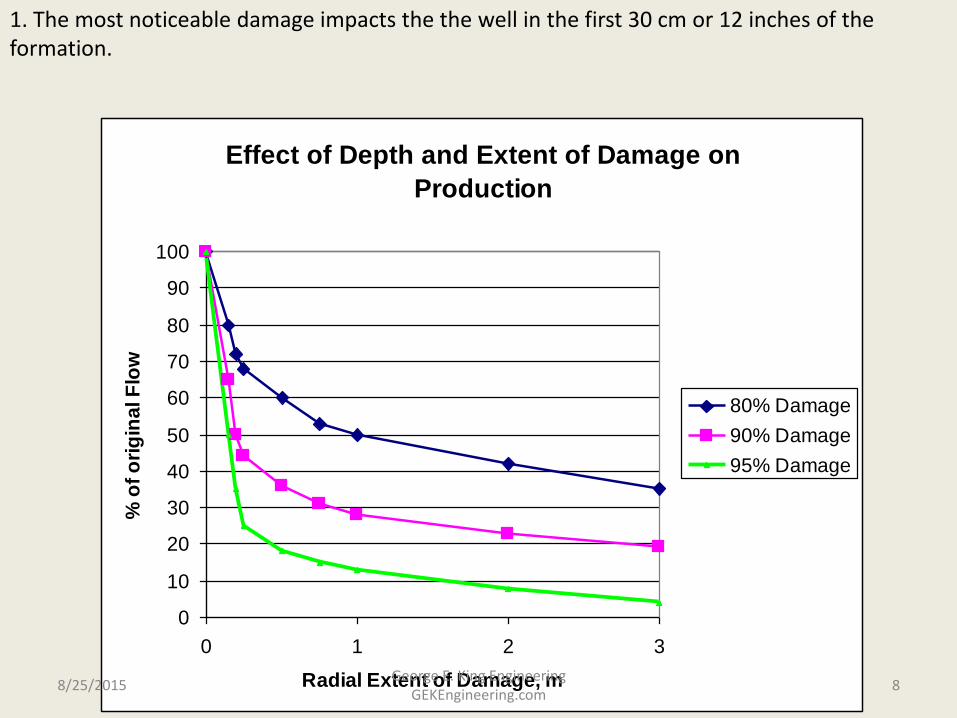
Effect of Depth and Extent of Damage on
Production
0
10
20
30
40
50
60
70
80
90
100
0 1 2 3
Radial Extent of Damage, m
% o
f o
rig
ina
l F
low
80% Damage
90% Damage
95% Damage
1. The most noticeable damage impacts the the well in the first 30 cm or 12 inches of the formation.
8/25/2015 8 George E. King Engineering
GEKEngineering.com
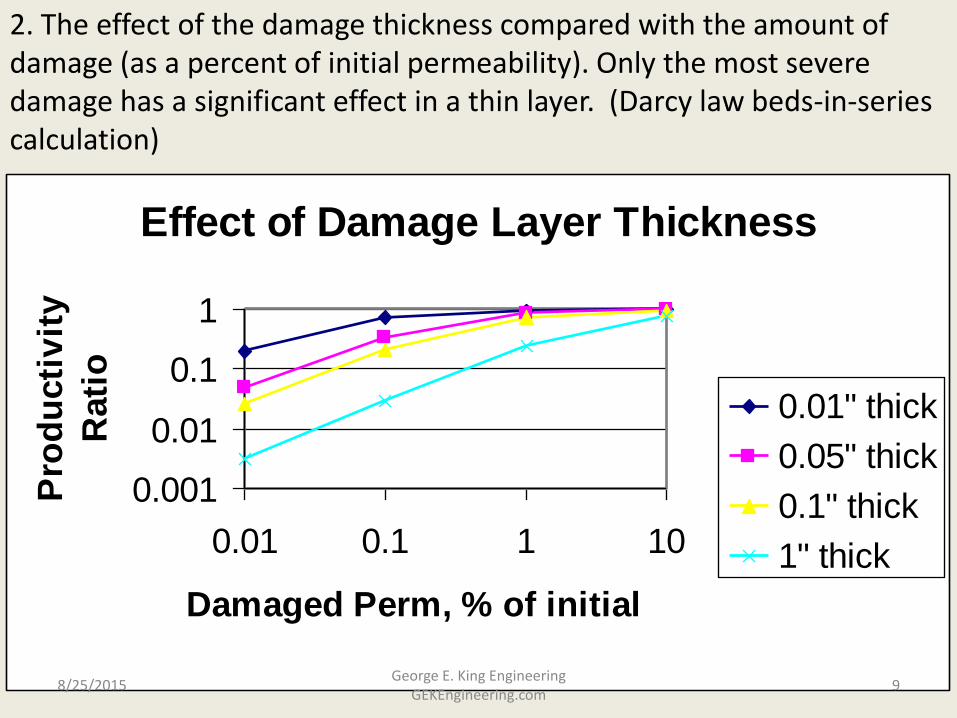
Effect of Damage Layer Thickness
0.001
0.01
0.1
1
0.01 0.1 1 10
Damaged Perm, % of initial
Pro
du
cti
vit
y
Rati
o
0.01" thick
0.05" thick
0.1" thick
1" thick
2. The effect of the damage thickness compared with the amount of damage (as a percent of initial permeability). Only the most severe damage has a significant effect in a thin layer. (Darcy law beds-in-series calculation)
8/25/2015 9 George E. King Engineering
GEKEngineering.com

Productivity Loss From Formation Damage
0.25
0.3
0.35
0.4
0.45
0.5
0.55
0.6
0.65
0.7
0.75
0.8
0.85
0.9
0.95
1
0 2 4 6 8 10
Depth of Damaged Zone, inches
Pro
du
cti
vit
y a
s a
Fra
cti
on
of
Un
da
ma
ge
d P
rod
.
Kd/Ki = 0.5
Kd/Ki = 0.2
Kd/Ki = 0.1
Kd/Ki = 0.05
Kd/Ki = 0.02
World Oil, Modern
Sandface Completion
2. (continued) As the damage layer thickens and becomes more severe, the impact on production builds quickly.
8/25/2015 10 George E. King Engineering
GEKEngineering.com
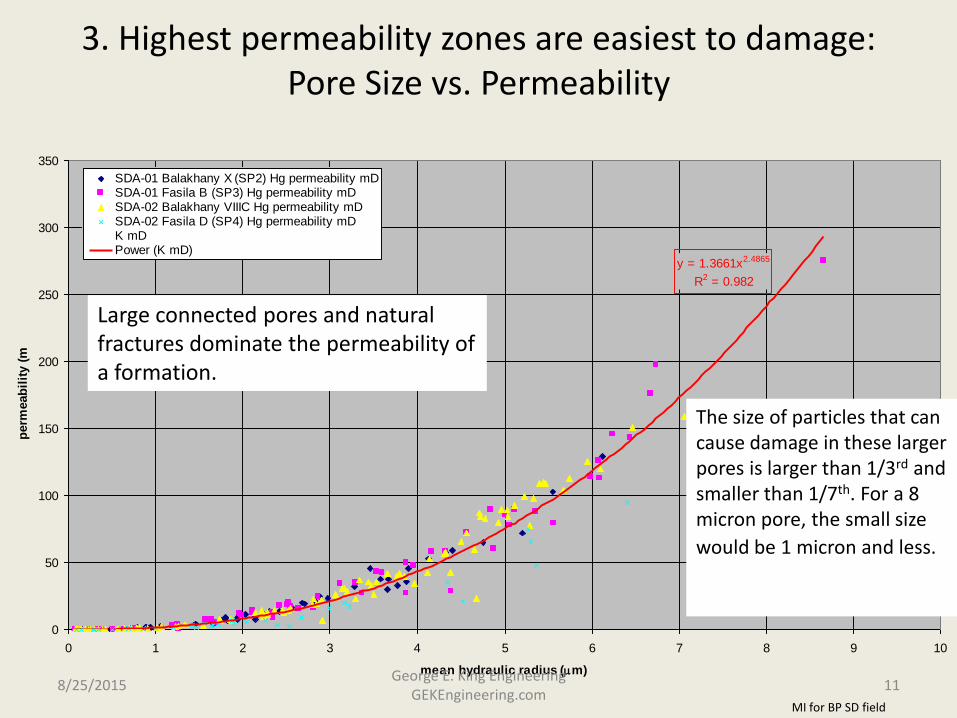
3. Highest permeability zones are easiest to damage: Pore Size vs. Permeability
y = 1.3661x2.4865
R2 = 0.982
0
50
100
150
200
250
300
350
0 1 2 3 4 5 6 7 8 9 10
mean hydraulic radius (mm)
perm
eab
ilit
y (
mD
)
SDA-01 Balakhany X (SP2) Hg permeability mDSDA-01 Fasila B (SP3) Hg permeability mDSDA-02 Balakhany VIIIC Hg permeability mDSDA-02 Fasila D (SP4) Hg permeability mDK mDPower (K mD)
MI for BP SD field
Large connected pores and natural fractures dominate the permeability of a formation.
The size of particles that can cause damage in these larger pores is larger than 1/3rd and smaller than 1/7th. For a 8 micron pore, the small size
would be 1 micron and less.
8/25/2015 11 George E. King Engineering
GEKEngineering.com

The Effect of Damage on Production
Rate = (DP x k x h) / (141.2 mo bo s)
Where:
DP = differential pressure (drawdown due to skin)
k = reservoir permeability, md
h = height of zone, ft
mo = viscosity, cp
bo = reservoir vol factor
s = skin factor
What are the variables that can be improved, modified or impacted in a positive way? 8/25/2015 12
George E. King Engineering GEKEngineering.com
Productivity and Skin Factor
• Q1/Qo = 7/(7+s)
Where:
Q1 = productivity of zone w/ skin, bpd
Qo = initial productivity of zone, bpd
s = skin factor, dimensionless
Just an estimation, but not too far off between skin numbers of zero and about 15.
8/25/2015 13 George E. King Engineering
GEKEngineering.com
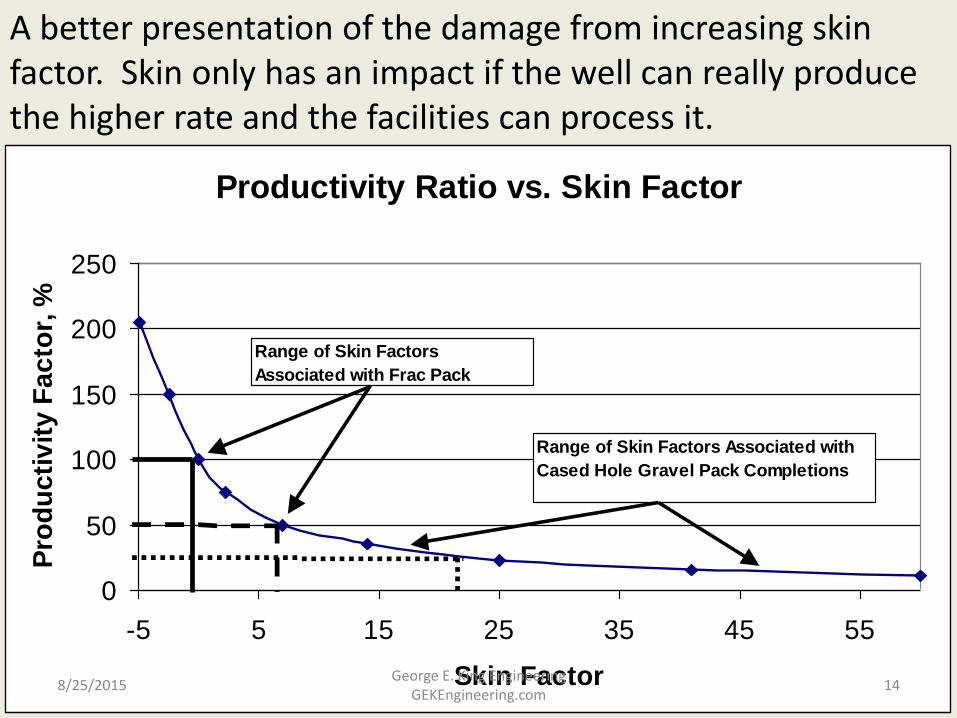
Productivity Ratio vs. Skin Factor
0
50
100
150
200
250
-5 5 15 25 35 45 55
Skin Factor
Pro
du
cti
vit
y F
ac
tor,
%
Range of Skin Factors
Associated with Frac Pack
Range of Skin Factors Associated with
Cased Hole Gravel Pack Completions
A better presentation of the damage from increasing skin factor. Skin only has an impact if the well can really produce the higher rate and the facilities can process it.
8/25/2015 14 George E. King Engineering
GEKEngineering.com
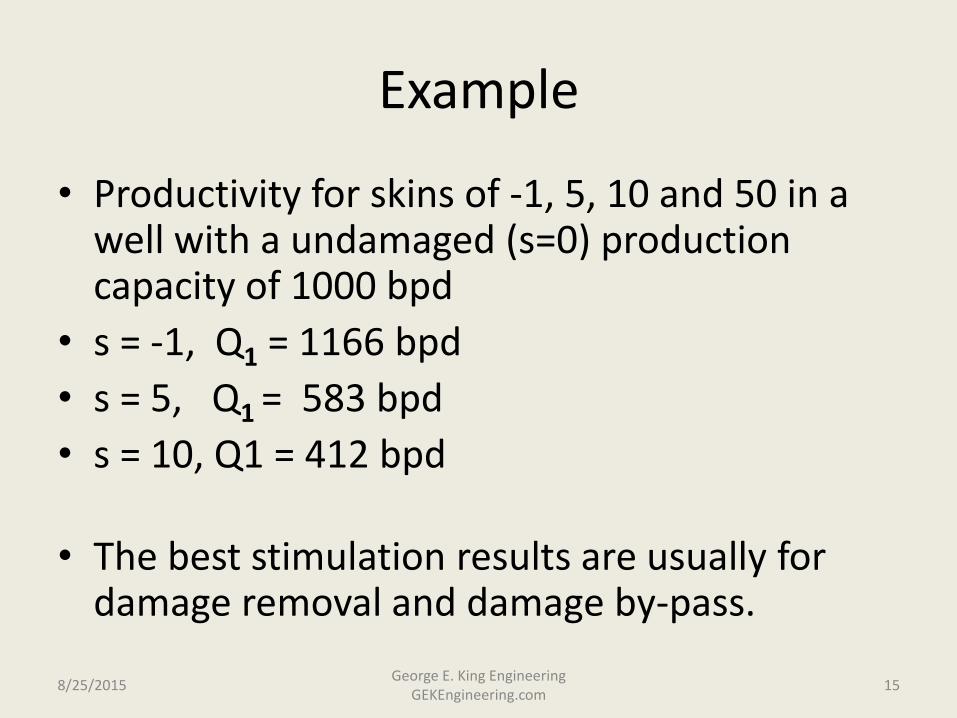
Example
• Productivity for skins of -1, 5, 10 and 50 in a well with a undamaged (s=0) production capacity of 1000 bpd
• s = -1, Q1 = 1166 bpd
• s = 5, Q1 = 583 bpd
• s = 10, Q1 = 412 bpd
• The best stimulation results are usually for damage removal and damage by-pass.
8/25/2015 15
George E. King Engineering GEKEngineering.com

Another way of stating damage - Damage in a horizontal well – increasing skin makes the well behave like the drilled lateral was much shorter.
8/25/2015 16 George E. King Engineering
GEKEngineering.com

Damage Causes
• Obstructions in the natural flow path in the reservoir.
• “Pseudo” damage such as turbulence - very real effect, but no visible obstructions
• “Structural” damage from depletion – matrix compression, etc.
8/25/2015 17 George E. King Engineering
GEKEngineering.com
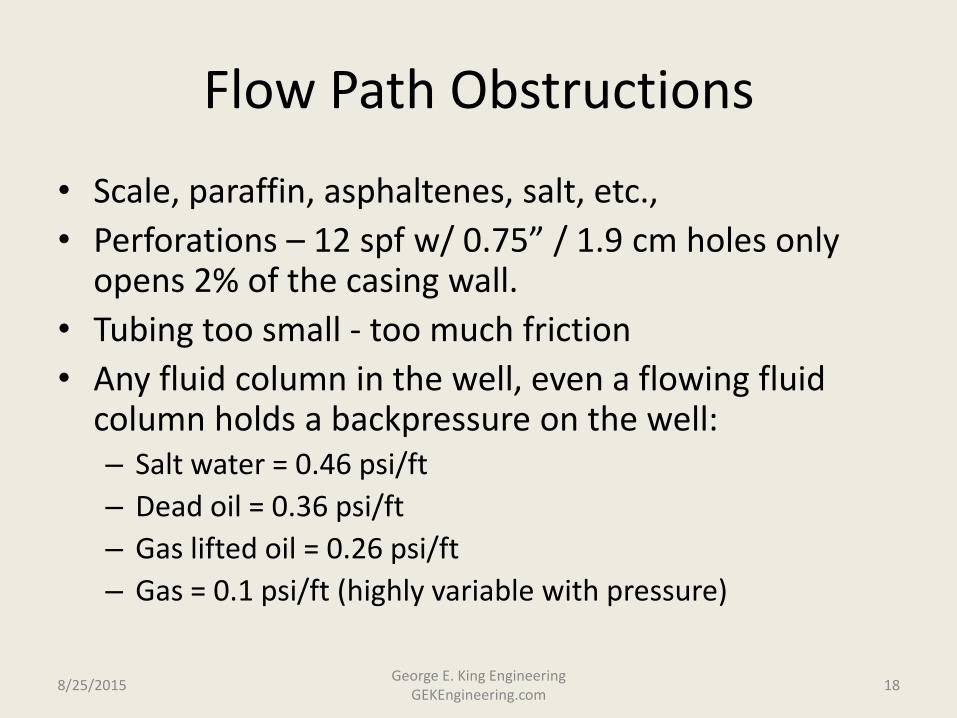
Flow Path Obstructions
• Scale, paraffin, asphaltenes, salt, etc.,
• Perforations – 12 spf w/ 0.75” / 1.9 cm holes only opens 2% of the casing wall.
• Tubing too small - too much friction
• Any fluid column in the well, even a flowing fluid column holds a backpressure on the well: – Salt water = 0.46 psi/ft
– Dead oil = 0.36 psi/ft
– Gas lifted oil = 0.26 psi/ft
– Gas = 0.1 psi/ft (highly variable with pressure)
8/25/2015 18 George E. King Engineering
GEKEngineering.com

“Pseudo” Damage
• Turbulence – high rate wells
– gas zones most affected
• Affected areas: – perfs (too few, too small)
– Near wellbore (tortuosity)
– fracture (conductivity too low)
– tubing (tubing too small, too rough)
– surface (debottle necking needed)
8/25/2015 19 George E. King Engineering
GEKEngineering.com

“Structural” Damage
• Tubular Deposits
– scale
– paraffin
– asphaltenes
– salt
– solids (fill)
– corrosion products
8/25/2015 20 George E. King Engineering
GEKEngineering.com
Perforation Damage
• debris from perforating
• sand in perf tunnel - mixing?
• mud particles
• particles in injected fluids
• pressure drop induced deposits – scales
– asphaltenes
– paraffins
8/25/2015 21 George E. King Engineering
GEKEngineering.com

Near Well Damage
• in-depth plugging by injected particles
• migrating fines
• water swellable clays
• water blocks, water sat. re-establishment
• polymer damage
• wetting by surfactants
• relative permeability problems
• matrix structure collapse
8/25/2015 22 George E. King Engineering
GEKEngineering.com
Deeper Damage
• water blocks
• formation matrix structure collapse
• natural fracture closing
8/25/2015 23 George E. King Engineering
GEKEngineering.com
Other Common Damages
• fines migration (increasing skin)
• water blocks
• scale
• emulsions
• paraffin and asphaltenes
• turbulence – rate dependent skin
• perf debris
• Initial damage from mud and DIF’s 8/25/2015 24
George E. King Engineering GEKEngineering.com

Skin Components and Determination
• Total Skins (s’) = So + Stp + D Q
Where:
So = laminar skin
Stp = 2-phase skin
D = rate dependent skin
Q = rate
8/25/2015 25 George E. King Engineering
GEKEngineering.com

Skin Components and Determination
• Multi-rate tests => So, Stp, D
• B/U Test => total skin, k
• 2 B/U Tests => So, D, k
8/25/2015 26 George E. King Engineering
GEKEngineering.com
Cleaning Damage
• Most damage is removed by simple clean-up flow.
• How much drawdown?
• How long to flow it?
• How soon to flow it?
• To do it?
8/25/2015 27 George E. King Engineering
GEKEngineering.com

Root Causes of Residual Damage After Clean-up Flow….
• High perm formations less affected?
– Major damage removers:
• Flow Rate per unit area,
• Flow Volume per unit area,
• Pressure pulse?
• Drawdown per unit area – a control?
8/25/2015 28 George E. King Engineering
GEKEngineering.com
First Problem
We don’t understand cleanup by flow…
It’s a matter of flow rate and volume through a given area.
8/25/2015 29 George E. King Engineering
GEKEngineering.com

For the same pay
thickness, a horizontal
well or a fractured well
may contact 100’s of
times more pay zone area
than a vertical well.
Now, think about the set drawdown – say
500 psi - per unit area, the velocity
generated, and the total volume per area.
A 10 ft pay in a
vertical well w/ 6”
diameter yields
contact area of 16 ft2
A 1000 ft pay in a
horizontal well w/ 6”
diam. yields contact
area of 1600 ft2
Clean-up flow is
“diluted” by the
length of interval
open at once for
cleanout.
8/25/2015 30 George E. King Engineering
GEKEngineering.com

Which has the potential of cleaning
up faster and more completely?
Vertical well - 500 psi dd and
an inflow of 100 bbl/day/ft
spread out over just 16 ft2 will
generate a clean-up flow of
110 gal per hour per ft.
Horiz. Well – assume 5x more than vertical
flow (typical) – would generate 5000 bpd,
but spread over 1600 ft2 – and release a
clean-up flow of only 3 gal per hour per ft.
1000 bpd
5000 bpd
8/25/2015 31 George E. King Engineering
GEKEngineering.com

Second Problem
• We don’t understand damage.
– How it got there
– How it is removed.
– How to prevent it.
– What operations put the well’s productivity at risk.
8/25/2015 32 George E. King Engineering
GEKEngineering.com
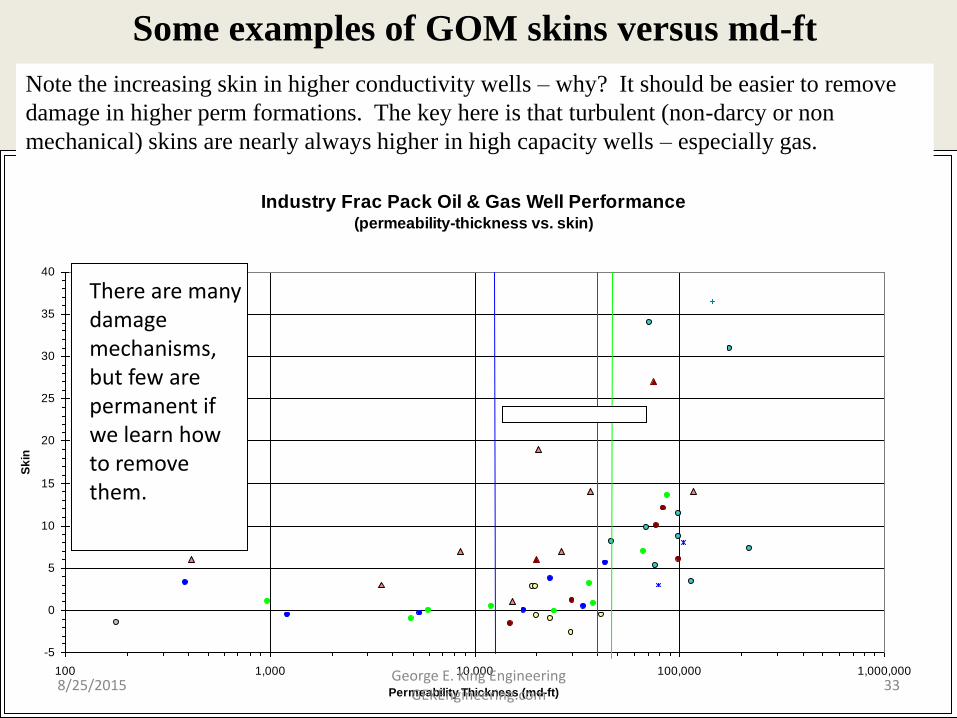
Industry Frac Pack Oil & Gas Well Performance(permeability-thickness vs. skin)
-5
0
5
10
15
20
25
30
35
40
100 1,000 10,000 100,000 1,000,000
Permeability Thickness (md-ft)
Sk
in
Heidrun Gp
Harding Appraisal GP
MC109 Frac-Enzyme - Oil
Pompano - Oil
Mars FP - Oil
Mars HRWP
Marathon Data
Oryx HRWF- HI 379 - Oil & Gas
Elf Hylia X/L + HEC Tail - Oil
Ew ing Bank FP- Oil
DD FF EE
Some examples of GOM skins versus md-ft
Note the increasing skin in higher conductivity wells – why? It should be easier to remove
damage in higher perm formations. The key here is that turbulent (non-darcy or non
mechanical) skins are nearly always higher in high capacity wells – especially gas.
There are many damage mechanisms, but few are permanent if we learn how to remove them.
8/25/2015 33 George E. King Engineering
GEKEngineering.com

Fluid Loss Rate from Pre Workover PI - Alaska
0
500
1000
1500
2000
2500
0 2 4 6 8 10
PI, bbls/day/psi
Da
ily
Lo
ss
, b
bls
SPE 26042
Cleanup examples from Alaska wells – high losses into high PI wells,
but…….
8/25/2015 34 George E. King Engineering
GEKEngineering.com
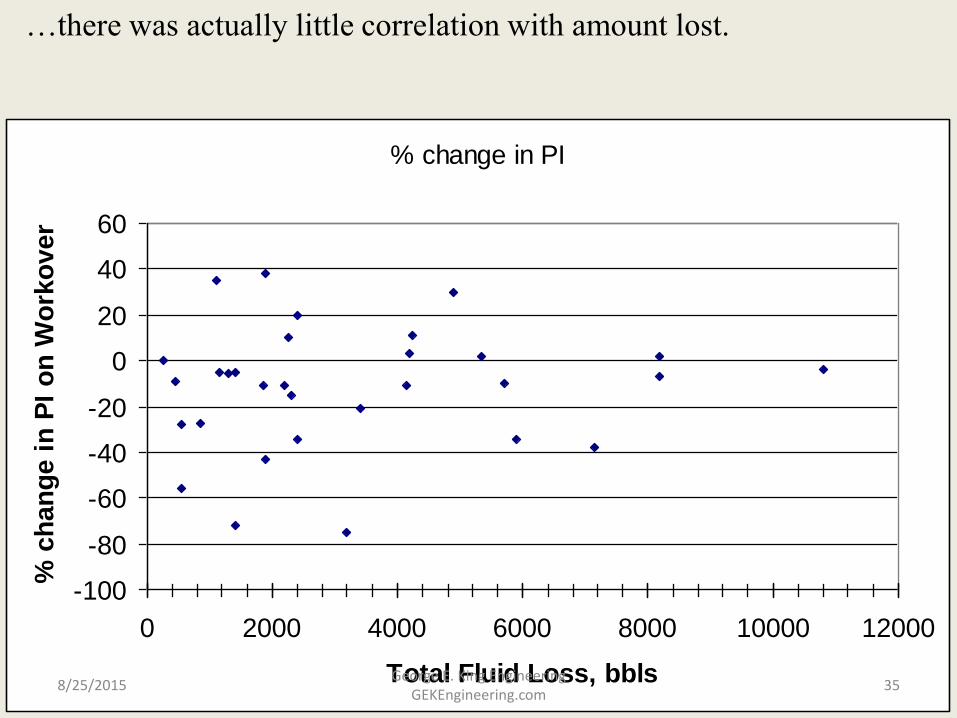
% change in PI
-100
-80
-60
-40
-20
0
20
40
60
0 2000 4000 6000 8000 10000 12000
Total Fluid Loss, bbls
% c
han
ge i
n P
I o
n W
ork
over
…there was actually little correlation with amount lost.
8/25/2015 35 George E. King Engineering
GEKEngineering.com
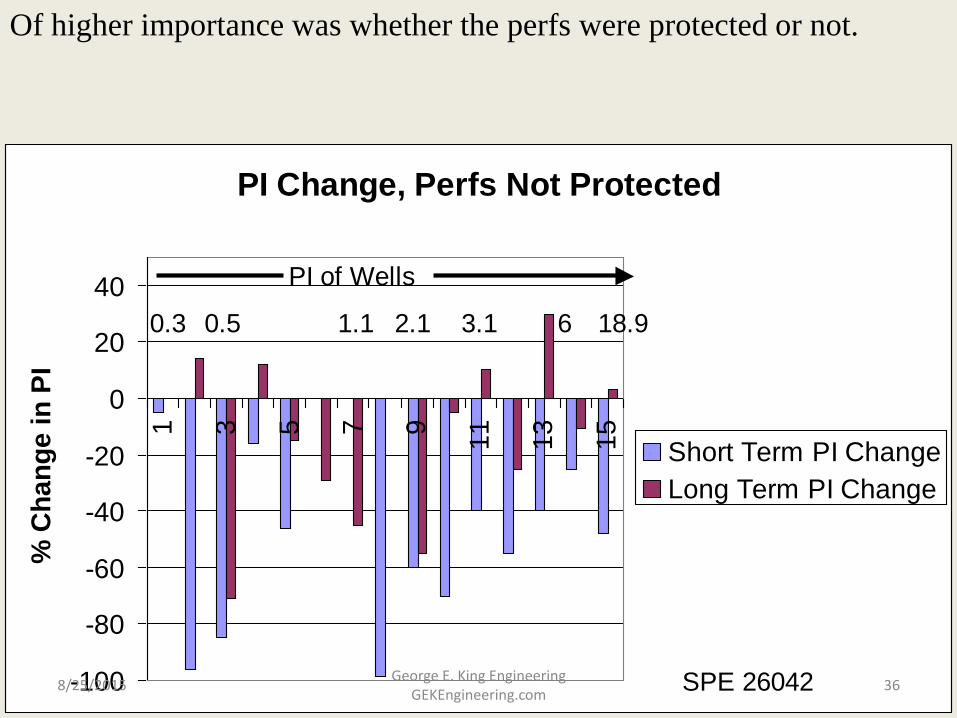
PI Change, Perfs Not Protected
-100
-80
-60
-40
-20
0
20
40
1 3 5 7 9
11
13
15
% C
ha
ng
e i
n P
I
Short Term PI Change
Long Term PI Change
0.3 0.5 1.1 2.1 3.1 6 18.9
PI of Wells
SPE 26042
Of higher importance was whether the perfs were protected or not.
8/25/2015 36 George E. King Engineering
GEKEngineering.com

PI Change After Workover - Perfs Protected
-40
-30
-20
-10
0
10
20
30
40
50
1 2 3 4 5 6 7 8 9 10 11
% C
han
ge in
PI
Short Term PI Change
Long Term PI Change
0.3 1.2 3.1 4.6 8.4
PI of wells
SPE 26042
When perfs were protected, that was little risk of long term damage.
8/25/2015 37 George E. King Engineering
GEKEngineering.com
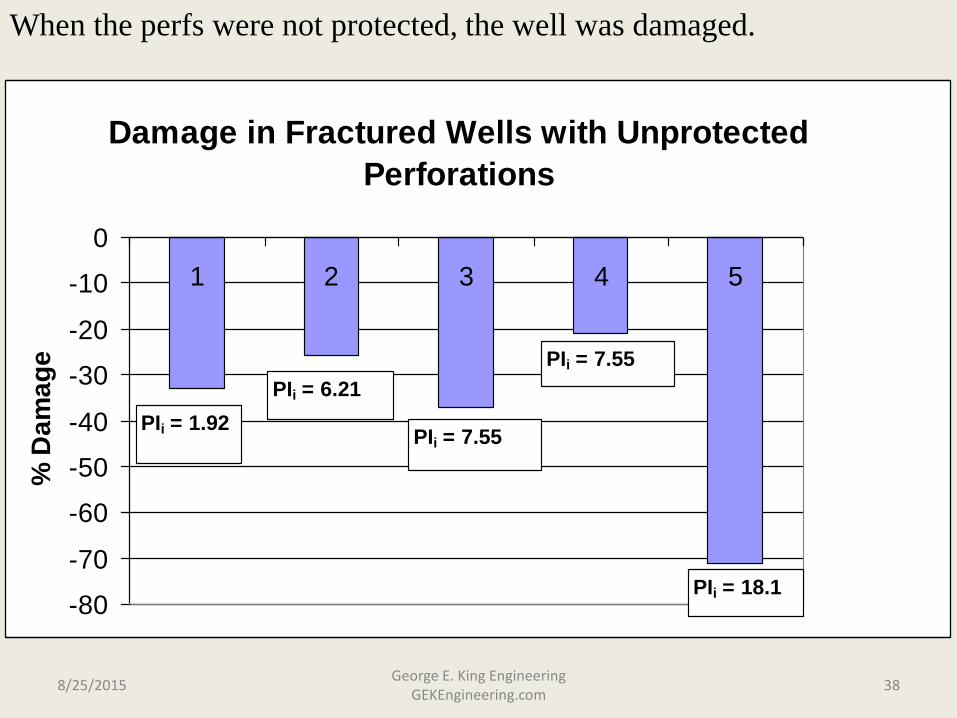
Damage in Fractured Wells with Unprotected
Perforations
-80
-70
-60
-50
-40
-30
-20
-10
0
1 2 3 4 5
% D
am
ag
e
PIi = 1.92
PIi = 6.21
PIi = 7.55
PIi = 7.55
PIi = 18.1
When the perfs were not protected, the well was damaged.
8/25/2015 38 George E. King Engineering
GEKEngineering.com
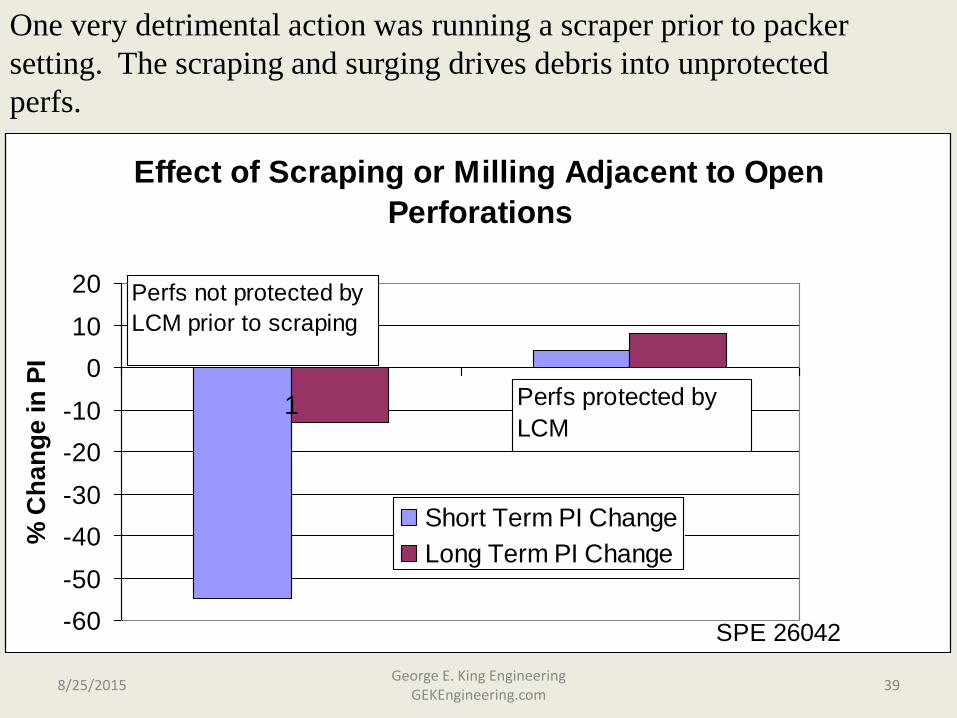
Effect of Scraping or Milling Adjacent to Open
Perforations
-60
-50
-40
-30
-20
-10
0
10
20
1 2
% C
ha
ng
e in
PI
Short Term PI Change
Long Term PI Change
Perfs not protected by
LCM prior to scraping
Perfs protected by
LCM
SPE 26042
One very detrimental action was running a scraper prior to packer
setting. The scraping and surging drives debris into unprotected
perfs.
8/25/2015 39 George E. King Engineering
GEKEngineering.com

Kill Pills: Summary of Overall Effectiveness in
Non Fractured Wells
-25
-20
-15
-10
-5
0
5
10
1 2 3 4 5 6 7
% C
han
ge i
n P
I
Sized Borate Salts
(4)
Cellulose
Fibers (3)
Sized Sodium
Chloride (12)
No Near Perf Milling
(6)
Near Perf Milling or
Scraping (3)
No Near Perf
Milling (8)
SPE 26042
Near Perf Milling
or Scraping (10)
HEC Pills No Pills
Sized particulates, particularly those that can be removed, are much less
damaging than most polymers, even the so-called clean polymers.
8/25/2015 40 George E. King Engineering
GEKEngineering.com
Third Problem
• We don’t know enough about timing of damage removal.
– Variety of causes • Polymer dehydration
• Decomposition of materials
• Adsorption, absorption and capillary effects
• Field data from Troika (100,000 md-ft) show initial flow improves PI, but later flow does not.
8/25/2015 41 George E. King Engineering
GEKEngineering.com

Deepwater Well Cleanup Lessons
• On initial cleanup, PI erratically increased as choke opened. Typical response was a decrease, as if well / flow path were loading up, then sharp PI increase, seemingly when the obstruction was unloaded.
• Little partly broken polymer recovered, but early load water recovery matched PI incr.
• Lower skins were linked to both sand flow before completion (sand surge removed damage), increased cleanup flow volumes (and drawdown) on initial cleanup, and more effective frac stimulations.
8/25/2015 42 George E. King Engineering
GEKEngineering.com

Deepwater Cleanup Lessons
• Wells cleaned up with increasing drawdown immediately following backflow start. Cleanup was increasing, measured by increasing PI, at the end of the first short cleanup periods prior to shut-in of the well.
• After initiation of production operations - after first cleanup flow, no further cleanup of damage was seen, regardless of drawdown. The reason is not known, but may be due to polymer adhering or cooking out?
8/25/2015 43
George E. King Engineering GEKEngineering.com
Fourth Problem
• We don’t understand how damage impacts economic return.
8/25/2015 44 George E. King Engineering
GEKEngineering.com
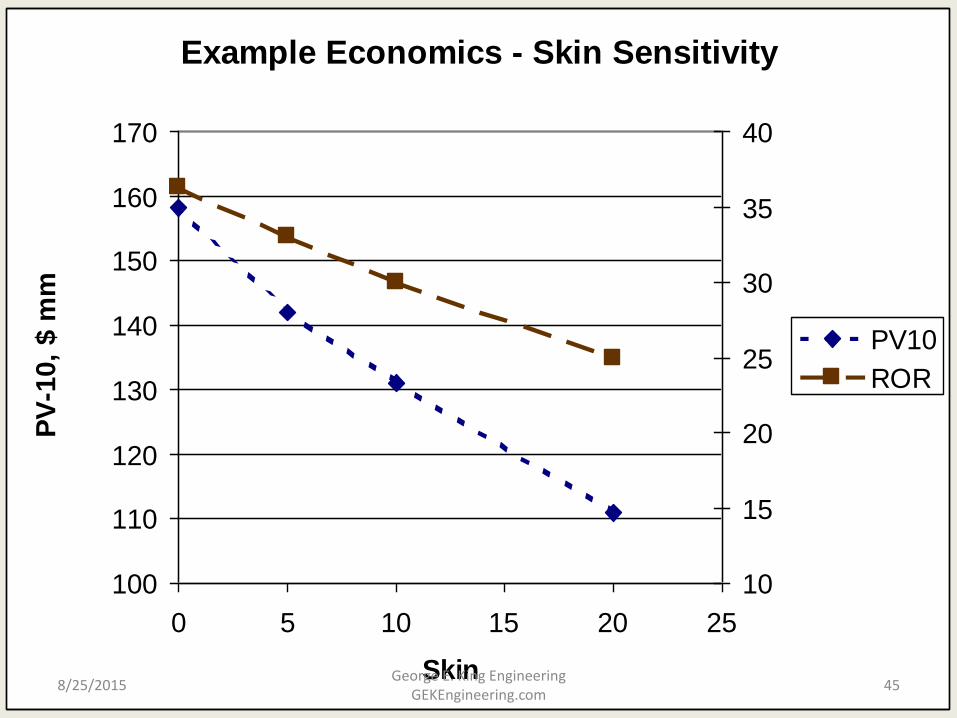
Example Economics - Skin Sensitivity
100
110
120
130
140
150
160
170
0 5 10 15 20 25
Skin
PV
-10,
$ m
m
10
15
20
25
30
35
40
PV10
ROR
8/25/2015 45 George E. King Engineering
GEKEngineering.com

An example of a completion method that minimizes damage.
• Perforating, but with enough underbalance to create the flow necessary to clean the perforations.
8/25/2015 46 George E. King Engineering
GEKEngineering.com
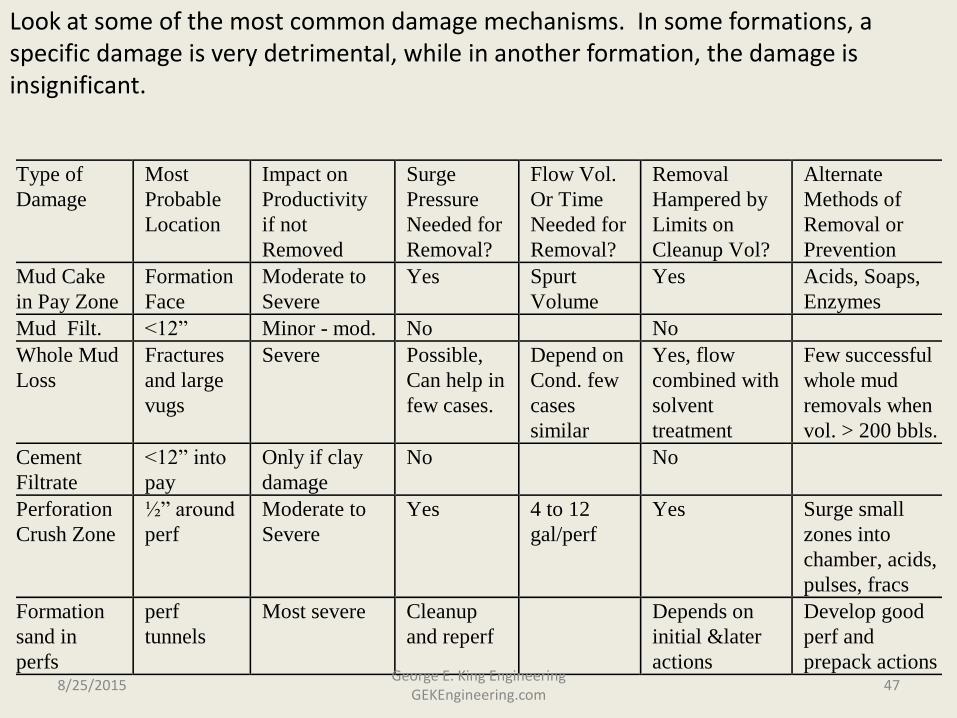
Type of
Damage
Most
Probable
Location
Impact on
Productivity
if not
Removed
Surge
Pressure
Needed for
Removal?
Flow Vol.
Or Time
Needed for
Removal?
Removal
Hampered by
Limits on
Cleanup Vol?
Alternate
Methods of
Removal or
Prevention
Mud Cake
in Pay Zone
Formation
Face
Moderate to
Severe
Yes Spurt
Volume
Yes Acids, Soaps,
Enzymes
Mud Filt. <12” Minor - mod. No No
Whole Mud
Loss
Fractures
and large
vugs
Severe Possible,
Can help in
few cases.
Depend on
Cond. few
cases
similar
Yes, flow
combined with
solvent
treatment
Few successful
whole mud
removals when
vol. > 200 bbls.
Cement
Filtrate
<12” into
pay
Only if clay
damage
No No
Perforation
Crush Zone
½” around
perf
Moderate to
Severe
Yes 4 to 12
gal/perf
Yes Surge small
zones into
chamber, acids,
pulses, fracs
Formation
sand in
perfs
perf
tunnels
Most severe Cleanup
and reperf
Depends on
initial &later
actions
Develop good
perf and
prepack actions
Look at some of the most common damage mechanisms. In some formations, a specific damage is very detrimental, while in another formation, the damage is insignificant.
8/25/2015 47 George E. King Engineering
GEKEngineering.com

Type of Damage Skin range Comments
Mud Cake in Pay
Zone
+5 to +300,
+15 is typical
Mud skin is usually shallow and has more impact when
turbulence and non-darcy skin problems are most severe. Mud
cake is usually by-passed by perforating.
Mud Filtrate +3 to +30 Filtrate usually recovered by steady flow and time. Related to
relative perm effects. This is usually a short lived problem (1 to
3 weeks)
Whole Mud Loss (in
pay zone)
>+50 Options depend on mud volume lost. Enzymes, solvents and
acids for small volumes (<10 bbls). Sidetrack if over 1000 bbls.
Low solids mud can be removed by concentrating on viscosifier
destruction or dispersment.
Cement Filtrate +10 to +20 Very shallow clay problems. Perforate with deep penetrating
charges to get beyond. Use leakoff control on cement.
Perforation Crush
Zone
+10 to +20 Perf small intervals underbalanced. Isolation packer breaksown,
explosive sleeve breakdown (very simple) - must be
accomplished prior to gravel packing.
Formation sand in
perfs
>+50 Most severe typical damage - cleanout and recompletion
required
When looking at the range of skins, it is useful to know that some wells have high skins but are really restricted by other factors such as tubing flow limits, facility limits, etc., and are not really limited by the skins.
8/25/2015 48 George E. King Engineering
GEKEngineering.com
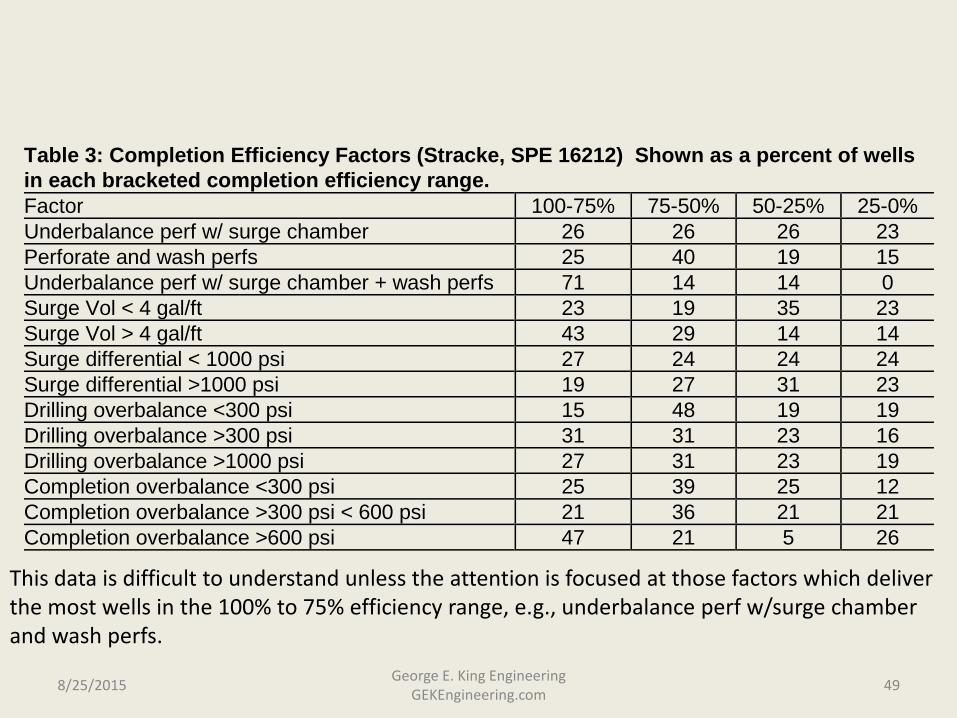
Table 3: Completion Efficiency Factors (Stracke, SPE 16212) Shown as a percent of wells
in each bracketed completion efficiency range.
Factor 100-75% 75-50% 50-25% 25-0%
Underbalance perf w/ surge chamber 26 26 26 23
Perforate and wash perfs 25 40 19 15
Underbalance perf w/ surge chamber + wash perfs 71 14 14 0
Surge Vol < 4 gal/ft 23 19 35 23
Surge Vol > 4 gal/ft 43 29 14 14
Surge differential < 1000 psi 27 24 24 24
Surge differential >1000 psi 19 27 31 23
Drilling overbalance <300 psi 15 48 19 19
Drilling overbalance >300 psi 31 31 23 16
Drilling overbalance >1000 psi 27 31 23 19
Completion overbalance <300 psi 25 39 25 12
Completion overbalance >300 psi < 600 psi 21 36 21 21
Completion overbalance >600 psi 47 21 5 26
This data is difficult to understand unless the attention is focused at those factors which deliver the most wells in the 100% to 75% efficiency range, e.g., underbalance perf w/surge chamber and wash perfs.
8/25/2015 49 George E. King Engineering
GEKEngineering.com

Table 4: Perforation Tunnel Volume Following Perforating at Different Conditions
(Regalbuto and Riggs, SPE PE, Feb 1988)
Pressure Differential Hole Volume, perforated Hole Volume, perforated/surged
Overbalanced,500 psi, no surge
18 cc
Balanced perforated, no surge 31 cc
Underbalanced perforated, 500psi
20 cc 42 cc
Balanced perforated, delayed1000 psi surge
31 cc 48 cc
Underbalanced perforated, 1000psi
50 cc 75 cc
Notice that underbalance perforating at high underbalance (which causes flow) delivers a perforation that is from 40% to nearly 300% larger than the other methods of perforating.
8/25/2015 50 George E. King Engineering
GEKEngineering.com

Back to over-all damage – What is it?
• Divide the well into three parts: – Inflow: area from reservoir to the wellbore
– Completion potential: flow to surface
– Surface restrictions: chokes, lines, separators.
• Basically, anything that causes a restriction in the flow path decreases the rate and acts as “damage.”
8/25/2015 51 George E. King Engineering
GEKEngineering.com

4600 psi
1000 psi 15 psi
10 psi
25 psi
100 psi
Column Densities:
Gas = 1.9 lb/gal = 0.1 psi/ft = 1900 psi in a 10,000 ft well
Dead oil = 7 lb/gal = 0.364 psi/ft = 3640 psi in a 10,000 ft well
Fresh water = 8.33 lb/gal = 0.433 psi/ft = 4330 psi in a 10,000 ft well
Salt water = 10 lb/gal = 0.52 psi/ft = 5200 psi in a 10,000 ft well
Gas cut flowing oil = 5 lb/gal = 0.26 psi/ft = 2600 psi in a 10,000 ft well
10,000 ft
Press.
Drop
Differential pressure, DP, is actually a pressure balance
4600 psi reservoir pressure
-2600 psi flowing gradient for oil
- 150 psi press drop
- 100 psi through the choke
- 25 psi through the flow line
- 10 psi through the separator
- 15 psi through downstream flow line
-1000 psi sales line entry pressure
----------------------
DP = 700 psi drawdown pressure
Where does
the DP come
from?
1000
8/25/2015 52 George E. King Engineering
GEKEngineering.com
The first step…..
• For the purposes of this work, consider the flow connection between the reservoir and the wellbore as the primary but not the only area of damage.
• Now, is it “formation damage” or something else that causes the restriction?
8/25/2015 53 George E. King Engineering
GEKEngineering.com
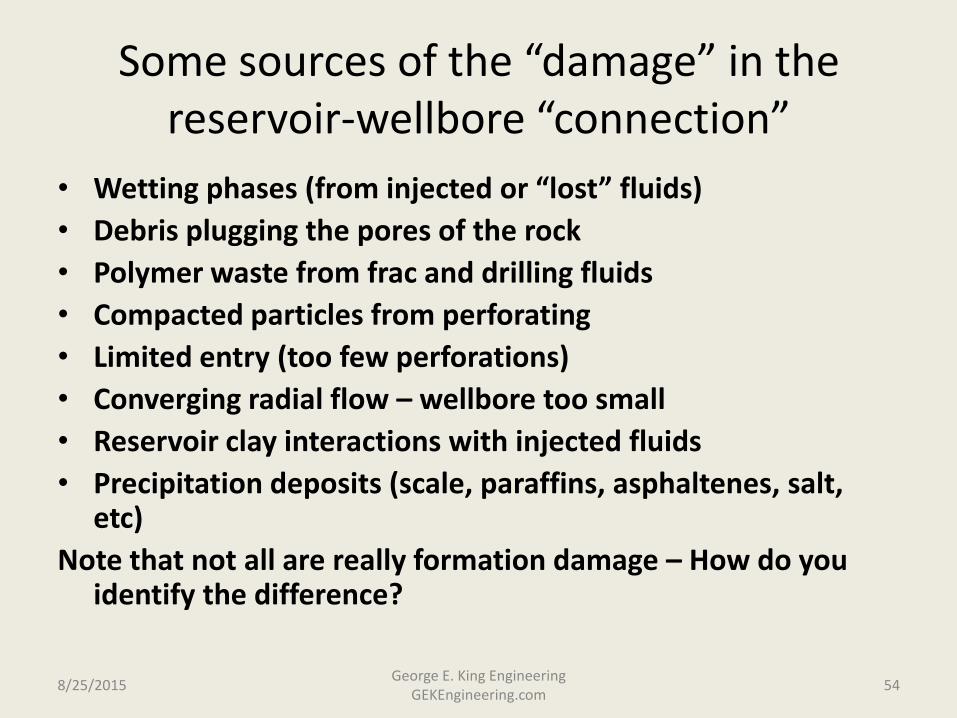
Some sources of the “damage” in the reservoir-wellbore “connection”
• Wetting phases (from injected or “lost” fluids)
• Debris plugging the pores of the rock
• Polymer waste from frac and drilling fluids
• Compacted particles from perforating
• Limited entry (too few perforations)
• Converging radial flow – wellbore too small
• Reservoir clay interactions with injected fluids
• Precipitation deposits (scale, paraffins, asphaltenes, salt, etc)
Note that not all are really formation damage – How do you identify the difference?
8/25/2015 54 George E. King Engineering
GEKEngineering.com
0
2
4
6
8
10
12
14
16
18
20
Tg 308 Tg 312bis Tg 315bis Teg 15y tg 307ter Tg 305bisz Teg 14z Teg 11z Teg 12z Teg 10z
To
tal S
kin
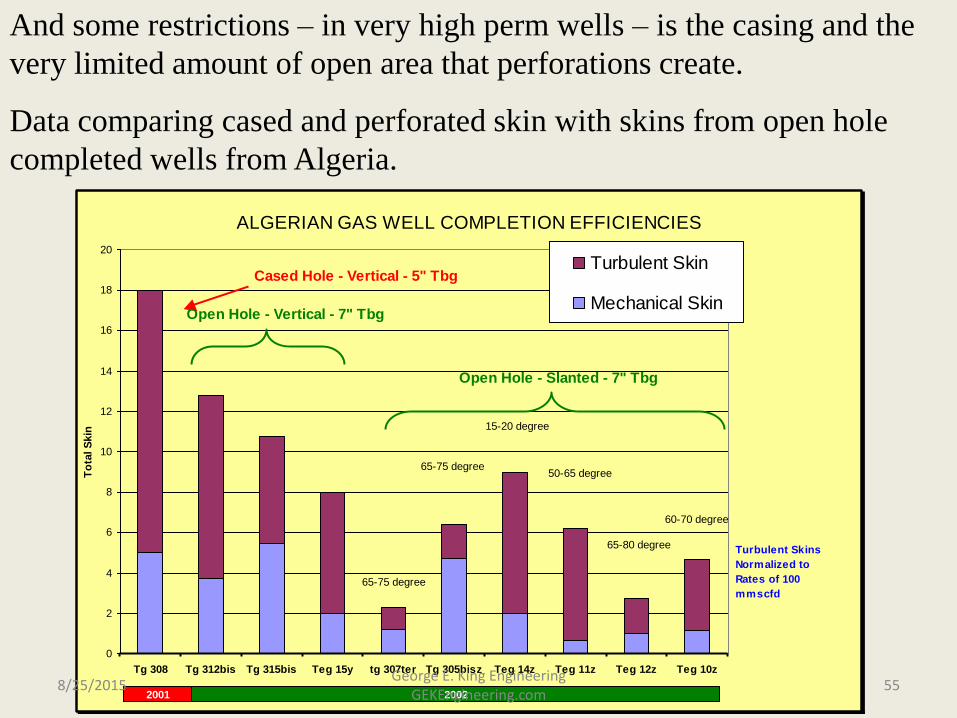
Turbulent Skin
Mechanical Skin
Cased Hole - Vertical - 5" Tbg
Open Hole - Vertical - 7" Tbg
Open Hole - Slanted - 7" Tbg
2001 2002
Turbulent Skins
Normalized to
Rates of 100
mmscfd
65-75 degree
15-20 degree
65-80 degree
50-65 degree
ALGERIAN GAS WELL COMPLETION EFFICIENCIES
60-70 degree
65-75 degree
And some restrictions – in very high perm wells – is the casing and the
very limited amount of open area that perforations create.
Data comparing cased and perforated skin with skins from open hole
completed wells from Algeria.
8/25/2015 55 George E. King Engineering
GEKEngineering.com

Identification of Damage.
• How good are you at deductive reasoning? – Identifying the cause and source of damage is
detective work. • Look at the well performance before the problem
• Look at the flow path for potential restrictions
• Look to the players: – Flow path ways
– Fluids
– Pressures
– Flow rate
8/25/2015 56 George E. King Engineering
GEKEngineering.com

What is Completion Efficiency?
• A measure of the effectiveness of a completion as measured against an ideal completion with no pressure drops.
• Pressure drops? – these are the restrictions, “damage”, heads, back-pressures, etc. that restrict the well’s production.
8/25/2015 57 George E. King Engineering
GEKEngineering.com

Look again - The Effect of Damage on
Production Rate = (DP x k x h) / (141.2 mo bo s)
Where:
DP = differential pressure (drawdown due to skin)
k = reservoir permeability, md
h = height of zone, ft
mo = viscosity, cp
bo = reservoir vol factor
s = skin factor
8/25/2015 58 George E. King Engineering
GEKEngineering.com
What changeable factors control production rate?
• Pressure drop – need maximum drawdown and minimum backpressures.
• Permeability - enhance or restore k? - yes
• Viscosity – can it be changed? – yes
• Skin – can it be made negative?
• These factors are where we start our stimulation design.
8/25/2015 59 George E. King Engineering
GEKEngineering.com
Formation Damage
• Impact
• Causes
• Diagnosis
• Removal/Prevention?
• Basically, the severity of damage on production depends on the location, extent and type of the damage. A well can have significant deposits, fill and other problems that do not affect production.
8/25/2015 60 George E. King Engineering
GEKEngineering.com
Conclusions
• Damage is usually shallow.
• Remove it or by-pass damage if it really causes a problem.
• Not every “damage” is in the formation.
• Not every drop in production is caused by damage.
• First, remove the pressure drops, everything else will take care of itself.
8/25/2015 61 George E. King Engineering
GEKEngineering.com


