
College of the Sequoias Master Plan 2015- 2025Chapter 2, Draft #3
CHAPTER 2: PROFILE OF THE DISTRICT’S COMMUNITIES AND STUDENTS
INDEX OF DATA SETS
INTRODUCTION
REGIONAL POPULATION TRENDS AND DEMOGRAPHICS
LOCAL ECONOMIC TRENDS
ENROLLMENT TRENDS
STUDENT DEMOGRAPHICS
STUDENT OUTCOMES
PERCEPTIONS
CURRENT AND ANTICIPATED CHALLENGES
1

College of the Sequoias Master Plan 2015- 2025Chapter 2, Draft #3
INDEX OF DATA SETS
REGIONAL POPULATION TRENDS AND DEMOGRAPHICSData Set 1. Current and Projected COS Service Area PopulationData Set 2. Current and Projected COS Service Area Population by Age Data Set 3. Current and Projected COS Service Area Population by Race/EthnicityData Set 4. COS Service Area Language Spoken at Home by Residents Age 5 and OlderData Set 5. COS Service Area Level of Educational Attainment for Adult Residents
LOCAL ECONOMIC TRENDS Data Set 6. COS Service Area Median Household IncomeData Set 7. Employment Projections by IndustryData Set 8. Employment Forecast for Tulare and Kings Counties Data Set 9. Largest Growing Occupations by Required Entry-level EducationData Set 10. National Earnings and Unemployment Rates by Educational Attainment
ENROLLMENT TRENDSData Set 11. Student Headcount and FTESData Set 12. Student Headcount by Site Data Set 13. Course Enrollments by SiteData Set 14. Efficiency by DisciplineData Set 15. Student Headcount by Area of ResidenceData Set 16. Student Headcount by Number of UnitsData Set 17. Student Headcount by Method of Instruction
STUDENT DEMOGRAPHICSData Set 18. Student Headcount by Age and SiteData Set 19. Comparison of District and Statewide Headcount by Age Data Set 20. Student Headcount by Gender and SiteData Set 21. Student Headcount by Race/Ethnicity and SiteData Set 22. Comparison of District and Statewide Headcount by Race/Ethnicity Data Set 23. Student Headcount by First Generation College Student StatusData Set 24. Placement of First-time Students
STUDENT OUTCOMESData Set 25. Student Success Scorecard: Completion RatesData Set 26. Student Success Scorecard: Completion Rates by AgeData Set 27. Student Success Scorecard: Completion and 30 Units Rates by PreparednessData Set 28. Student Success Scorecard: Basic Skills RatesData Set 29. Student Success Scorecard: Career Technical Education RatesData Set 30. Student Retention Rates in Credit Courses Data Set 31. Student Successful Course Completion Rates in Credit CoursesData Set 32. Students’ Successful Course Completion Rates by Race/Ethnicity
2

College of the Sequoias Master Plan 2015- 2025Chapter 2, Draft #3
Data Set 33. Students’ Successful Course Completion Rates by AgeData Set 34. Students’ Successful Course Completion Rates by Unit LoadData Set 35. Student Degree Completion by Race/EthnicityData Set 36. Student Certificate Completion by Race/Ethnicity
PERCEPTIONSData Set 37. Community PerceptionsData Set 38. Community College Survey of Student EngagementData Set 39. Community College Faculty Survey of Student Engagement
3

College of the Sequoias Master Plan 2015- 2025Chapter 2, Draft #3
INTRODUCTION
This chapter provides background information about the demographic and economic characteristics of the District’s service area and its students. These data are clustered in six sections:
1. Regional Population Demographics: Current and projected demographic characteristics, such as population, age, race/ethnicity, and educational levels, and income;
2. Local Economic Trends: Current and projected employment and industry growth patterns;
3. Enrollment Trends: Patterns of student enrollment, such as student headcount by site and by method of instruction;
4. Student Demographics: Characteristics of the District’s students, such as age, race/ethnicity, and educational goals;
5. Student Achievement: Measures of student achievement within the District, such as persistence, successful course completion rates, and number of awards; and
6. Perceptions: Survey results, such as a recent survey of community perceptions about the District and students’ perceptions about their level of engagement in the teaching/learning process.
The final section of this chapter, Current and Anticipated Challenges, presents an analysis of the data presented in Chapters 1 and 2 that identifies the challenges that the District will be called upon to address in the coming decade.
The data sets in Chapters 1 and 2 are extracted from a variety of resources including state agencies, local agencies, the COS data warehouse, and the COS Office of Research, Planning and Institutional Effectiveness. The specific resource for the information presented in a data set is cited at the bottom of each data set.
4

College of the Sequoias Master Plan 2015- 2025Chapter 2, Draft #3
REGIONAL POPULATION TRENDS AND DEMOGRAPHICS
Data Set 1. Current and Projected COS Service Area Population
2010 2020 2025 2030 % Growth from 2010 to 2030
Kings County 152,656 176,647 192,147 205,627 35%Tulare County 443,066 526,718 575,294 630,303 42%
California 37,309,382 40,643,643 42,451,760 44,279,354 19%Source: California Department of Finance, http://www.dof/ca/gov/research/demographic/reports/projections/P-1/
The number of residents living in Kings County is projected to increase 35% between 2010 and 2030 and in Tulare County by 42% in the same time period.
Each of these increases is an average increase of about 1.5% each year for the next twenty years, which is double the projection that the state population will increase 19% total, or 0.7% per year compounded, over the next twenty years. In other words, COS Service Area population will grow much faster than the state population.
5

College of the Sequoias Master Plan 2015- 2025Chapter 2, Draft #3
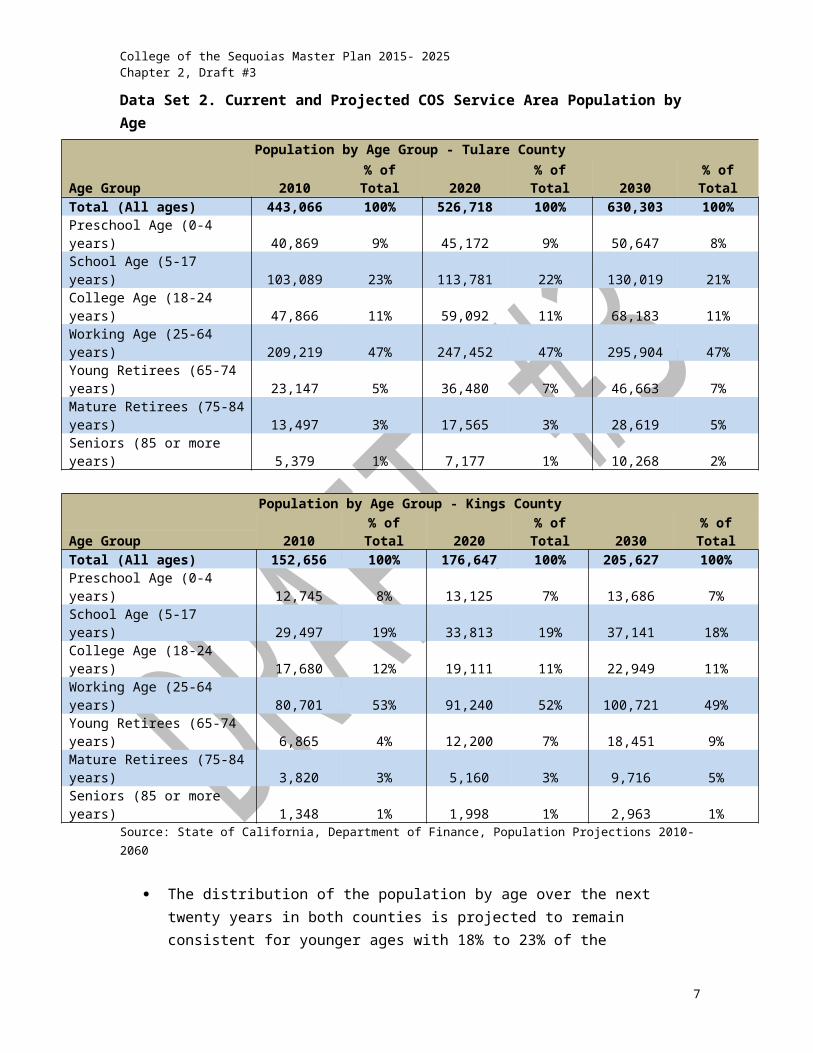
Data Set 2. Current and Projected COS Service Area Population by Age
Population by Age Group - Tulare County
2010 % of Total 2020 % of Total 2030 % of TotalAge GroupTotal (All ages) 443,066 100% 526,718 100% 630,303 100%
Preschool Age (0-4 years) 40,869 9% 45,172 9% 50,647 8%School Age (5-17 years) 103,089 23% 113,781 22% 130,019 21%College Age (18-24 years) 47,866 11% 59,092 11% 68,183 11%Working Age (25-64 years) 209,219 47% 247,452 47% 295,904 47%Young Retirees (65-74 years) 23,147 5% 36,480 7% 46,663 7%Mature Retirees (75-84 years) 13,497 3% 17,565 3% 28,619 5%Seniors (85 or more years) 5,379 1% 7,177 1% 10,268 2%
Population by Age Group - Kings County
2010 % of Total 2020 % of Total 2030 % of TotalAge GroupTotal (All ages) 152,656 100% 176,647 100% 205,627 100%Preschool Age (0-4 years) 12,745 8% 13,125 7% 13,686 7%School Age (5-17 years) 29,497 19% 33,813 19% 37,141 18%College Age (18-24 years) 17,680 12% 19,111 11% 22,949 11%Working Age (25-64 years) 80,701 53% 91,240 52% 100,721 49%Young Retirees (65-74 years) 6,865 4% 12,200 7% 18,451 9%Mature Retirees (75-84 years) 3,820 3% 5,160 3% 9,716 5%Seniors (85 or more years) 1,348 1% 1,998 1% 2,963 1%
Source: State of California, Department of Finance, Population Projections 2010-2060
The distribution of the population by age over the next twenty years in both counties is projected to remain consistent for younger ages with 18% to 23% of the population school age and 11% to 12% of the population college age.
The proportion of the population age 65 and older is projected to increase slightly over the next twenty years.
6
College of the Sequoias Master Plan 2015- 2025Chapter 2, Draft #3
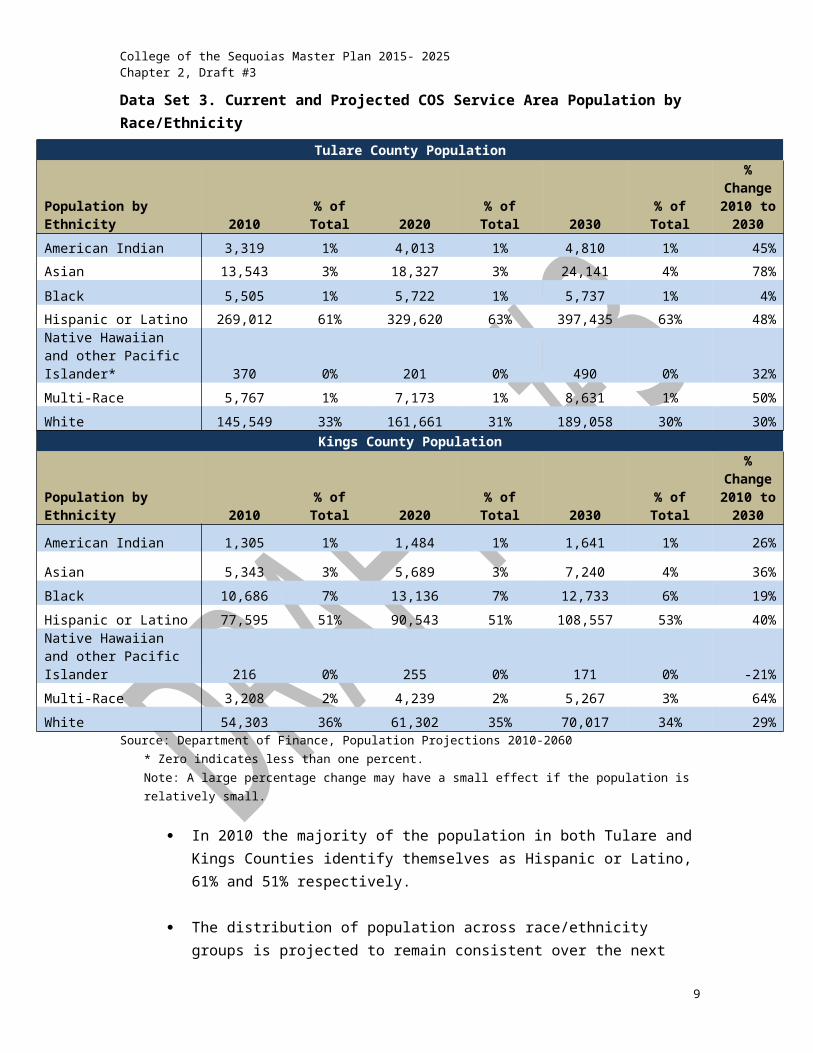
Data Set 3. Current and Projected COS Service Area Population by Race/Ethnicity
Tulare County Population
Population by Ethnicity 2010 % of Total 2020 % of Total 2030 % of Total
% Change 2010 to
2030
American Indian 3,319 1% 4,013 1% 4,810 1% 45%
Asian 13,543 3% 18,327 3% 24,141 4% 78%
Black 5,505 1% 5,722 1% 5,737 1% 4%
Hispanic or Latino 269,012 61% 329,620 63% 397,435 63% 48%Native Hawaiian and other Pacific Islander* 370 0% 201 0% 490 0% 32%
Multi-Race 5,767 1% 7,173 1% 8,631 1% 50%
White 145,549 33% 161,661 31% 189,058 30% 30%Kings County Population
Population by Ethnicity 2010 % of Total 2020 % of Total 2030 % of Total
% Change 2010 to
2030
American Indian 1,305 1% 1,484 1% 1,641 1% 26%
Asian 5,343 3% 5,689 3% 7,240 4% 36%
Black 10,686 7% 13,136 7% 12,733 6% 19%
Hispanic or Latino 77,595 51% 90,543 51% 108,557 53% 40%Native Hawaiian and other Pacific Islander 216 0% 255 0% 171 0% -21%
Multi-Race 3,208 2% 4,239 2% 5,267 3% 64%
White 54,303 36% 61,302 35% 70,017 34% 29%Source: Department of Finance, Population Projections 2010-2060
* Zero indicates less than one percent.Note: A large percentage change may have a small effect if the population is relatively small.
In 2010 the majority of the population in both Tulare and Kings Counties identify themselves as Hispanic or Latino, 61% and 51% respectively.
The distribution of population across race/ethnicity groups is projected to remain consistent over the next twenty years, other than a slight increase in residents who identify themselves as Hispanic or Latino and a slight decrease in residents who identify themselves as White.
7

College of the Sequoias Master Plan 2015- 2025Chapter 2, Draft #3
Data Set 4. COS Service Area Language Spoken at Home by Residents Age 5 and Older
Language Spoken at HomeCalifornia Tulare County Kings County
Estimate Percent Estimate Percent Estimate Percent
English only 19,651,209 56% 207,274 52% 80,161 58%
Language other than English 15,130,082 44% 193,438 48% 59,002 42%
Source: U.S. Census Bureau, 2008-2012 American Community Survey
Forty-eight percent of the residents in Tulare County over the age of five who speak a language other than English at home compared to 42% in Kings County and 44% statewide.
Data Set 5a. COS Service Area Level of Educational Attainment for Adult Residents
Educational AttainmentCalifornia Tulare County Kings County
Estimate Percent Estimate Percent Estimate PercentLess than 9th grade 2,487,399 10% 51,789 21% 14,263 16%
9th to 12th grade, no diploma 2,090,094 9% 28,381 11% 12,198 13%High school graduate (includes equivalency) 4,988,559 29% 59,653 24% 23,985 26%
Some college, no degree 5,345,201 22% 58,137 23% 23,075 25%
Associate's degree 1,861,509 8% 19,691 8% 7,154 8%
Bachelor's degree 4,667,570 20% 22,355 9% 8,459 9%
Graduate or professional degree 2,676,985 11% 11,014 4% 2,962 3%
Percent high school graduate or higher 81% 68% 71%
Percent bachelor's degree or higher 31% 13% 12%Source: U.S. Census Bureau, 2008-2012 American Community Survey
Thirty-two percent of the residents in Tulare County and 29% of the residents in Kings County who are age 25 and older have not graduated from high school compared to 19% statewide.
8
College of the Sequoias Master Plan 2015- 2025Chapter 2, Draft #3
The proportion of adults age 25 and older that have some college education is comparable in Tulare County, Kings County and statewide, ranging from 22% to 25%. The proportion of adults that have earned an associate degree is 8% for Tulare County, Kings County and statewide.
The proportions of adults in Tulare County and Kings County that have earned a bachelor’s degree or higher (13% and 12% respectively) is significantly below the statewide rate of 31% for this level of educational attainment.
9

College of the Sequoias Master Plan 2015- 2025Chapter 2, Draft #3
Data Set 5b. College Readiness: 12th Grade Graduates Completing All Courses Required for UC and/or CSU Entrance
2007-08 2008-09 2009-10 2010-11 2011-12Tulare County Graduates
Grads with UC/CSU Required Courses 1,258 1,194 1,058 1,546 1,743
All Grads 4,899 5,068 5,380 5,485 5,711Rate 26% 24% 20% 28% 31%Kings County Graduates
Grads with UC/CSU Required Courses 276 305 252 404 301
All Grads 1345 1516 1520 1632 1695Rate 21% 20% 17% 25% 18%Statewide Totals-GraduatesStatewide Rate 34% 35% 36% 37% 38%
Source: California Department of Education, Data Reporting Officehttp://dq.cde.ca.gov/dataquest/cogradnum.asp?cChoice=CoGrdEth&cYear=2011-12&TheCounty=16%2CKINGS&ProgramName=All&cTopic=Graduates&cLevel=County&myTimeFrame=S
To be eligible to apply for admission to the UC and CSU systems, california high school students must complete 30 semesters of UC approved coursework in seven subject areas (the a-g course sequence) with grades of C or higher. UC/ CSU a-g standards are much more rigorous than California’s minimum graduation requirement. The majority of California highs scholl graduates do not complete the a-g course sequence.Source: http://www.ppic.org/content/pubs/report/R_413JBR.pdf
In this review of the past five academic years, the proportions of Kings County and Tulare County 12th grade graduates who completed all courses required for UC and/ or CSU entrance have consistently been below the state rates, which ranged from 34% to 38%.
10

College of the Sequoias Master Plan 2015- 2025Chapter 2, Draft #3
LOCAL ECONOMIC TRENDS
Data Set 6a. COS Service Area Median Household Income
Median IncomeCalifornia Tulare County Kings County
Estimate Percent Estimate Percent Estimate Percent
Families 8,550,034 100% 102,374 100% 31,787 100%
Less than $10,000 359,919 4.20% 7,212 7.20% 2,131 6.70%
$10,000 to $14,999 271,387 3.20% 5,344 6.80% 1,148 3.60%
$15,000 to $24,999 700,897 8.20% 13,142 13.60% 3,456 10.90%
$25,000 to $34,999 719,052 8.40% 13,132 12.80% 3,763 11.80%
$35,000 to $49,999 1,022,505 12.00% 14,876 15.30% 4,954 15.60%
$50,000 to $74,999 1,469,246 17.20% 19,298 18.30% 6,124 19.30%
$75,000 to $99,999 1,128,984 13.20% 10,974 10.00% 3,370 10.60%
$100,000 to $149,999 1,466,601 17.20% 12,098 10.30% 4,503 14.20%
$150,000 to $199,999 679,964 8.00% 3,858 3.50% 1,545 4.90%
$200,000 or more 731,479 8.60% 2,440 2.20% 793 2.50%
Median family income (dollars) 69,883 (X) 47,003 (X) 51,575 (X)
Mean family income (dollars) 94,829 (X) 62,533 (X) 67,193 (X)
Source: U.S. Census Bureau, 2008-2012 American Community Survey
As measured by both median and mean, statewide family income is significantly higher than the median and mean family income levels for residents in Tulare County and Kings County.
Data Set 6b. COS Service Area Family Poverty Levels
11

College of the Sequoias Master Plan 2015- 2025Chapter 2, Draft #3
Percentage of Families Whose Income in the Past 12 Months is Below the Poverty LevelCalifornia Tulare County Kings County
All families 11.50% 20.50% 17.10%With related children under 18 years 17.00% 28.80% 24.30%With related children under 5 years only 15.10% 28.20% 21.00%Married couple families 6.90% 13.90% 9.80%With related children under 18 years 10.00% 20.60% 14.10%With related children under 5 years only 6.80% 18.40% 6.40%
Families with female householder, no husband present 26.60% 40.60% 42.10%
With related children under 18 years 35.60% 48.10% 53.70%With related children under 5 years only 39.30% 47.70% 58.10%
Source: U.S. Census Bureau, 2008-2012 American Community Survey
Both Tulare and Kings Counties have a greater proportion of families living below poverty level compared to the statewide rate of 11.5%.
Data Set 7. Employment Projections by Industry
Industry Title
Visalia-Porterville Metropolitan Statistical Area Hanford-Corcoran Metropolitan Statistical Area
Annual Average Employment Employment Change Annual Average
Employment Employment Change
2010 2020 Numerical Percent 2010 2020 Numerical Percent
Total 159,800 183,000 23,200 15% 47,000 53,900 6,900 15%Self Employment 14,000 14,000 0 0 3,600 3,800 200 6%Unpaid Family Workers 1,200 1,200 0 0 200 200 0 0Private Household Workers 1,300 1,700 400 31% 1,000 1,000 0 0Mining, Logging, Construction 3,900 4,900 1,000 26% 900 1,100 200 22%Manufacturing 11,100 11,900 800 7% 4,100 5,500 1,400 34%Trade, Utilities, Transportation 23,300 27,800 4,500 19% 5,200 6,400 1,200 23%Wholesale Trade 3,800 4,500 700 18% 500 600 100 20%Retail Trade 14,300 17,100 2,800 20% 3,900 4,700 800 21%Transportation, Warehousing, and Utilities 5,100 6,200 1,100 22% 800 1,100 300 38%Information 1,100 1,100 0 0 200 200 0 0Financial Activities 3,800 4,200 400 11% 900 1,100 200 22%Professional and Business Services 8,700 12,100 3,400 39% 1,700 2,000 300 18%Educational Svs 10,800 13,900 3,100 29% 4,500 5,500 1,000 22%
12

College of the Sequoias Master Plan 2015- 2025Chapter 2, Draft #3
Health Care, Social AssistanceLeisure and Hospitality 8,900 10,900 2,000 23% 2,700 3,400 700 26%Other Services 3,000 3,600 600 20% 500 600 100 20%Government 31,100 34,100 3,000 10% 15,000 16,000 1,000 7%
Total Farm 37,700 41,600 3,900 10% 6,600 7,100 500 8%Total Nonfarm 105,600 124,500 18,900 18% 35,600 41,800 6,200 17%
Source: U.S. Bureau of Labor Statistics’ Current Employment Statistics March 2011 benchmark and Quarterly Census of Employment and Wages
Fifteen percent employment growth is projected for both the Visalia-Porterville and Hanford-Corcoran metropolitan areas.
Since this forecast focused on the more populated portions of both counties, it is not surprising that nonfarm jobs are projected to add the greatest number of jobs in both metropolitan areas.
In Visalia-Porterville metropolitan area the industries projected to add the greater number of jobs are: trade, utilities and transportation; professional and business services; educational services, health care and social assistance; and government.
In Hanford-Corcoran metropolitan area the industries projected to add the greater number of jobs are: manufacturing; retail trade; trade, utilities and transportation; educational services, health care and social assistance; and government.
13

College of the Sequoias Master Plan 2015- 2025Chapter 2, Draft #3
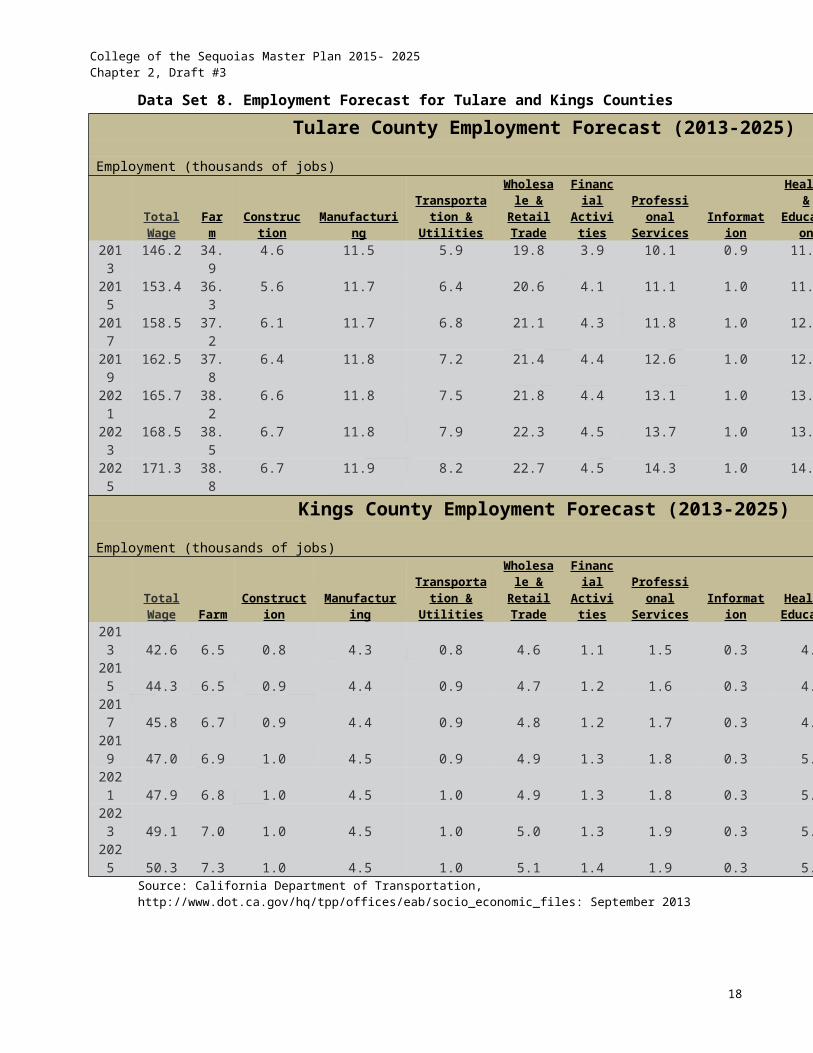
Data Set 8. Employment Forecast for Tulare and Kings Counties
Tulare County Employment Forecast (2013-2025)
Employment (thousands of jobs)
Total Wage Farm Construction Manufacturing
Transportation & Utilities
Wholesale & Retail
TradeFinancial Activities
Professional Services Information
Health & Education
2013 146.2 34.9 4.6 11.5 5.9 19.8 3.9 10.1 0.9 11.02015 153.4 36.3 5.6 11.7 6.4 20.6 4.1 11.1 1.0 11.82017 158.5 37.2 6.1 11.7 6.8 21.1 4.3 11.8 1.0 12.32019 162.5 37.8 6.4 11.8 7.2 21.4 4.4 12.6 1.0 12.92021 165.7 38.2 6.6 11.8 7.5 21.8 4.4 13.1 1.0 13.42023 168.5 38.5 6.7 11.8 7.9 22.3 4.5 13.7 1.0 13.92025 171.3 38.8 6.7 11.9 8.2 22.7 4.5 14.3 1.0 14.3
Kings County Employment Forecast (2013-2025)
Employment (thousands of jobs)
Total Wage Farm Construction Manufacturing
Transportation & Utilities
Wholesale & Retail
TradeFinancial Activities
Professional Services Information
Health & Education
2013 42.6 6.5 0.8 4.3 0.8 4.6 1.1 1.5 0.3 4.72015 44.3 6.5 0.9 4.4 0.9 4.7 1.2 1.6 0.3 4.82017 45.8 6.7 0.9 4.4 0.9 4.8 1.2 1.7 0.3 4.92019 47.0 6.9 1.0 4.5 0.9 4.9 1.3 1.8 0.3 5.12021 47.9 6.8 1.0 4.5 1.0 4.9 1.3 1.8 0.3 5.32023 49.1 7.0 1.0 4.5 1.0 5.0 1.3 1.9 0.3 5.52025 50.3 7.3 1.0 4.5 1.0 5.1 1.4 1.9 0.3 5.6
Source: California Department of Transportation, http://www.dot.ca.gov/hq/tpp/offices/eab/socio_economic_files: September 2013
The largest number of jobs in both Tulare and Kings Counties are in farming and governmental agencies. This pattern is projected to continue over the coming decade.
The two sectors of professional services and farm are projected to experience the most significant increase in the number of jobs in Tulare County over the next decade.
The three sectors of farm, health and education, and government are projected to experience the most significant increase in the number of jobs in Kings County over the next decade.
14

College of the Sequoias Master Plan 2015- 2025Chapter 2, Draft #3
Data Set 9. Largest Growing Occupations by Required Entry-level Education (2010-2020)
Entry Level Education
Kings County Tulare County
Largest Growing(New & Replacement Jobs) Jobs Largest Growing
(New & Replacement Jobs) Jobs
Bachelor’s Degree
Elementary School Teachers, Except Special Education 250 Elementary School Teachers,
Except Special Education 920
Secondary School Teachers, Except Special Ed & CTE 170 Secondary School Teachers,
Except Special Ed & CTE 580
Special Education Teachers 100 Kindergarten Teachers, Except Special Education 230
Probation Officers & Correctional Treat’t Specialst 90 Recreation Workers 210
Accountants and Auditors 70 Accountants and Auditors 160
Associate’s Degree
Registered Nurses 400 Registered Nurses 960Agricultural & Food Science Technicians 120 General & Operations Mgrs 390
General & Operations Mgrs 110 Preschool Teachers, Except Special Education 140
Radiologic Technologists & Technicians 30 Forest & Conservation
Technicians 110
Construction Managers 20 Construction Managers 60
Postsecondary Non-degree Award
Firefighters 270 Nursing Aides, Orderlies & and Attendants 310
Licensed Practical & Licensed Vocational Nurses 170 Licensed Practical & Licensed
Vocational Nurses 260
Nursing Aides, Orderlies, & Attendants 140 Dental Assistants 160
First-Line Supervisors of Fire Fighting & Prevention Wkrs 70
Heating, Air Conditioning, and Refrigeration Mechanics and
Installers150
First-Line Supervisors of Production & Operat’g Wkrs 60 First-Line Supervisors of
Production & Operating Wkrs 120
Some College Computer Support Specialsts 40
High School Diploma or Equivalent
Correctional Officers/Jailers 700 Heavy and Tractor-Trailer Truck Drivers 980
Farmers, Ranchers, and Other Agricultural Managers 490 Teacher Assistants 820
Teacher Assistants 260 Office Clerks, General 800Tractor-Trailer Truck Drivers 240 Customer Service Reps 730
Office Clerks General 240 Farmers, Ranchers, and Other Agricultural Managers 1,650
Less than High School
Cashiers 730 Retail Salespersons 2,230Retail Salespersons 550 Cashiers 2,030Combined Food Prep & Serving Workers Inc. Fast Food 470 Combined Food Prep &
Serving Workers Inc. Fast Food 1,620
Waiters and Waitresses 280 Laborers and Freight, Stock, and Material Movers, Hand 1,540
Laborers and Freight, Stock, and Material Movers, Hand 250 Farmworkers and Laborers,
Crop, Nursery & Greenhouse 11,780
Source: California Employment Development Division, http://www.calmis.ca.gov/file/indproj/visa$_highlights.pdf
15

College of the Sequoias Master Plan 2015- 2025Chapter 2, Draft #3
In both Kings and Tulare Counties jobs that require little to no formal higher education are plentiful. However, higher levels of educational attainment are predictive of higher greater income and lower unemployment.
Data Set 10. National Earnings and Unemployment Rates by Educational Attainment
Education attainedUnemployment rate in
2013Median weekly
earnings ($)
Doctoral degree 2.2% $1,623
Professional degree 2.3% $1,714
Master's degree 3.4% $1,329
Bachelor's degree 4.0% $1,108
Associate's degree 5.4% $777
Some college, no degree 7.0% $727
High school diploma 7.5% $651
Less than a high school diploma 11.0% $472 Source: U.S. Bureau of Labor Statistics, Current Population Survey, http://www.bls.gov/emp/ep_table_001.htm; March 2104.
Note: Data are for persons age 25 and over. Earnings are for full-time wage and salary workers.
Nationally, adults age 25 and older with the lowest levels of educational attainment have the highest rates of unemployment and the lowest median weekly earnings.
The relatively lower level of educational attainment for adults in the COS service area no doubt contributes to this region’s overall lower median household income. (Refer to Data Set 5 and Data Set 6.)
16

College of the Sequoias Master Plan 2015- 2025Chapter 2, Draft #3
ENROLLMENT TRENDS
Data Set 11a. Student Headcount
Fall 2009 Fall 2010 Fall 2011 Fall 2012 Fall 20130
2,000
4,000
6,000
8,000
10,000
12,000
14,000
Fall 2009 Fall 2013 % Change2009 to 2013
District Total 13,964 11,052 -21%COS-Visalia Campus 12,200 9,932 -19%COS-Hanford Educational Ctr 745 1,394 187%COS-Tulare College Center 550 1,457 264%Other Sites 2,299 775 -66%
Statewide 1,822,842 1,520,472 -17%Sources: COS Data Warehouse, COS Office of Research, Planning and Institutional Effectiveness, and California Community Colleges Chancellor’s Office: datamart.cccco.edu
Notes: - The District Total is an unduplicated count of all students registered for a course past census. Each student is
counted only once in the District Total even if that student is enrolled in more than one course. However, since students may enroll in a course at more than one campus, the sum of the campus counts is greater than the District Total in this data set.
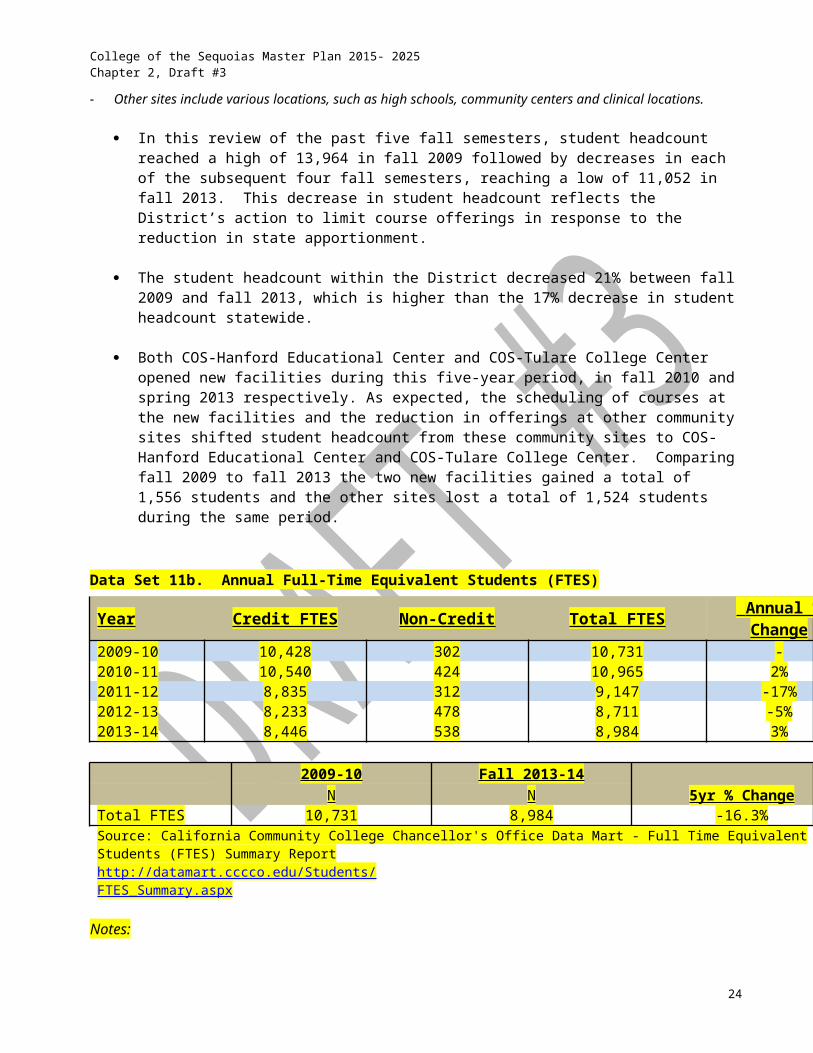
- These data include the student headcount for both credit and non-credit courses.- Other sites include various locations, such as high schools, community centers and clinical locations.
In this review of the past five fall semesters, student headcount reached a high of 13,964 in fall 2009 followed by decreases in each of the subsequent four fall semesters, reaching a low of 11,052 in fall
17
College of the Sequoias Master Plan 2015- 2025Chapter 2, Draft #3
2013. This decrease in student headcount reflects the District’s action to limit course offerings in response to the reduction in state apportionment.
The student headcount within the District decreased 21% between fall 2009 and fall 2013, which is higher than the 17% decrease in student headcount statewide.
Both COS-Hanford Educational Center and COS-Tulare College Center opened new facilities during this five-year period, in fall 2010 and spring 2013 respectively. As expected, the scheduling of courses at the new facilities and the reduction in offerings at other community sites shifted student headcount from these community sites to COS-Hanford Educational Center and COS-Tulare College Center. Comparing fall 2009 to fall 2013 the two new facilities gained a total of 1,556 students and the other sites lost a total of 1,524 students during the same period.
Data Set 11b. Annual Full-Time Equivalent Students (FTES)
Year Credit FTES Non-Credit Total FTES Annual % Change 2009-10 10,428 302 10,731 -2010-11 10,540 424 10,965 2%2011-12 8,835 312 9,147 -17%2012-13 8,233 478 8,711 -5%2013-14 8,446 538 8,984 3%
2009-10 Fall 2013-145yr % ChangeN N
Total FTES 10,731 8,984 -16.3%Source: California Community College Chancellor's Office Data Mart - Full Time Equivalent Students (FTES) Summary Reporthttp://datamart.cccco.edu/Students/FTES_Summary.aspx
Notes:-The FTES value is calculated by summing the "Total Hours" (refer to SXD4 in CCCCO MIS Data Element Dictionary) in all the enrollment records reported to CCCCO MIS during the requested time period, then dividing by 525.-If "Total Hours" cannot be derived because data is missing or set to "Unknown/Unreported", the enrollments are not included.-All activity in classes eligible for state apportionment funding is included. This methodology is not same as the methodology used in calculating FTES for CCFS-320 report.
While the Fall district enrollment has decreased 21% over the last five years (see Data Set 11.a), total FTES has only decreased by 16.3%, indicating students enrolled at COS are carrying more units.
Although the total FTES has decreased until the most recent years, Non-Credit FTES continue to grow from 2009-10 levels reaching a high in 2013-14.
18

College of the Sequoias Master Plan 2015- 2025Chapter 2, Draft #3
Data Set 11c. COS Annual Projected Full-Time Equivalent Students 2015-2030
COS Annual Projected Full-Time Equivalent Students (FTES)Year 2014/15 2019/20 2024/25 2029/30 2015 - 2030
GrowthDistrict Total 9,375 10,225 11,151 12,161 30%Visalia Campus 6,820 7,249 7,686 8,127 19%Hanford Campus 928 1,089 1,278 1,499 62%Tulare Campus 1,627 1,887 2,187 2,535 56%
Source: COS Data Warehouse; COS Administrative Services & California Community College Chancellor's Office Data Mart - Full Time Equivalent Students (FTES) Summary Report: http://datamart.cccco.edu/Students/FTES_Summary.aspx
Note: The COS growth projections are based on the following annual growth rates: District Total: 1.75%, Visalia Campus: 1.21% (average), Hanford Campus: 3.25%, Tulare Campus: 3.00%
The number of District’s full-time equivalent students is projected to increase 30% between 2015 and 2030.
The Hanford and Tulare campus are projected to grow much faster than the Visalia campus (Hanford 62%, Tulare 56%, and Visalia 19%).
The Visalia campus is projected to grow much slower than the District.
Data Set 12. Student Headcount by Site
District Site of Students’ Courses HeadcountCOS-Visalia Campus Exclusively 7,642COS-Hanford Educational Center Exclusively 756COS-Tulare College Center Exclusively 415
19

College of the Sequoias Master Plan 2015- 2025Chapter 2, Draft #3
COS-Visalia Campus + COS-Hanford Educational Center 559COS-Visalia Campus + COS Tulare College Center 897COS-Hanford Educational Center + COS-Tulare College Center 29COS-Visalia Campus + COS-Hanford Educational Center + COS Tulare College Center
45
Subtotal 10,343Other Sites 436District Total 10,779Sources: COS Data Warehouse, EIS: Student Data Touchpoints, and COS Office of Research, Planning and Institutional Effectiveness
Notes: - This is an unduplicated count of students; students are counted once regardless of the number of units in which they
are enrolled.- These data include the student headcount for both credit and non-credit courses.- Other sites include various locations such as high schools, community centers, and clinical locations.
In fall 2013, over 1,500 students were enrolled in courses at more than one district campus/site.
Data Set 13. Course Enrollments by Site
Visalia Campus – 7,642 Tulare College Center – 415
Hanford Educational Center – 756
897
45
29559
20

College of the Sequoias Master Plan 2015- 2025Chapter 2, Draft #3
Fall 2009 Fall 2010 Fall 2011 Fall 2012 Fall 20130
5,000
10,000
15,000
20,000
25,000
30,000
35,000
40,000
45,000
50,000
55,000
Fall 2009 Fall 2013% Change Fall 2009 to Fall
2013
Average Enrollments per Headcount Fall
2009
Average Enrollments
per Headcount Fall 2013
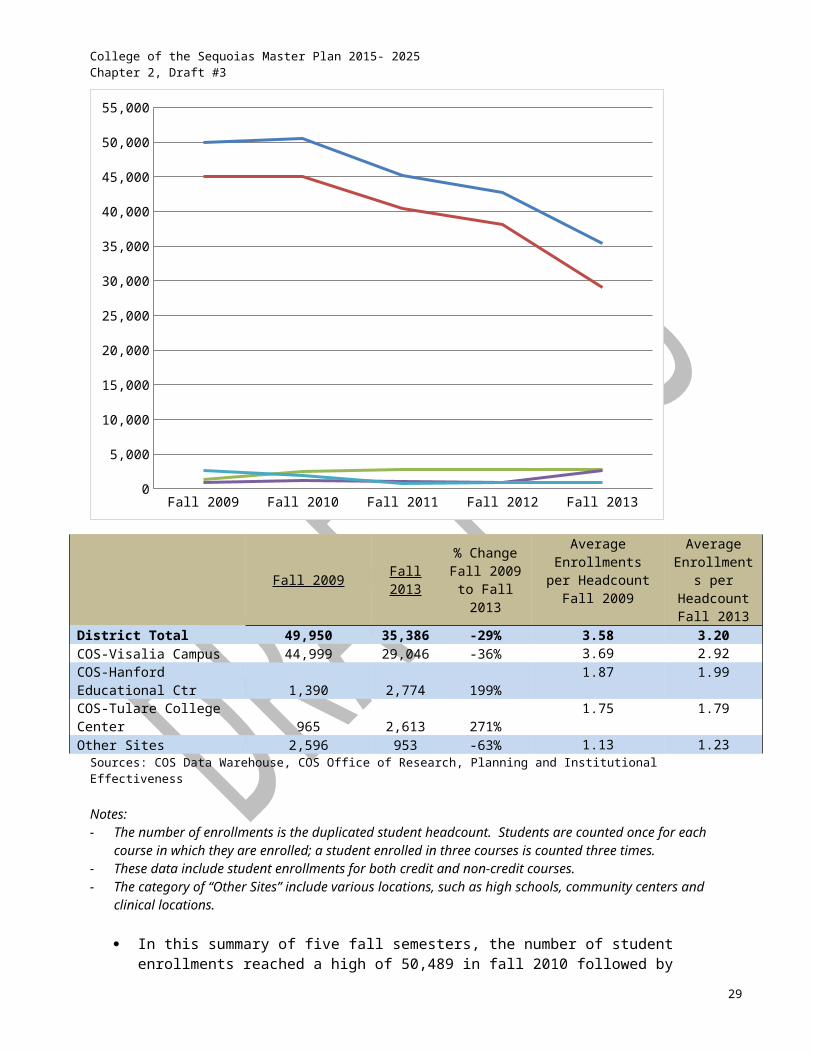
District Total 49,950 35,386 -29% 3.58 3.20COS-Visalia Campus 44,999 29,046 -36% 3.69 2.92COS-Hanford Educational Ctr 1,390 2,774 199% 1.87 1.99COS-Tulare College Center 965 2,613 271% 1.75 1.79Other Sites 2,596 953 -63% 1.13 1.23
Sources: COS Data Warehouse, COS Office of Research, Planning and Institutional Effectiveness
Notes: - The number of enrollments is the duplicated student headcount. Students are counted once for each course in which
they are enrolled; a student enrolled in three courses is counted three times.- These data include student enrollments for both credit and non-credit courses.- The category of “Other Sites” include various locations, such as high schools, community centers and clinical
locations.
In this summary of five fall semesters, the number of student enrollments reached a high of 50,489 in fall 2010 followed by decreases in each of the subsequent three fall semesters, reaching a low of 35,386 in fall 2013. This decrease in student enrollments reflects the District’s action to limit course offerings in response to reductions in state apportionment.
Although the student headcount decreased 21% between fall 2009 and fall 2013, the number of enrollments decreased 29%.
21

College of the Sequoias Master Plan 2015- 2025Chapter 2, Draft #3
The average number of enrollments per student district-wide decreased from 3.58 to 3.20. The decrease in the average number of enrollments per student occurred on COS-Visalia Campus (from 3.69 enrollments per student in fall 2009 to 2.92 per student in fall 2013) while COS-Hanford Educational Center, COS-Tulare College Center and other sites show a slight increase in the average number of enrollments per student.
Data Set 14. Efficiency by Discipline
Fall 2009 Fall 2010 Fall 2011 Fall 2012 Fall 2013AG 413 419 371 393 340BUS 480 494 495 476 430
CFS 498 493 574 538 500ARTF 535 590 644 605 544IT 466 465 455 377 364
LANG 433 435 427 395 379MATH 595 617 612 621 630NURS 278 285 286 266 232PE 385 519 710 711 612SCI 539 530 577 583 551
SOCS 627 668 714 628 559SPLP 560 684 562 623 599STSV 547 358 497 484 677
LRC 164 131 163 161 388
Note - The figures include outlier data that was excluded in the department trend tables, specifically Fall 2009 and Fall 2010 COUN and Fall 2009 ESL data.
-WSCH and FTEF Defined: The most common statewide measure of efficiency compares the number of hours faculty are with students in class each week (Weekly Student Contact Hours) with the number of equivalent full-time faculty (Full Time Equivalent Faculty). The state recommendation for this ratio is 525, representing one faculty member teaching five three-unit classes per semester with 35 students in each class.
In Fall 2013, over half (57%) of the divisions had increased efficiency ratios (WSCH/FTEF) from the Fall 2009 levels.
In Fall 2013, half (50%) of the divisions had an efficiency ratio greater than or equal to the state recommendation of 525.
22

College of the Sequoias Master Plan 2015- 2025Chapter 2, Draft #3
Data Set 15. Student Headcount by Area of Residence
Fall 2009 Fall 2010 Fall 2011 Fall 2012 Fall 20130
2,000
4,000
6,000
8,000
10,000
12,000
14,000
16,000
Fall 2009Proportion
of Total Fall 2013Proportion
of TotalDistrict Total 13,964 100% 11,052 100%Visalia 6,238 45% 4,872 44%Hanford 1,101 8% 1,024 9%Tulare 2,019 14% 1,725 16%Exeter 607 4% 392 4%Woodlake 350 3% 288 3%Farmersville 331 2% 315 3%Lindsay 291 2% 251 2%Porterville 298 2% 244 2%Others 2,729 20% 1,941 18%
Sources: COS Data Warehouse and COS Office of Research. Planning and Institutional Effectiveness
Notes:- Student headcount reflects the number of unique students enrolled; each student is counted once no matter how
many courses that student enrolled in for that semester.- These data include the student headcount for both credit and non-credit courses.- Area of resident is drawn from students’ self-reports.- The category of “Others” refers to the unincorporated areas in Tulare and Kings Counties.
The pattern of where the District’s students live has been relatively stable in recent years. Almost half of the District’s students live in Visalia, with the second largest proportion of student living in unincorporated areas of Tulare and Kings Counties.
23
College of the Sequoias Master Plan 2015- 2025Chapter 2, Draft #3
Data Set 16. Student Headcount by Number of Units
Fall 2009 Fall 2010 Fall 2011 Fall 2012 Fall 20130
2,000
4,000
6,000
8,000
10,000
12,000
14,000
COS % of Total Statewide % of TotalFall 2009 Fall 2013 Fall 2009 Fall 2013
Total Non-credit 10% 8% 11% 8%Total Credit 90% 92% 89% 92%
0.1 - 2.9 7% 4% 8% 5%3 - 5.9 21% 18% 23% 22%6 - 8.9 14% 16% 16% 18%9-11.9 14% 18% 13% 16%12 – 14.9 27% 26% 20% 22%15+ 7% 9% 8% 9%
Sources: COS Data Warehouse, COS Office of Research, Planning and Institutional Effectiveness, and California Community Colleges Chancellor’s Office: datamart.cccco.edu
Note: Student headcount reflects the number of unique students enrolled; each student is counted once no matter how many courses that student enrolled in for that semester.
The proportions of COS students enrolled in a full-time load of 12 or more credit units were comparable in fall 2009 and fall 2013 (34% and 35% respectively). These proportions of COS students with a full-time credit load were slightly higher than the statewide proportions in the same semesters of 28% and 31% respectively.
24

College of the Sequoias Master Plan 2015- 2025Chapter 2, Draft #3
The pattern of the proportions of COS students enrolled in 6 to 11.9 credit units increased slightly from 28% in fall 2009 34% in fall 2013, parallel to similar slight increases in the statewide proportions from 29% in fall 2009 to 34% in fall 2013.
The pattern of the proportions of COS students enrolled in 5.9 or fewer credit units decreased slightly from 28% in fall 2009 to 22% in fall 2013, parallel to similar slight decreases in the statewide proportions from 31% in fall 2009 to 27% in fall 2013.
Data Set 17. Student Headcount by Method of Instruction
Fall 2009 Fall 2010 Fall 2011 Fall 2012 Fall 20130
2,000
4,000
6,000
8,000
10,000
12,000
14,000
Enrollment by Instructional MethodFall 2009 Fall 2013 5yr Change
N% of
Students N% of
Students % ChangeDistrict Total 13,964 - 11,052 - -21%Face-To-Face 13,428 96% 10,624 96% 0%Online (any type) 2370 17% 2300 21% 4%
Source: COS Data Warehouse and COS Office of Research, Planning and Institutional Effectiveness
25

College of the Sequoias Master Plan 2015- 2025Chapter 2, Draft #3
Notes: - The District Total is an unduplicated count of all students registered for a course past census. Each student is
counted only once in this total even if enrolled in more than one course. However, since students may enroll in courses taught by more than one type of instructional method, the sum of the count by instructional method is greater than the District Total in this data set.
- The category “Online with Orientation” refers to a pilot project in which faculty and students meet once at the start of the semester for an on-campus orientation to the course and to the online teaching/learning environment.
- The category “Others” in this data set includes work experience, tutoring, directed study, field experience, independent study, hybrid video and other instructional activities.
The District offers almost all instruction through face-to-face methods. Consequently, the percentage of the District-wide reduction in student headcount has reduced.
The proportion of students taking courses in all types of online courses has increased 4% between Fall 2009 and Fall 2013.
26

College of the Sequoias Master Plan 2015- 2025Chapter 2, Draft #3
STUDENT DEMOGRAPHICS
Data Set 18. Student Headcount by Age and SiteFall 2009 Fall 2011 Fall 2013
# of StudentsProportion of Total Students
# of StudentsProportion of Total Students
# of StudentsProportion of Total Students
District Total19 or less 4,310 31% 3,790 32% 3,238 29%20-24 4,163 30% 4,038 34% 4,154 38%25-29 1,788 13% 1,407 12% 1,389 13%
30-49 3,011
22%2,141
18%1,942
18%
50 and older 692
5%
377
3%
325
3%
District Total
13,964 100% 11,764 100% 11,052 100%
COS-Visalia Campus19 or less 3,807 31% 3,506 30% 3,003 26%20-24 3,909 32% 3,769 34% 3,890 40%25-29 1,546 13% 1,236 15% 1,197 15%30-49 2,406 20% 1,826 19% 1,594 17%
50 and older 532
4%
305
2%
249
2%
Sub-total 12,200
100% 10,645 100% 9,933 100%
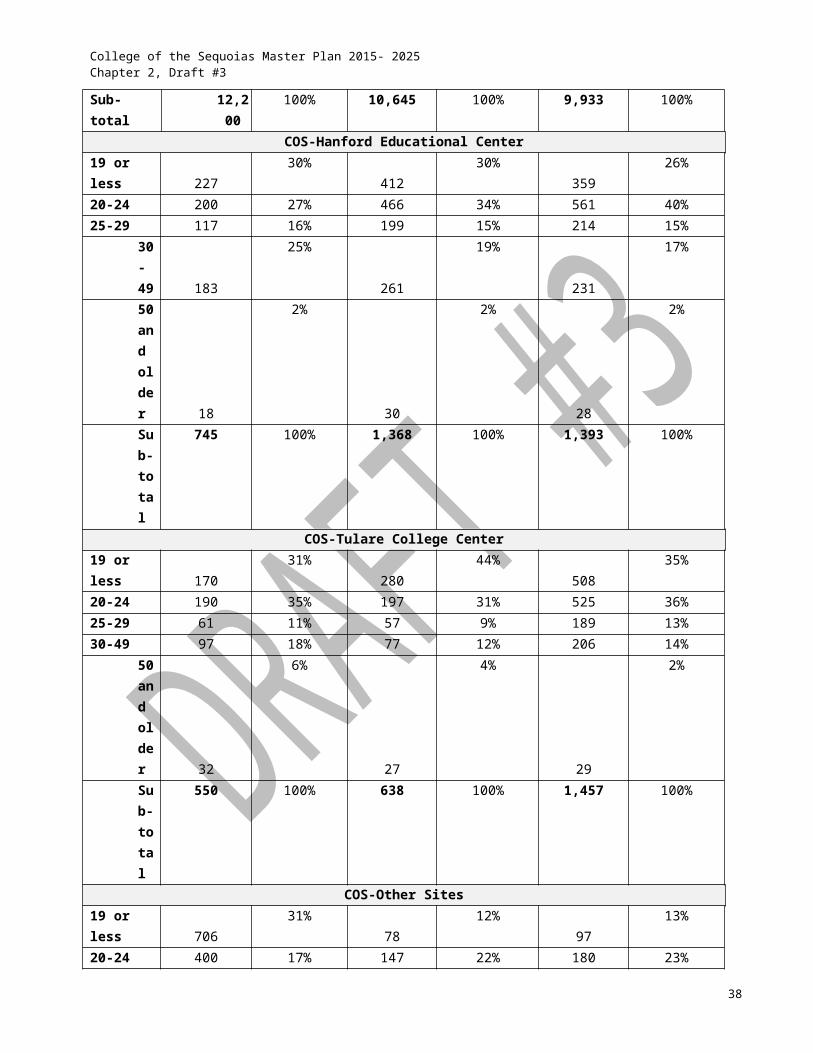
COS-Hanford Educational Center19 or less 227 30% 412 30% 359 26%20-24 200 27% 466 34% 561 40%25-29 117 16% 199 15% 214 15%
30-49 183
25%261
19%231
17%
50 and older 18
2%
30
2%
28
2%
Sub-total
745 100% 1,368 100% 1,393 100%
COS-Tulare College Center
27

College of the Sequoias Master Plan 2015- 2025Chapter 2, Draft #3
19 or less 170 31% 280 44% 508 35%20-24 190 35% 197 31% 525 36%25-29 61 11% 57 9% 189 13%30-49 97 18% 77 12% 206 14%
50 and older 32
6%
27
4%
29
2%
Sub-total
550 100% 638 100% 1,457 100%
COS-Other Sites19 or less 706 31% 78 12% 97 13%20-24 400 17% 147 22% 180 23%25-29 310 13% 112 17% 128 17%30-49 720 31% 251 38% 300 39%
50 and older 163
7%
62
9%
66
9%
Sub-total
2,299 100% 658 100% 775 100%
Source: COS Data Warehouse and COS Office of Research, Planning and Institutional Effectiveness
Notes: - The District Total is an annual unduplicated count of all students registered for a course past census. Each student is
counted only once in the District Total even if that student is enrolled in more than one course. However, since students may enroll in courses at more than one campus, the sum of the campus counts is greater than the District Total in this data set.
- The category of “Other Sites’ includes various locations, such as high schools, community centers and clinical locations.
- Ages are unknown for a small number of students; these data are in the totals and sub-totals but are not included as separate lines this data set.
About 2/3’s of District students are age 24 or younger. In fall 2013, 66 to 71% of the students at each District location except “Other Sites” are in the youngest age cohorts.
The largest proportion of students who attend classes at sites other than the three primary District locations settings is between 30 to 49 years old (fall 2013, 39%).
District-wide, the proportions of students of younger than 19 and between the ages of 25-29 have been largely consistent. However, the proportions of students between ages 20 and 24 increased (from 30% in fall 2009 to 38% in fall 2013) and the proportions of students aged 50 and older decreased (from 5% in fall 2009 to 3% in fall 2013). The latter shift may be due to the reduction in the number of night sections offered.
28
College of the Sequoias Master Plan 2015- 2025Chapter 2, Draft #3
Data Set 19. Comparison of District and Statewide Headcount by Age
2012/13District-Wide Statewide
< 20 years old 32% 24%20 to 24 years old 35% 32%25 to 39 years old 25% 27%
40+ years old 9% 17%Source: California Community Colleges Chancellor’s Office: scorecard.cccco.edu
District students on the average are younger than the statewide student population, with 65% of District students 24 years old or younger compared to 56% of students in that age cohort statewide in 2012/13.
As another measure of the relative youthfulness of the District’s students, the proportion of District students who are age 40 and older is only 9% compared to 17% of the students in the oldest cohort statewide.
29

College of the Sequoias Master Plan 2015- 2025Chapter 2, Draft #3
Data Set 20. Student Headcount by Gender and Site
2008/09 2009/10 2010/11 2011/12 2012/130
5,000
10,000
15,000
20,000
25,000
2008/09 2010/11 2012/13# of
StudentsProportion of Students
# of Students
Proportion of Students
# of Students
Proportion of Students
COS-Visalia CampusFemale 8,343 57% 8,830 56% 7,288 56%Male 6,153 42% 6,740 43% 5,662 44%Unknown 69 <1% 79 <1% 18 <1%Sub-total 14,565 100% 15,649 100% 12,968 100%
COS-Hanford Educational CenterFemale 603 63% 976 42% 1,069 45%Male 343 36% 1,347 58% 1,039 55%Unknown 5 1% 11 <1% 1 <1%Sub-total 951 100% 2,334 100% 2,109 100%
COS-Tulare College CenterFemale 363 47% 449 44% 632 45%Male 413 53% 581 56% 772 55%Unknown 4 1% 2 <1% 0 <1%
Sub-total 780 100% 1,032 100% 1,404 100%COS-Other Sites
Female 2,445 49% 1,520 55% 564 55%Male 2,441 49% 1,212 44% 458 45%Unknown 111 2% 29 1% 6 1%Total 4,997 100% 2,761 100% 1,028 100%
Source: COS Data Warehouse and COS Office of Research, Planning and Institutional Effectiveness
30

College of the Sequoias Master Plan 2015- 2025Chapter 2, Draft #3
Notes:- The District Total is an annual unduplicated count of all students registered for a course past census. Each student is
counted only once in the District Total even if that student is enrolled in more than one course. However, since students may enroll in courses at more than one campus, the sum of the campus counts is greater than the District Total in this data set.
- Other sites include various locations, such as high schools, community centers and clinical locations.
The proportions of males and females in the District student population have remained consistent across this five-year snapshot within the ranges of 53-55% female students and 45-46% male.
However, the proportions of male and female students differ at the District’s three sites. In 2012/13 the proportions of male and female students at COS-Visalia Campus are 44% and 56% respectively. However, those proportions are reversed for COS-Hanford Educational Center and COS-Tulare College Center where at both locations there are more male than female students, 55% and 45% respectively. This difference is due to the gender differences in the genders of students attracted to the unique career technical educational programs at each location. For example, the police academy moved to the Hanford Center in 2010, which contributed to the reversal of male/female proportions.
31

College of the Sequoias Master Plan 2015- 2025Chapter 2, Draft #3
Data Set 21. Student Headcount by Site and Race/Ethnicity
Fall 2009 Fall 2011 Fall 2013 Change from 2009 to 2013
# of Students
% of Total
Students
# of Students
% of Total
Students
# of Students
% of Total
Students
# of Students
District TotalAlas/Nat.Amer. 77 1% 55 <1% 58 1% -19
Asian 582 4% 526 4% 442 4% -140
Black/Af. Amer. 403 3% 363 3% 301 3% -102
Hispanic 7,155 51% 6,559 56% 6,411 58% -744
Non-res. Alien 26 <1% 13 <1% 15 <1% -11
Pac Islander 40 <1% 22 <1% 11 <1% -29
Two or more 486 3% 501 4% 546 5% 60
White 4,697 34% 3,495 30% 2,984 27% -1,713
Unknown 498 4% 230 2% 284 3% -214
District Total 13,964 100% 11,764 100% 11,052 100% -2,912COS-Visalia Campus
Alas/Nat.Amer. 67 1% 45 <1% 51 1% -16
Asian 555 5% 498 5% 422 4% -133
Black/Af. Amer. 362 3% 330 3% 282 3% -80
Hispanic 6,262 51% 5,905 55% 5,805 58% -457
Non-res. Alien 26 <1% 13 <1% 15 <1% -11
Pac Islander 36 <1% 22 <1% 7 <1% -29
Two or more 449 4% 468 4% 511 5% 62
White 4,126 34% 3,174 30% 2,665 27% -1,461
Unknown 317 3% 190 2% 175 2% -142
Sub-total 12,200 100% 10,645 100% 9,933 100% -2,267COS-Hanford Educational Center
Alas/Nat.Amer. 4 1% 11 1% 11 1% 7
Asian 20 3% 54 4% 51 4% 31
Black/Af. Amer. 27 4% 52 4% 29 2% 2
Hispanic 356 48% 718 52% 784 56% 428
Non-res. Alien 0 0% 0 0% 0 0% 0
Pac Islander 2 <1% 0 0% 3 <1% 1
Two or more 18 2% 46 3% 67 5% 49
White 300 40% 468 34% 427 31% 127
Unknown 18 2% 19 1% 21 2% 3
Sub-total 745 100% 1,368 100% 1,393 100% 648COS-Tulare College Center
Alas/Nat.Amer. 2 <1% 3 <1% 8 1% 6
Asian 4 1% 7 1% 24 2% 20
32

College of the Sequoias Master Plan 2015- 2025Chapter 2, Draft #3
Black/Af. Amer. 7 1% 8 1% 38 3% 31
Hispanic 209 38% 263 41% 803 55% 594
Non-res. Alien 0 0% 0 0% 0 0% 0
Pac Islander 0 0% 1 <1% 2 <1% 2
Two or more 24 4% 31 5% 64 4% 40
White 293 53% 320 50% 498 34% 205
Unknown 11 2% 5 1% 20 1% 9
Sub-total 550 100% 638 100% 1,457 100% 907COS-Other Sites
Alas/Nat.Amer. 14 1% 2 0% 1 0% -13
Asian 64 3% 39 6% 35 5% -29
Black/Af. Amer. 53 2% 10 2% 12 2% -41
Hispanic 1,179 51% 348 53% 408 53% -771
Non-res. Alien 1 <1% 0 0% 1 <1% 0
Pac Islander 8 <1% 1 <1% 0 0% -8
Two or more 53 2% 18 3% 20 3% -33
White 734 32% 196 30% 189 24% -545
Unknown 193 8% 44 7% 109 14% -84
Sub-total 2,299 100% 658 100% 775 100% -1,524Source: COS Data Warehouse and COS Office of Research, Planning and Institutional Effectiveness
Notes:- The District Total is an annual unduplicated count of all students registered for a course past census. Each student is
counted only once in the District Total even if that student is enrolled in more than one course. However, since students may enroll in courses at more than one campus, the sum of the campus counts is greater than the District Total in this data set.
- Other sites include various locations, such as high schools, community centers and clinical locations. - Ages are unknown for a small number of students; these data are in the totals and sub-totals but are not included as
separate lines this data set.
In fall 2013 the two predominate racial/ethnic groups in the District student population are students who self-identify as Hispanic (58%) and those who self-identify as White (27%). The next largest proportions of students are those who self-identify as Two or More Races (5%) and Asian (4%).
In the past five years, there has been a shift in the District’s student demographics. The proportions of students who self-identify as Hispanic increased while the proportions of students who self-identify as White decreased. District-wide these shifts were from 51% Hispanic in fall 2009 to 58% Hispanic in Fall 2013 and from 34% White to 27% White in the same semesters. The proportions of students in other racial/ethnic groups remained relatively consistent across these years.
The same pattern of increases in the proportion of students who self-identify as Hispanic and decreases in those who self-identify as White is seen in the student demographics at all District sites.
33

College of the Sequoias Master Plan 2015- 2025Chapter 2, Draft #3
Data Set 22. Comparison of District and State Headcount by Race/Ethnicity 2012/13
District-wide StatewideAfrican-American 3% 7%American Indian/Alaska Native 1% 1%
Asian 4% 12%Filipino 1% 3%Hispanic 58% 38%Pacific Islander 0% 1%White 29% 30%Two or More Races 3% 3%Unknown Ethnicity 3% 6%Source: California Community Colleges Chancellor’s Office: scorecard.cccco.edu
In race/ethnicity demographics, the two predominant groups in both the District and statewide are students who self-identify as Hispanic and White.
Compared to the statewide demographics, the District student population includes a higher proportion of Hispanic students and lower proportions of African American and Asian students.
34

College of the Sequoias Master Plan 2015- 2025Chapter 2, Draft #3
Data Set 23. Student Headcount by First-Generation College Student Status
2011/12 % of Total 2012/13 % of Total 2013/14 % of TotalDistrict Total 3,277 3,078 3,064First-Generation 2,322 71% 2,118 69% 2,022 66%
Not First-Generation 692
21% 666
22%706
23%
Unknown 263 8% 294 10% 336 11%Sources: COS Data Warehouse and COS Office of Research, Planning and Institutional Effectiveness
Close to 70% of first time students who enroll in the District are also the first generation in their families to attend college. This is higher than the 2012 estimate from the California Community Colleges Chancellor’s Office that 61% of first-time students were first generation college students. (Source: Measuring the Education Level of California Community College Students’ Parents: Current Status and Preliminary Findings, April 11, 2014; http://www.rpgroup.org/resources/measuring-education-level-california-community-college-students%E2%80%99-parents-current-status-an
Data Set 24. Placement of First-time Students
2008/09 2010/11 2012/13Placement # of
StudentsProportion
of Total Students
# of Students
Proportion of Total
Students
# of Students
Proportion of Total
StudentsEnglish
Re-test Referral 204 5% 154 4% 101 4%Below College Level 2,216 59% 2,061 58% 1,598 58%College Level 1,338 36% 1,309 37% 1,040 38%English Total 3,758 3,524 2,739
MathematicsRe-test Referral 181 5% 129 4% 94 3%Below College Level 3,068 82% 2,951 84% 2,326 85%College Level 470 13% 431 12% 320 12%Mathematics Total 3,719 3,511 2,740
Source: COS Data Warehouse and COS Office of Research, Planning and Institutional Effectiveness
Note: This data set represents all first-time college students who voluntarily completed a placement test in English or mathematics or both and then subsequently enrolled. Since students are allowed to re-take the placement test, these scores may or may not be students’ original scores. Students are not required to complete the English and/or mathematics placement tests prior to enrollment.
The 2012/13 pattern of placement data for students who voluntarily completed the English assessment is parallel to the patterns in prior years: of the first-time students who completed the English assessment, 4% were recommended for re-testing, 58% placed below college-level, and the remaining 38% placed at college-level.
35

College of the Sequoias Master Plan 2015- 2025Chapter 2, Draft #3
The 2012/13 pattern of placement data for students who voluntarily completed the mathematics assessment is comparable to the patterns in prior years: of the first-time students who completed the mathematics assessment test, 3% were recommended for re-testing, 85% placed below college-level, and the remaining 12% placed at college-level.
36

College of the Sequoias Master Plan 2015- 2025Chapter 2, Draft #3
STUDENT OUTCOMES
Data Set 25. Student Success Scorecard: Completion Rates2003/04 2005/06 2007/08
COS State COS State COS StateN % % N % % N % %
Completion Rate Overall 1,626 43% 47% 1,593 45% 49% 2,052 43% 48%
Source: The California Community Colleges Student Success Scorecard,2014; http://scorecard.cccco.edu
Note: Completion Rate is the percentage of degree and/or transfer-seeking students tracked for six years through 2012-13 who completed a degree, certificate or transfer related outcomes.
The completion rates for COS students are consistent over this multi-year snapshot, in the range of 43% - 45%.
The completion rates for COS students are consistently lower than students’ completion rates statewide (43% versus 47%, 45% versus 49%, and 43% versus 48%).
Data Set 26. Student Success Scorecard: Completion Rates by Age2003/04 2005/06 2007/08
COS State COS State COS StateN % % N % % N % %
Younger than 20 1,286 44% 51% 1,313 48% 52% 1,709 45% 51%
Ages 20 - 24 127 42% 38% 122 32% 39% 146 30% 37%
Ages 25 - 39 135 36% 35% 114 36% 34% 135 34% 35%
Ages 40+ 78 44% 33% 44 39% 33% 62 48% 34%
Source: The California Community Colleges Student Success Scorecard, 2014;http://scorecard.cccco.edu
Note: Completion Rate is the percentage of degree and/or transfer-seeking students tracked for six years through 2012-13 who completed a degree, certificate or transfer related outcomes.
The completion rates for COS students in the age 20 – 24 cohort have steadily decreased in this multi-year comparison, from a high of 42% to 30% in the most recent data. In addition, the completion rates for COS students in college-going years (younger than 20 and 20 – 24) are consistently below the completion rates for students of the same ages statewide.
The completion rates for COS students over the age of 25 are comparable to or exceed the statewide completion rates for students in older age cohorts.
Data Set 27. Student Success Scorecard: Completion and 30 Units Rates by Preparedness
37
College of the Sequoias Master Plan 2015- 2025Chapter 2, Draft #3
Prepared: Student’s lowest course attempted in mathematics and/or English was college level
2003/04 2005/06 2007/08
COS State COS State COS State
N % % N % % N % %
% of Total Cohort
325 20% 26% 333 21% 26% 476 23% 26%
Completion Rate 325 70% 69% 333 70% 71% 476 66% 70%
30 Units 325 74% 69% 333 69% 69% 476 71% 70%
Persistence 325 77% 72% 333 75% 71% 476 64% 72%
Unprepared: Student’s lowest course attempted in mathematics and/or English was remedial level
2003/04 2005/06 2007/08
COS State COS State COS State
N % % N % % N % %
% of Total Cohort
1,301 80% 74% 1,260 79% 74% 1,576 77% 74%
Completion Rate 1,301 37% 39% 1,260 39% 41% 1,576 36% 41%
30 Units 1,301 64% 64% 1,260 65% 65% 1,576 64% 65%
Persistence 1,301 71% 71% 1,260 71% 70% 1,576 66% 70%
Source: The California Community Colleges Student Success Scorecard, 2014; http://scorecard.cccco.edu
Notes: - Completion Rate is the percentage of degree and/or transfer-seeking students tracked for six years
through 2012-13 who completed a degree, certificate or transfer related outcomes.- 30 Units is the percentage of degree and/or transfer seeking students tracked for six years through 2012-
13 who achieved at least 30 units.- Persistence is the percentage of degree and/or transfer-seeking students tracked for six years through
2012-13 who enrolled in the first three consecutive terms.
The proportions of COS students who are not prepared for college-level courses have been slightly but consistently above than the statewide proportions of unprepared students, with 80% vs. 74%, 79% vs. 74%, and 77% vs. 74%.
For students at COS and statewide, completion rates for prepared students are significantly higher than the rates for unprepared students, with approximately 70% completion rates for prepared students and approximately 40% completion rates for unprepared students. In both the prepared and unprepared categories, COS students’ completion rates are lower than the rates for students statewide.
38

College of the Sequoias Master Plan 2015- 2025Chapter 2, Draft #3
In contrast to the pattern of higher achievement levels for prepared students for both students at COS and statewide the proportions of prepared students who have accumulated 30 units are higher than the 30 unit rates for unprepared students. The 30 unit rates for prepared students range from 69% to 74% and for unprepared students range from 64% to 65%. In both the prepared and unprepared categories, COS students’ 30 unit rates and persistence rates are comparable to those rates for students statewide.
For unprepared students, at COS and statewide, there is a consistent and striking disparity with the rate of students who have accumulated 30 units significantly higher than the completion rates. For example, in the cohort of students who entered the District in 2007/08, 64% had completed 30 units at the end of six years but only 36% had completed a degree, certificate or transfer related outcomes.
Data Set 28. Student Success Scorecard: Basic Skills Rates
2003/04 2005/06 2007/08COS State COS State COS State
N % % N % % N % %English 1,466 38% 41% 1,510 31% 42% 1,610 31% 44%Mathematics 1,767 25% 28% 1,674 26% 29% 1,883 27% 31%
Source: The California Community Colleges Student Success Scorecard, 2014; http://scorecard.cccco.edu
Note: These percentages indicate the percentage of credit students tracked for six years through 2012-13 who started below transfer level in English or mathematics and completed a college-level course in the same discipline.
COS students are much less likely than students statewide to begin below transfer level in English or mathematics and complete a college-level course in the same discipline within six years. In English, the statewide rates are 41% to 44% compared to rates of 31% to 38% for COS students. In mathematics, the statewide rates are 28% to 31% compared to rates of 25% to 27% for COS students.
39

College of the Sequoias Master Plan 2015- 2025Chapter 2, Draft #3
Data Set 29. Student Success Scorecard: Career Technical Education Rates2003/04 2005/06 2007/08
COS State COS State COS StateN % % N % % N % %
CTE 955 63% 54% 964 77% 54% 1,279 53% 54%Source: The California Community Colleges Student Success Scorecard, 2014; http://scorecard.cccco.edu
Note: CTE Rate is the percentage of students tracked for six years through 2012-13 who completed several courses classified as career technical education in a single discipline and completed a degree, certificate or transferred.
The rates of COS students completing a degree, certificate or transferring in a career technical education program has been higher than the statewide rates in prior years, but decreased significantly for the cohort of students who began in 2007/08 and the rate is now comparable to the statewide rate.
Data Set 30. Student Retention Rates in Credit Courses
Fall 2009 Fall 2011 Fall 2013State Total 85% 85% 85%District Total 88% 92% 88%Successful Grades 35,783 32,604 30,093All Grades 40,518 35,545 34,120Face-To-Face 89% 92% 89%Successful Grades 32,772 29,747 27,364All Grades 36,824 32,264 30,699Online Only 80% 86% 78%Successful Grades 1,540 1,364 1,313All Grades 1,916 1,588 1,689Online Hybrid 79% 88% 80%Successful Grades 592 659 773All Grades 750 751 972Online w/ Orientation 78% 83% 75%Successful Grades 302 330 183All Grades 385 398 243Others 90% 93% 89%Successful Grades 577 504 460All Grades 643 544 517
Source: COS Data Warehouse, COS Office of Research, Planning and Institutional Effectiveness and California Community Colleges Chancellor’s Office: datamart.cccco.edu
Notes: - Retention Rate is the ratio of all completed grades (A,B,C,D,F,CR,NC,P,NP,I) to all grade marks
(A,B,C,D,F,W,CR,NC,P,NP,I) for credit courses. Plus/Minus grades are included in the ratio. - The category “Online with Orientation” refers to a pilot project in which faculty and students meet once at
the start of the semester for an on-campus orientation to the course and to the online teaching/learning environment.
40

College of the Sequoias Master Plan 2015- 2025Chapter 2, Draft #3
- The category “Others” in this data set includes work experience, tutoring, directed study, field experience, independent study, hybrid video and other instructional activities.
COS has an impressive rate of student retention, ranging from 88% to 92% in this snapshot. These rates are consistently higher than the statewide averages for these three fall semesters.
The rates for student retention in face-to-face courses is higher than other methods of instruction, reaching 92% in fall 2011. Student retention rates in all types of online courses are lower than face-to-face methods.
Data Set 31. Student Successful Course Completion Rates in Credit Courses
Fall 2009 Fall 2011 Fall 2013State Total 67% 69% 69%District Total 67% 69% 68%Successful Grades 26,976 24,663 23,362All Grades 40,518 35,545 34,120Face-To-Face 68% 70% 70%Successful Grades 25,064 22,671 21,431All Grades 36,824 32,264 30,699Online Only 44% 59% 53%Successful Grades 840 932 902All Grades 1,916 1,588 1,689Online Hybrid 57% 62% 58%Successful Grades 425 465 559All Grades 750 751 972Online w/ Orientation 39% 46% 41%Successful Grades 152 182 100All Grades 385 398 243Others 77% 78% 72%Successful Grades 495 422 370All Grades 643 544 517
Sources: COS Data Warehouse, COS Office of Research, Planning and Institutional Effectiveness, and California Community Colleges Chancellor’s Office: datamart.cccco.edu
Notes:- Successful Course Completion Rate is the ratio of successful grade marks (A,B,C,CR,P) to all
grade marks (A,B,C,D,F,W,CR,NC,P,NP,I) for credit courses. Plus/Minus grades are included in the ratio.
- The category “Online with Orientation” refers to a pilot project in which faculty and students meet once at the start of the semester for an on-campus orientation to the course and to the online teaching/learning environment.
- The category “Others” in this data set includes work experience, tutoring, directed study, field experience, independent study, hybrid video and other instructional activities.
41

College of the Sequoias Master Plan 2015- 2025Chapter 2, Draft #3
The District’s overall successful course completion rates are consistent across this five-year summary and are comparable to the statewide average for these three fall semesters.
COS students’ successful course completion rates for face-to-face and online hybrid courses were relatively consistent across this period in the range of 68%-70% for face-to-face courses and 57%-62% for online hybrid courses.
Although there has been an improvement in the COS students’ successful course completion rates in online courses, increasing from 44% in fall 2009 to 53% in fall 2013, the disparity between the successful course completion rates in face-to-face versus online courses is an issue. COS students in face-to-face courses are significantly more successful in completing courses with a passing grade compared to students in online and online hybrid courses.
Data Set 32. Students’ Successful Course Completion Rates by Race/Ethnicity
Race/Ethnicity Fall 2009 Fall 2011 Fall 2013
% N % N % N
Alaskan/Native American 64% 232 72% 170 58% 165
Asian 73% 1,774 76% 1,561 74% 1,277Black/African American 57% 1,409 62% 1,361 61% 1,180
Hispanic 64% 20,820 66% 19,610 67% 19,658Non-Resident Alien 76% 111 72% 54 75% 63Pacific Islander 50% 119 74% 66 74% 31
Two or More 65% 1,562 68% 1,568 68% 1,894
White 71% 13,523 76% 10,571 72% 9,286Unknown 75% 969 74% 584 69% 570
District Total 67% 40,519 69% 35,545 68% 34,124
State Total 67% 69% 69%Sources: COS Data Warehouse, COS Office of Research, Planning and Institutional Effectiveness, and California Community Colleges Chancellor’s Office: datamart.cccco.edu
Note: Successful Course Completion Rate is the ratio of successful grade marks (A,B,C,CR,P) to all grade marks (A,B,C,D,F,W,CR,NC,P,NP,I) for credit courses. Plus/Minus grades are included in the ratio.
In fall 2013 the race/ethnicity cohorts with the lowest students’ successful course completion rates are Alaskan/Native American (58%) and Black/African American (61%).
Since fall 2009 there has been improvement in students’ successful course completion rates for students who self-identify as Black/African American (from 57% to 61%), Hispanic (from 64% to 67%), Pacific Islander (from 50% to 74%), and two or more races (from 65% to 68%).
Overall, the district’s successful course completion rates are comparable to the state rates.
42

College of the Sequoias Master Plan 2015- 2025Chapter 2, Draft #3
Data Set 33. Students’ Successful Course Completion Rates by Age
Successful Course Completions by Age
AgeFall 2009 Fall 2011 Fall 2013
% N % N % N
Under 20 64% 15,418 67% 13,740 67% 11,849
20 - 24 65% 13,219 68% 12,661 68% 13,714
25 - 49 72% 10,809 74% 8,367 71% 7,981
50 and Above 79% 1,073 77% 777 73% 580
District Totals 67% 40,519 69% 35,545 68% 34,124
State Totals 67% - 69% - 69% -
Under 20 66% - 69% - 69% -
20 - 24 65% - 66% - 68% -
25 - 49 72% - 72% - 73% -
50 and Above 78% - 77% - 76% -Sources: COS Data Warehouse, COS Office of Research, Planning and Institutional Effectiveness, and California Community Colleges Chancellor’s Office: datamart.cccco.edu
Note: Successful Course Completion Rate is the ratio of successful grade marks (A,B,C,CR,P) to all grade marks (A,B,C,D,F,W,CR,NC,P,NP,I) for credit courses. Plus/Minus grades are included in the ratio.
Although overall, older students have higher student successful course completion rates compared to younger students, over this five-year period, the student successful course completion rates increased slightly for younger students and declined slightly for students age 50 and older.
Data Set 34. Students’ Successful Course Completion Rates by Unit Load
Student Load Fall 2009 Fall 2011 Fall 2013
% N % N % N
Full-time 76% 21,143 78% 19,050 80% 17,379
Part-time 56% 19,376 59% 16,495 57% 16,745
District Total 67% 40,519 69% 35,545 68% 34,124
State Total 67% 69% 69%Sources: COS Data Warehouse, COS Office of Research, Planning and Institutional Effectiveness, and California Community Colleges Chancellor’s Office: datamart.cccco.eduNote: Successful Course Completion Rate is the ratio of successful grade marks (A,B,C,CR,P) to all grade marks (A,B,C,D,F,W,CR,NC,P,NP,I) for credit courses. Plus/Minus grades are included in the ratio. Full-time: Enrolled in 12 or more units, Part-time: Enrolled in fewer than 12 units
Consistently over this five-year review, students who enroll in 12 or more units have higher student
43

College of the Sequoias Master Plan 2015- 2025Chapter 2, Draft #3
successful course completion rates compared to students who enroll in fewer than 12 units.
Full-time students’ successful course completion rates steadily increased from fall 2009 (76%) to fall 2013 (80%).
Data Set 35a. Student Degree Completion by Race/Ethnicity
Distribution of Degrees and Certificates
Degree/Certificate 2008/09 2010/11 2012/13
State Totals N% of All Awards N
% of All Awards N
% of All Awards
State Associate Total - 65% - 62% - 60%State Cert. of Achievement - 20% - 25% - 26%State Skill Certificate - 15% - 12% - 14%District TotalsAssociate Degrees 736 61% 1001 58% 987 65%Certificate of Achievement 384 32% 208 12% 213 14%Skill Certificates 77 6% 513 30% 315 21%District Total Awards 1197 100% 1722 100% 1515 100%
Sources: COS Data Warehouse, COS Office of Research, Planning and Institutional Effectiveness, and California Community Colleges Chancellor’s Office: datamart.cccco.edu
Notes: - Certificates of Achievement require 18 units or more units and are approved by the Chancellor’s Office.- Skills Certificates require fewer than 18 units.- This data set presents the number of awarded granted in a year. Students may earn multiple awards in a
year.
Of all COS degrees and certificates awarded in 2012/13, 65% were associate degrees. This is a higher proportion of associate degrees compared to previous years and significantly higher than the proportion of associate degrees compared to total degrees statewide. In previous years, the proportions of associate degrees awarded by COS were slightly below the proportions of associate degrees in statewide awards.
Statewide, the proportions of certificates of achievement awarded increased from 20% to 26% between 2008/09 and 2012/13 while the proportions of certificates of achievement awarded by COS decreased from 32% to 14% in the same time period.
Data Set 35b. Student Degree Completion by Race/Ethnicity
44

College of the Sequoias Master Plan 2015- 2025Chapter 2, Draft #3
Distribution of Degrees by Race/Ethnicity
Associate Degrees 2008/09 2010/11 2012/13
N % of Awards N % of Awards N % of AwardsDistrict Total 736 100% 1,001 100% 987 100%Alas/Nat.Amer 6 1% 8 1% 0 0%Asian 44 6% 39 4% 56 6%Black/Af.Amer 22 3% 24 2% 19 2%Hispanic 251 34% 391 39% 452 46%Non-Resident Alien 0 0% 1 0% 0 0%Pac Islander 2 0% 3 0% 2 0%Two or More 9 1% 53 5% 33 3%White 260 35% 352 35% 331 34%Unknown 142 19% 130 13% 94 10%
Sources: COS Data Warehouse, COS Office of Research, Planning and Institutional Effectiveness, and California Community Colleges Chancellor’s Office: datamart.cccco.edu
Between 2008/09 and 2012/13 the number of associate degrees awarded by COS increased 34% during this same period that the overall student headcount declined 21% (Refer to Data Set 11.)
Data Set 36a. Student Certificate Completion by Race/Ethnicity
Distribution of Certificates of Achievement by Race/Ethnicity
Cert. of Achievement 2008/09 2010/11 2012/13
N % of Awards N % of Awards N % of AwardsDistrict Total 384 100% 208 100% 213 100%Alas/Nat.Amer 1 0% 0 0% 2 1%Asian 11 3% 7 3% 5 2%Black/Af.Amer 11 3% 13 6% 3 1%Hispanic 145 38% 103 50% 125 59%Non-Resident Alien 0 0% 0 0% 0 0%Pac Islander 1 0% 0 0% 0 0%Two or More 4 1% 6 3% 5 2%White 131 34% 48 23% 64 30%Unknown 80 21% 31 15% 9 4%
Sources: COS Data Warehouse, COS Office of Research, Planning and Institutional Effectiveness, and California Community Colleges Chancellor’s Office: datamart.cccco.edu
45

College of the Sequoias Master Plan 2015- 2025Chapter 2, Draft #3
Of all awards earned by COS students, the proportions of certificates of achievement declined from 32% to 17% and the proportions of skill certificates increased from 6% to 26% between 2008/09 and 2012/13 (refer to Data Set 36b.)
The total certificates of achievement declined 45% from 384 in 2008/09 to 213 in 2012/13, which is greater than the 21% decline in overall student headcount. (Refer to Data Set 11.)
The proportions of certificates of achievement earned by students who self-identify as Hispanic have steadily increased, from 38% of all COS awards in 2008/09 to 59% of all COS awards in 2012/13. The proportions of certificates of achievement earned by students who self-identify as White have been relatively consistent across these years.
Data Set 36b. Student Degree Completion by Race/Ethnicity
Distribution of Skill Certificate by Race/EthnicitySkill Certificate 2008/09 2010/11 2012/13
N % of Awards N % of Awards N % of Awards
District Total 77 100% 513 100% 315 100%Alas/Nat.Amer 0% 6 1% 0 0%Asian 5 6% 13 3% 11 3%Black/Af.Amer 3 4% 14 3% 0 0%Hispanic 43 56% 265 52% 173 55%Non-Resident Alien 1 1% 0 0% 0 0%Pac Islander 0 0% 0 0% 1 0%Two or More 2 3% 12 2% 17 5%White 13 17% 185 36% 102 32%Unknown 10 13% 18 4% 11 3%
Sources: COS Data Warehouse, COS Office of Research, Planning and Institutional Effectiveness, and California Community Colleges Chancellor’s Office: datamart.cccco.edu
The proportions of skill certificates earned by students who self-identify as Hispanic have remained consistent, in the range of 52% to 56% while the proportions of skill certificates earned by students who self-identify as White have almost doubled, from 17% to 32%.
46

College of the Sequoias Master Plan 2015- 2025Chapter 2, Draft #3
PERCEPTIONS OF THE DISTRICT
Data Set 37. Community Perceptions
How would you rate the quality of education provided by the College of the Sequoias?
Source: Tulare Area Reauthorization Bond Election Survey, 2012
Note: These community perceptions were gathered in 2012 when 400 of community members (registered voters) were interviewed over six days to ascertain their perceptions of the District prior to a bond election.- A telephone survey of 400 likely voters (those having voted in November 2008, or registered after
November 2008 and voted in November 2010, or registered after November 2010) in the District was conducted between June 01, 2012 through June 06, 2012.
- Surveys were conducted during the weekdays in the evenings.- The average length of the survey was about 10.1 minutes.- Margin of error for this sample is +/- 4.85%.
A strong majority (74%) of the community members who participated in this survey rated the quality of education as “good” or “excellent.”
Good 43%
Excellent 31%
Fair 7%
Don’t Know/Unsure 13%
Poor/ Very Poor2%
47
College of the Sequoias Master Plan 2015- 2025Chapter 2, Draft #3
Data Set 38. Community College Survey of Student Engagement
0.00
10.00
20.00
30.00
40.00
50.00
60.00
70.00
80.00
90.00
100.00
50.60 47.70 47.70 45.6048.50
51.20 48.4051.10
48.8050.80
2009 Sequoias Benchmark Scores2011 Sequoias Benchmark Scores
Source: Community College Survey of Student Engagement, 2009 and 2011
Note: This survey was completed by 933 students in spring 2009 and 889 students in spring 2011.
Comparing the results from the 2009 and 2011 surveys, COS improved on all benchmarks of student engagement.
COS students slightly exceeded the national average of 50.00 on three benchmarks on this national survey.
- Active and Collaborative Learning, which asks students about their activities related to learning, such as whether they made a class presentation or worked collaboratively with a classmate on a project.
- Academic Challenge, which asks students about the level of academic rigor, such as whether their coursework requires the analysis of the basic elements of an idea or theory and the required amount of reading and writing.
- Support for Learners, which asks students about the level of support provided by the institution, such as financial support, and students’ use of services such as academic advising.
COS students were below the national average of 50.00 on two benchmarks on this national survey.
48

College of the Sequoias Master Plan 2015- 2025Chapter 2, Draft #3
- Student Effort, which asks students about the amount of effort they expend related to coursework, such as whether they prepared two or more drafts of an assignment before turning it in and whether they came to a class meeting without completing assigned readings or exercises.
- Student-Faculty Interaction, which asks students whether or not they discuss class assignments or career plans with faculty.
Data Set 39. Community College Faculty Survey of Student Engagement
Do students ask questions in class or contribute to class
discussions?
Do students make class presentations?
Do student work with other students on projects during
class?
Response Full-time Part-time Full-time Part-time Full-time Part-timeVery Often 56% 48% 9% 16% 26% 35%Often 28% 34% 21% 22% 30% 33%Sometimes 14% 17% 37% 41% 30% 16%Never 0 0 28% 22% 7% 14%Don’t Know 2% 0 5% 0 7% 2%
Source: Community College Faculty Survey of Student Engagement, 2011
Note: This survey is a companion to the Community College Survey of Student Engagement and was completed by 107 faculty members in spring 2011.
This sample of three questions from the Community College Faculty Survey of Student Engagement focuses on the area of Academic and Collaborative Learning. Over 80% of full-time and part-time faculty report that in their perceptions, students “often” or “very often” participate during class by asking questions or making comments.
Thirty percent of the full-time faculty requires students to make class presentations “often” or “very often” compared to 38% of the part-time faculty.
Both part-time and full-time faculty creates venues for students to work with other students on projects during class (“often” or “very often”).
49

College of the Sequoias Master Plan 2015- 2025Chapter 2, Draft #3
CURRENT AND ANTICIPATED CHALLENGES
The purposes of the first two chapters of this master plan are to identify the District’s benefits and successes as well as to analyze the District’s effectiveness in meeting its mission.
The COS mission is:
College of the Sequoias is a comprehensive community college focused on student learning that leads to productive work, lifelong learning and community involvement.
College of the Sequoias affirms that our mission is to help our diverse student population achieve its transfer and/or occupational objectives and to advance the economic growth and global competitiveness of business and industry within our region.
College of the Sequoias is committed to supporting students' mastery of basic skills and to providing programs and services that foster student success.
Using this mission statement as the benchmark, these chapters provide evidence of some of the District’s successes and benefits.
The District’s geographic region is projected to increase in population and that projection includes sustained growth in residents of college-going ages. (Data Set 1. and Data Set 2.)
Employment growth is projected for the District’s geographic region. (Data Set 7., Data Set 8., and Data Set 9.)
District students are younger than the statewide student population, with 65% of the District’s students age 24 old or younger at all three District sites, compared to 56% of students in that age cohort statewide. (Data Set 18. and Data Set 19.)
COS has an impressive rate of student retention, ranging from 88% to 92% in a five-year summary. These retention rates are consistently higher than the statewide averages for the same semesters. (Data Set 30.)
The rates at which COS students earn passing grades are consistent across a five-year summary and are comparable to the statewide average for the same semesters. (Data Set 31.)
The successful course completion rates for COS college-age students (age 20 - 24) increased from 65% in fall 2009 to 68% in fall 2013. (Data Set 33.)
The successful course completion rates for COS full-time students increased from 76% in fall 2009 to 80% in fall 2013. (Data Set 34.)
50

College of the Sequoias Master Plan 2015- 2025Chapter 2, Draft #3
In order to identify its current and anticipated challenges, the District analyzed the information in these two chapters by:
Comparing its current status to its mission (internal scans) in order to identify current challenges and
Studying projected demographics, legislative, and economic changes (external scans) in order to anticipate the challenges that the District will be called upon to address in the coming decade.
Based on this analysis, the District identified the following current and anticipated challenges. Challenge #1: To fulfill its mission, COS must accommodate the anticipated increases in student demand at all district campuses.
Student demand is projected to increase in the next ten years. Based on data in the previous chapters, the District projects that enrollment will grow at the rate of x% per year each year in the coming decade. This projection of the overall college growth projection is based on the following demographic projections and recent history.
Student demand is projected to increase because the populations in the communities served by the District are projected to increase. Between 2010 and 2025 Kings County is projected to increase 26% (35% by 2030) and Tulare County is projected to increase 30% (42% by 2030). (Data Set 1.)
However, the impact of these projected increases in total population are offset to some extent by the low college-going rates of local high school graduates. The population increases are projected to be evenly distributed across the age cohorts, with the college-age population on both counties projected to remain consistent, (Data Set 2.
Student demand is projected to increase because the District was required by reductions in state funding in recent years to limit student access to higher education. As a result, the number of students served by District decreased 21% between fall 2009 and fall 2013. (Date Set 11.) In alignment with the reduction in student headcount, the number of course enrollments decreased 29% between fall 2009 and fall 2013. (Data Set 13.) The District has begun address these unmet student needs as evidenced by the increase in FTES earned in 2013/14(8711 FTES in 2012/13; 9480 FTES in 2013/14). However, student demand/ enrollment decreases as the economy improves (one reason for decrease is in 09-13).
Student demand is projected to increase because the District opened two facilities that are geographically separated from COS-Visalia Campus. This action was taken in order to expand student access to the District’s programs and services. Each of the two new sites, COS-Hanford Educational Center that opened in fall 2010 and COS-Tulare College Center that opened in spring 2013, offer unique career technical education programs as well as general education courses.
51
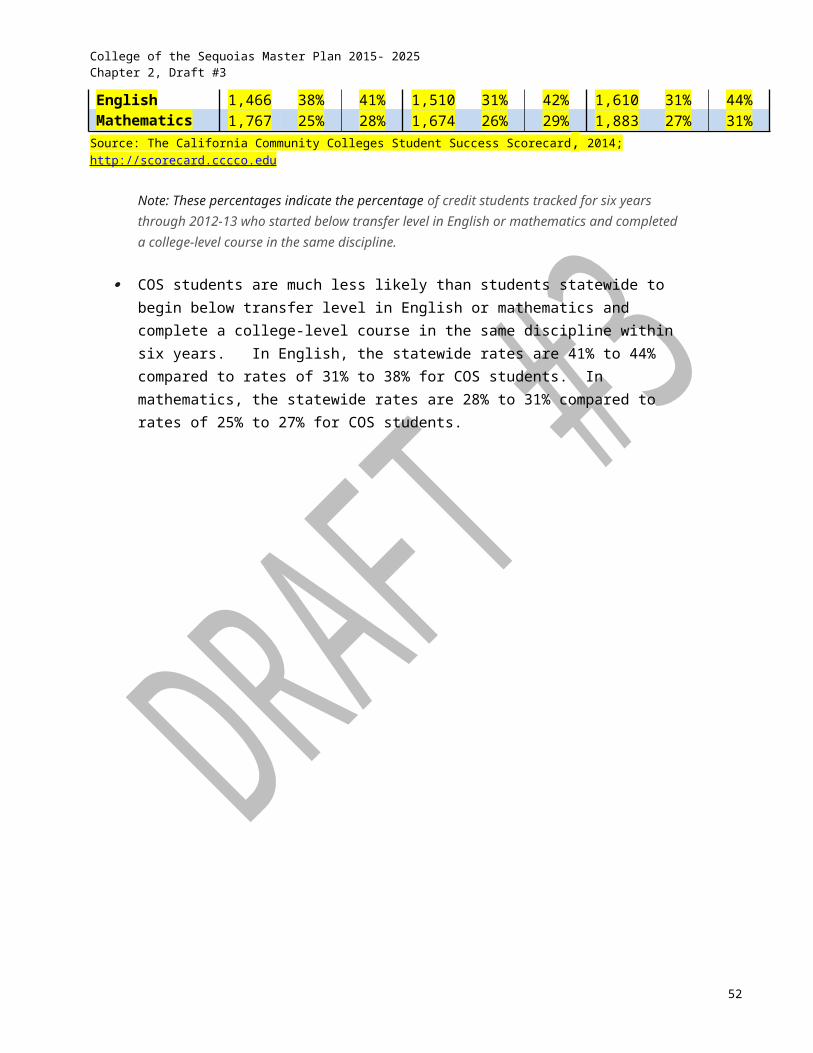
College of the Sequoias Master Plan 2015- 2025Chapter 2, Draft #3
However, these additions promise to contribute to addressing student needs, contingent on the District’s ability to increase programs and staffing for these sites, (Chapter 1)
Student demand is projected to increase because jobs requiring postsecondary education are projected to increase. Adults with the lowest educational attainment have the highest rates of unemployment. (Data Set 10.) This trend is likely to continue if economists are correct in projecting that the education level required for employment will increase in the next decade. One such forecast from the Lumina Foundation project that if the current rate of degree completion continues, 45% of California’s working adults will have earned a college degree by 2025, far short of the 61% that is projected to be needed for the workforce. (Chapter 1)
Challenge #2: To fulfill its mission, COS must improve the rate at which its students complete degrees, certificates, and transfer objectives.
Students’ completion of degrees, certificates and transfer requirements as a strategy to meet workforce needs is a focus of national, state and local attention. At the national level, economists project that the majority of tomorrow’s jobs will require postsecondary education. The projection for California is that by 2020, 61% of the jobs will require postsecondary education: 32% will require some college, a career technical certificate, or an associate degree; 23% will require a bachelor’s degree; and 12% will require a master’s degree. To meet this need and to offset the decline in the educational attainment of US citizens, the President’s American Graduation Initiative set a target for each community college to triple the number of degrees and certificates awarded by 2020. (Chapter 1)
On the Student Success Scorecard the metric of completion rate is calculated as the percentage of degree and/or transfer-seeking students tracked for six years through 2012-13 who completed a degree, certificate or transfer related outcomes. These Student Success Scorecard data indicate that completion rates for COS students over the past five years have been consistently below students’ completion rates statewide. (Data Set 25.)
Although below students’ completion rates statewide, in recent years, the number of degrees awarded by COS increased. Between 2008/09 and 2012/13 COS awarded 34% more associate degrees during the same period that the overall student headcount declined 21%. (Data Set 11. and Data Set 35.) Although the increase in the number of associate degrees awarded by COS is impressive, this completion rate is unlikely to meet current and projected workforce needs and is below the statewide rates for completion of degrees, certificates, and transfer requirements. (Chapter 1 and Data Set 25)
In order to meet this challenge of increasing the rate of students’ completion of degrees and certificates, COS will need to dedicate attention to the viability of its career technical education programs as well as to multiple benchmarks of students’ matriculation, highlighted by the following specific issues.
Career Technical Education Programs
52

College of the Sequoias Master Plan 2015- 2025Chapter 2, Draft #3
In order to increase students’ successful completion of degrees, certificates and transfer requirements, the District must ensure that the links between program completion and employment are visible and authentic for both employers and students.
The District expanded students’ access to higher education opportunities by building facilities that are geographically separated and that feature unique career technical educational programs. Increased enrollment at each location is evidence of students’ positive responses to these opportunities. (Chapter 1 and Data Set 18.)
This expansion of access to higher education is well timed because employment growth is projected in a range of industry sectors in the next decade. Although this is positive news for this region because the local unemployment rate of approximately 15% in March 2014 in both counties is higher than state and national rates, many of the new jobs require little to no formal education. (Chapter 1, Data Set 7., Data Set 9.)
Since higher levels of educational attainment are predictive of higher income and lower unemployment, in order to fulfill its mission, the District is committed its role in contributing to the economic growth of the region by training students to become skilled employees. (Chapter 1 and Data Set 10.) and entrepreneurs.
Students’ Readiness for College The low level of students’ preparedness for college-level coursework may be a factor in the District’s lower completion rates. Of the degree and transfer seeking COS students who voluntarily completed course placement tests in 2012/13, 58% were not prepared for college-level coursework in English and 85% were not prepared for college-level coursework in mathematics. (Data Set 24.) Using the Student Success Scorecard data, the proportions of COS students who are not prepared for college-level courses have been slightly but consistently above the proportions of unprepared students statewide, with 80% versus 74%, 79% versus 74%, and 77% versus 74%. Although prepared students have higher completion rates than unprepared students, COS students’ completion rates for both prepared and unprepared students are slightly lower than the completion rates for students statewide. (Data Set 27.)
Students’ Transition from Basic Skills to College-level Coursework The Student Success Scorecard data on basic skills reinforces the idea that students’ level of preparedness for college-level coursework may be a factor in the District’s lower completion rates. These data indicate the percentage of credit students tracked for six years through 2012-13 who started below transfer level in English or mathematics and completed a college-level course in the same discipline. On this metric, COS students are much less likely than students statewide to begin below transfer level in English or mathematics and complete a college-level course in the same discipline within six years. In English, the statewide rates are 41% to 44% compared to rates of 31% to 38% for COS students. In mathematics, the statewide rates are 28% to 31% compared to rates of 25% to 27% for COS students. (Data Set 28.)
53

College of the Sequoias Master Plan 2015- 2025Chapter 2, Draft #3
Students’ Transition from Some College Credit to Degree/Certificate Completion/Transfer The Student Success Scorecard data on students who continue their education after achieving 30 units indicates another area of concern for COS.
Although a significant proportion of both prepared and unprepared COS students complete 30 units, the challenge for COS is to improve the rate at which students move from reaching the 30-unit benchmark to the completion of degrees, certificates, and/or transfer requirements. For example, in the cohort of unprepared students who entered the District in 2007/08, 64% had completed 30 units at the end of six years but only 36% completed a degree, certificate or transfer related outcomes. (Data Set 27.)
Similar patterns are found in the data on persistence. In the Student Success Scorecard persistence is defined as the percentage of degree and/or transfer-seeking students tracked for six years through 2012-13 who enrolled in the first three consecutive terms. Like the 30-unit benchmark, this metric is considered a momentum point in students’ matriculation because research shows that students with sustained enrollment are more likely to succeed. COS students’ persistence rate was higher than the statewide rates for prepared students who entered in 2003/04 and 2005/06 but lower than the statewide rates for prepared students who entered in 2007/08. The persistence rates of COS unprepared students have been comparable to the statewide persistence rates for unprepared students across the same time periods except for the cohort of 2007/08 (COS: 66% State: 70%). (Data Set 27.)
Taken together, these two measures indicate that COS students are likely to enroll in three or four consecutive semesters and accumulate 30 units, but then fail to sufficiently pursue to their education to complete degree and transfer requirements.
Students’ Number of Units per Semester In fall 2013 approximately 65% of COS students took fewer than 12 units per semester. (Data Set 16.) The good news is that this proportion of full-time to part-time students at COS is slightly higher than the statewide proportions, in which 69% were part-time in fall 2013. The bad news is that the majority of COS students are part-time and part-time students have lower successful course completion rates than full-time students, 57% compared to 80% in fall 2013. (Data Set 16. and Data Set 34.)
Students’ Successful Completion of Distance Education Courses Although there has been an improvement in students’ successful course completion rates in COS online courses, increasing from 44% in fall 2009 to 53% in fall 2013, only about half of COS students successfully complete the distance education courses in which they enrolled. (Data Set 31.)
Challenge #3: To fulfill its mission, COS must strategically tailor its academic programs and student services to the unique demographics of its communities.
54

College of the Sequoias Master Plan 2015- 2025Chapter 2, Draft #3
In order to provide meaningful support to its students, the District must tailor both academic programs and student services to meet the unique demographic variables that characterize its students and communities. These multiple and interacting demographic variables are summarized below.
Forty-two to forty-eight percent of the residents in Tulare and Kings Counties over the age of five speak a language other than English at home. (Data Set 4.)
The level of educational attainment for adult residents within the District’s geographic boundaries is low compared to statewide levels. Of the adult residents in Tulare County and Kings County, 32% and 29% respectively have not graduated from high school compared to 19% statewide. The proportions of adults who have some college and an associate degree in these two counties are comparable to the statewide statistics, but the proportions of adult residents who have earned a bachelor’s degree or higher (13% in Tulare County and 12% in Kings County) is significantly below the statewide rate of 31% for this level of educational attainment. (Data Set 5.)
Consequently, close to 70% of first-time students who enroll in the District are also the first generation in their families to attend college. This is higher than the 2012 estimate from the California Community Colleges Chancellor’s Office that 61% of first-time students were first generation college students. (Data Set 23.)
Consistent with the link between levels of educational attainment and employment, the unemployment rate in the District’s communities of 15% as of March 2014 is higher than state and national rates. (Chapter 1 and Data Set 10.)
The income for many residents within the District’s geographic boundaries is below poverty level. Both Tulare and Kings Counties have a greater proportion of families living below poverty level compared to the statewide rate of 11.5% (Tulare: 20.5% to Kings: 17.1%). %. (Data Set 6.)
Combined, these demographic variables portray a complex student profile in which as many as half of COS students have few role models who achieved high levels of educational attainment combined with living in households with unemployment and poverty. When parents have little/no postsecondary education, they often cannot serve as effective role models to guide their children’s academic success and they may not fully understand the benefits and language of postsecondary education. A corresponding factor is that these COS students live in households with high unemployment rates and poverty, which may necessitate them dedicating time and energy to their families through part-time employment and/or increased household responsibilities. These factors combine and interact, serving as significant barriers to students’ pursuit of their educational goals, which thereby limits students’ abilities to break the cycle of under-education and poverty. (Data Set 5., Data Set 6., 10.)
55

College of the Sequoias Master Plan 2015- 2025Chapter 2, Draft #3
Economic concerns within the family and the possible necessity to work part-time may contribute to the high portion of COS students who enroll in fewer than 12 units per semester. In fall 2013, 65% of COS students were enrolled in 11.9 or fewer units. This is a concern for student success in two ways: (1) fewer units per semester are linked to lower likelihood of completing degrees, certificates and transfer requirements and (2) the number of units per semester is correlated with students’ successful course completion rates. Overall part-time students have lower successful course completion rates than full-time students, 57% compared to 80% in fall 2013. (Data Set 16. and Data Set 34.)
Challenge #4: To fulfill its mission, COS must sustain and improve operational structures and systems for institutional assessment and continuous improvement.
Based on discussions, comments and feedback gathered at the May 3, 2014 Academic Senate Summit, which was attended by more than eighty participants/contributors representing the COS faculty, staff, students, Board, and community members, an additional challenge was identified. In response to the 2012 ACCJC show cause sanction the District has been undergoing a major transformation in its governance, planning, decision-making and resource allocation structures. In order to further increase its institutional effectiveness, the District must sustain and improve its operational structures and systems.
The next step is for the District to develop District Goals that describe how it intends to address the identified current and anticipated challenges.
56


![An Interim ReportIMAGE AND VIOFO DATA OVER LOW BIT RAIE NOISY CHANNELS] Interim Report (Notre Dame Univ.) 12 p G3/61 N95-11764 Unclas 0022366. EXECUTIVE SUMMARY This research project](https://cdn.vdocuments.us/doc/165x107/611ca2118951fb1fac3342f7/an-interim-report-image-and-viofo-data-over-low-bit-raie-noisy-channels-interim.jpg)


