
CARAVEL MINERALS LIMITED Investor Presentation
November 2016. ASX: CVV
For
per
sona
l use
onl
y

Investor Presentation | November 2016 | Page 2
Rapidly advancing Calingiri Copper-MolybdenumProject in W.A.
- Large Resource (April 2016): Maiden JORCMineral Resource estimate released, 1.4Mt Cu
- Scoping Study (June 2016): Confirmed potentialas a low-cost mid-tier producer with low Capexand robust economics
- Tier-1 Partner: Leading international miner FirstQuantumMinerals (FQM:TX)
Bryah “Degrussa” style copper projectexploration program underway near Meekatharra
Management:Experienced,highlyskilledteamandBoard
LowBurn: Oneoftheleanestjuniorminingcompanies
Forward Strategy: Calingiri PFS in H1 2017followed by DFS and construction in late 2018
Company Highlights
For
per
sona
l use
onl
y

Investor Presentation | November 2016 | Page 3
Corporate SnapshotCaravelMineralsMajorShareholders*:
*asof8November2016
BoardandManagement:11.3%
Cash*: $1.5M
Debt*: Nil
SharePrice*: $0.07
12monthsrange: $0.06-$0.15
Avg dailyvolume: 121K
MarketCap(undiluted): A$5M
SharesOutstanding^: 68M
OptionsListed: 0M
Unlisted: 18M
Nov16:PlacementraisedA$1.2m
CKLShun&SLChoy 9.2%
FirstQuantumMinerals 8.8%
NESTORInvestment 5.1%
Eyeon Investments 4.9%
NewsteadHoldings 4.5%
Retzos Investment 4.2%
Waratah/Taylor 3.7%
PoustieGroup 3.7%
HilmerGroup 3.6%
HealyGroup 3.6%
GeoffreyLevy 3.4%
Clarkson’sBoathouse 3.0%
Goldfire Enterprises 2.8%
CorporatePropertyServices 2.4%
Calama Holdings 1.3%
Total– Top15 64.2%For
per
sona
l use
onl
y

50.1%projectequity
Calingiri and First Quantum Minerals
Investor Presentation | November 2016 | Page 4
1. FQMhasa“RightofFirstRefusal”afterobtaininga50.1%equitystake2. Thenotewasconvertedtoshareson8September2015at28.6cashare
FQM- Largeglobalcopperproducer:marketcap~A$8b(FM:TSX).OperatingsevenminesanddevelopingfivebulktonnageprojectsinZambia,Peru,ArgentinaandPanama
Farm-In1st Phase- $1.2m
ü
JVPartner’s1
11/2015 ~9/2016 ~9/2017
Equity$1.7m+Note$0.6m2
ü
Commencefarm-In2nd Phase- +$2.4m
by9/2017
2014/15
For
per
sona
l use
onl
y

Scoping Study1 Key Findings
Investor Presentation | November 2016 | Page 5
• NPV$520maftertax
• IRR23%
• Payback3years
• Netcashflow$1.5b
• Cu710ktLoM(92%Revenue)
• Moly14.5kt(5%)
• SilverandGold(3%)
• FloatConc25%
• Throughput15Mtpa(21Yrs)
• Oretreated310mt
• Recoveries92%
• Stripratio1:1
• Capitalcost$440m
• Opex- Lom$1.50/lb
• Opex– 1st 5Yrs$1.40/lb
• CuUS$2.75/lb(FXA$0.72)
Capex/Opex
Mine/Plant
EconomicsProduction
1 – Prepared by CSA Global Pty Ltd June 2016. Please read in conjunction with disclosures on page 2 andpublic releases available on the ASX
Economics
For
per
sona
l use
onl
y
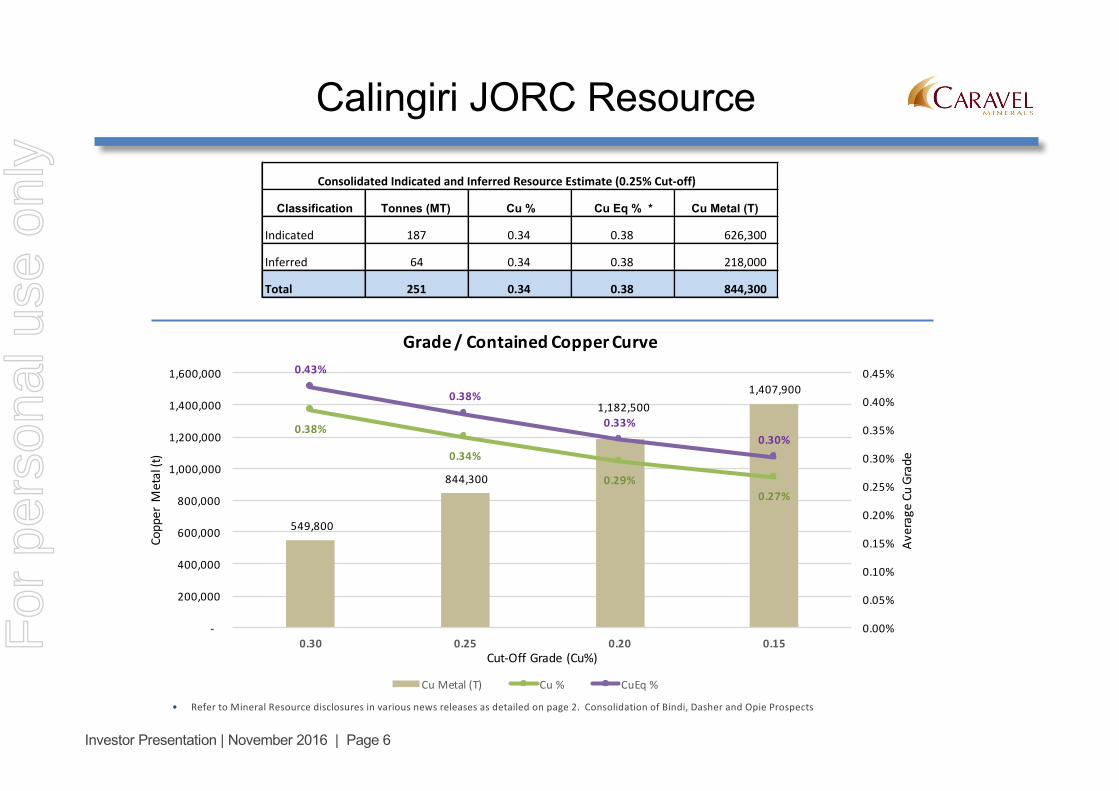
• RefertoMineralResourcedisclosuresinvariousnewsreleasesasdetailedonpage2.ConsolidationofBindi,DasherandOpieProspects
Investor Presentation | November 2016 | Page 6
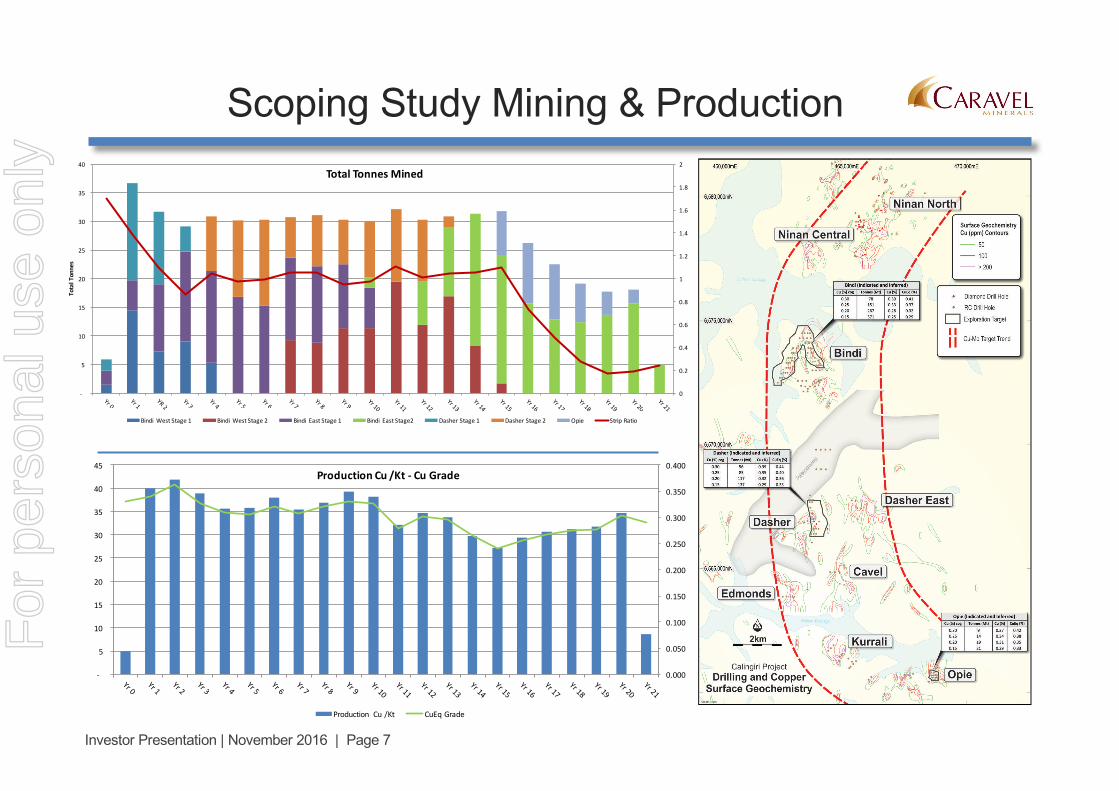
Broadintersectionsofopencopper-molybdenum-silver-goldmineralisation:Dasher:1,050mlongandopen- extendingtoverticaldepthsof450mBindi:2,000mlongandopen- upto150mthickextendingtoverticaldepthsof300mOpie:300mlongandopen- upto172mthickextendingtoverticaldepthsof200m
549,800
844,300
1,182,5001,407,900
0.38%
0.34%
0.29%0.27%
0.43%
0.38%
0.33%0.30%
0.00%
0.05%
0.10%
0.15%
0.20%
0.25%
0.30%
0.35%
0.40%
0.45%
-
200,000
400,000
600,000
800,000
1,000,000
1,200,000
1,400,000
1,600,000
0.30 0.25 0.20 0.15
AverageCuGrade
CopperM
etal(t)
Cut-OffGrade(Cu%)
Grade/ContainedCopperCurve
CuMetal(T) Cu% CuEq%
Classification Tonnes (MT) Cu % Cu Eq % * Cu Metal (T)
Indicated 187 0.34 0.38 626,300
Inferred 64 0.34 0.38 218,000
Total 251 0.34 0.38 844,300
ConsolidatedIndicatedandInferredResourceEstimate(0.25%Cut-off)
Calingiri JORC Resource
For
per
sona
l use
onl
y
0
0.2
0.4
0.6
0.8
1
1.2
1.4
1.6
1.8
2
-
5
10
15
20
25
30
35
40
TotalTonnes
TotalTonnesMined
BindiWestStage1 BindiWestStage2 Bindi EastStage1 Bindi EastStage2 DasherStage1 DasherStage2 Opie StripRatio
Scoping Study Mining & Production
Investor Presentation | November 2016 | Page 7
0.000
0.050
0.100
0.150
0.200
0.250
0.300
0.350
0.400
-
5
10
15
20
25
30
35
40
45ProductionCu/Kt- CuGrade
Production Cu/Kt CuEqGrade
For
per
sona
l use
onl
y

Scoping Study Sensitivities
Investor Presentation | November 2016 | Page 8
• Economicoutcomesarerobust
• Mostsensitivetocopperprice
• Breakevenpre-taxNPV7 is$1.98/LbCu
• NotsensitivetoCapex
• LesssensitivetoOpex
$2.20
$2.48$2.75
$3.03$3.30
$530m $490m$440m
$400m $360m
$1.70$1.60
$1.50
$1.40 $1.30
-200.0
0.0
200.0
400.0
600.0
800.0
1000.0
-20% -10% Base 10% 20%
NPVUS
$/M
CuPrice$/lb CapitalCosts$m CashCosts(C1)$/lb
For
per
sona
l use
onl
y

Calingiri Pit Shells
Investor Presentation | November 2016 | Page 9
Bindi oblique with Cu>0.2%
Opie oblique with Cu>0.2%
Dasher oblique with Cu>0.2%
Low cost open pit mining
Low strip ratio: < 1:1
Two major pits situated close to the proposedplantFor
per
sona
l use
onl
y

Investor Presentation | November 2016 | Page 10
CAPEX & Process Plant Flowsheet
Based on a well understood and proven SAG/ball mill circuit
Prepare:MH|Review:ABDR|Approve:DR
COPPERCONCENTRATEFILTER
GYRATORYCRUSHER
CRUSHEDORESTOCKPILE
PEBBLECRUSHER
SAGMILL
SAGDISCHARGE
SCREENS
CYCLONECLUSTERFEED
HOPPER
BALLMILL
CYCLONECLUSTER
COPPERROUGHERFLOATATION(2*6)
CONDITIONER
COPPERCLEANERS COPPER2ndCLEANERS
COPPER3rdCLEANERSCOPPERSCAVENGERS
COPPERCONCENTRATETHICKENER
COPPERCONCENTRATE
PROCESSWATERPOND
TAILSTHICKENERTAILINGSSTORAGE
FACILITY
CONDITIONER
Cu/MoCircuitRougherFloatation
|ConditioningTanks(2)
|1st,2nd,3rdand4thCleaners
|1stand2ndColumnFeed
|MoFilter
|MoDryerandCooler
|BaggedMo
|FinalCuConThickener
|SurgeTank
PRELIMINARY–NOTFORCONSTRUCTION
CaravelMineralsLimitedCalingiriCopperProject
Level3,18RichardsonStreet,WestPerth6005WesternAustralia0894266400
A3|Rev7|Rel0|Pgs1
CapitalItems+/- 30%
Est.CostA$/M
Processplant,firstfill&spares 250
Miningcapital&pre-strip 70
Tailingsdisposal 10
Bulkwatersupply 10
Powersupply&substation 20
Owner’sandotheroutlays 10
EPCM 30
Contingency 40
ProjectCapital 440
Sustainingcapital(LoM) 110
For
per
sona
l use
onl
y
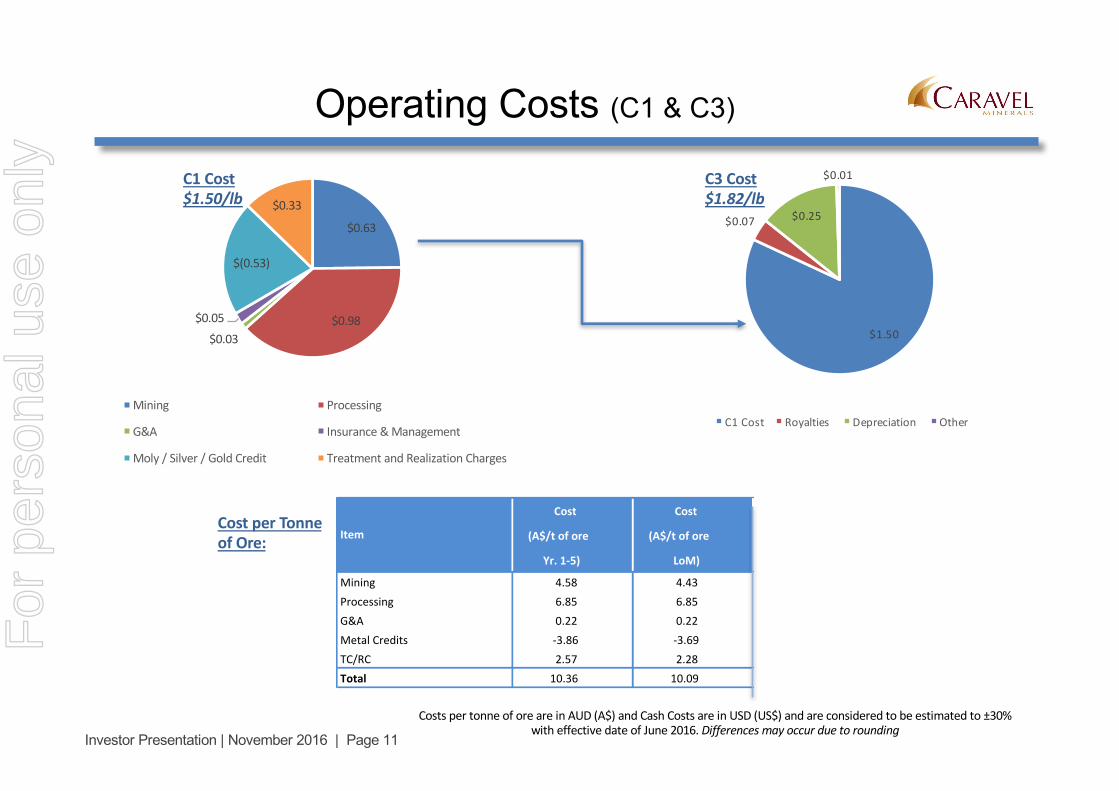
$1.50
$0.07 $0.25
$0.01
C1Cost Royalties Depreciation Other
Investor Presentation | November 2016 | Page 11
Operating Costs (C1 & C3)
CostspertonneoforeareinAUD(A$)andCashCostsareinUSD(US$)andareconsideredtobeestimatedto±30%witheffectivedateofJune2016.Differencesmayoccurduetorounding
Cost Cost Cost Cost %
(A$/tofore (A$/tofore (US$/lbCu (US$/lbCu ofCost
Yr.1-5) LoM) Yr.1-5) LoM)
Mining 4.58 4.43 0.59 0.63 42%Processing 6.85 6.85 0.89 0.98 65%G&A 0.22 0.22 0.07 0.08 6%MetalCredits -3.86 -3.69 -0.50 -0.53 -35%TC/RC 2.57 2.28 0.33 0.33 22%Total 10.36 10.09 1.40 1.50
Item
$0.63
$0.98$0.03
$0.05
$(0.53)
$0.33
Mining Processing
G&A Insurance&Management
Moly/Silver/GoldCredit TreatmentandRealizationCharges
C1Cost$1.50/lb
C3Cost$1.82/lb
CostperTonneofOre:
For
per
sona
l use
onl
y

Infrastructure
Investor Presentation | November 2016 | Page 12
Summary
Area Status
Buildings Buildrequirementsdetailedandcosted üPowerSupply Externalreportcompletedandcosted üWaterSupply
Abundantwaterwithinbothaperchedwatertableandbedrockaquifers.Hydrogeologicalinvestigationsunderway ü
TransportSealedroadsandrailwaylineswithcloseproximitytotheprojectsiteandportslocatedwithinWesternAustraliathataresuitable ü
TailingsManagement Externalreportcompletedandcosted üSiteCommunication
Locatedinafirst-worldhighlydevelopedandpopulatedregionwheretelephoneandhigh-speeddatainfrastructureisinplace üF
or p
erso
nal u
se o
nly

SS:ScopingStudyorPreliminaryEconomicAssessment.PFS:PreliminaryFeasibilityStudy.FS:FeasibilityStudyorDefinitive FeasibilityStudy.BluetextcellsareestimatedasnotmarketreleasedBasedonthereleasedCalingiriScopingStudyJune2016andothercompanydataisfrompubliclyavailableinformation.FulldetailsofCalingirireleasescanbefoundatwww.caravelminerals.com.au.
Investor Presentation | November 2016 | Page 13
GlobalComparableCopperStudies
UnitsCaravel
Minerals Calingiri
Hot Chili Productora
Red Hawk Resources
Copper Creek
Altona Little Eva
Avalon Viscaria
Study SS PFS SS FS SS
Location Australia Chilli USA Australia Sweden
Key FindingsInitial LoM Years 21 12 18 11 8
NPV - pre tax A$M 799 335 231 346 102
- post tax A$M 525 220 154 200 68
- DR % 7.0 7.0 7.5 7.5 7.0
IRR - pre tax % 31% 20% 12% 29% 22%
- post tax % 23% 15% 11% 16% 17%Capital Cost A$M 445 725 857 294 139
Production (LOM)Treatment throughput p.a. 15.0 14.7 8.5 7.0 1.2
Strip ratio t:t 0.9 2.7 4.0 1.8 5.8
Quantity ore treated Mt 310 167 156 77 10
Copper Eq. grade % 0.30% 0.43% 0.74% 0.52% 1.20%
Recoveries Cu % 92% 86% 89% 96% 90%
Cu sold Kt 709 527 950 366 107
Copper price (model input) US$Lb 2.75 3.00 3.00 3.10 3.25
Cash Costs (C1) US$Lb 1.49 1.47 1.85 1.65 1.86
ü
For
per
sona
l use
onl
y

Calingiri Roadmap
Investor Presentation | November 2016 | Page 14
Q22015ExplorationTargets
Q12016DrillingResults
Q12016MaidenResource
Q22016ScopingStudy
H12017Pre-FeasibilityStudy
Nov2016
A history of achieving significant milestones
Delivering on time and within budget
Long-term focus on completing a DFS, obtainingproject finance, construction and commissioning
For
per
sona
l use
onl
y

2.10 2.15
2.60
3.003.35
2016E 2017E 2018E 20189E LTPrice
CUPRICEUSDDriving the recovery with India following
The Smart Money is on Copper
Investor Presentation | November 2016 | Page 15
ChinaGrowth
PriceOutlook
DemandUp
Used in nearly every major industry of the world
SupplyRisks
Production delays, lack of major discoveries and mothballing of projects
LT Forecast US$3.35/lb
Demand by Region: UBS
End Use by Market: AME
Supply by Region: UBS, AMEWBMS
China Copper Demand: UBSAME WBMS
UBS August 2016
For
per
sona
l use
onl
y

Bryah Project
Investor Presentation | November 2016 | Page 16
Bryah (97.5%) is located ~80km north ofMeekatharra – 60km south-west of the DegrussaCopper-Gold Deposit.
Two zones of copper-zinc-gold anomalism, eachabout 2 km long and up to 500m wide. Therecent discovery of the Monty deposit, andexploration results from other explorers focusingon the southern margin of the Bryah Basin,indicate that these copper-zinc-gold anomaliesoverly the interpreted VMS target horizon.
Significantly there are a cluster of vein golddeposits, overlying the same horizon, betweenthese anomalies.F
or p
erso
nal u
se o
nly

A Very High Quality Leadership Team
MARCEL HILMER, CEO and Executive DirectorMr Hilmer is a Fellow of the Institute of Chartered Accountants and a Member of the Australian Institute of Company Directors withmore than 30 years experience in executive management of global public and private groups including 6 years as BusinessDevelopment Executive with First QuantumMinerals Limited and following as CEO of ForsysMetals
ROWENCOLMAN,CFOMr Colman is a Chartered Accountant with over 25 years of senior financial management experience and holds a Bachelor Degree inCommerce. Recently Mr Colman spent time as Development Director for a major sovereign wealth fund in the Middle East managingmultiple development projects globally
TONY POUSTIE, Director of ExplorationMr Poustie is a fellow of the Australian Institute of Mining and Metallurgy. He is a geologist with 47 years international experience inmineral exploration, resource definition, project evaluation and development, and mining. He was General Manager Exploration from1998 until the takeover of Dominion by Kingsgate Consolidated Limited in 2011, when he took on the role of Chief Geologist
GRAHAM KUBALE, ExplorationManagerMr Kubale is a Geologist with over 15 years’ experience in the resources sector, having worked extensively in greenfields and near-mine exploration for a range of gold, base metal and Iron Ore mineralisation styles in Australia, Asia and Canada. Graham spent severalyears at Newmont Mining Corporation, Kingsgate Consolidated and Cliffs Natural Resources. He holds a Bachelor of Applied Science(Geology)
PETER ALEXANDER, Non-Executive DirectorMr Alexander has over 40 years experience in the Australian and international mining and exploration industry. He was ManagingDirector of Dominion Mining Limited for 10 years. Mr Alexander is also Non-Executive Director of the ASX listed company DorayMinerals Limited
JAMES HARRIS, Non-Executive DirectorMr Harris has had extensive experience in both Government and private enterprise in Australia and overseas. He has worked for tenyears with both Alcoa of Australia and the United Group Limited. His qualifications are in Legal Studies and Public Administration andhe is a Fellow of the Australian Institute of Company Directors
Investor Presentation | November 2016 | Page 17
For
per
sona
l use
onl
y

Investor Presentation | November 2016 | Page 18
Strongfundingfarm-inpartner- FQM
Ideallocation–infrastructure– localworkforce
ScopingStudy:Openpitmine– lowcost– lowstrip– robusteconomics
Metallurgicalrecoveries- >90%CuandMo
Nonativetitleandlowenvironmentalrisk
Calingiri Investment Profile
For
per
sona
l use
onl
y

Investor Presentation | November 2016 | Page 19
Corporate and Operations:Marcel Hilmer, CEO orTony Poustie, Dir. Of Exploration
L3, 18 Richardson StreetWest Perth WA 6005+61 8 9426 6400
Corporate Advisors:Bridge Street Capital PartnersTelephone: +61 2 9002 5415
Contact Information
For
per
sona
l use
onl
y

DisclosuresandDisclaimer
Investor Presentation | November 2016 | Page 20
DisclaimerThe presentation materials (and the contents of the presentation) are for information purposes only and do not constitute an offer or invitation to subscribe for or purchase any securities,and neither the presentation materials nor anything contained therein nor the fact of their distribution nor the contents of the presentation shall form the basis of or be relied on inconnection with or act as any inducement to enter into any contract or commitment whatsoever.
The information contained in this presentation is subject to material updating, completion, revision, amendment and verification. No reliance should be placed on the information and norepresentation or warranty (express or implied) is made by the Company, any of their respective directors or employees or any other person, and, save in respect to fraud, no liabilitywhatsoever is accepted by any such person, in relation thereto. The Company does not provide any financial product advice.
Forward-Looking StatementsThis presentation includes certain statements that may be deemed “forward-looking statements”. All statements in this presentation, other than statements of historical facts, thataddress future production, reserve or resource potential, exploration drilling, exploitation activities and events or developments that Caravel Minerals Limited (the “Company”) expects tooccur, are forward-looking statements.
Although the Company believes the expectations expressed in such forward-looking statements are based on reasonable assumptions, such statements are not guarantees of futureperformance and actual results or developments may differ materially from those in the forward-looking statements. The ability of any person to achieve forward-looking production andeconomic targets is dependent on numerous factors that are beyond the Company’s control and that Caravel cannot anticipate. These factors include, but are not limited to, site-specificmining and geological conditions, management and personnel capabilities, availability of funding to properly operate and capitalize the operation, variations in cost elements and marketconditions, developing and operating the mine in an efficient manner, unforeseen changes in legislation and new industry developments. Any of these factors may substantially alter theperformance of any mining operation.
Investors are cautioned that any such statements are not guarantees of future performance and actual results or developments may differ materially from those projected in the forward-looking statements. Readers should not place undue reliance on forward-looking information. The Company does not assume any obligation to update or revise its forward-lookingstatements, whether as a result of new information, future events or otherwise.
Competent Person StatementThe information in this report that relates to the Calingiri Mineral Resource estimates is extracted from an ASX Announcement dated 4 April 2016, (see ASX Announcement – 4 April 2016“Calingiri Maiden JORC Resource”, www.caravelminerals.com.au and www.asx.com.au ). The Company confirms that it is not aware of any new information or data that materially affectsthe information included in the original market announcement and that all material assumptions and technical parameters underpinning the Mineral Resource estimates in the relevantmarket announcement continue to apply and have not materially changed. The Company confirms that the form and context in which the Competent Person’s findings are representedhave not been materially modified from the original market announcement.
Production Targets and Financial InformationInformation in relation to the Calingiri Project Scoping Study , including production targets and financial information, included in this report is extracted from an ASX Announcement dated28 June 2016, (see ASX Announcement – 28 June 2016, “Scoping Study Confirms Outstanding WA Copper Project ”, www.caravelminerals.com.au and www.asx.com.au. The Companyconfirms that all material assumptions underpinning the production target and financial information set out in the announcement released on 28 June 2016 continue to apply and havenot materially changed.
For
per
sona
l use
onl
y

Investor Presentation | November 2016 | Page 21
Projects Status Target Location Holding Area(km2)
CALINGIRI Granted Copper,Gold,Molybdenum WA,Australia 16tenements– 100%
1tenement– 80% 760
BRYAH Granted Copper,Gold,Manganese WA,Australia 1tenement – 92.5% 123
Appendix
AustralianPortfolio
Options:November2016
Status Mn ExercisePrice ExpiryDate
Unlisted 3.80 $0.77 31/12/16
““ 5.26 $0.29 31/01/17
““ 0.20 $0.17 31/01/17
““ 8.80 $0.12 31/12/18
Total 18.06For
per
sona
l use
onl
y


