
Classification Transurban Group
Transurban International Limited
ACN 121 746 825
Transurban Holdings Limited
ABN 86 098 143 429
Transurban Holding Trust
ABN 30 169 362 255
ARSN 098 807 419
www.transurban.com.au
Level 23
Tower One, Collins Square
727 Collins Street
Docklands Victoria 3008
Australia
Telephone +613 9612 6999
Facsimile +613 9649 7380
Level 9
1 Chifley Square
Sydney NSW 2000
Australia
Telephone +612 9254 4900
Facsimile +612 9254 4990
5 May 2015
Transurban Investor Presentation
Please find attached a presentation that will be provided at a Transurban investor day today.
The presentation will also be webcast live from 10:00am AEST on the Transurban website: www.transurban.com.
Amanda Street Company Secretary
Investor enquiries
Henry Byrne General Manager, Investor Relations and Corporate Affairs +61 438 564 245
asx release
For
per
sona
l use
onl
y

INVESTOR DAY 5 MAY 2015
For
per
sona
l use
onl
y

DISCLAIMER & BASIS OF PREPARATION
2
This publication is prepared by the Transurban Group comprising Transurban Holdings Limited (ACN 098 143 429), Transurban Holding Trust (ARSN 098 807 419) and Transurban International Limited (ACN 121 746 825). The responsible entity of Transurban Holding Trust is Transurban Infrastructure Management Limited (ACN 098 147 678) (AFSL 246 585). No representation or warranty is made as to the accuracy, completeness or correctness of the information contained in this publication. To the maximum extent permitted by law, none of the Transurban Group, its directors, employees or agents or any other person, accept any liability for any loss arising from or in connection with this publication including, without limitation, any liability arising from fault or negligence. The information in this publication does not take into account individual investment and financial circumstances and is not intended in any way to influence a person dealing with a financial product, nor provide financial advice. It does not constitute an offer to subscribe for securities in the Transurban Group. Any person intending to deal in Transurban Group securities is recommended to obtain professional advice.
UNITED STATES These materials do not constitute an offer of securities for sale in the United States, and the securities referred to in these materials have not been and will not be registered under the United States Securities Act of 1933, as amended, and may not be offered or sold in the United States absent registration or an exemption from registration.
© Copyright Transurban Limited ABN 96 098 143 410. All rights reserved. No part of this publication may be reproduced, stored in a retrieval system, or transmitted in any form or by any means, electronic, mechanical, photocopying, recording or otherwise, without the written permission of the Transurban Group.
BASIS OF PREPARATION This document includes the presentation of results on a statutory as well as non-statutory basis. The non-statutory basis includes the Proportional Results and Free Cash. All financial results are presented in AUD unless otherwise stated. Data used for calculating percentage movements has been rounded to thousands.
For
per
sona
l use
onl
y

10.00 Welcome Scott Charlton Chief Executive Officer 10.30 Strategy Michele Huey
Sue Johnson Lisa Tobin
Group General Manager Strategy Group General Manager Customer Operations and Human Resources Group General Manager Technology
11.30 Finance Adam Watson Chief Financial Officer
12.00 Lunch
12.40 Market updates
12.45 Sydney network Andrew Head Tony Adams Lisa Tobin
Group General Manager NSW Group General Manager Project Delivery & Operational Excellence Group General Manager Technology
13.15 Melbourne network Vin Vassallo Tony Adams
Group General Manager VIC Group General Manager Project Delivery & Operational Excellence
13.45 Brisbane network Wes Ballantine Sue Johnson
Group General Manager QLD Group General Manager Customer Operations and Human Resources
14.15 Northern Virginia network Jennifer Aument Group General Manager North America
14.45 Conclusion Scott Charlton Chief Executive Officer
AGENDA
3
For
per
sona
l use
onl
y

SCOTT CHARLTON, CEO
WELCOME
For
per
sona
l use
onl
y

CONSISTENT STRATEGY
5
utilising core capabilities providing effective and innovative urban road infrastructure To be the partner of choice with governments
NETWORK PLANNING / FORECASTING
COMMUNITY ENGAGEMENT
DEVELOPMENT / DELIVERY
TECHNOLOGY OPERATIONS AND CUSTOMER MANAGEMENT
For
per
sona
l use
onl
y

DELIVERING ON STRATEGY
6
MELBOURNE
SYDNEY
BRISBANE
NORTHERN VIRGINIA
CORPORATE
2012 2013 2014 2015
DEVELOPMENT PROJECT TECHNOLOGY & OPERATIONS
FUNDING
Western Distributor announced
CityLink Tulla Widening financial close
Lane Cove on-ramp
Cross City Tunnel acquired M5 Widening completed
NorthConnex construction commenced
M2 Upgrade completed
Logan Motorway pavement phase one works completed
Queensland Motorways (QM) acquired
Gateway Upgrade North procurement on track
495 Express Lanes opened
95 Express Lanes opened early, ahead of budget
GLIDe rolled out across CityLink TransLink Operations in-housed
QM integration program on track
M2 and LCT O&M in-housed
GLIDe rolled out across M2 and ED GLIDe roll out on M7 and LCT
95 Express Lanes operations integrated with 495
Move to national customer operations model
National procurement program rolled out
QM equity raising Euro issuance Euro issuance
Ongoing asset refinancing For
per
sona
l use
onl
y

CONSISTENT GROWTH
FY15 GUIDANCE 39.5 CENTS
7
FY09
22₵ 24₵
FY10
27₵
FY11
29.5₵
FY12
31₵
FY13
35₵
FY14
39.5₵
FY15
Compound annual growth of more than 10% since FY09 (inclusive of FY15 guidance)
Strong underlying network traffic
Embedded price escalation across concessions
Operational efficiencies across technology, operations and maintenance
Traffic uplift from development projects − improved traffic flows in
key corridors − toll price adjustments
(eg truck tolls on M5, M7, and LCT)
GROWTH DRIVERS
IN DISTRIBUTIONS
For
per
sona
l use
onl
y

LONG-TERM VALUE CREATION WEIGHTED AVERAGE CONCESSION LIFE
8
CONCESSION EXTENSIONS
M5 WEST WIDENING M5 3.3 years to 2026
QUEENSLAND MOTORWAYS ACQUISITION
Gateway Logan Clem7 GBB
37 years to 2051 37 years to 2051 37 years to 2051 49 years to 2063
CITYLINK TULLA WIDENING CityLink 1 year to 2035
NORTHCONNEX PROJECT
M2 M7 LCT
2.1 years to 2048 11.4 years to 2048 11.5 years to 2048
95 EXPRESS LANES PROJECT1
95 Express Lanes 73 years to 2087
1. 95 Express Lanes is not included in the weighted average concession life calculation as the asset is still in ‘ramp-up’
For
per
sona
l use
onl
y

TO STRENGTHEN COMMUNITIES
New motorway connection from CityLink to West Gate Freeway
Expansion of existing West Gate Freeway
Second major river crossing
New entry to the CBD
Improved port access
WESTERN DISTRIBUTOR
THROUGH TRANSPORT
9
For
per
sona
l use
onl
y

WESTERN DISTRIBUTOR
$5 - 5.5 BILLION ANTICIPATED PROJECT COST
10
PROJECT ECONOMICS
TOLLING
PROPOSED FEDERAL FUNDING
CITYLINK CONCESSION
For
per
sona
l use
onl
y

SAFETY
Zero employee lost-time injuries for 12 months ̶ 5.7 million construction hours
without a lost-time injury1 New medium-term road safety strategy
driving corporate target of 15% reduction in injury crashes between FY15 and FY192
NSW and VIC networks audited to identify high crash areas for safety enhancements ̶ QLD and US networks to be
assessed in FY16
1. For 95 Express Lanes and M5 West Widening projects 2. Consistent with state and federal government road safety targets 3. Road injury crashes per 100 million vehicle kilometres travelled 4. TCL estimate calculated at March 2015
0
5
10
15
20
25
ROAD INJURY CRASH INDEX3 (ICR) COMPARISON
TRANSURBAN ICR INDEX
Broader Australian network ICR – indicative4
Broader USA network ICR - indicative4
JUL 2012 JAN 2013 JUL 2013 JAN 2014 JUL 2014 JAN 2015
HIGHLIGHTS
11
For
per
sona
l use
onl
y

POSITIONING FOR THE FUTURE
POLICY TECHNOLOGY CUSTOMER STRATEGY
12
For
per
sona
l use
onl
y

MICHELE HUEY, GROUP GENERAL MANAGER STRATEGY
STRATEGY LISA TOBIN, GROUP GENERAL MANAGER TECHNOLOGY
SUE JOHNSON, GROUP GENERAL MANAGER CUSTOMER OPERATIONS AND HUMAN RESOURCES
For
per
sona
l use
onl
y

EMERGING TRENDS POLICY OPPORTUNITIES TO ADDRESS
14
Road pricing reform over medium to long term
Potential to address funding issues for roads
Opportunity for efficiency gains in network operations
POLICY
For
per
sona
l use
onl
y

EMERGING TRENDS
CURRENT INFRASTRUCTURE SPENDING OUTSTRIPS INCOME1
15 1. Data from 2012/2013 year
35
30
25
20
15
10
5
EXPENDITURE INCOME
AUST
RAL
IAN
DO
LLAR
S (B
ILLI
ON
S)
Source: BITRE Yearbook 2014 PO
PULA
TIO
N S
IZE
(MIL
LIO
NS)
10
8
6
4
2
SIGNIFICANT URBAN POPULATION GROWTH EXPECTED
CURRENT (2015) FORECAST (2053)
Source: Australian Bureau of Statistics
SYDNEY BRISBANE MELBOURNE
For
per
sona
l use
onl
y

ADVOCATING FOR ROAD
“Reform of road pricing and provision should be a priority.”
Competition Policy Review (‘The Harper Review’) March 2015
“Well-designed user charges should be used to the fullest extent that can be justified.”
Productivity Commission, Public Infrastructure Inquiry Report, 2014
"Australia now has an opportunity to engage in structural reform of road provision and charging, leading to considerable productivity benefits.“
Rod Sims, Australian Competition and Consumer Commission, 2014
60% OF RESPONDENTS FAVOURED A USER-PAYS MODEL TO FUND ROAD INFRASTRUCTURE
COMMUNITY ATTITUDES
Source: EY Sweeney 2014
PRICING REFORM
16
For
per
sona
l use
onl
y

TRANSURBAN ROAD NETWORK
17
PROVIDE TANGIBLE DATA
INFORM AND EDUCATE STAKEHOLDERS
DEMONSTRATE TECHNOLOGY EXAMPLES
UNDERSTAND BEHAVIOURAL RESPONSES
ASSESS CUSTOMER ATTITUDES AND PREFERENCES
PRACTICAL, REAL-WORLD EXAMINATION OF COMMUNITY AND ROAD-USER ATTITUDES TO ROAD PRICING MODELS
PREFERENCE STUDY
For
per
sona
l use
onl
y

PILOT PROCESS STUDY DESIGN
STUDY DESIGN AND DELIVERY
18
Detailed design commencement
Q4 FY15 Q1 FY16 Q1 FY16
Targeted pilot study commencement
Targeted participant recruitment
Targeted project completion
Q3 FY16 Q4 FY16
STUDY ROLL OUT ANALYSIS PHASE
Q2 FY16
Targeted study commencement
Targeted post study analysis commencement
Time-of-day pricing
Zone based congestion charge
Distance-based per kilometre charge
Price per trip
Banded per kilometre based on estimated travel distance
PROPOSED PRICING CONSTRUCTS ADDITIONAL OPTIONS
For
per
sona
l use
onl
y

TECHNOLOGY NO LONGER A BARRIER CRITICAL TECHNOLOGY FOR BROADER ROAD PRICING
GPS 2000: personal GPS products launched 18.5 million GPS-enabled smartphones in use
ON BOARD DIAGNOSTIC (OBD) CONNECTOR
2007: OBD connector mandated as standard for Australian vehicles 60% of vehicle fleet have an OBD connector
TELEMATICS DEVICE 2000: $2,000 per device $350 per device (medium price)
FAST MOBILE DATA 1991: 2G data (9.6kbp/s) introduced in Australia 4G data network rolled out (100 mbp/s)
INTRODUCED
CURRENT STATE IN AUSTRALIA – CRITICAL MASS
19
For
per
sona
l use
onl
y

20
Road network pricing opportunities
Efficient road network operations
Optimised traffic management
Expanded customer interfaces
TECHNOLOGY
EMERGING THROUGH TECHNOLOGY SIGNIFICANT OPPORTUNITIES
For
per
sona
l use
onl
y
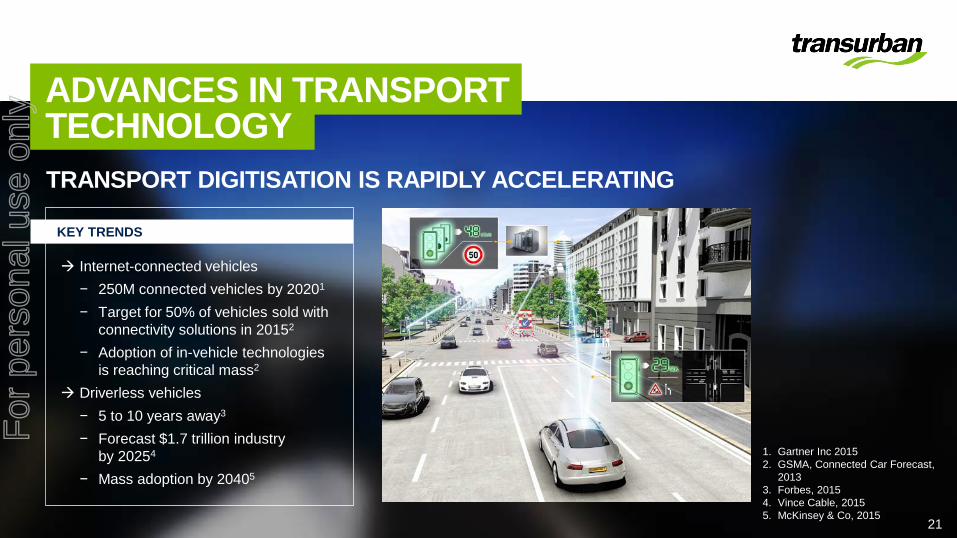
ADVANCES IN TRANSPORT
TRANSPORT DIGITISATION IS RAPIDLY ACCELERATING
21
1. Gartner Inc 2015 2. GSMA, Connected Car Forecast,
2013 3. Forbes, 2015 4. Vince Cable, 2015 5. McKinsey & Co, 2015
Internet-connected vehicles − 250M connected vehicles by 20201
− Target for 50% of vehicles sold with connectivity solutions in 20152
− Adoption of in-vehicle technologies is reaching critical mass2
Driverless vehicles − 5 to 10 years away3
− Forecast $1.7 trillion industry by 20254
− Mass adoption by 20405
KEY TRENDS
TECHNOLOGY
For
per
sona
l use
onl
y

DRIVERLESS VEHICLES
Driverless vehicles communicating with centralised systems
SHIFT TO SMART VEHICLES
Internet-connected vehicles Accurate vehicle tracking Real-time communication
with drivers
NETWORK MANAGEMENT
22
ROADSIDE MEASURES
Variable speed signs Lane use management Over height detection Weight-in-motion sensors
NOW MEDIUM TERM LONG TERM
BE
NE
FIT
S
OPPORTUNITIES
Effective traffic control Reduced damage to
infrastructure Improved road safety
New road user pricing models
Improved traffic management
Richer data and analytics Integrated road user
experience
Increased utilisation of road assets
Optimisation of traffic flows Resulting in increased
network capacity and more efficient travel times
For
per
sona
l use
onl
y

TECHNOLOGY PARTNERSHIP DEVELOPMENT OF ROAD-USER TECHNOLOGIES
23
PEOPLE | SOLUTIONS | OUTCOMES
ROAD OWNER/OPERATOR TELECOMMUNICATIONS NAVIGATION, MAP AND TRAFFIC SERVICES
ANALYTICS SOFTWARE
For
per
sona
l use
onl
y

IMPROVING CUSTOMER OFFERING
24
Focus on customer experience
National model driving value and efficiencies
Migration to self-service customer interfaces
CUSTOMER STRATEGY
For
per
sona
l use
onl
y

EXPANDING CUSTOMER BASE USA CUSTOMER BASE
25
0.0
0.5
1.0
1.5
2.0
2.5
3.0
3.5
FY13 FY14 FY150.0
0.5
1.0
1.5
2.0
2.5
3.0
3.5
FY13 FY14 FY15
1. Includes CityLink, go via, Roam and Roam Express account customers
AUSTRALIAN CUSTOMER BASE1
CU
STO
MER
S (M
ILLI
ON
S)
CU
MU
LATI
VE U
NIQ
UE
TRAN
SPO
ND
ERS
USE
D O
N A
SSET
S (M
ILLI
ON
S)
2. Year-to-date
2 2
For
per
sona
l use
onl
y

ENHANCING CUSTOMER EXPERIENCE
26
DIGITAL1 FY13
45% FY15
62%
CITYLINK CUSTOMER INTERACTIONS
1. Excludes payment transactions
MIGRATION TO SELF SERVICE (CITYLINK)
0
20,000
40,000
60,000
80,000
100,000
120,000
140,000
160,000
180,000
VOLU
ME
Online transactions
Calls
JAN 2013 JUL 2013 JAN 2014 JUL 2014 JAN 2015
For
per
sona
l use
onl
y

NATIONAL MODEL DRIVING BENEFITS
More customer service channels − increasing convenience and
accessibility
New retail partners − increasing face-to-face
options
Improved and simplified website − enhancing usability
− faster and easier transactions
Increased engagement with customers to avoid account suspension
ENHANCING CUSTOMER EXPERIENCE
Economies of scale − Costs savings through
national contracts e.g. tag procurement
Technology efficiencies − roll out of GLIDE across VIC
and NSW brands and assets
Standardisation of customer websites − consistent design across TCL
brands in FY16
INCREASING OPERATIONAL EFFICIENCY
VIC FY14
814 FY15
1,708
QLD FY14
902 FY15
1,537
NSW FY14
1,055 FY15
1,055
NUMBER OF SERVICE OUTLETS
27
For
per
sona
l use
onl
y

ADAM WATSON, CHIEF FINANCIAL OFFICER
FINANCE
For
per
sona
l use
onl
y

29
CONSISTENTLY GROWING DISTRIBUTIONS
EFFICIENTLY FUND GROWTH
MAINTAIN STRONG INVESTMENT GRADE CREDIT METRICS
COST EFFICIENT FUNDING THROUGH MARKET CYCLES
CAPITAL STRATEGY
For
per
sona
l use
onl
y

30
FY09
22₵ 24₵
FY10
27₵
FY11
29.5₵
FY12
31₵
FY13
35₵
FY14
39.5₵
FY15
Compound annual growth of more than 10% since FY09 (inclusive of FY15 guidance)
CAPITAL STRATEGY
CONSISTENTLY GROWING DISTRIBUTIONS
MAINTAIN STRONG INVESTMENT GRADE CREDIT METRICS
COST EFFICIENT FUNDING THROUGH MARKET CYCLES EFFICIENTLY FUND GROWTH
For
per
sona
l use
onl
y

0
2000
4000
6000
8000
10000
12000
0
500
1000
1500
2000
2500
1,281 1,415 1,444 1,458 1,482 1,896 1,9061
CITYLINK TULLA WIDENING NORTHCONNEX
LANE COVE TUNNEL ACQUISITION
M1 – CITYLINK UPGRADE
495 EXPRESS LANES
95 EXPRESS LANES CROSS CITY TUNNEL ACQUISITION
QM ACQUISITION
M2 UPGRADE M5 WIDENING
31
FY15 FY14 FY13 FY12 FY09 FY11 FY10
PROPORTIONAL DRAWN DEBT (RIGHT AXIS)
MIL
LIO
N
$MIL
LIO
N
SECURITIES ON ISSUE (LEFT AXIS) INDICATIVE FUNDING TIMEFRAME
1. Half year 2015
EFFICIENTLY FUND GROWTH MAINTAIN STRONG INVESTMENT GRADE CREDIT METRICS
CONSISTENTLY GROWING DISTRIBUTIONS
COST EFFICIENT FUNDING THROUGH MARKET CYCLES
CAPITAL STRATEGY
For
per
sona
l use
onl
y

32
31 DEC 2014 TARGET
FFO/DEBT1 ~8% 8 - 12%2
SENIOR INTEREST COVERAGE RATIO
3.3 >2.5
1. FFO/Debt as per S&P’s definition
2. Position within target largely dependent upon where TCL is in its development cycle
Strong investment grade ratings – S&P: BBB+ stable – Moody's: Baa1 stable – Fitch: A- stable
MAINTAIN STRONG INVESTMENT GRADE CREDIT METRICS
CONSISTENTLY GROWING DISTRIBUTIONS
COST EFFICIENT FUNDING THROUGH MARKET CYCLES EFFICIENTLY FUND GROWTH
CAPITAL STRATEGY
STRONG INVESTMENT GRADE CREDIT METRICS
For
per
sona
l use
onl
y

31 DECEMBER 2014
CAPITAL STRATEGY
33
30 JUNE 2013
Total debt A$3.9b
Average tenor 3.9yrs
Average interest rate 6.5%
Total debt A$5.1b
Average tenor 4.8yrs
Average interest rate 6.2%
CORPORATE DEBT BOOK CORPORATE DEBT BOOK Diversify funding
sources Extend tenor in low
interest rate environment
Maintain adequate liquidity
Ensure future maturity towers minimise refinancing risk
COST EFFICIENT FUNDING THROUGH MARKET CYCLES
MAINTAIN STRONG INVESTMENT GRADE CREDIT METRICS
CONSISTENTLY GROWING DISTRIBUTIONS EFFICIENTLY FUND GROWTH
FUNDING PLAN
For
per
sona
l use
onl
y

NEAR TERM OPPORTUNITIES– PARTICULARLY AT AUSTRALIAN ASSET LEVEL
DEBT BOOK
34
CORPORATE
Total debt A$5.1b
Average tenor 4.8yrs
Average interest rate 6.2%
AUSTRALIA NON-RECOURSE
Total debt1 A$7.0b
Average tenor1 3.2yrs3
Average interest rate2 5.3%
US NON-RECOURSE1
Total debt A$1.5b
Average tenor1 31.4yrs
Average interest rate2 4.5%
31 DECEMBER 2014 31 DECEMBER 2014 31 DECEMBER 2014
1. Represents 100% of debt facilities 2. Weighted on a proportional drawn debt basis 3. The tenor is reflective of what is available in the bank debt market
For
per
sona
l use
onl
y

PORTFOLIO HEDGED
35
DEBT BOOK SUBSTANTIALLY HEDGED1 INFLATION-LINKED TOLL PRICING2,3
Fixed rate hedging reduces exposure to interest rate movements
Extending tenor pushes out exposure to potential future interest rate increases
Asset portfolio provides a mix of inflation protection and exposure to upside
AGAINST ECONOMIC CYCLES
1. Comprises fixed rate debt and floating debt that has been hedged and is a weighted average of total proportionate drawn debt in A$ 2. Annual CPI figures shown. Revenue based on proportionate toll revenue as disclosed in the December 2014 Traffic and Revenue Data ASX release 3. Note each asset is subject to specific CPI conditions in the context of toll price adjustments. Refer to slide 44 of the 2014 Investor Day presentation for further details
INTEREST COST MINIMISED REVENUE BENEFITS
For
per
sona
l use
onl
y

TAX PROFILE
1. Based on an assumed security holder profile
Critical to investment appeal and ability to fund long term infrastructure projects
Enables payment of distributions to security holders
Distributions are ultimately taxed in the hands of investors
STAPLED STRUCTURE
Infrastructure assets require billions of dollars of upfront capital investment leading to losses in early years
International and Australian accounting and tax principles require amortisation of capital investment
Funding costs are deductible but subject to tax in lender’s hands
AMORTISATION OF CAPITAL INVESTMENT
TCL rated ‘low risk’ by the Australian Tax Office
Fully compliant with Australian and international tax law
No entities located in tax havens
No artificial transfer pricing to shift profits overseas
TAX INTEGRITY
36
For
per
sona
l use
onl
y

ANDREW HEAD, GROUP GENERAL MANAGER NEW SOUTH WALES
SYDNEY NETWORK
For
per
sona
l use
onl
y

MARKET OVERVIEW
38
Continued strong traffic performance across the network, following Hills M2 and M5 enhancements
NorthConnex construction commenced in February
GLIDe roadside system successfully rolled out on Hills M2 and Eastern Distributor
Agreement to restructure O&M services on Cross City Tunnel and the Eastern Distributor reached with Leighton Services
Continuing to monitor WestConnex development
HIGHLIGHTS
For
per
sona
l use
onl
y

NETWORK OPTIONALITY – DEVELOPMENT ENHANCED TRAFFIC FLOWS FROM CIRCA $1.1B OF NETWORK INVESTMENT ON M2 AND M5
39
20%
15%
10%
0%
5%
-5%
-10% FY09 FY10 FY11 FY12 FY13 FY14 FY15
M2
LANE COVE TUNNEL
M5 SOUTH WEST
WESTLINK M7
AVERAGE DAILY TRAFFIC GROWTH
M5 WIDENING COMMENCED
M2 UPGRADE COMMENCED
STAGED LANE AND RAMP OPENINGS
STAGED LANE OPENINGS F
or p
erso
nal u
se o
nly

40
NETWORK OPTIONALITY – DEVELOPMENT
40
2005 2011 2007 2009 2013 2025 2027 2035 2037 2046 2048
M7 32 YEARS 11.4 YEARS
M2 37 YEARS 6.1 YEARS
M5 16 YEARS 3.3 YEARS
ED 41 YEARS
LCT 27 YEARS 11.5 YEARS
CCT 21 YEARS
CONCESSION EXTENSIONS
For
per
sona
l use
onl
y

NETWORK OPTIONALITY – PRICING COMMERCIAL VEHICLE PRICING ALIGNED TO COSTS AND BENEFITS
41
3.5x
TRUCK TOLL MULTIPLIER
3.0x
2.5x
2.0x
1.5x
1.0x
0.5x
FY10 FY11 FY12 FY13 FY14 FY15 FY16 FY17
M5
NorthConnex
15 MINUTES
15 MINUTES
M2 40 MINUTES
POST ENHANCEMENT TIME SAVINGS
ED
M2
M5
M7
LCT
CCT
For
per
sona
l use
onl
y

NETWORK OPTIONALITY – O&M OPERATIONS AND MAINTENANCE EFFICIENCIES
42 1Subject to RMS and financier approval. If approved, to become effective in the next few months.
Existing 33-year evergreen O&M contract with Leighton Services on ED restructured1
ED and CCT operations in-housed
Leighton to deliver ED and CCT maintenance services for 12 years
CONSOLIDATION OF O&M1
New KPI regime drives stronger performance
− Up to 40% of contractor’s profit margin linked to performance indicators
Increased control of operations drives efficiencies
Enhanced flexibility creates future opportunities
STRATEGIC RATIONAL
For
per
sona
l use
onl
y

CENTRAL BACK OFFICE SERVICES (GLIDe)
ASSET SERVICES
TOLLING TECHNOLOGY
43
TRIP CONSTRUCTION
Vehicle trip construction and pricing
Licence plate recognition
RETAIL SERVICES TOLL COLLECTION
Links trip to customer account
Integrates with external toll road providers and retailers
Enforcement processing
CUSTOMER MANAGEMENT
Customer account management
Tag management Account payments
DATA CAPTURE
Identifies the vehicle/eTAG
Records characteristics of the trip
Transfers trip data for processing
ROADSIDE SERVICES (PHYSICAL INFRASTRUCTURE)
NETWORK OPTIONALITY – TECHNOLOGY
For
per
sona
l use
onl
y

NETWORK OPTIONALITY
44
AUG 2014 GLIDe asset services – M2 and ED
JULY 2015 GLIDe asset system – M7 and LCT GLIDe retail services replaces Roam
GLIDe retail services replaces Roam Express GLIDe Roadside System – CCT
FUTURE
Increased system reliability
Reduced leakage
Ability to share learnings across assets
CURRENT BENEFITS
Rich source of data for customer travel preferences and behaviours
Architecture supports a variety of tolling models
Able to support the build-out of a range of new customer and channel interactions
FUTURE OPPORTUNITIES
– TECHNOLOGY GLIDe ROLL-OUT
For
per
sona
l use
onl
y

NETWORK OPPORTUNITY WESTCONNEX
2014 $2B allocated to NSW Government for WestConnex Stage 2
2015 M4 Widening commenced (Stage 1a)
Preferred D&C to be selected for M4 East (Stage 1b) and the New M5 (Stage 2)
2016
2019
D&C tender process commenced for Stage 2
Construction scheduled to commence on King Georges Road interchange (part of Stage 2)
Stage 2 major works commence
Target completion for M4 East (Stage 1b) and the New M5 (Stage 2)
GOVERNMENT TIMELINE
45
2017 Target completion for Stage 1a
2023 Target completion for Stage 3
For
per
sona
l use
onl
y
VIN VASSALLO, GROUP GENERAL MANAGER VICTORIA
MELBOURNE NETWORK
For
per
sona
l use
onl
y

MARKET OVERVIEW
47
Continued refinement of operating model
CityLink Tulla Widening renegotiation reached financial close on 30 April
− construction to commence as planned in October 2015
Western Distributor market-led proposal has been positively received by government and progressed to Stage 3
HIGHLIGHTS
For
per
sona
l use
onl
y

CITYLINK TULLA WIDENING REVISED AGREEMENT
48
TCL to undertake all widening works on CityLink
Federal Government has committed $200M for widening to Melbourne Airport
State Government will undertake widening works from CityLink to the airport
TCL project cost increased from $850M to $1B
Additional costs offset by: ̶ reduced disruption ̶ lower state payment ̶ removal of toll freeze
period during construction (due to reduced disruption)
FUNDING SCOPE
For
per
sona
l use
onl
y

PROJECT ECONOMICS
CITYLINK TULLA WIDENING
2015 2016 2017 2018 2019 2020 2032 2033 2034 2035
Project costs $1 billion
Traffic uplift 22 additional lane kms from project
Truck multiplier (effective in one increment 1 April 2017)
Concession extension One year extension
Index of minimum 4.5% extended by one year
Toll price
49
HCV tolls move from 1.9 x to 3 x HCV (day) from 1.3x to 3x HCV (night) from 1.3x to 2x LCV from 1.3x to 1.6x
For
per
sona
l use
onl
y

CITYLINK TULLA WIDENING
50
ORIGINAL SCOPE REVISED SCOPE
Increased control
Reduced integration risk
Reduced traffic disruption
BENEFITS
For
per
sona
l use
onl
y
51
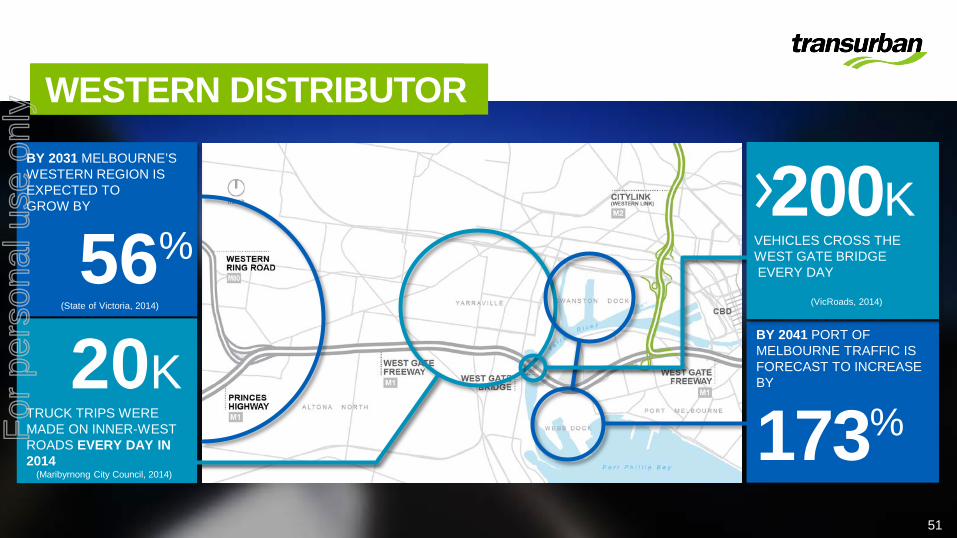
WESTERN DISTRIBUTOR BY 2031 MELBOURNE’S WESTERN REGION IS EXPECTED TO GROW BY
56% (State of Victoria, 2014)
20K TRUCK TRIPS WERE MADE ON INNER-WEST ROADS EVERY DAY IN 2014
(Maribyrnong City Council, 2014)
BY 2041 PORT OF MELBOURNE TRAFFIC IS FORECAST TO INCREASE BY
173%
200K
VEHICLES CROSS THE WEST GATE BRIDGE EVERY DAY
(VicRoads, 2014)
For
per
sona
l use
onl
y

WESTERN DISTRIBUTOR
52 1. Prepared by Deloitte Access Economics in accordance with Austroads standards.
PRELIMINARY BENEFIT COST1 RATIO OF
1.6X
For
per
sona
l use
onl
y

WESTERN DISTRIBUTOR OVERVIEW
53
WEST GATE FREEWAY WIDENING 50% additional capacity by adding two lanes each way from M80 Ring Road to the Western Distributor tunnel portal
WESTERN DISTRIBUTOR Tunnel and elevated motorway connecting the West Gate Fwy with the port, CityLink and the CBD
WEBB DOCK ACCESS IMPROVEMENTS Upgrading Cook Street and the West Gate Freeway to Bolte Bridge ramp, complementing port works already underway
For
per
sona
l use
onl
y

TCL PROPOSAL - STAGED DELIVERY
WEBB DOCK ACCESS
WEST GATE FREEWAY WIDENING
WESTERN DISTRIBUTOR
54
Transurban has progressed to Stage 3 of the Victorian Government’s Market-led Proposal process
OVERVIEW 2016 2017 2018 2019 2020
For
per
sona
l use
onl
y

PROJECT BENEFITS BUSINESS
Increased motorway capacity enhances freight productivity
Improves connectivity to the port precinct
Enhances supply chain efficiency and supports port expansion
55
COMMUNITY
Up to 50% less trucks on local streets
Safety improvements to the West Gate Freeway/Bolte Bridge interchange
Improve liveability for the local community
Enable safer and conflict free cycling routes
Improve air quality and reduce truck related noise on local roads
ECONOMIC
Preliminary benefit cost ratio (BCR) of 1.6 times1
Including wider economic benefits (eg productivity), BCR increases to more than 2 times1
Delivers $1.2 billion per annum of additional Gross Regional Product by 20301
3,500 construction jobs created
TRANSPORT
Travel time savings: − bypasses up to 14 sets of
traffic lights − halves travel time from
Western Ring Road to CBD during morning peak
− three times faster trips to the Port of Melbourne
− reduces travel time from CBD to Geelong and Ballarat by 15 minutes
Second motorway river crossing for the west, reduces pressure on West Gate Bridge
Enhances travel time reliability
1. Prepared by Deloitte Access Economics in accordance with Austroads standards.
For
per
sona
l use
onl
y

WESLEY BALLANTINE, GROUP GENERAL MANAGER QUEENSLAND
BRISBANE NETWORK
For
per
sona
l use
onl
y

MARKET OVERVIEW
57
Integration driving benefits – on track to outperform bid budget
National operations model driving improvements to customer service
Solid traffic performance across all assets during Q3FY15
– Logan Motorway traffic growth strong post pavement works
Legacy Way expected opening mid-2015
Portfolio of network opportunities
HIGHLIGHTS
For
per
sona
l use
onl
y

INTEGRATION UPDATE INTEGRATION ON TRACK
58
Redefined leadership team
Organisation structure aligned to TCL matrix
2 JUL 2014 DEC 2014 JUL 2016 JUL 2015
Corporate system alignment
Integrated tolling and back office systems
PROGRAM TIMELINE
MAR 2015
National customer operations model implemented
2017
O&M integration
NOW Queensland Motorways
rebranded Transurban Queensland
Aligned vision, values, policies and risk management framework
Technology networks joined enabling national operating model
Transitioned to national customer operations model
Full corporate system alignment
KEY ACHIEVEMENTS
For
per
sona
l use
onl
y

Further margin improvement expected as benefits annualise
MARGIN IMPROVEMENT
Reduction in annualised direct employee costs
EMPLOYEE COSTS
NATIONAL MODEL DRIVING BENEFITS
INTEGRATION UPDATE
59
For
per
sona
l use
onl
y

NATIONAL CUSTOMER OPERATIONS
60
250
200
350
300
FY19 FY18 FY17 FY16 FY15
FY15 National Customer Service Rate Queensland 0.3%
0.2%
0.1%
FY19 FY18 FY17 FY16 FY15
50%
65%
40% 45%
60% 55%
35%
FY15 FY17 FY16 FY19 FY18
CALL HANDLING TIMES SELF SERVICE RATES
BAD DEBT RATE
For
per
sona
l use
onl
y

61
4.6km road tunnel that connects the Western Freeway at Toowong with the Inner City Bypass ( ICB) at Kelvin Grove
Western Freeway to ICB in just four minutes − avoids seven sets of
traffic lights
Improved connectivity to a range of destinations
Expected opening mid-year
HIGHLIGHTS
NETWORK DEVELOPMENT – LEGACY WAY OPENING
For
per
sona
l use
onl
y

LEGACY WAY RAMP UP
62
DISCOUNT PERIOD 1 – FIRST ~5 MONTHS OF OPERATION
12 month discount period for private vehicles
− designed to optimise first impression of asset for expected users
Providing the highest quality experience for motorists
TOLLING STRATEGY
OPENING ~6 MONTHS AFTER OPENING
~12 MONTHS AFTER OPENING
D I S C O U N T T O L L P E R I O D
TOLL INCREASE
TOLL INCREASE
TOLLS INCREASE
BY CPI
F U L L T O L L P E R I O D
For
per
sona
l use
onl
y

NETWORK OPPORTUNITIES
Sale process expected to begin in near term
Asset demonstrating steady state characteristics – as at December 2014, ~80% of AirportLink traffic were go via customers
Modest growth expected over near term with impacts from improvements to key alternatives (eg Kingsford Smith Drive)
Material operational savings unique to TCL
Asset completes existing network position – ability to maximise customer benefits
OVERVIEW
63
– AIRPORTLINK
For
per
sona
l use
onl
y

1.1%
2.4%
0.3%0.7%
2.9%
CROSS CITY TUNNEL CLEM7 AIRPORTLINK
INVESTMENT DISCIPLINE COMPARISON OF TCL AND VENDOR TRAFFIC FORECASTS
Commitment to accurate forecasting – alignment of interest as long-term operator
Detailed network modelling enables rigorous assessment of key inputs
Modelling underpinned by extensive range of variables
Supported by a well-established and experienced in-house team of traffic modellers - TCL has a track record of producing accurate traffic forecasts to assess development opportunities
TCL APPROACH
64
Long term vendor forecast ~29% higher than TCL
Long term vendor forecast ~34% higher than TCL
1. Year to date (YTD), as at 30 April 2015. 2. P50 case assumes 50% probability of meeting or exceeding forecast 3. Based on go via customers driving on AirportLink. As at December 2014, go via customers
comprised approximately 80% of total traffic on AirportLink.
FY15 YTD1 ACTUAL FY15 TCL INVESTMENT CASE FY15 VENDOR CORE (P50)2 ESTIMATE
YEAR-ON-YEAR TRAFFIC GROWTH (AADT %)
0.1%
~ -3%3 For
per
sona
l use
onl
y

HIGHLIGHTS
DEVELOPMENT OPPORTUNITIES
65
Logan Motorway pinch points Actively exploring solutions to relieve
bottle necks
Gateway Upgrade North TCL undertaking final assessment of
tenders on behalf of the State Government
Formal recommendation to be made to the State Government by end of May
Pacific Motorway interchange upgrade State Government undertaking
feasibility assessment
For
per
sona
l use
onl
y

JENN AUMENT, GROUP GENERAL MANAGER NORTH AMERICA
NORTHERN VIRGINIA NETWORK
For
per
sona
l use
onl
y

MARKET OVERVIEW
Continued 495 ramp-up
Early and safe delivery of 95 Express Lanes with more than 5.6M safe hours
Successful migration to joint system
95 Express Lanes commenced operations early (December 2014)
HIGHLIGHTS
67
For
per
sona
l use
onl
y

NETWORK SYNERGIES
Fully integrated tolling and traffic management system
Consolidated traffic control room
Single customer interface for service and information needs
Consistent network enforcement and incident response
68
45% SAVINGS ON 495 CONTROL ROOM OPERATIONS
For
per
sona
l use
onl
y

$10,000
$60,000
$110,000
$160,000
$210,000
DEC-12 MAR-13 JUN-13 SEP-13 DEC-13 MAR-14 JUN-14 SEP-14 DEC-14 MAR-15
AVER
AG
E D
AILY
REV
ENU
E (U
SD)
95 AVG WEEKDAY TOLL REVENUE
MANAGED LANES NETWORKS
GROWING CUSTOMER BASE
495 EXPRESS LANES
Average new monthly customers1
48,000
More Beltway users becoming customers2
12%
95 EXPRESS LANES
Total unique customers 550,000
TWO ASSETS IN RAMP-UP
69 1. April 2014 – March 2015 2. May 2014 research compared to February 2015 research
ESTABLISHED
For
per
sona
l use
onl
y

95 AND 495 EXPRESS LANES
OPERATION 1ST QUARTER OF OPERATIONS 1ST QUARTER OF OPERATIONS
LENGTH OF FACILITY 16km (10 miles) 45km (28 miles)
AVERAGE WORKDAY TRAFFIC 23,308 43,165
AVERAGE TRIP LENGTH 10.5km (6.5 miles) 20.43km (12.7 miles)
AVERAGE WEEKEND DAY TRAVEL $8,082 $35,024
PEAK PERIOD 6:30-9:00am | 4:00-7:00pm 5:30-9:00am | 4:00-7:00pm
MAX TOLL $3.70 $20.90
MAX REVENUE DAY $32,952 $250,078
AVERAGE TOLL PAID $1.20 $4.52
HIGH OCCUPANCY AND EXEMPT VEHICLES 7% 32%
70
For
per
sona
l use
onl
y

FULL LENGTH PEAK 95 SOUTHBOUND EXPRESS AND GENERAL PURPOSE LANES1
1. Maximum trip time on workdays
UNRELIABLE GENERAL
71
95 EXPRESS LANES AVERAGE TIME
GENERAL PURPOSE LANES
JAN-15 FEB -15 MAR -15 APR -15
250
200
150
100
50
MIN
UTE
S
PURPOSE LANES
For
per
sona
l use
onl
y

TRAVEL TIME SAVINGS – FULL-LENGTH PEAK 95 SOUTHBOUND1
95 EXPRESS LANES INDICATIVE
72
TRAVEL TIME SAVINGS
0
40
80
120
160
MONDAY TUESDAY WEDNESDAY THURSDAY FRIDAY
MIN
UTE
S O
F TR
AVEL
TIM
E SA
VIN
GS
AVERAGE SAVINGS MAXIMUM SAVINGS
1. Average workday in February 2015
More than two hours of savings experienced
For
per
sona
l use
onl
y

DYNAMIC TOLLING ALGORITHM
73
$0
$5
$10
$15
$20DELIVERING VALUE FOR CUSTOMERS
MANAGING OPERATIONAL ISSUES
OPTIMISING REVENUE
95 END-TO-END TOLL 495 END-TO-END TOLL
MONDAY TUESDAY WEDNESDAY THURSDAY FRIDAY
For
per
sona
l use
onl
y

ACTIVE MANAGEMENT
74
INCREASED LANE AVAILABILITY ON 95 GROWING E-ZPASS BASE
HIGH SELF-SERVICE PAYMENT RATE
91%
0.6M
1.0M
2012 2015
83% > 3 HRS
71 MINUTES
GATE REVERSAL TIME 70%
DEC-2014 APR-2015
0%
100%
96%
DEC-2014 APR-2015
E-ZPASS USAGE ON 95 EXPRESS LANES
For
per
sona
l use
onl
y

65 62
54
68
43 42
47 44
46
37
30
40
50
60
70
MONDAY TUESDAY WEDNESDAY THURSDAY FRIDAY
MIN
UTE
S O
F TR
AVEL
FEBRUARY 2014 FEBRUARY 2015
Reduced travel times for 95 general purpose lanes
Increased options for carpools and buses
Direct returns on State investment
– 495 > 29 times investment1
– 95 >110 times investment2
Generated billions in economic activity
– 495 = $3.5B1
– 95 = $1.5B2
KEY ACHIEVEMENTS
SHARED VALUE - POLICY OUTCOMES
75
95 NORTHBOUND GENERAL PURPOSE LANES AVERAGE TRAVEL TIMES
1. George Mason University, 2008. 2. George Mason University, 2012.
For
per
sona
l use
onl
y

CONTINUOUS NETWORK ENHANCEMENTS
Engaged partnership with local and state governments
– New access point in Tysons
– Auxiliary lanes to ease transitions
– Extensions
Network expansion opportunities
76
For
per
sona
l use
onl
y

SCOTT CHARLTON, CEO
SUMMARY
For
per
sona
l use
onl
y

CONSISTENT STRATEGY
78
utilising core capabilities providing effective and innovative urban road infrastructure To be the partner of choice with governments
NETWORK PLANNING / FORECASTING
COMMUNITY ENGAGEMENT
DEVELOPMENT / DELIVERY
TECHNOLOGY OPERATIONS AND CUSTOMER MANAGEMENT
For
per
sona
l use
onl
y


