
April – June 2013
Our Mission:
To seek out innovative FME users throughout the galaxy, sharing their stories and ideas to inspire you to take your data where no
data has gone before.

Kansas DOT Division of Aviation - USA
The Mission: Preserve airport usability to ensure that air ambulance service is readily available to the public.
The Solution: Build a public online tool to illustrate and evaluate the effects of proposed vertical constructions on airport airspace
KDOT Aviation
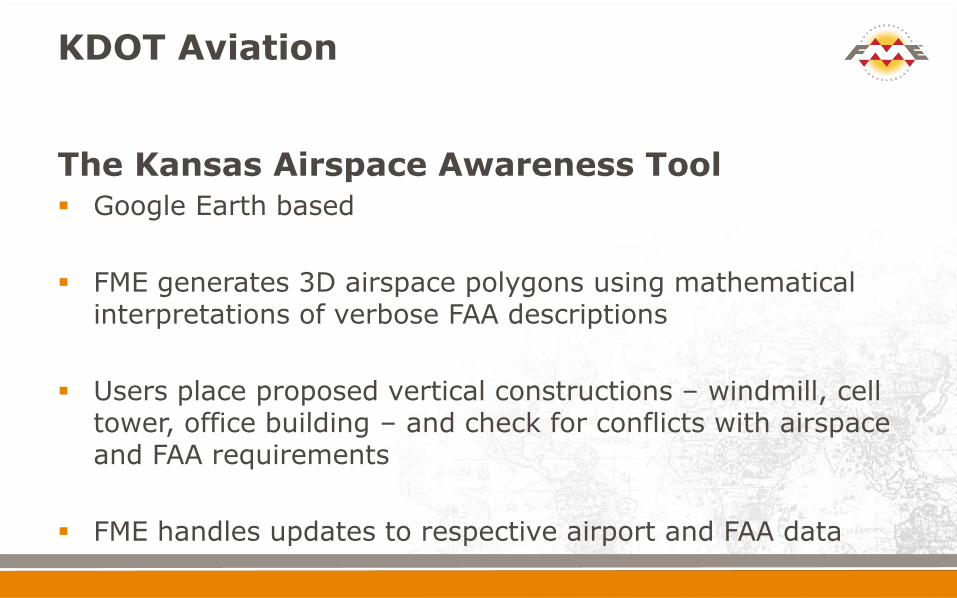
The Kansas Airspace Awareness Tool
Google Earth based
FME generates 3D airspace polygons using mathematical interpretations of verbose FAA descriptions
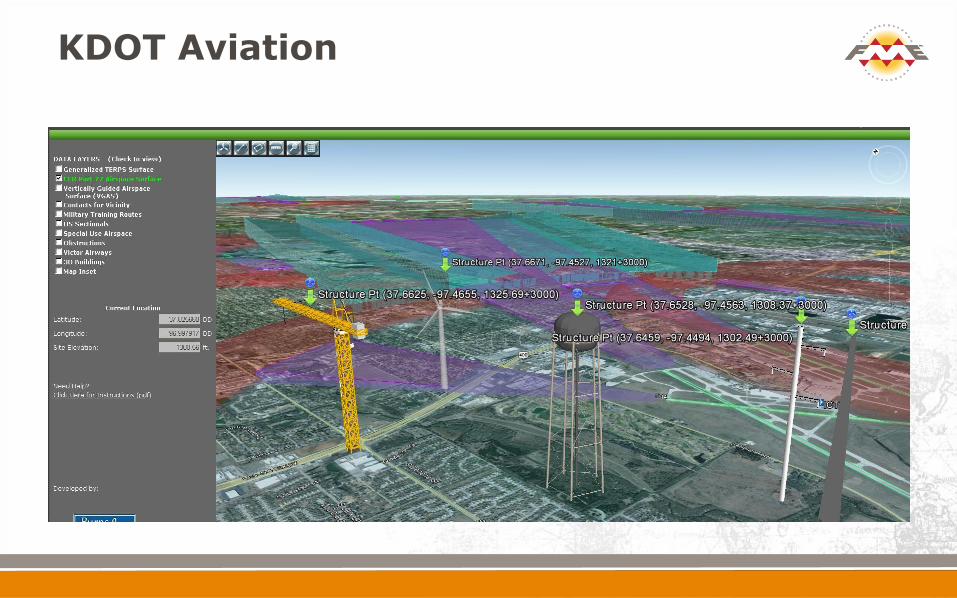
Users place proposed vertical constructions – windmill, cell tower, office building – and check for conflicts with airspace and FAA requirements
FME handles updates to respective airport and FAA data
KDOT Aviation
KDOT Aviation
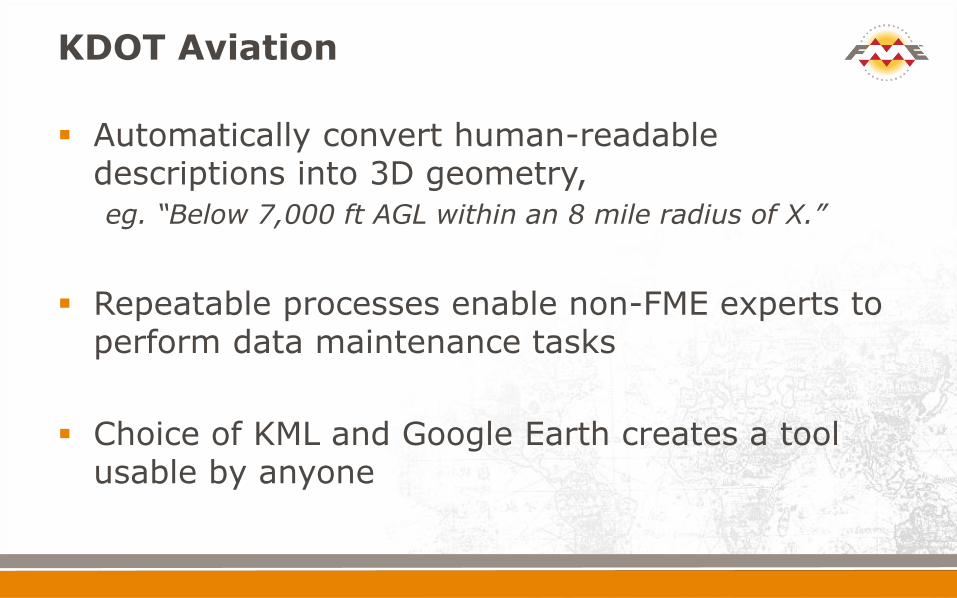
Automatically convert human-readable descriptions into 3D geometry,
eg. “Below 7,000 ft AGL within an 8 mile radius of X.”
Repeatable processes enable non-FME experts to perform data maintenance tasks
Choice of KML and Google Earth creates a tool usable by anyone
UVM Systems - Austria
The Mission: Create CityGRID navigable 3D worlds with thousands of individual 3D models
The Solution: Automate model and terrain data preparation and QA tasks with FME
UVM Systems CityGRID
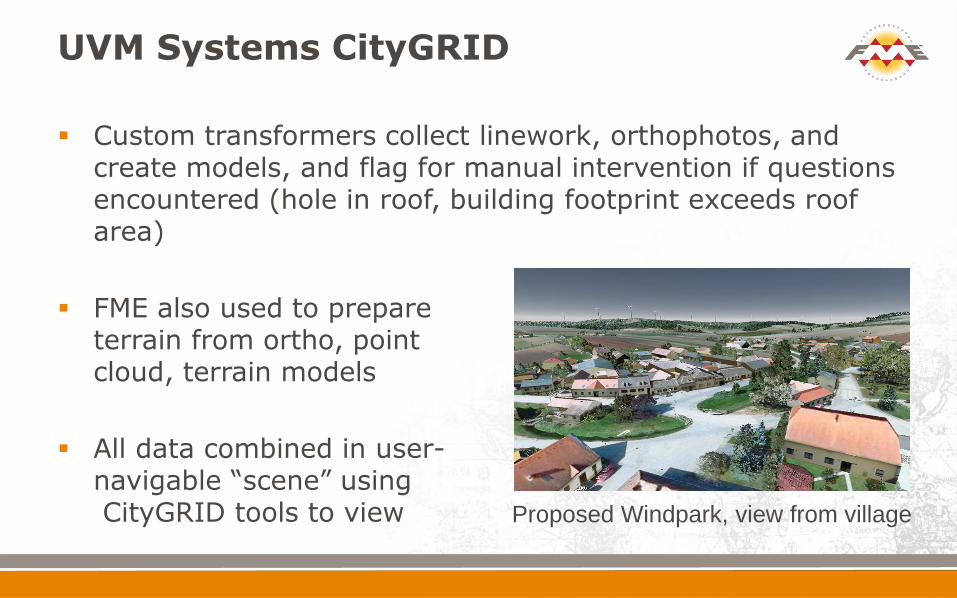
Custom transformers collect linework, orthophotos, and create models, and flag for manual intervention if questions encountered (hole in roof, building footprint exceeds roof area)
FME also used to prepare terrain from ortho, point cloud, terrain models
All data combined in user- navigable “scene” using CityGRID tools to view
Proposed Windpark, view from village
UVM Systems CityGRID
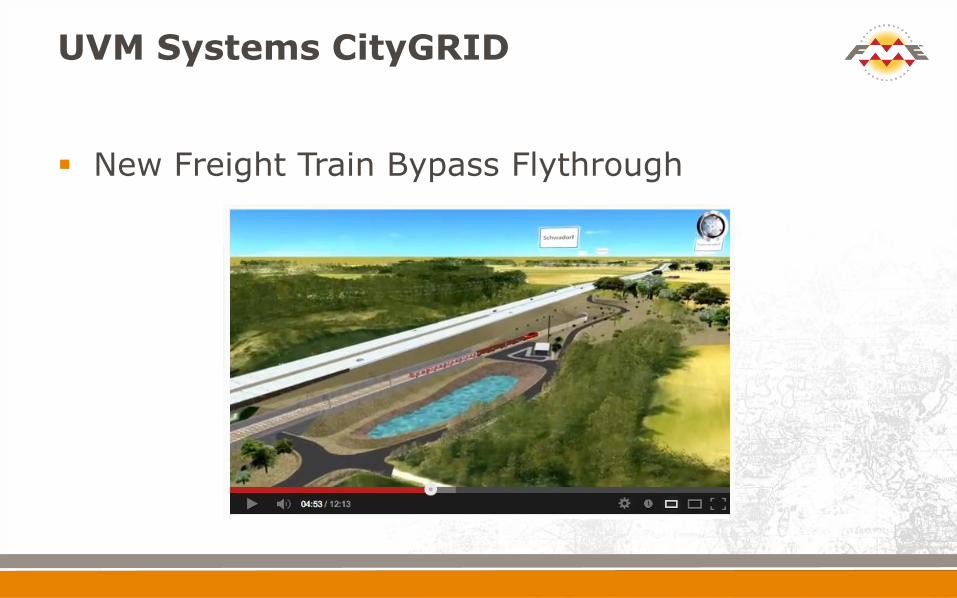
New Freight Train Bypass Flythrough

UVM Systems CityGRID
Custom transformers bundle up repetitive tasks for easy re-use
FME slashes processing time through automation and QA
CityGRID selected to process 2.7 million buildings for swisstopo
UVM now plugs into customers’ data stores rapidly, regardless of platform
San Antonio Water System – USA Toni Jackson & Larry Phillips
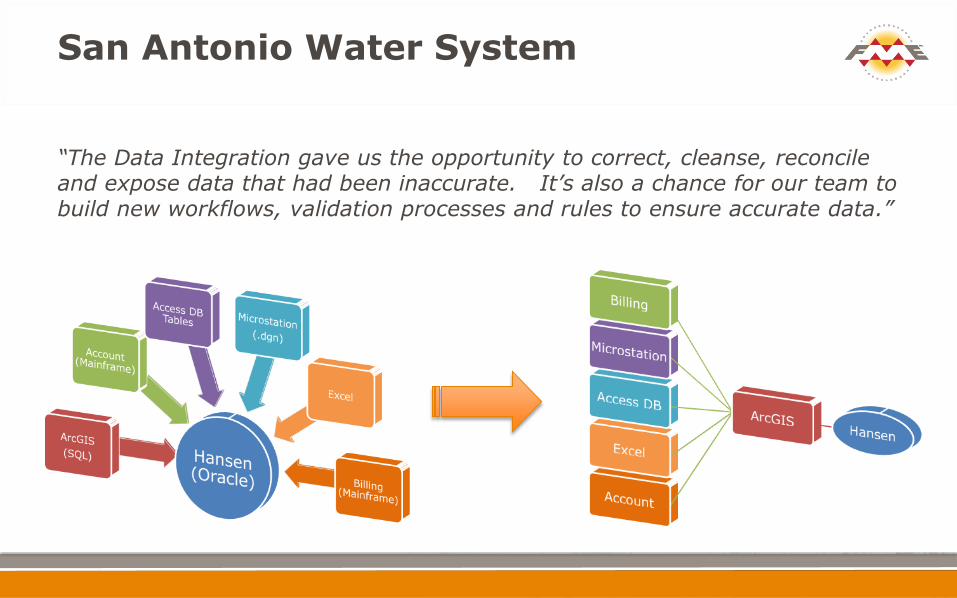
The Mission: Integrate multiple systems and data types across departments, while adopting a new Oracle-based asset management system.
The Solution: Use Esri’s FME-based Data Interoperability Extension to handle it, and save a pile of money at the same time.
San Antonio Water System
“The Data Integration gave us the opportunity to correct, cleanse, reconcile and expose data that had been inaccurate. It’s also a chance for our team to build new workflows, validation processes and rules to ensure accurate data.”
San Antonio Water System
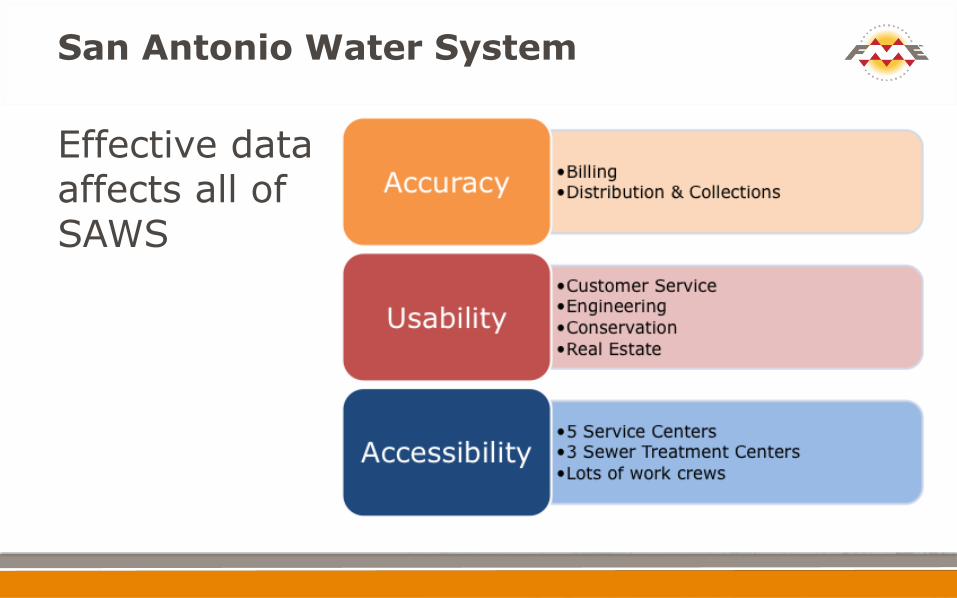
Effective data affects all of SAWS
San Antonio Water System
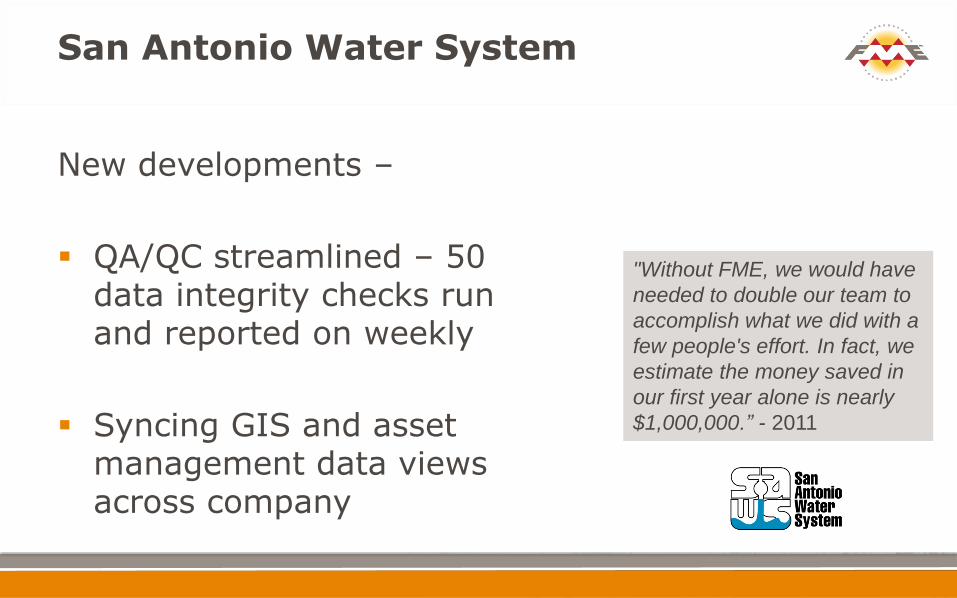
New developments –
QA/QC streamlined – 50 data integrity checks run and reported on weekly
Syncing GIS and asset management data views across company
"Without FME, we would have
needed to double our team to
accomplish what we did with a
few people's effort. In fact, we
estimate the money saved in
our first year alone is nearly
$1,000,000.” - 2011
Gobierno de La Rioja – Spain Ana García de Vicuña
The Mission: Generate land cover classification from RapidEye multispectral images for agricultural analysis – without required algorithms available in remote sensing software
The Solution: Use FME to do it, in a single workspace.
Gobierno de La Rioja
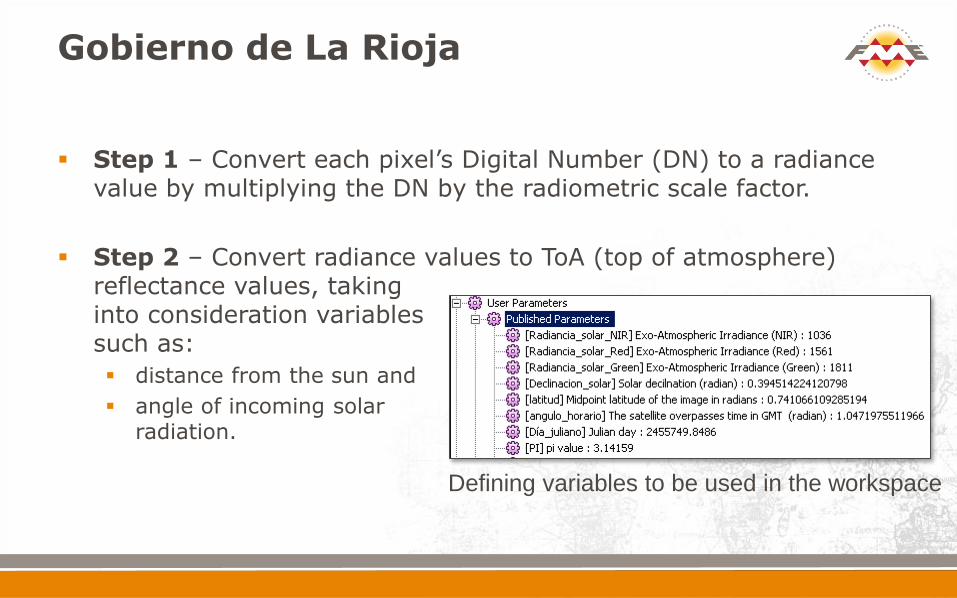
Step 1 – Convert each pixel’s Digital Number (DN) to a radiance value by multiplying the DN by the radiometric scale factor.
Step 2 – Convert radiance values to ToA (top of atmosphere) reflectance values, taking into consideration variables such as:
distance from the sun and
angle of incoming solar radiation.
Defining variables to be used in the workspace
Gobierno de La Rioja
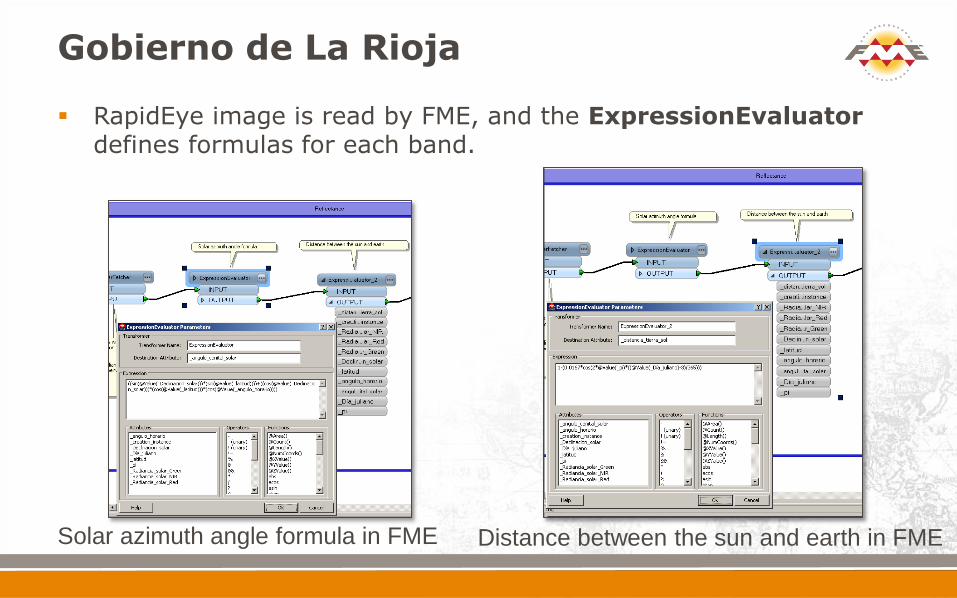
RapidEye image is read by FME, and the ExpressionEvaluator defines formulas for each band.
Distance between the sun and earth in FME Solar azimuth angle formula in FME
Gobierno de La Rioja
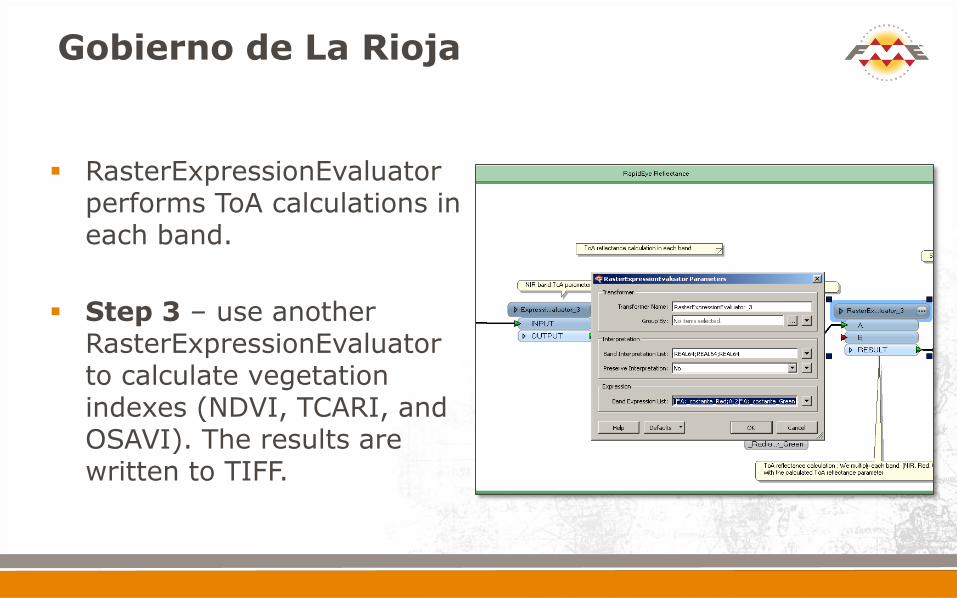
RasterExpressionEvaluator performs ToA calculations in each band.
Step 3 – use another RasterExpressionEvaluator to calculate vegetation indexes (NDVI, TCARI, and OSAVI). The results are written to TIFF.
Gobierno de La Rioja
asdf
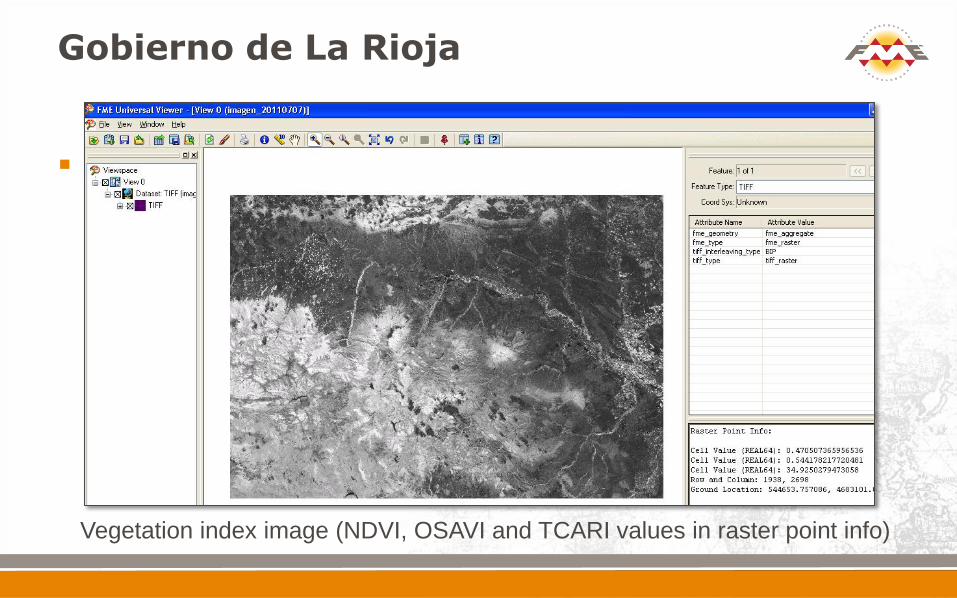
Vegetation index image (NDVI, OSAVI and TCARI values in raster point info)
CN Railway - Canada/USA
The Mission: Optimize operations at North America’s only transcontinental rail network, with over 20,000 route-miles of track.
The Solution: Use FME Desktop and FME Server to deliver automated, real time, or event-driven solutions to almost every CN group and practice.

CN Railway
LiDAR processing extracts surface and track features to generate alignments, corridors, and slope analysis
CN Railway
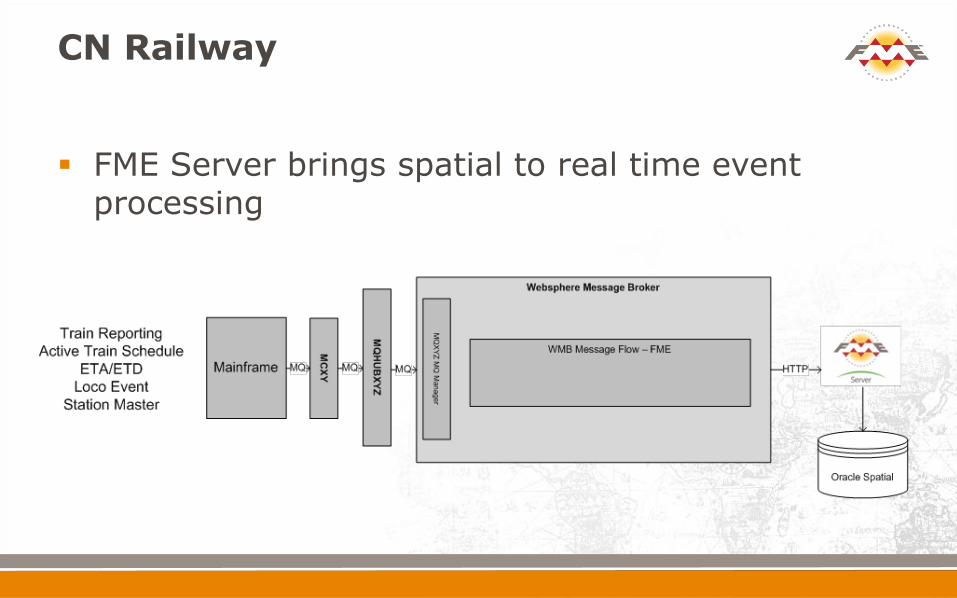
FME Server brings spatial to real time event processing
CN Railway
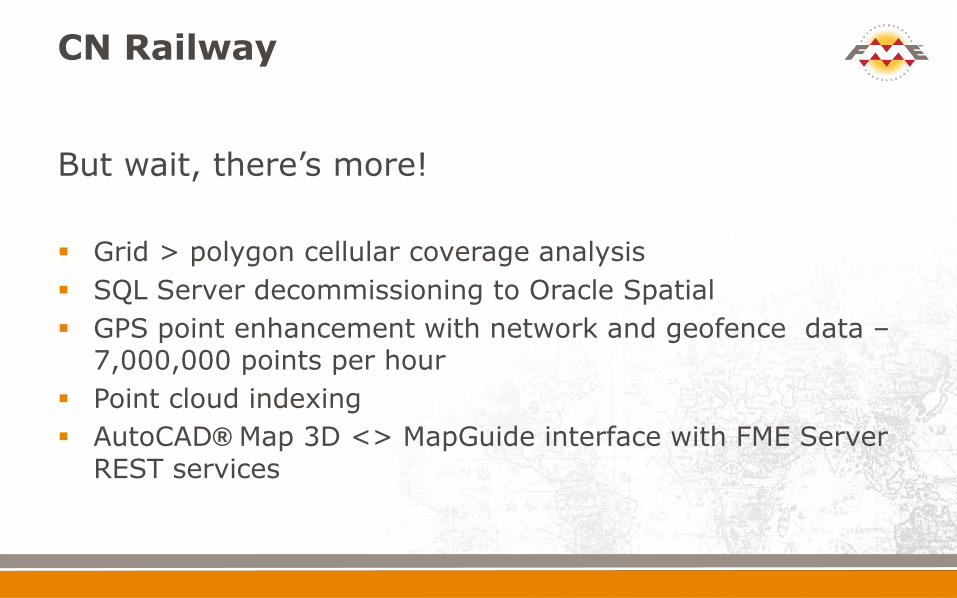
But wait, there’s more!
Grid > polygon cellular coverage analysis
SQL Server decommissioning to Oracle Spatial
GPS point enhancement with network and geofence data – 7,000,000 points per hour
Point cloud indexing
AutoCAD® Map 3D <> MapGuide interface with FME Server REST services
52° North – Germany Simon Jirka, 52° North and Christian Dahmen, con terra
The Mission: To create a prototype system using sensors to assist ships in safe passage under bridges on inland waterways.
The Solution: Use FME Server to calculate and monitor available clearance and ship height, sending notifications if danger exists.
52° North
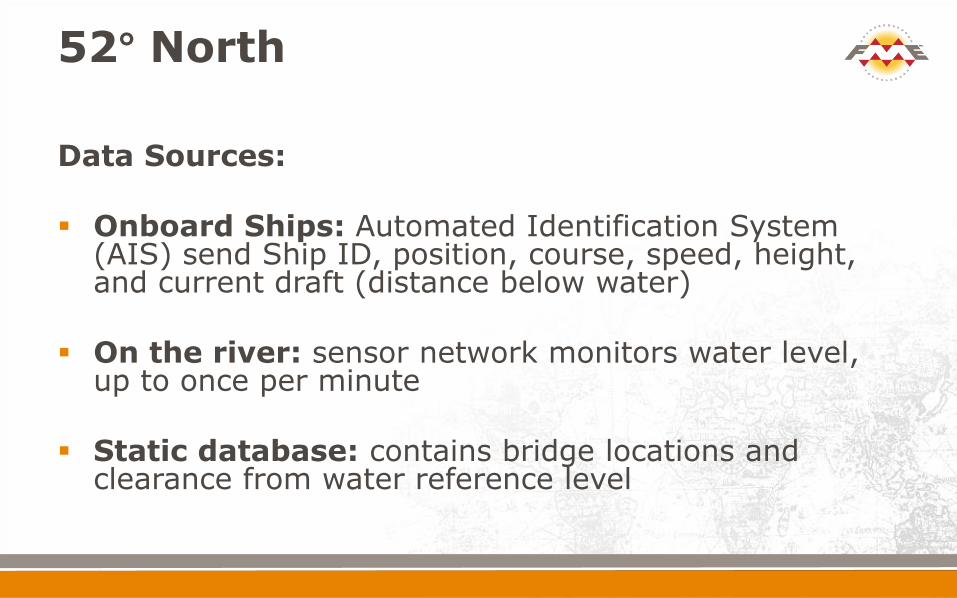
Data Sources: Onboard Ships: Automated Identification System
(AIS) send Ship ID, position, course, speed, height, and current draft (distance below water)
On the river: sensor network monitors water level, up to once per minute
Static database: contains bridge locations and clearance from water reference level
52° North
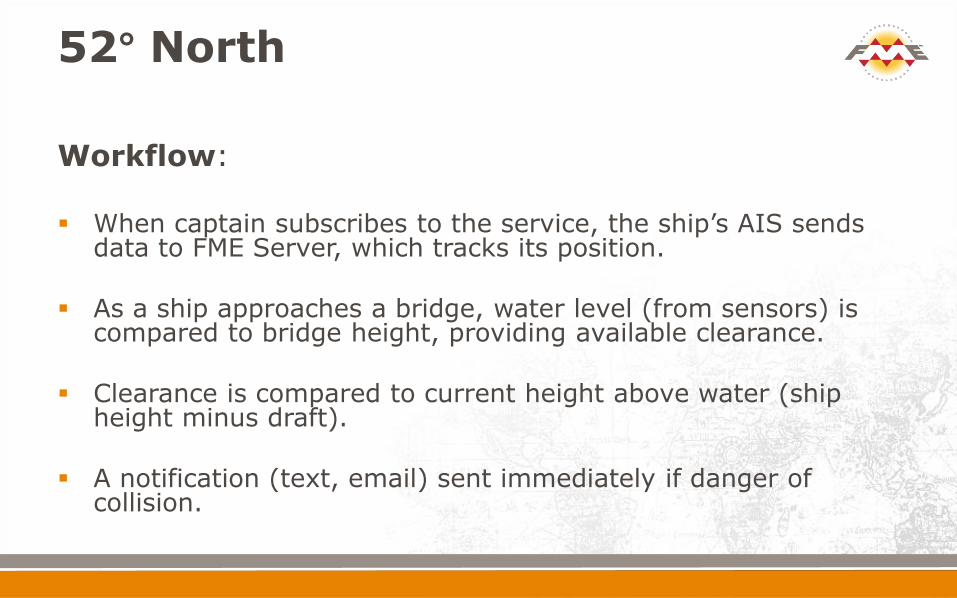
Workflow: When captain subscribes to the service, the ship’s AIS sends
data to FME Server, which tracks its position.
As a ship approaches a bridge, water level (from sensors) is compared to bridge height, providing available clearance.
Clearance is compared to current height above water (ship height minus draft).
A notification (text, email) sent immediately if danger of collision.
52° North
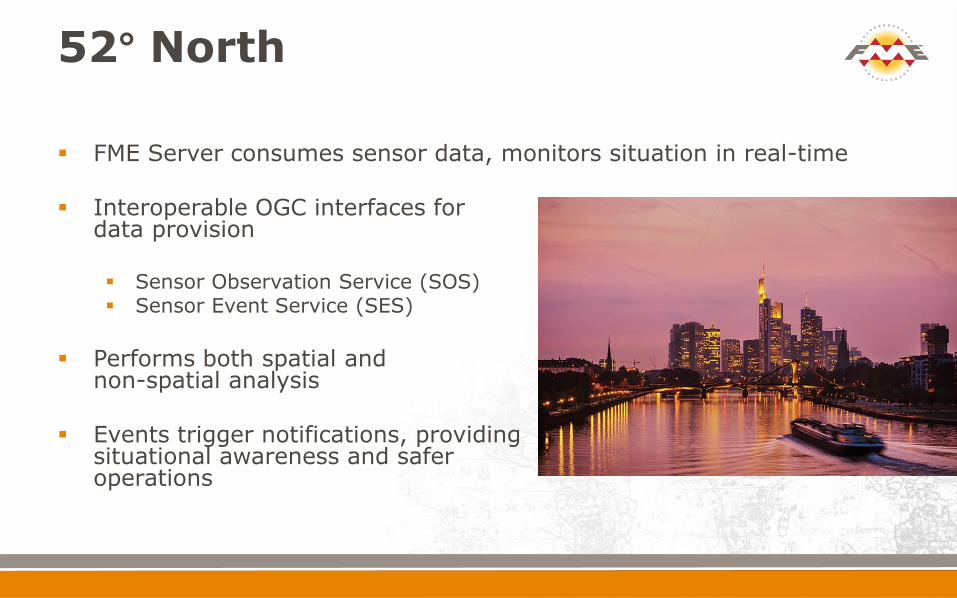
FME Server consumes sensor data, monitors situation in real-time
Interoperable OGC interfaces for data provision Sensor Observation Service (SOS) Sensor Event Service (SES)
Performs both spatial and
non-spatial analysis
Events trigger notifications, providing situational awareness and safer operations
City of Hamilton Public Health Unit - Canada
The Mission: Automate a manual process combining spreadsheets, databases, GIS, and statistical analysis.
The Solution: Use FME to build a reporting tool in Google Earth, reducing report generation time from one week to 12 minutes.
City of Hamilton
West Nile Virus tracking uses statistical and spatial analysis of field observations over time
Geomedia® Pro, databases, and spreadsheets (for charting) were part of manual process
Replaced with FME to combine all functions and generates KML
Reporting tool is now interactive, in Google Earth
City of Hamilton
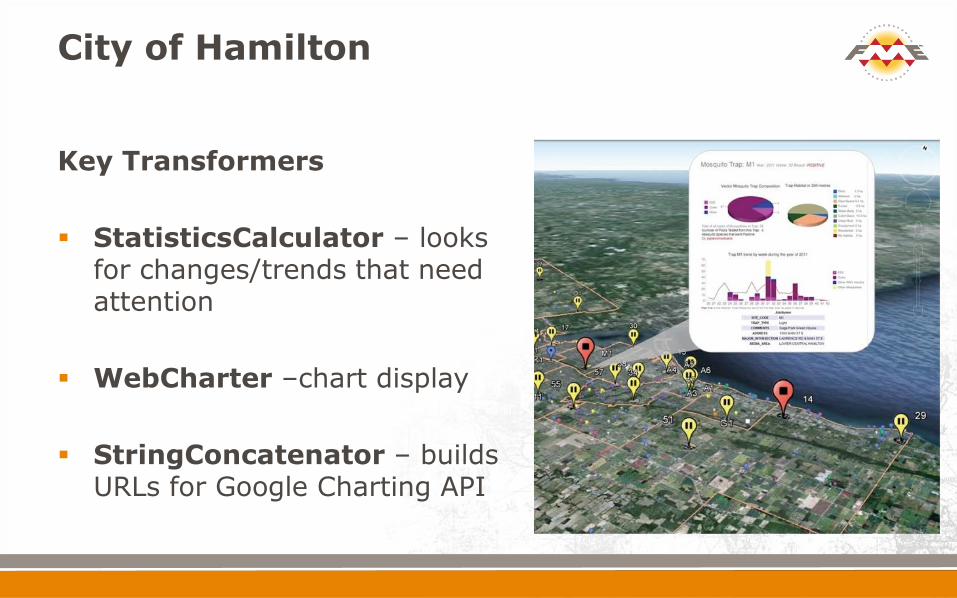
Key Transformers
StatisticsCalculator – looks for changes/trends that need attention
WebCharter –chart display
StringConcatenator – builds URLs for Google Charting API
City of Hamilton
Automating repetitive tasks = huge time savings, reduced reliance on single specialists/points of failure
Faster report availability supports quicker decisions on level of risk and disease control activities
Creative transformer use opens up new possibilities
Swiss Federal Roads Office – Switzerland David Reksten, Inser
The Mission: Perform road accident analysis based on recorded events, with variable criteria, identifying dangerous road segments.
The Solution: Use FME to do a “sliding window” analysis, using linear referencing methodology and user-defined variables.
Swiss Federal Roads
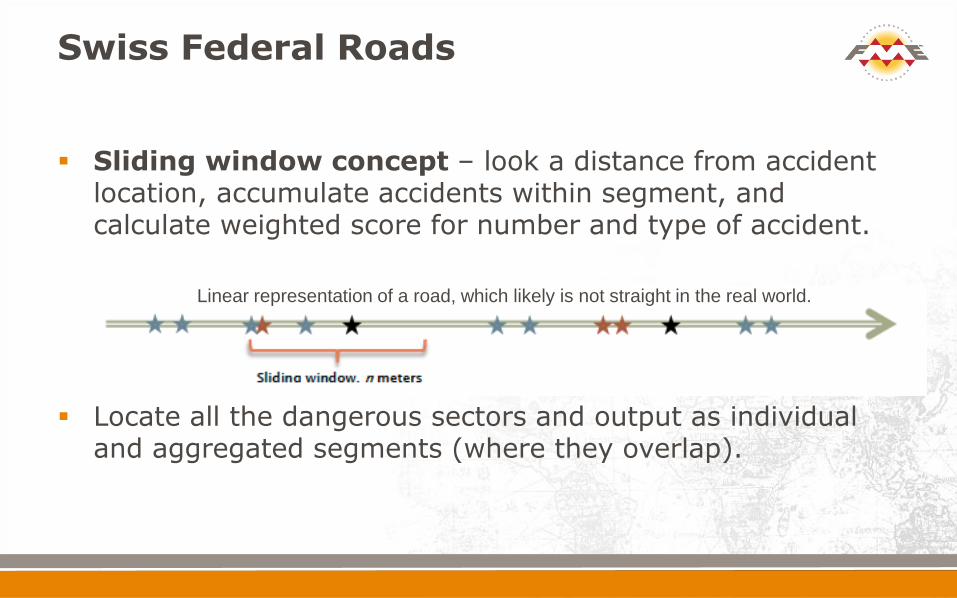
Sliding window concept – look a distance from accident location, accumulate accidents within segment, and calculate weighted score for number and type of accident.
Locate all the dangerous sectors and output as individual and aggregated segments (where they overlap).
Linear representation of a road, which likely is not straight in the real world.
Swiss Federal Roads
Calibrate road segments to linear reference points to acquire maximum M-values
User-defined criteria, sorted by M-value, merged with road segment – sequential list of accidents along feature
Sliding window analysis done (PythonCaller), outputs one feature per window with statistical analysis results
Weighted scores classify segments as dangerous (or not)
Overlapping segments aggregated and statistics re-calculated
Swiss Federal Roads
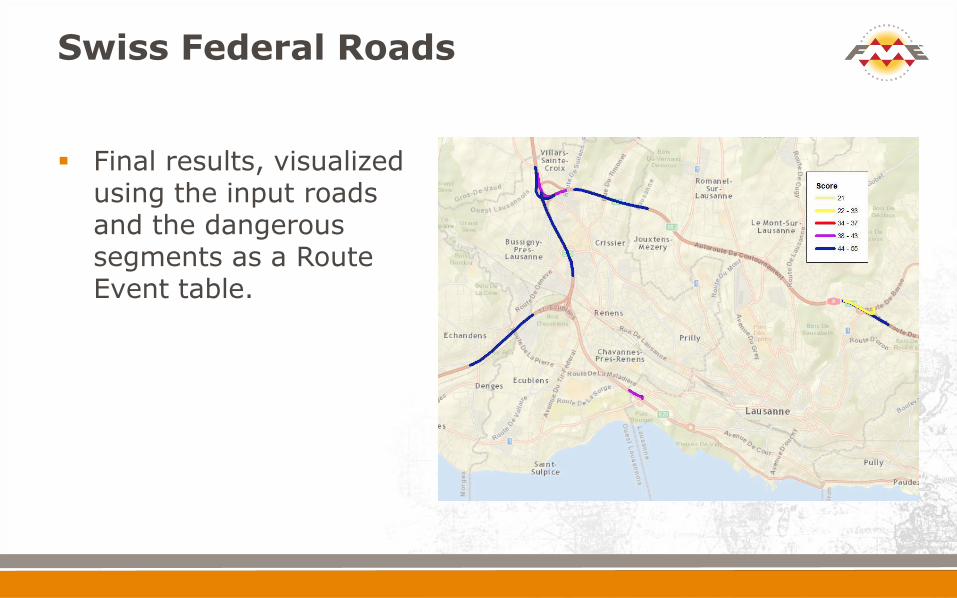
Final results, visualized using the input roads and the dangerous segments as a Route Event table.
pragmatica inc. – Japan Takashi Iijima
The Mission: Estimate radioactive material concentrations in agricultural water supply catchments near Fukushima
The Solution: Use FME to interpolate tabular regional observation data for catchment areas
pragmatica inc.
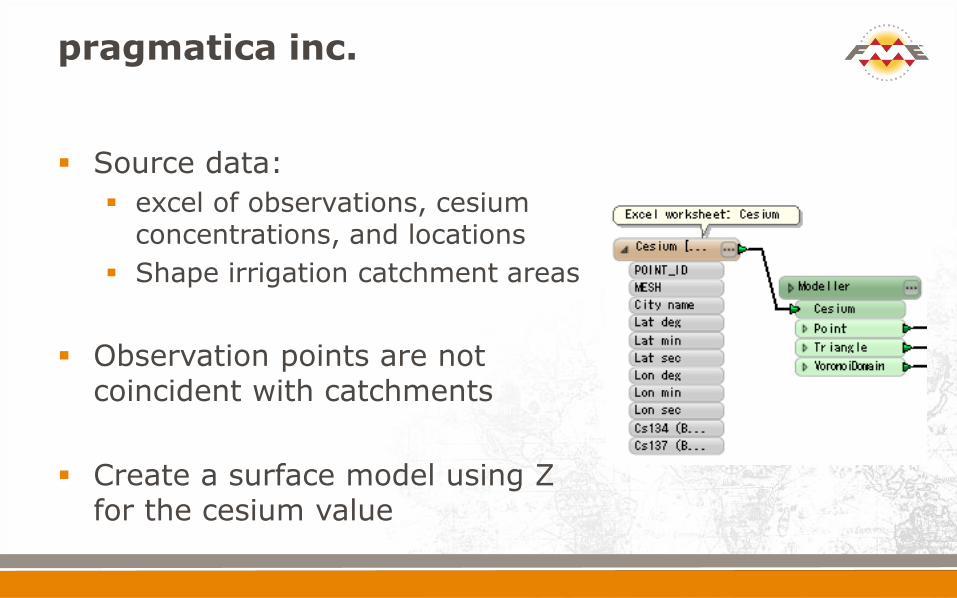
Source data:
excel of observations, cesium concentrations, and locations
Shape irrigation catchment areas
Observation points are not coincident with catchments
Create a surface model using Z for the cesium value
pragmatica inc.
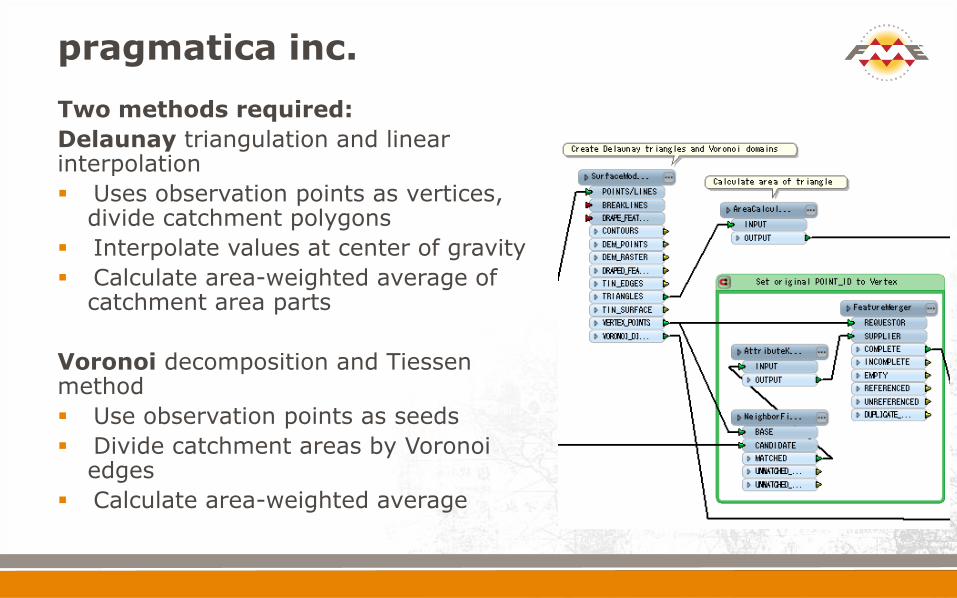
Two methods required:
Delaunay triangulation and linear interpolation
Uses observation points as vertices, divide catchment polygons
Interpolate values at center of gravity
Calculate area-weighted average of catchment area parts
Voronoi decomposition and Tiessen method
Use observation points as seeds
Divide catchment areas by Voronoi edges
Calculate area-weighted average
pragmatica inc.
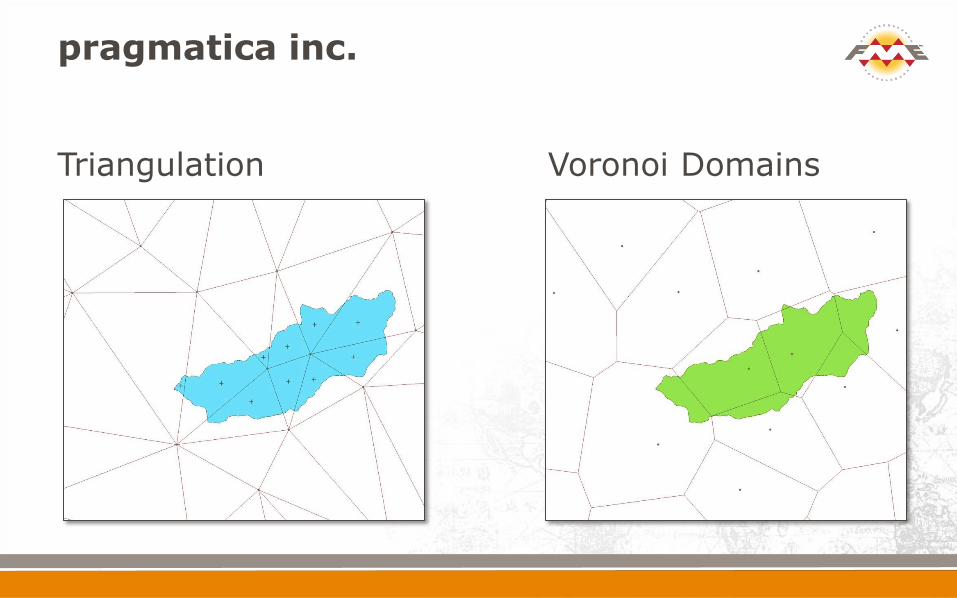
Triangulation Voronoi Domains

WhiteStar Corp - USA
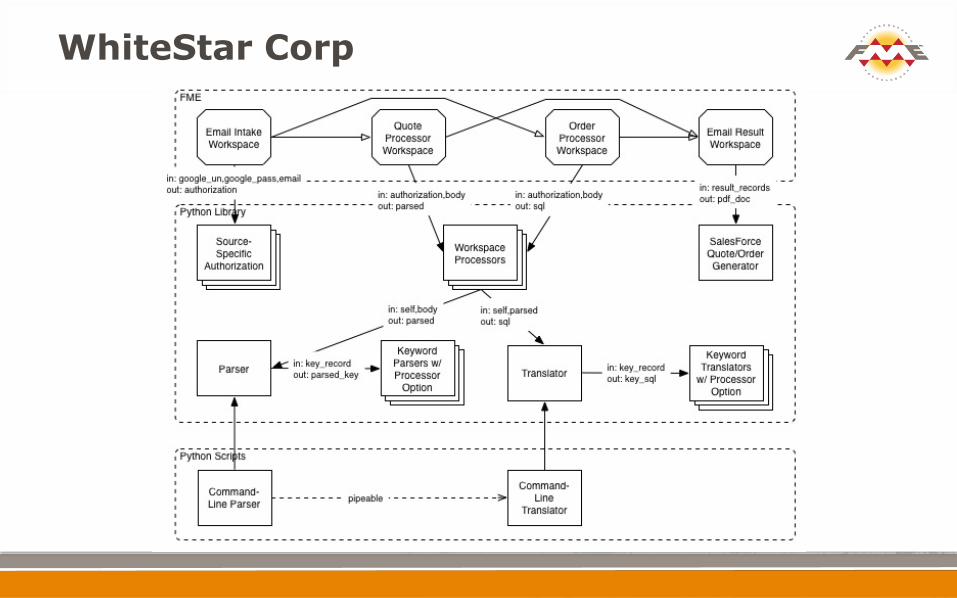
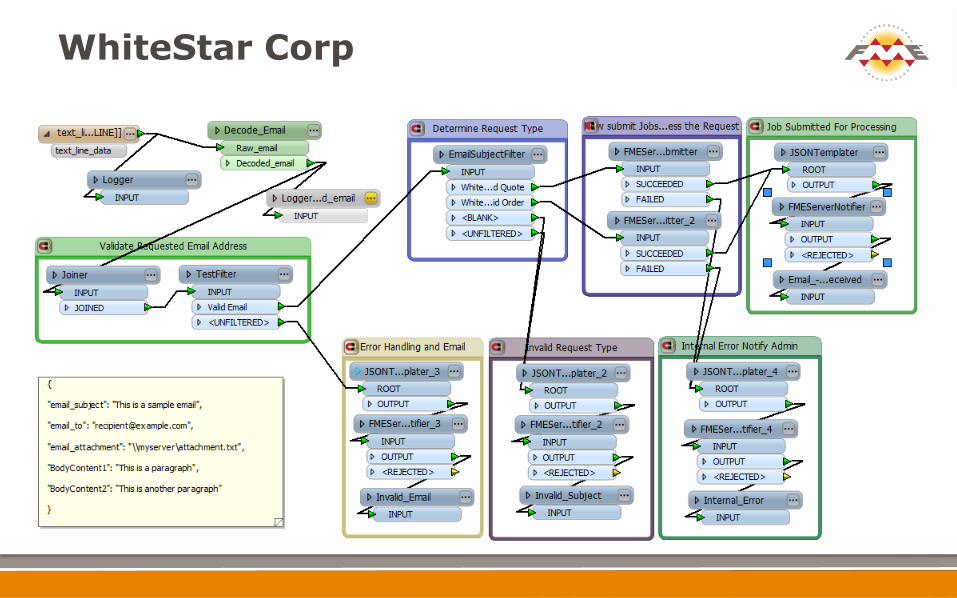
The Mission: Automate a manually intensive land grid data ordering and fulfillment system for external customers.
The Solution: Use FME Server’s email protocol support to process and fulfill emailed data orders – in the cloud.
WhiteStar Corp
WhiteStar Corp

WhiteStar Corp
Decoding email and processing a data order
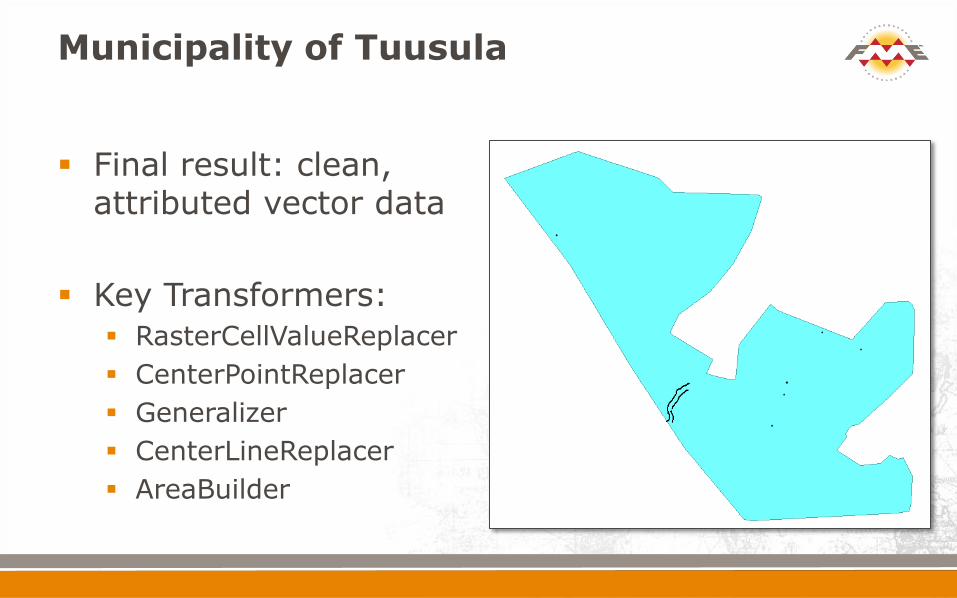
Municipality of Tuusula – Finland Lassi Tani, Spatialworld
The Mission: Convert environmental observations, received as JPGs with drawn areas, lines, and symbols, to vector data.
The Solution: Use FME’s vectorization transformers to produce point, line, and polygon vector data.
Municipality of Tuusula
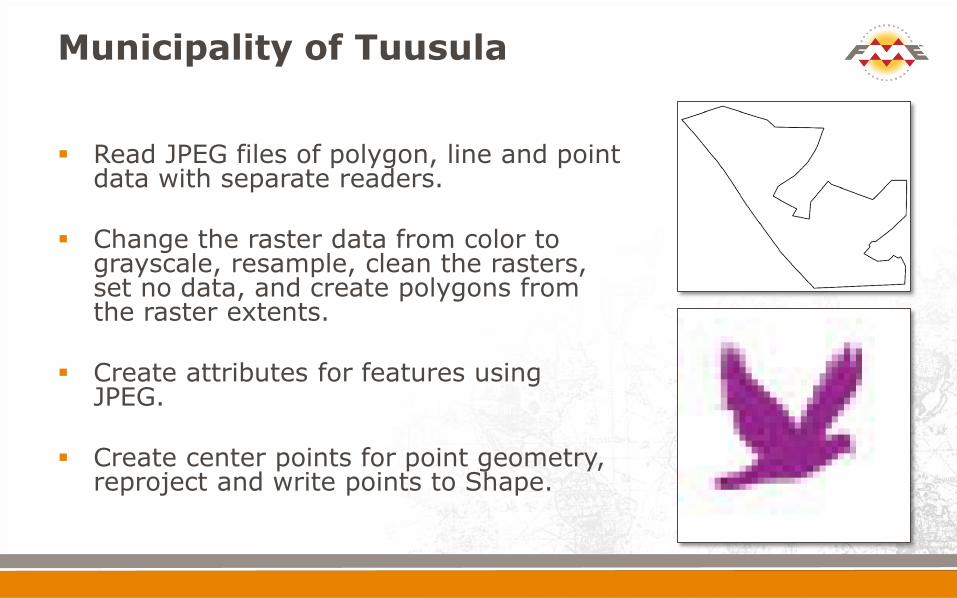
Read JPEG files of polygon, line and point data with separate readers.
Change the raster data from color to grayscale, resample, clean the rasters, set no data, and create polygons from the raster extents.
Create attributes for features using JPEG.
Create center points for point geometry, reproject and write points to Shape.
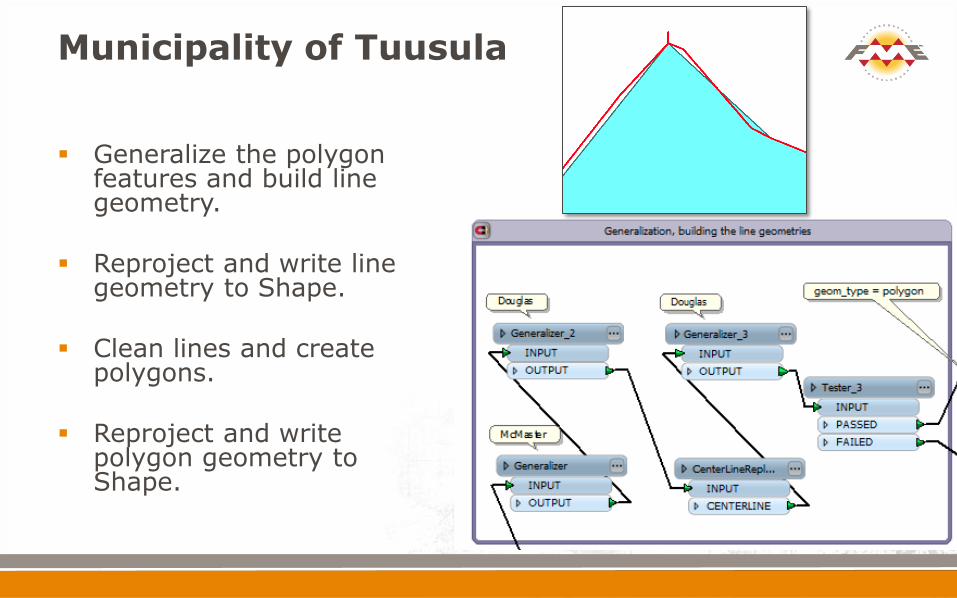
Generalize the polygon features and build line geometry.
Reproject and write line geometry to Shape.
Clean lines and create polygons.
Reproject and write polygon geometry to Shape.
Municipality of Tuusula
Municipality of Tuusula
Final result: clean, attributed vector data
Key Transformers:
RasterCellValueReplacer
CenterPointReplacer
Generalizer
CenterLineReplacer
AreaBuilder
Syncadd - USA
The Mission: Monitor data uploaded via a web interface to an Army Geospatial Data Warehouse for compliance and data model validation, reporting the results.
The Solution: Use FME Server and custom transformers to run QA tests and email the results as Excel spreadsheets.
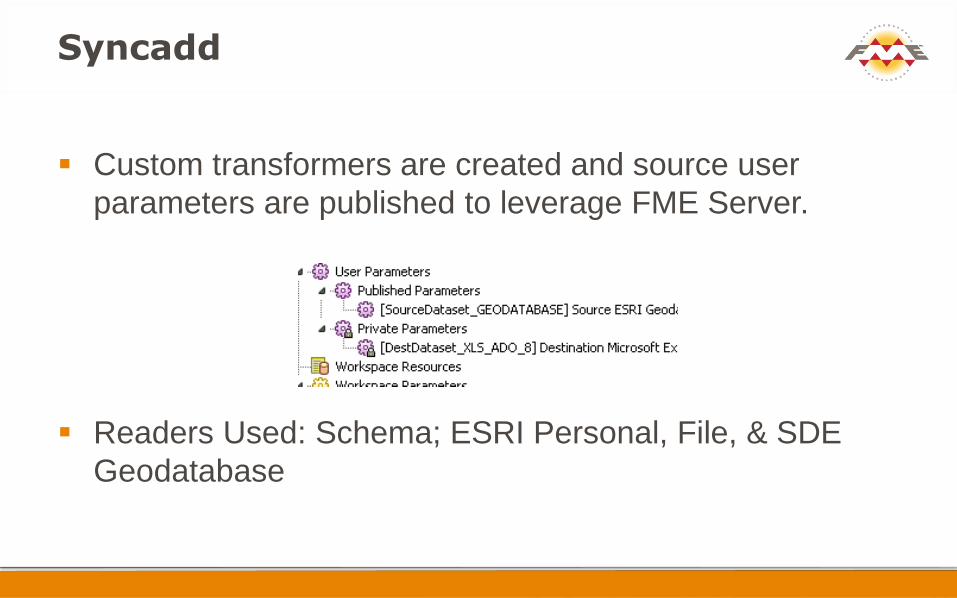
Syncadd
Custom transformers are created and source user
parameters are published to leverage FME Server.
Readers Used: Schema; ESRI Personal, File, & SDE
Geodatabase
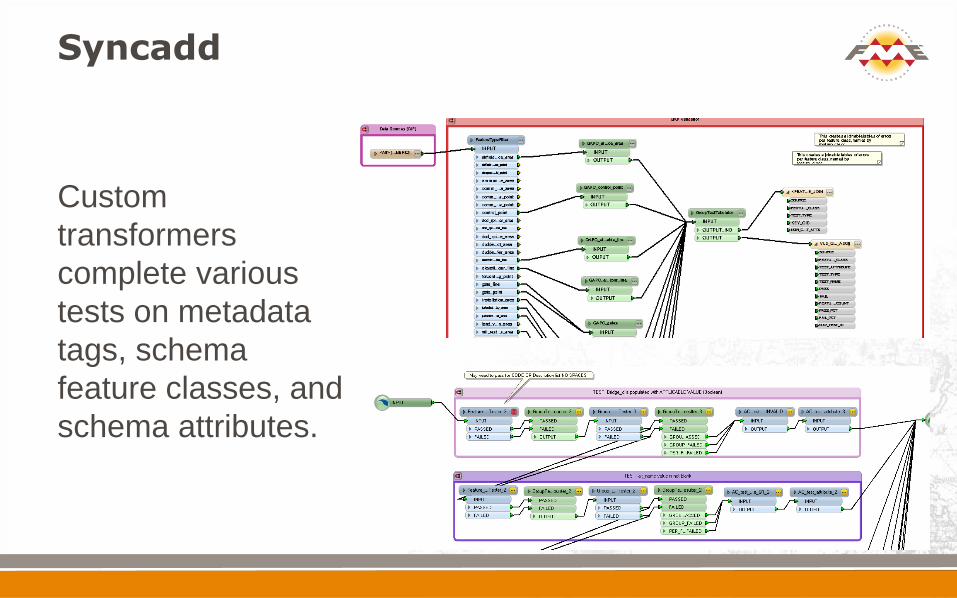
Syncadd
Custom
transformers
complete various
tests on metadata
tags, schema
feature classes, and
schema attributes.
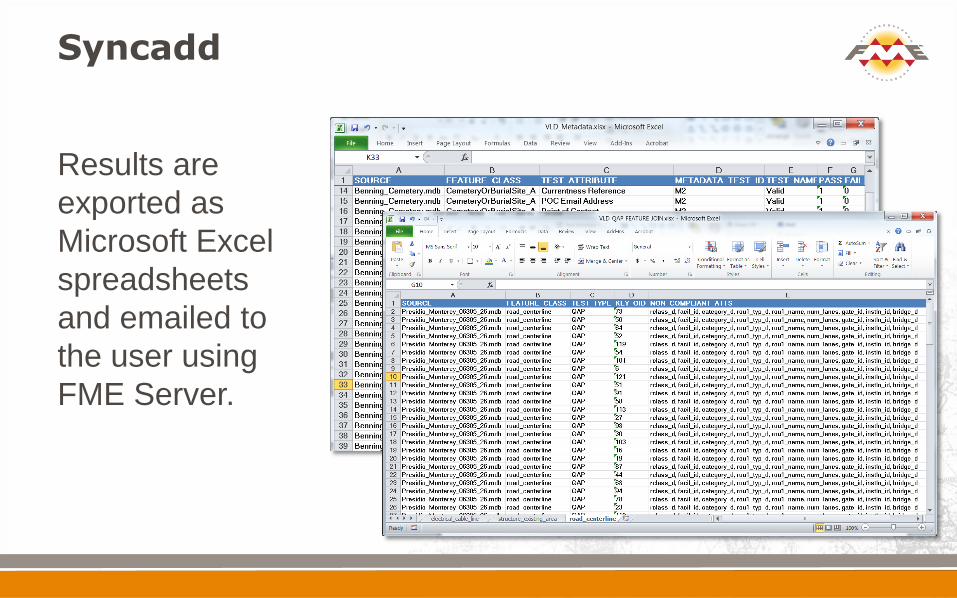
Syncadd
Results are
exported as
Microsoft Excel
spreadsheets
and emailed to
the user using
FME Server.

Are YOU a Trekker?
Share your FME stories with your compatriots across the galaxy!
Send them to the FME Insider –

Coming up next!


