Page 1Find us at www.keysight.com
T E C H N I C A L O V E R V I E W
• Analyze Frequency Modulated Continuous Wave (FMCW) radar signals used in automotive radar, industrial, surveillance, aerospace and defense radar applications
• Automatically synchronize to FMCW radar signals comprised of multi-chirp linear FM modulation patterns
• Visualize FMCW signal modulation characteristics and impairment errors within the synchronized amplitude, phase, frequency (FM) and frequency slope (FM Slope) trace results
• Verify all key FMCW signal modulation performance indicators relating to power, time, phase, frequency (FM) and frequency slope rate using a comprehensive FMCW region table
• Accumulate performance data statistics for each reported FMCW metric over single or multiple acquisitions using the FMCW current record statistics and cumulative statistics, along with graphical histogram and trend line trace plots
• Gain deeper insight into your signal’s time and frequency dynamic and spurious performance with powerful and flexible trace views such as spectrogram and cumulative history
• Select from more than 40 Keysight measurement platforms to meet your specific design and test goals
FMCW Radar Analysis 89600 VSA SoftwareOption 89601BHPC (Replacing 89601B/BN/BK-BHP)
Page 2Find us at www.keysight.com
FMCW Radar AnalysisThe Keysight 89600 VSA software is a comprehensive set of tools for signal
demodulation, vector signal analysis and time domain analysis. Option BHP for
Frequency Modulated Continuous Wave (FMCW) radar analysis helps R&D and design
verification test engineers quickly and easily make automated modulation quality
measurements on multi-chirp linear FM signals according the evolving requirements
for radar sensor performance and detection techniques in automotive, aerospace
and defense applications. The new 89601BHPC FMCW option provides signal
synchronization, quick access to multiple FMCW modulation domain result traces,
metrics, statistics, histograms and trend lines. 89600 VSA software with Option BHP
provides design engineers more insight into and confidence in product design and
quality in a shorter test time and accelerates time to market.
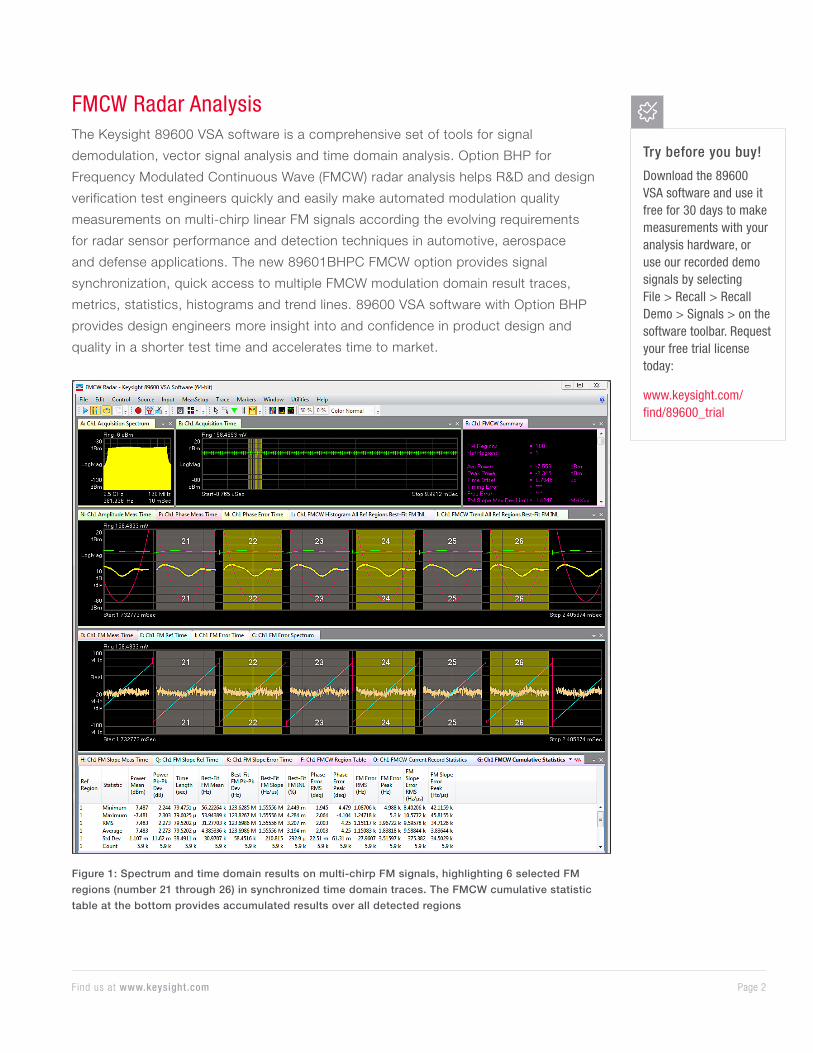
Figure 1: Spectrum and time domain results on multi-chirp FM signals, highlighting 6 selected FM
regions (number 21 through 26) in synchronized time domain traces. The FMCW cumulative statistic
table at the bottom provides accumulated results over all detected regions
Try before you buy!
Download the 89600 VSA software and use it free for 30 days to make measurements with your analysis hardware, or use our recorded demo signals by selecting File > Recall > Recall Demo > Signals > on the software toolbar. Request your free trial license today:
www.keysight.com/find/89600_trial
Page 3Find us at www.keysight.com
FMCW Radar TechnologyFMCW is common in radar applications and is typically used for determining the distance
and speed of target objects. For example, automotive companies are developing FMCW
radar components, antennas, and sensors for use in adaptive cruise control (ACC), blind
spot monitoring, traffic alerts, and even automated driving. These applications are at
frequencies of 24 GHz, 77 GHz, and 79 GHz, with wider bandwidths of up to 2 GHz.
Other radar applications such as high resolution image radar, weather monitoring radar,
and ground surveillance radar use FMCW signals as well.
Scalable Measurements Across Various Hardware PlatformsThe 89600 VSA software is supported by over 40 Keysight measurement platforms at
analog and digital baseband, IF, RF and mmWave, so you can select the appropriate
hardware necessary to acquire signal data and meet your performance requirements
and test margins. To meet the wide bandwidth requirements of FMCW radar analysis,
Keysight’s UXA X-Series signal analyzers can offer the highest performance signal analysis
capability, with the greatest dynamic range with up to 510 MHz analysis bandwidth.
The Keysight Infiniium oscilloscopes and M9703A AXIe wideband digitizers are the ideal
solution for even wider bandwidths.
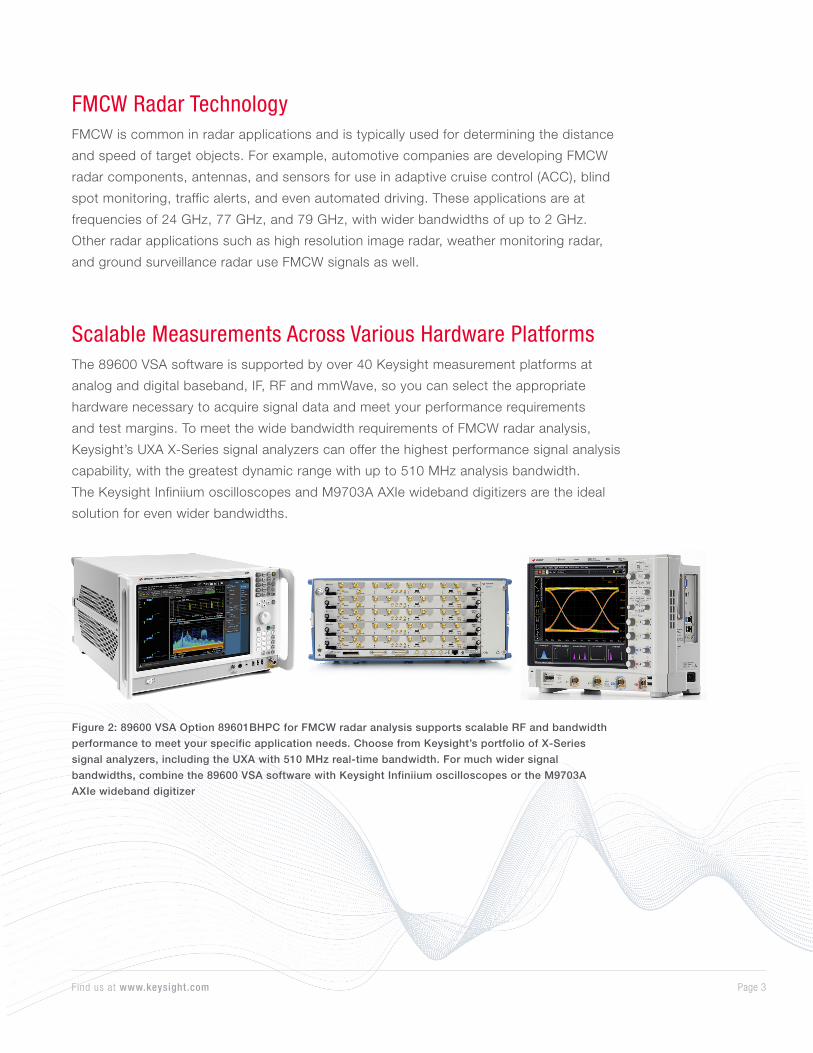
Figure 2: 89600 VSA Option 89601BHPC for FMCW radar analysis supports scalable RF and bandwidth
performance to meet your specific application needs. Choose from Keysight’s portfolio of X-Series
signal analyzers, including the UXA with 510 MHz real-time bandwidth. For much wider signal
bandwidths, combine the 89600 VSA software with Keysight Infiniium oscilloscopes or the M9703A
AXIe wideband digitizer
Page 4Find us at www.keysight.com
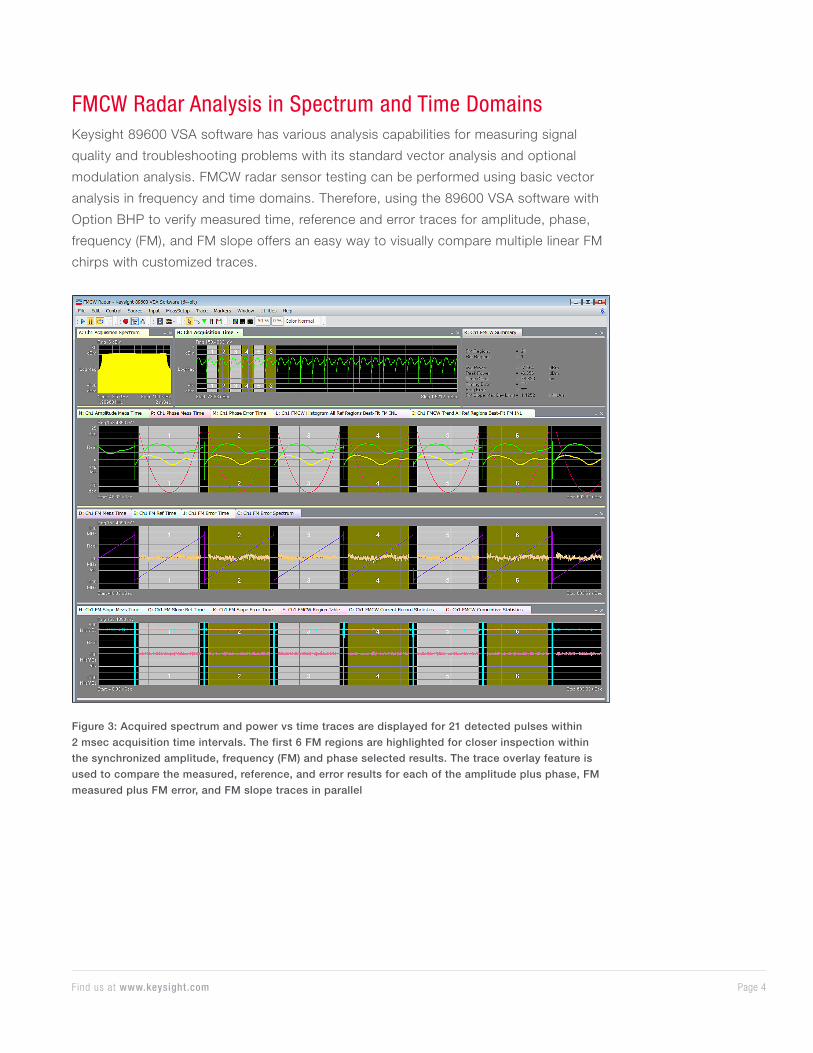
Figure 3: Acquired spectrum and power vs time traces are displayed for 21 detected pulses within
2 msec acquisition time intervals. The first 6 FM regions are highlighted for closer inspection within
the synchronized amplitude, frequency (FM) and phase selected results. The trace overlay feature is
used to compare the measured, reference, and error results for each of the amplitude plus phase, FM
measured plus FM error, and FM slope traces in parallel
FMCW Radar Analysis in Spectrum and Time DomainsKeysight 89600 VSA software has various analysis capabilities for measuring signal
quality and troubleshooting problems with its standard vector analysis and optional
modulation analysis. FMCW radar sensor testing can be performed using basic vector
analysis in frequency and time domains. Therefore, using the 89600 VSA software with
Option BHP to verify measured time, reference and error traces for amplitude, phase,
frequency (FM), and FM slope offers an easy way to visually compare multiple linear FM
chirps with customized traces.
Page 5Find us at www.keysight.com
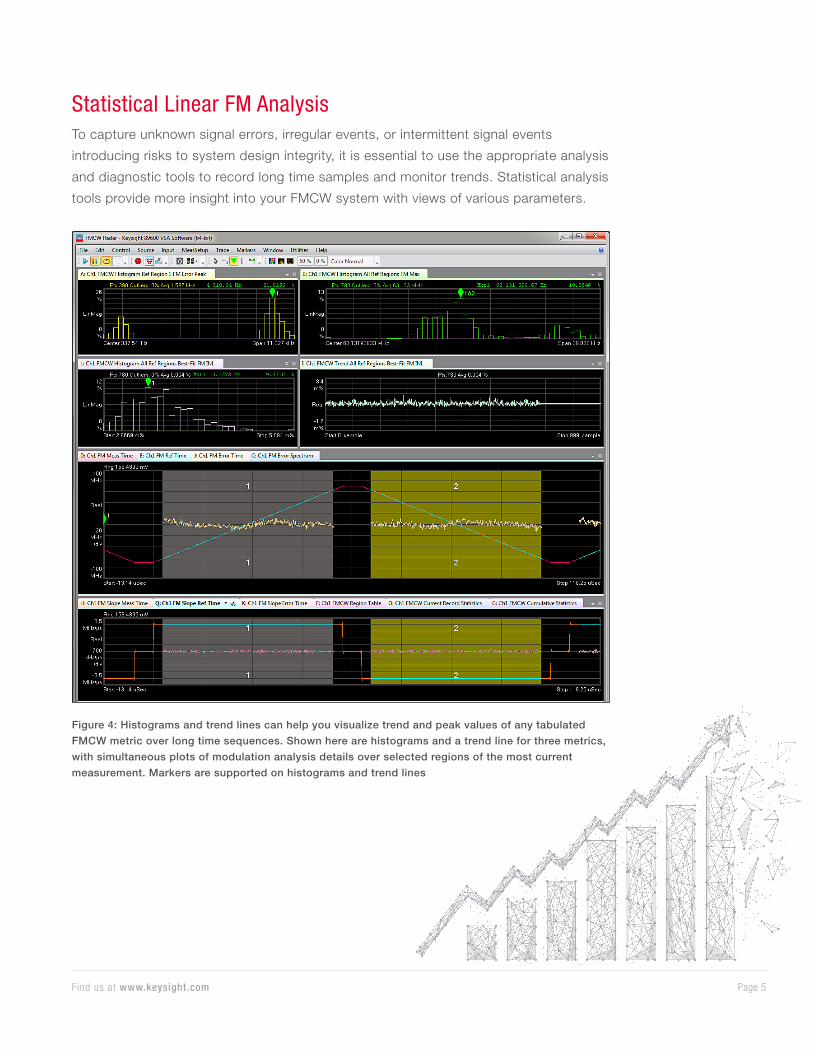
Figure 4: Histograms and trend lines can help you visualize trend and peak values of any tabulated
FMCW metric over long time sequences. Shown here are histograms and a trend line for three metrics,
with simultaneous plots of modulation analysis details over selected regions of the most current
measurement. Markers are supported on histograms and trend lines
Statistical Linear FM AnalysisTo capture unknown signal errors, irregular events, or intermittent signal events
introducing risks to system design integrity, it is essential to use the appropriate analysis
and diagnostic tools to record long time samples and monitor trends. Statistical analysis
tools provide more insight into your FMCW system with views of various parameters.
Page 6Find us at www.keysight.com
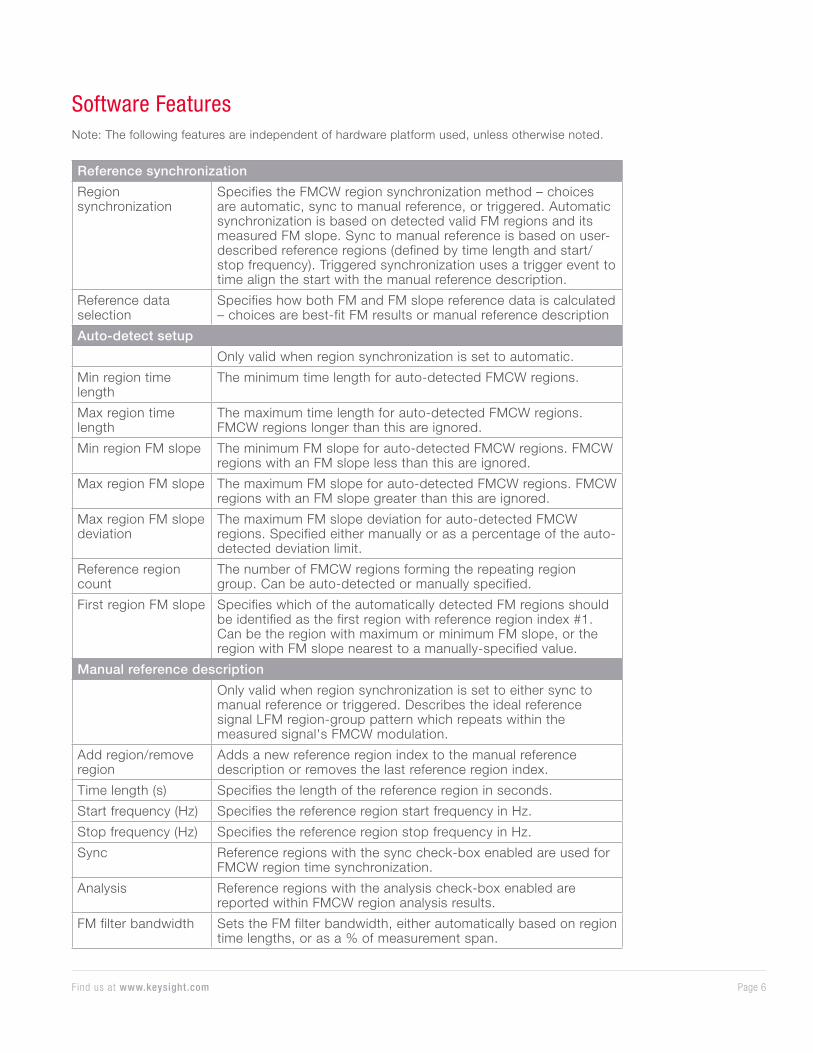
Software FeaturesNote: The following features are independent of hardware platform used, unless otherwise noted.
Reference synchronization
Region synchronization
Specifies the FMCW region synchronization method – choices are automatic, sync to manual reference, or triggered. Automatic synchronization is based on detected valid FM regions and its measured FM slope. Sync to manual reference is based on user-described reference regions (defined by time length and start/stop frequency). Triggered synchronization uses a trigger event to time align the start with the manual reference description.
Reference data selection
Specifies how both FM and FM slope reference data is calculated – choices are best-fit FM results or manual reference description
Auto-detect setup
Only valid when region synchronization is set to automatic.
Min region time length
The minimum time length for auto-detected FMCW regions.
Max region time length
The maximum time length for auto-detected FMCW regions. FMCW regions longer than this are ignored.
Min region FM slope The minimum FM slope for auto-detected FMCW regions. FMCW regions with an FM slope less than this are ignored.
Max region FM slope The maximum FM slope for auto-detected FMCW regions. FMCW regions with an FM slope greater than this are ignored.
Max region FM slope deviation
The maximum FM slope deviation for auto-detected FMCW regions. Specified either manually or as a percentage of the auto-detected deviation limit.
Reference region count
The number of FMCW regions forming the repeating region group. Can be auto-detected or manually specified.
First region FM slope Specifies which of the automatically detected FM regions should be identified as the first region with reference region index #1. Can be the region with maximum or minimum FM slope, or the region with FM slope nearest to a manually-specified value.
Manual reference description
Only valid when region synchronization is set to either sync to manual reference or triggered. Describes the ideal reference signal LFM region-group pattern which repeats within the measured signal's FMCW modulation.
Add region/remove region
Adds a new reference region index to the manual reference description or removes the last reference region index.
Time length (s) Specifies the length of the reference region in seconds.
Start frequency (Hz) Specifies the reference region start frequency in Hz.
Stop frequency (Hz) Specifies the reference region stop frequency in Hz.
Sync Reference regions with the sync check-box enabled are used for FMCW region time synchronization.
Analysis Reference regions with the analysis check-box enabled are reported within FMCW region analysis results.
FM filter bandwidth Sets the FM filter bandwidth, either automatically based on region time lengths, or as a % of measurement span.
Page 7Find us at www.keysight.com
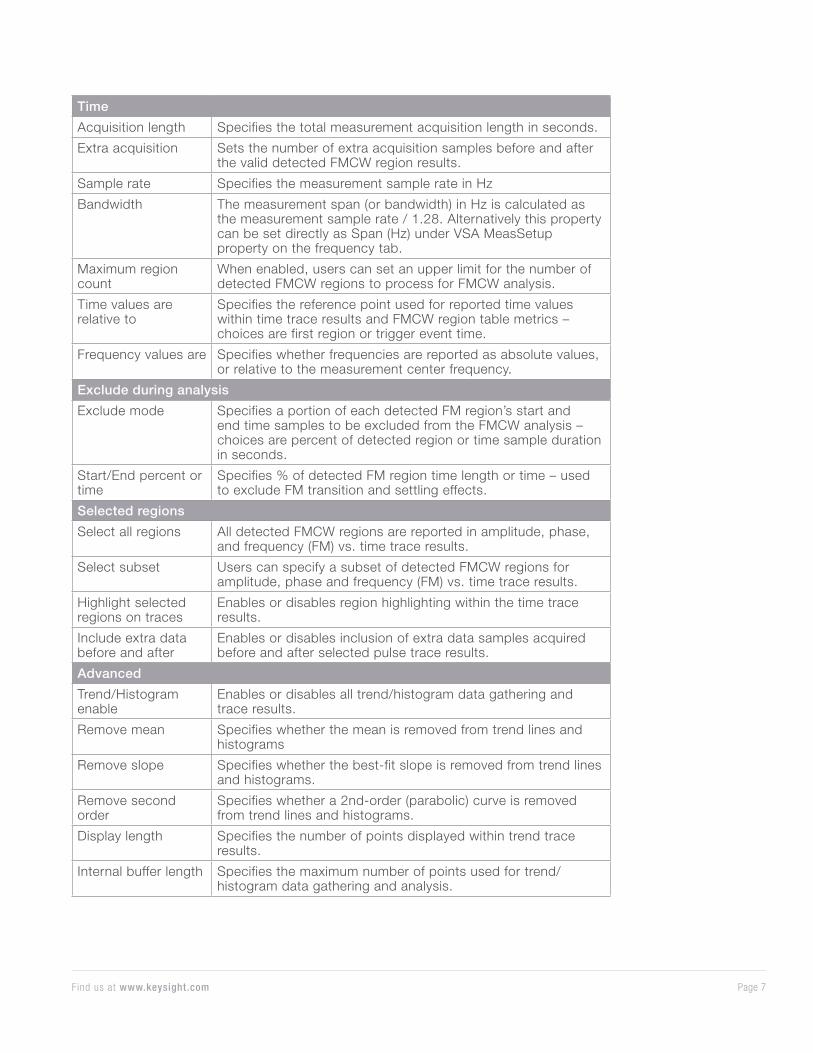
Time
Acquisition length Specifies the total measurement acquisition length in seconds.
Extra acquisition Sets the number of extra acquisition samples before and after the valid detected FMCW region results.
Sample rate Specifies the measurement sample rate in Hz
Bandwidth The measurement span (or bandwidth) in Hz is calculated as the measurement sample rate / 1.28. Alternatively this property can be set directly as Span (Hz) under VSA MeasSetup property on the frequency tab.
Maximum region count
When enabled, users can set an upper limit for the number of detected FMCW regions to process for FMCW analysis.
Time values are relative to
Specifies the reference point used for reported time values within time trace results and FMCW region table metrics – choices are first region or trigger event time.
Frequency values are Specifies whether frequencies are reported as absolute values, or relative to the measurement center frequency.
Exclude during analysis
Exclude mode Specifies a portion of each detected FM region’s start and end time samples to be excluded from the FMCW analysis – choices are percent of detected region or time sample duration in seconds.
Start/End percent or time
Specifies % of detected FM region time length or time – used to exclude FM transition and settling effects.
Selected regions
Select all regions All detected FMCW regions are reported in amplitude, phase, and frequency (FM) vs. time trace results.
Select subset Users can specify a subset of detected FMCW regions for amplitude, phase and frequency (FM) vs. time trace results.
Highlight selected regions on traces
Enables or disables region highlighting within the time trace results.
Include extra data before and after
Enables or disables inclusion of extra data samples acquired before and after selected pulse trace results.
Advanced
Trend/Histogram enable
Enables or disables all trend/histogram data gathering and trace results.
Remove mean Specifies whether the mean is removed from trend lines and histograms
Remove slope Specifies whether the best-fit slope is removed from trend lines and histograms.
Remove second order
Specifies whether a 2nd-order (parabolic) curve is removed from trend lines and histograms.
Display length Specifies the number of points displayed within trend trace results.
Internal buffer length Specifies the maximum number of points used for trend/histogram data gathering and analysis.

Page 8Find us at www.keysight.com
Histogram range Choose from automatic (min/max limits of histogram set to mean ± 3 * standard deviation of the data), or full (actual min/max limits of the data are used for histogram).
Measurement pause enable
Allows a continuous measurement to pause based on the defined measurement metric, operator (conditional test), and threshold combination.
FM slope base unit Determines the base unit of FM slope results reported in FM slope trace and FMCW table metrics – choices are automatic, Hz/s, Hz/ms, Hz/us, Hz/ns, or Hz/ps.
Measurement results
Channel <N> Acquisition time, auto correlation, CCDF, CDF, correction, instantaneous spectrum, PDF, PSD, raw main time, spectrum.
Amplitude Amplitude meas time, instantaneous amplitude meas time.
Phase Phase error time, phase meas time, phase ref time, instantaneous phase error time, instantaneous phase meas time.
FM FM error spectrum, FM error time, FM meas spectrum, FM meas time, FM ref spectrum, FM ref time, Instantaneous FM error spectrum, Instantaneous FM error time, Instantaneous FM meas spectrum, Instantaneous FM meas time, FM filter coefficients.
FM slope FM slope error time, FM slope meas time, FM slope ref time, Instantaneous FM slope error time, Instantaneous FM slope meas time.
Result tables Region table (reports metrics for power, time, best-fit FM, FM, phase error, FM error, FM slope error), Cumulative statistics (reports, min., max., RMS, average, std. dev. and count for all metrics on all detected regions since the last measurement restart.), Current statistics (same as cumulative statistics, but only for the current acquisition), Summary (# of FM region, # of reference region, Avg power, peak power, time offset, timing error, frequency error, FM slope max. dev. limit)
Region table metrics, trend lines, histograms
Power Power mean (dBm), power max.(dBm), power min. (dBm), power pk-pk deviation (dB)
Time Time start (sec), time length (sec)
Best-fit FM Best-fit FM mean (Hz), best-fit FM start (Hz), best-fit FM stop (Hz), best-fit FM pk-pk deviation (Hz), best-fit FM slope (Hz/µsec), best-fit FM INL (%, integral non linearity)
FM FM max. (Hz), FM min. (Hz), FM pk-pk deviation (Hz)
Phase error Phase error RMS (deg), phase error peak (deg), phase error peak location (sec)
FM error FM error RMS (Hz), FM error peak (Hz), FM error peak location (sec)
FM slope error FM slope error RMS (Hz), FM slope error peak (Hz), FM slope error peak location (sec)

Page 9Find us at www.keysight.com
Key SpecificationsThis technical overview provides nominal performance specifications for the software when
making measurements with the specified platform 1. Nominal values indicate expected
performance, or describe product performance that is useful in the application of the
product. For a complete list of specifications refer to the measurement platform literature.
General
Frequency Depends on connected hardware platforms
Trigger types Free run, external, IF magnitude, frequency mask 2
Sample intervals, time resolution
Depends on analysis bandwidth (BW) of connected hardware
Min sample interval = 1/(1.28*BW)
Max sample rate = 1/(SampleInterval) = 1.28 * BW
Live acquisition length
10 MSa per 4 GB of physical memory on the PC running the 89600 VSA software.
5 MSa on 89600 VSA software running with X-Series signal analyzer
Recording lengthDepends on the measurement hardware. Visit http://www.keysight.com/find/89600_hardware to find the maximum capture depth supported by each hardware platform.
Measurement accuracy
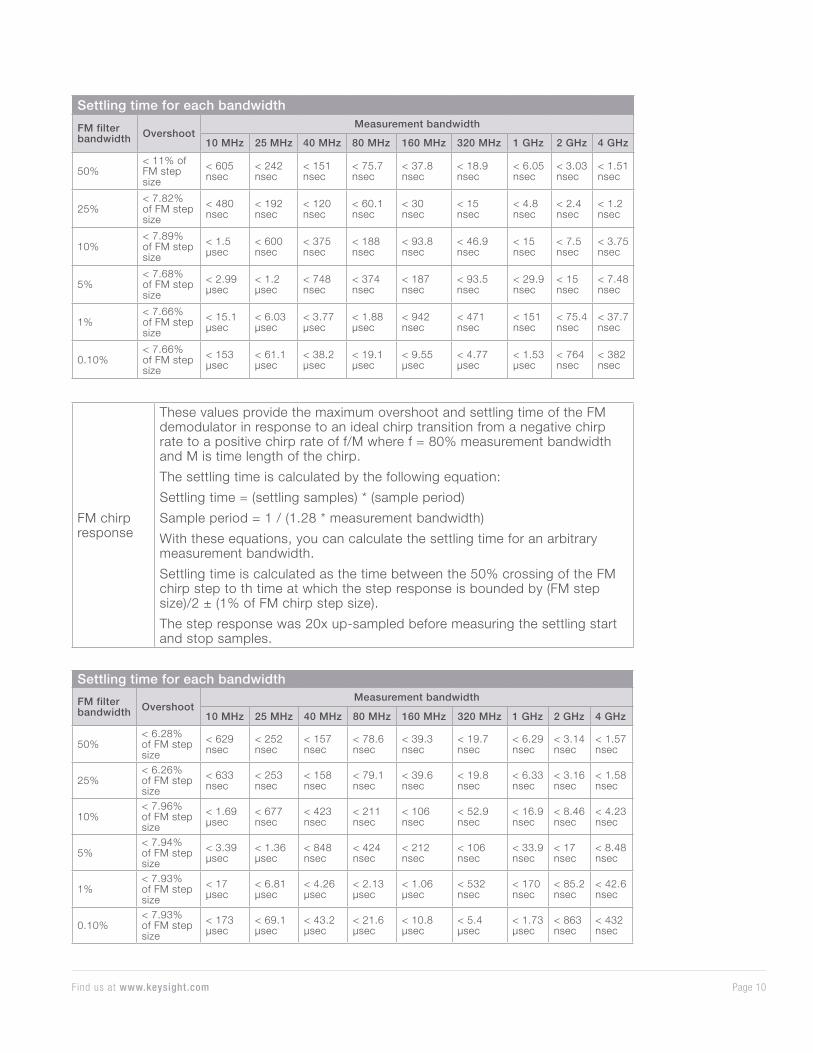
FM step response
These values provide the maximum overshoot and settling time of the FM demodulator in response to an ideal frequency step. The step size is 80% of the measurement bandwidth. The settling time is calculated using the following equation:
Settling time = (settling samples) * (sample period)
Sample period = 1 / (1.28 * measurement bandwidth)
With these equations, you can calculate the settling time for an arbitrary measurement bandwidth.
Settling time is calculated as the time between the 50% crossing of the FM step and the time at which the step response is bounded by (FM step size)/2 ± (1% of the step size).
The step response was 20x up-sampled before measuring the settling start and stop samples.
1. Data subject to change.
2. Frequency mask is included with RT1 and RT2 real-time spectrum analysis l icenses. It works with UXA, PXA, and MXA X-Series signal analyzers with required hardware. Refer to instrument configuration guides for more deta.
Page 10Find us at www.keysight.com
Settling time for each bandwidth
FM filter bandwidth Overshoot
Measurement bandwidth
10 MHz 25 MHz 40 MHz 80 MHz 160 MHz 320 MHz 1 GHz 2 GHz 4 GHz
50%< 11% of FM step size
< 605 nsec
< 242 nsec
< 151 nsec
< 75.7 nsec
< 37.8 nsec
< 18.9 nsec
< 6.05 nsec
< 3.03 nsec
< 1.51 nsec
25%< 7.82% of FM step size
< 480 nsec
< 192 nsec
< 120 nsec
< 60.1 nsec
< 30 nsec
< 15 nsec
< 4.8 nsec
< 2.4 nsec
< 1.2 nsec
10%< 7.89% of FM step size
< 1.5 µsec
< 600 nsec
< 375 nsec
< 188 nsec
< 93.8 nsec
< 46.9 nsec
< 15 nsec
< 7.5 nsec
< 3.75 nsec
5%< 7.68% of FM step size
< 2.99 µsec
< 1.2 µsec
< 748 nsec
< 374 nsec
< 187 nsec
< 93.5 nsec
< 29.9 nsec
< 15 nsec
< 7.48 nsec
1%< 7.66% of FM step size
< 15.1 µsec
< 6.03 µsec
< 3.77 µsec
< 1.88 µsec
< 942 nsec
< 471 nsec
< 151 nsec
< 75.4 nsec
< 37.7 nsec
0.10%< 7.66% of FM step size
< 153 µsec
< 61.1 µsec
< 38.2 µsec
< 19.1 µsec
< 9.55 µsec
< 4.77 µsec
< 1.53 µsec
< 764 nsec
< 382 nsec
FM chirp response
These values provide the maximum overshoot and settling time of the FM demodulator in response to an ideal chirp transition from a negative chirp rate to a positive chirp rate of f/M where f = 80% measurement bandwidth and M is time length of the chirp.
The settling time is calculated by the following equation:
Settling time = (settling samples) * (sample period)
Sample period = 1 / (1.28 * measurement bandwidth)
With these equations, you can calculate the settling time for an arbitrary measurement bandwidth.
Settling time is calculated as the time between the 50% crossing of the FM chirp step to th time at which the step response is bounded by (FM step size)/2 ± (1% of FM chirp step size).
The step response was 20x up-sampled before measuring the settling start and stop samples.
Settling time for each bandwidth
FM filter bandwidth Overshoot
Measurement bandwidth
10 MHz 25 MHz 40 MHz 80 MHz 160 MHz 320 MHz 1 GHz 2 GHz 4 GHz
50%< 6.28% of FM step size
< 629 nsec
< 252 nsec
< 157 nsec
< 78.6 nsec
< 39.3 nsec
< 19.7 nsec
< 6.29 nsec
< 3.14 nsec
< 1.57 nsec
25%< 6.26% of FM step size
< 633 nsec
< 253 nsec
< 158 nsec
< 79.1 nsec
< 39.6 nsec
< 19.8 nsec
< 6.33 nsec
< 3.16 nsec
< 1.58 nsec
10%< 7.96% of FM step size
< 1.69 µsec
< 677 nsec
< 423 nsec
< 211 nsec
< 106 nsec
< 52.9 nsec
< 16.9 nsec
< 8.46 nsec
< 4.23 nsec
5%< 7.94% of FM step size
< 3.39 µsec
< 1.36 µsec
< 848 nsec
< 424 nsec
< 212 nsec
< 106 nsec
< 33.9 nsec
< 17 nsec
< 8.48 nsec
1%< 7.93% of FM step size
< 17 µsec
< 6.81 µsec
< 4.26 µsec
< 2.13 µsec
< 1.06 µsec
< 532 nsec
< 170 nsec
< 85.2 nsec
< 42.6 nsec
0.10%< 7.93% of FM step size
< 173 µsec
< 69.1 µsec
< 43.2 µsec
< 21.6 µsec
< 10.8 µsec
< 5.4 µsec
< 1.73 µsec
< 863 nsec
< 432 nsec
Page 11Find us at www.keysight.com
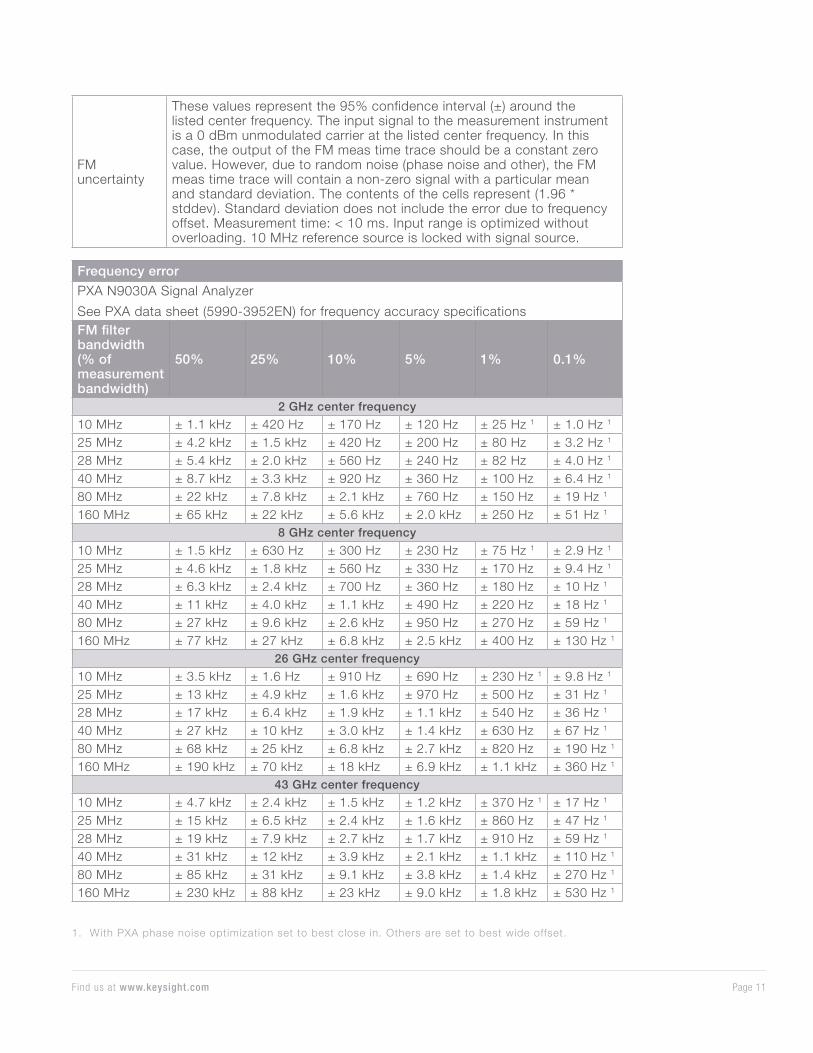
FM uncertainty
These values represent the 95% confidence interval (±) around the listed center frequency. The input signal to the measurement instrument is a 0 dBm unmodulated carrier at the listed center frequency. In this case, the output of the FM meas time trace should be a constant zero value. However, due to random noise (phase noise and other), the FM meas time trace will contain a non-zero signal with a particular mean and standard deviation. The contents of the cells represent (1.96 * stddev). Standard deviation does not include the error due to frequency offset. Measurement time: < 10 ms. Input range is optimized without overloading. 10 MHz reference source is locked with signal source.
Frequency error
PXA N9030A Signal Analyzer
See PXA data sheet (5990-3952EN) for frequency accuracy specificationsFM filter bandwidth (% of measurement bandwidth)
50% 25% 10% 5% 1% 0.1%
2 GHz center frequency
10 MHz ± 1.1 kHz ± 420 Hz ± 170 Hz ± 120 Hz ± 25 Hz 1 ± 1.0 Hz 1
25 MHz ± 4.2 kHz ± 1.5 kHz ± 420 Hz ± 200 Hz ± 80 Hz ± 3.2 Hz 1
28 MHz ± 5.4 kHz ± 2.0 kHz ± 560 Hz ± 240 Hz ± 82 Hz ± 4.0 Hz 1
40 MHz ± 8.7 kHz ± 3.3 kHz ± 920 Hz ± 360 Hz ± 100 Hz ± 6.4 Hz 1
80 MHz ± 22 kHz ± 7.8 kHz ± 2.1 kHz ± 760 Hz ± 150 Hz ± 19 Hz 1
160 MHz ± 65 kHz ± 22 kHz ± 5.6 kHz ± 2.0 kHz ± 250 Hz ± 51 Hz 1
8 GHz center frequency
10 MHz ± 1.5 kHz ± 630 Hz ± 300 Hz ± 230 Hz ± 75 Hz 1 ± 2.9 Hz 1
25 MHz ± 4.6 kHz ± 1.8 kHz ± 560 Hz ± 330 Hz ± 170 Hz ± 9.4 Hz 1
28 MHz ± 6.3 kHz ± 2.4 kHz ± 700 Hz ± 360 Hz ± 180 Hz ± 10 Hz 1
40 MHz ± 11 kHz ± 4.0 kHz ± 1.1 kHz ± 490 Hz ± 220 Hz ± 18 Hz 1
80 MHz ± 27 kHz ± 9.6 kHz ± 2.6 kHz ± 950 Hz ± 270 Hz ± 59 Hz 1
160 MHz ± 77 kHz ± 27 kHz ± 6.8 kHz ± 2.5 kHz ± 400 Hz ± 130 Hz 1
26 GHz center frequency
10 MHz ± 3.5 kHz ± 1.6 Hz ± 910 Hz ± 690 Hz ± 230 Hz 1 ± 9.8 Hz 1
25 MHz ± 13 kHz ± 4.9 kHz ± 1.6 kHz ± 970 Hz ± 500 Hz ± 31 Hz 1
28 MHz ± 17 kHz ± 6.4 kHz ± 1.9 kHz ± 1.1 kHz ± 540 Hz ± 36 Hz 1
40 MHz ± 27 kHz ± 10 kHz ± 3.0 kHz ± 1.4 kHz ± 630 Hz ± 67 Hz 1
80 MHz ± 68 kHz ± 25 kHz ± 6.8 kHz ± 2.7 kHz ± 820 Hz ± 190 Hz 1
160 MHz ± 190 kHz ± 70 kHz ± 18 kHz ± 6.9 kHz ± 1.1 kHz ± 360 Hz 1
43 GHz center frequency
10 MHz ± 4.7 kHz ± 2.4 kHz ± 1.5 kHz ± 1.2 kHz ± 370 Hz 1 ± 17 Hz 1
25 MHz ± 15 kHz ± 6.5 kHz ± 2.4 kHz ± 1.6 kHz ± 860 Hz ± 47 Hz 1
28 MHz ± 19 kHz ± 7.9 kHz ± 2.7 kHz ± 1.7 kHz ± 910 Hz ± 59 Hz 1
40 MHz ± 31 kHz ± 12 kHz ± 3.9 kHz ± 2.1 kHz ± 1.1 kHz ± 110 Hz 1
80 MHz ± 85 kHz ± 31 kHz ± 9.1 kHz ± 3.8 kHz ± 1.4 kHz ± 270 Hz 1
160 MHz ± 230 kHz ± 88 kHz ± 23 kHz ± 9.0 kHz ± 1.8 kHz ± 530 Hz 1
1. With PXA phase noise optimization set to best close in. Others are set to best wide offset.
Page 12Find us at www.keysight.com
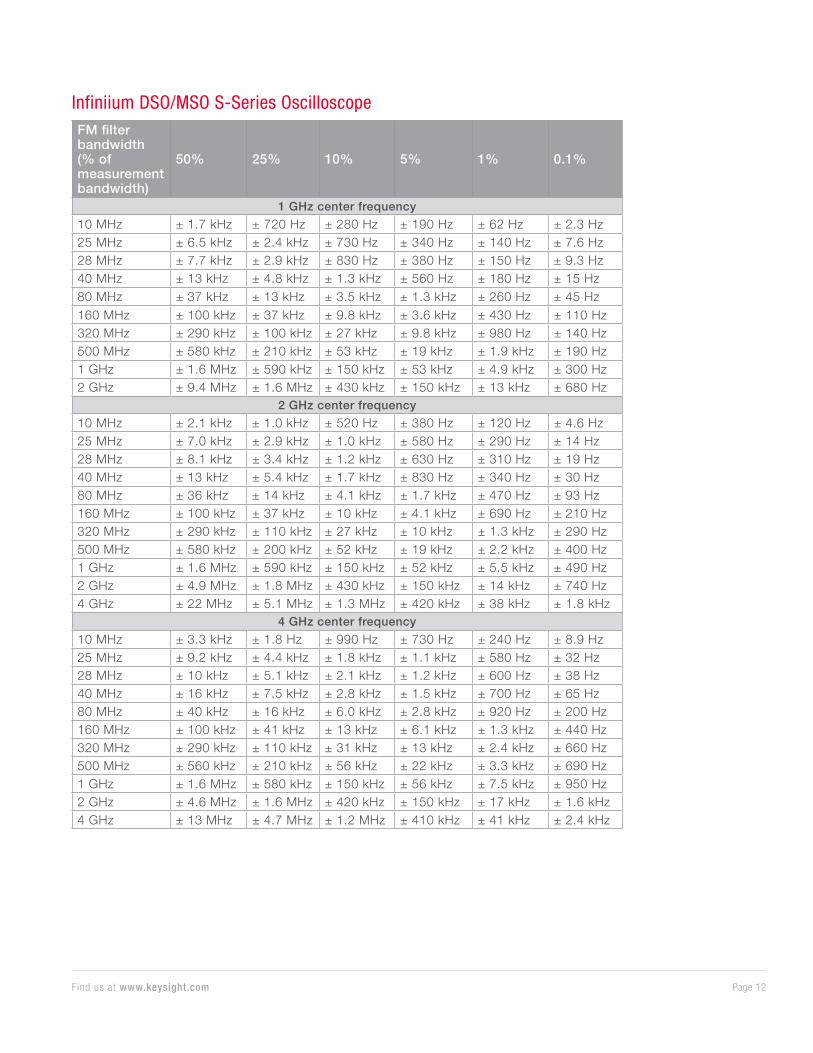
Infiniium DSO/MSO S-Series OscilloscopeFM filter bandwidth (% of measurement bandwidth)
50% 25% 10% 5% 1% 0.1%
1 GHz center frequency
10 MHz ± 1.7 kHz ± 720 Hz ± 280 Hz ± 190 Hz ± 62 Hz ± 2.3 Hz25 MHz ± 6.5 kHz ± 2.4 kHz ± 730 Hz ± 340 Hz ± 140 Hz ± 7.6 Hz28 MHz ± 7.7 kHz ± 2.9 kHz ± 830 Hz ± 380 Hz ± 150 Hz ± 9.3 Hz40 MHz ± 13 kHz ± 4.8 kHz ± 1.3 kHz ± 560 Hz ± 180 Hz ± 15 Hz80 MHz ± 37 kHz ± 13 kHz ± 3.5 kHz ± 1.3 kHz ± 260 Hz ± 45 Hz160 MHz ± 100 kHz ± 37 kHz ± 9.8 kHz ± 3.6 kHz ± 430 Hz ± 110 Hz320 MHz ± 290 kHz ± 100 kHz ± 27 kHz ± 9.8 kHz ± 980 Hz ± 140 Hz500 MHz ± 580 kHz ± 210 kHz ± 53 kHz ± 19 kHz ± 1.9 kHz ± 190 Hz1 GHz ± 1.6 MHz ± 590 kHz ± 150 kHz ± 53 kHz ± 4.9 kHz ± 300 Hz2 GHz ± 9.4 MHz ± 1.6 MHz ± 430 kHz ± 150 kHz ± 13 kHz ± 680 Hz
2 GHz center frequency
10 MHz ± 2.1 kHz ± 1.0 kHz ± 520 Hz ± 380 Hz ± 120 Hz ± 4.6 Hz25 MHz ± 7.0 kHz ± 2.9 kHz ± 1.0 kHz ± 580 Hz ± 290 Hz ± 14 Hz28 MHz ± 8.1 kHz ± 3.4 kHz ± 1.2 kHz ± 630 Hz ± 310 Hz ± 19 Hz40 MHz ± 13 kHz ± 5.4 kHz ± 1.7 kHz ± 830 Hz ± 340 Hz ± 30 Hz80 MHz ± 36 kHz ± 14 kHz ± 4.1 kHz ± 1.7 kHz ± 470 Hz ± 93 Hz160 MHz ± 100 kHz ± 37 kHz ± 10 kHz ± 4.1 kHz ± 690 Hz ± 210 Hz320 MHz ± 290 kHz ± 110 kHz ± 27 kHz ± 10 kHz ± 1.3 kHz ± 290 Hz500 MHz ± 580 kHz ± 200 kHz ± 52 kHz ± 19 kHz ± 2.2 kHz ± 400 Hz1 GHz ± 1.6 MHz ± 590 kHz ± 150 kHz ± 52 kHz ± 5.5 kHz ± 490 Hz2 GHz ± 4.9 MHz ± 1.8 MHz ± 430 kHz ± 150 kHz ± 14 kHz ± 740 Hz4 GHz ± 22 MHz ± 5.1 MHz ± 1.3 MHz ± 420 kHz ± 38 kHz ± 1.8 kHz
4 GHz center frequency
10 MHz ± 3.3 kHz ± 1.8 Hz ± 990 Hz ± 730 Hz ± 240 Hz ± 8.9 Hz25 MHz ± 9.2 kHz ± 4.4 kHz ± 1.8 kHz ± 1.1 kHz ± 580 Hz ± 32 Hz28 MHz ± 10 kHz ± 5.1 kHz ± 2.1 kHz ± 1.2 kHz ± 600 Hz ± 38 Hz40 MHz ± 16 kHz ± 7.5 kHz ± 2.8 kHz ± 1.5 kHz ± 700 Hz ± 65 Hz80 MHz ± 40 kHz ± 16 kHz ± 6.0 kHz ± 2.8 kHz ± 920 Hz ± 200 Hz160 MHz ± 100 kHz ± 41 kHz ± 13 kHz ± 6.1 kHz ± 1.3 kHz ± 440 Hz320 MHz ± 290 kHz ± 110 kHz ± 31 kHz ± 13 kHz ± 2.4 kHz ± 660 Hz500 MHz ± 560 kHz ± 210 kHz ± 56 kHz ± 22 kHz ± 3.3 kHz ± 690 Hz1 GHz ± 1.6 MHz ± 580 kHz ± 150 kHz ± 56 kHz ± 7.5 kHz ± 950 Hz2 GHz ± 4.6 MHz ± 1.6 MHz ± 420 kHz ± 150 kHz ± 17 kHz ± 1.6 kHz4 GHz ± 13 MHz ± 4.7 MHz ± 1.2 MHz ± 410 kHz ± 41 kHz ± 2.4 kHz
Page 13Find us at www.keysight.com
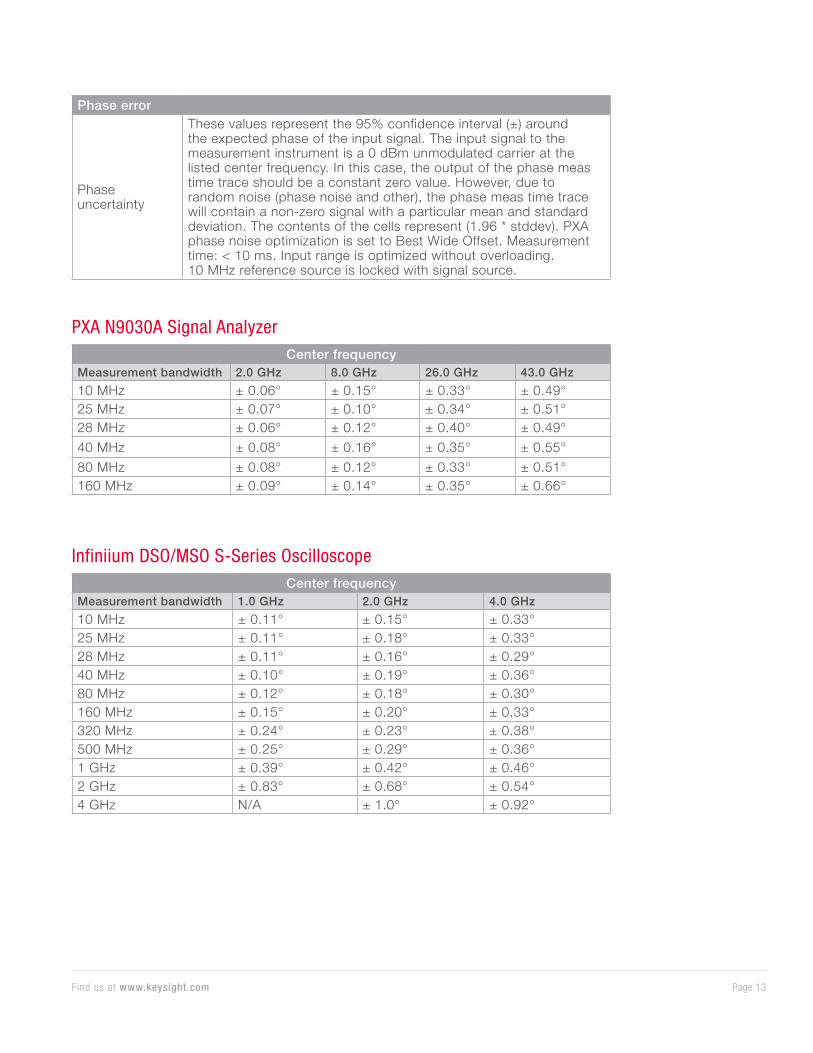
Phase error
Phase uncertainty
These values represent the 95% confidence interval (±) around the expected phase of the input signal. The input signal to the measurement instrument is a 0 dBm unmodulated carrier at the listed center frequency. In this case, the output of the phase meas time trace should be a constant zero value. However, due to random noise (phase noise and other), the phase meas time trace will contain a non-zero signal with a particular mean and standard deviation. The contents of the cells represent (1.96 * stddev). PXA phase noise optimization is set to Best Wide Offset. Measurement time: < 10 ms. Input range is optimized without overloading. 10 MHz reference source is locked with signal source.
Infiniium DSO/MSO S-Series OscilloscopeCenter frequency
Measurement bandwidth 1.0 GHz 2.0 GHz 4.0 GHz
10 MHz ± 0.11° ± 0.15° ± 0.33°25 MHz ± 0.11° ± 0.18° ± 0.33°28 MHz ± 0.11° ± 0.16° ± 0.29°40 MHz ± 0.10° ± 0.19° ± 0.36°80 MHz ± 0.12° ± 0.18° ± 0.30°160 MHz ± 0.15° ± 0.20° ± 0.33°320 MHz ± 0.24° ± 0.23° ± 0.38°500 MHz ± 0.25° ± 0.29° ± 0.36°1 GHz ± 0.39° ± 0.42° ± 0.46°2 GHz ± 0.83° ± 0.68° ± 0.54°4 GHz N/A ± 1.0° ± 0.92°
PXA N9030A Signal AnalyzerCenter frequency
Measurement bandwidth 2.0 GHz 8.0 GHz 26.0 GHz 43.0 GHz
10 MHz ± 0.06° ± 0.15° ± 0.33° ± 0.49°25 MHz ± 0.07° ± 0.10° ± 0.34° ± 0.51°28 MHz ± 0.06° ± 0.12° ± 0.40° ± 0.49°
40 MHz ± 0.08° ± 0.16° ± 0.35° ± 0.55°
80 MHz ± 0.08° ± 0.12° ± 0.33° ± 0.51°160 MHz ± 0.09° ± 0.14° ± 0.35° ± 0.66°

Page 14Find us at www.keysight.com
Ordering InformationSoftware licensing and configuration
Flexible licensing and configuration
• Perpetual: License can be used in perpetuity.
• Time-based: License is time limited to a defined period, such as 12-months.
• Node-locked: Allows you to use the license on one specified instrument/computer.
• Transportable: Allows you to use the license on one instrument/computer at a time. This license may be transferred to another instrument/computer using Keysight’s online tool.
• Floating: Allows you to access the license on networked instruments/computers from a server, one at a time. For concurrent access, multiple licenses may be purchased.
• USB portable: Allows you to move the license from one instrument/computer to another by end-user only with certified USB dongle, purchased separately.
• Software support subscription: Allows the license holder access to Keysight technical support and all software upgrades
Basic vector signal analysis and hardware connectivity (89601200C) (required)
FMCW Radar Analysis (89601BHPC)
Software license type Software license Support subscriptionNode-locked perpetual R-Y5A-001-A R-Y6A-001-z 2
Node-locked time-based R-Y4A-001-z 1 IncludedTransportable perpetual R-Y5A-004-D R-Y6A-004-z 2
Transportable time-based R-Y4A-004-z 1 IncludedFloating perpetual (single site) R-Y5A-002-B R-Y6A-002-z 2
Floating time-based (single site) R-Y4A-002-z 1 IncludedFloating perpetual (regional) R-Y5A-006-F R-Y6A-006-z 2
Floating time-based (regional) R-Y4A-006-z 1 IncludedFloating perpetual (worldwide) R-Y5A-010-J R-Y6A-010-z 2
Floating time-based (worldwide) R-Y4A-010-z 1 IncludedUSB portable perpetual R-Y5A-005-E R-Y6A-005-z 2
USB portable time-based R-Y4A-005-z 1 Included
1. z means different time-based license duration. F for six months, L for 12 months, X for 24 months, and Y for 36 months. All time-based licenses have included the support subscription same as the time-base duration.
2. z means different support subscription duration. L for 12 months (as default), X for 24 months, Y for 36 months, and Z for 60-months. Support subscription must be purchased for all perpetual l icenses with 12-months as the default. All software upgrades and KeysightCare support are provided for software l icenses with valid support subscription.
Page 15This information is subject to change without notice. © Keysight Technologies, 2019, Published in USA, August 27, 2019, 5992-4216EN
Find us at www.keysight.com
Learn more at: www.keysight.com
For more information on Keysight Technologies’ products, applications or services,
please contact your local Keysight office. The complete list is available at:
www.keysight.com/find/contactus
Upgrade your 89600 VSA software up to date (89601B to 89601C)Keysight now launches the totally new 89600 VSA software as 89601C after
September 2019 as version 2019 update 1.0, the existing 89601B customers can
continue to use the new 89601C software with valid licenses or can visit the Keysight
software upgrade webpage to fill in their current 89601B software license information
and get a quote for upgrading from 89601B licenses to 89601C licenses.
https://upgrade.software.keysight.com/software_upgrade_form.html
Additional Information• 89600 VSA Software, Brochure, literature number 5990-6553EN
• 89600 VSA Software, Configuration Guide, literature number 5990-6386EN
• 89600 VSA Software Pulse analysis Option 89601BHQC, Technical Overview, 5998-4197EN
Web • www.keysight.com/find/89600vsa
• www.keysight.com/find/vsa_trial
You can upgrade!All 89600 VSA Software options can be added after your initial
purchase and are license-key enabled. For more information
please refer to www.keysight.com/find/89600B_upgrades


