Download - Fluorescence & UV- Visible Workshop
Fluorescence & UV- Visible Workshop
Simple Applications to Sophisticated Analyses
Why UV-Vis and Fluorescence?
• Quantitative measurements in solutions and solids
• Quality assurance and quality control (QA/QC)• Sensitivity to the ppm levely pp
• Full spectrum data for troubleshooting samples and method development
• Performance of windows and optics• Diffuse and specular reflectance
• Integrating sphere detectors for scattering and non-planar samples
• Probe the electronic structure of organic and inorganic solids
• Fluorescence spectroscopy extends capability
2
p py p y• Measure your sample, not the matrix
• Linear measurements from percent to ppb
• Complimentary information to UV-Vis and FT-IR

Fluorescence Spectroscopy
High resolution and sensitivity provide a new window to your samples
Benefits of Fluorescence Spectroscopy
• Fluorescence is by far the most sensitive of all the molecular spectroscopy techniques
• Dramatically lower background compared to absorbance tmeasurements
• Only technique with the ability to move from ensemble averaging to single-molecule analysis
4

• Double monochromator• Excitiation light
• Emission light
Hardware Overview
• High resolution 0.5 nm spectral bandwidth
• Coated optics and holographic gratingsincrease sensitivity
• Fast scanning drive
• Stable and powerful xenon lamp
• Accessories that enableeasy sample measurements
5
easy sample measurements
• Software modules customized for your application
Extreme Sensitivity
• Lumina detect concentrations as low as 60 femtomolar• This is around 100 molecules!
• Low background provides a large linear range for concentration measurements
• Small volume cells allow low volumes to be measured
ence
cen
ce
6
500 525 550 575
Flu
ore
sce
Wavelength
Flu
ore
sc
Concentration

3D Scanning Provides Molecular Fingerprints
• By collecting many emission spectra, 3D fluorescence maps can be assembled
• 3D maps can identify:• Hydrocarbon samples in water
• Drugs of abuse
• Dyes, inks, and additives
• Luminous software has powerful datavisualization tools
7
Powerful 3D Graphics
8

Fluorescence Characterizes Solid Samples
• Fast changes (~ 20 µs) in luminescence intensitycan be measured with the Lumina
• Optical components used in OLEDs and hi h l ti di l d thi d t thigh-resolution displays need this data toensure a crisp, clear picture is produced OLED displays
9
UV-Visible Spectroscopy For Materials Science

Transmittance Optics
Plano Pieces at normal or variable angle
11
Solar Cell and Display Windows
• Measure transmittance from 190nm to 1100nm at all viewing or illumination angles
• Fast, precise, simple
12

• Compound or curved optics with the Diffuse Transmittance Accessory• Magnetic base-plate drilled and scored like a laser table
• Integrating sphere detector is immune to changes of beam shape and focus
Transmittance Optics
13
Specular Reflectance Optics
• How reflective is a mirror?
• Does it reflect in the UV?
• How effective is the AR coating on a piece of glass?
D it i “t ” l ?• Does it give “true” color?
• Is one mirror “brighter” than another
14
Cold mirror lighting reflector

Application Focus - Dental Mirrors
• Red is rhodium dental mirror
• Green is new dental mirror
• Black is a reference mirror specified at 91% absolute reflectivity at 500 nm
• Measurements done on
15
Measurements done on 30° reflectance accessory
Specular Reflectance Measurements
• Evolution 220, 300, 600• High precision and accuracy
• High resolution with SBW to 0.2nm
Large variety of other accessories• Large variety of other accessories
• Evolution Array• Convenience and speed
VeeMAX 60° SpecCold Mirror
16
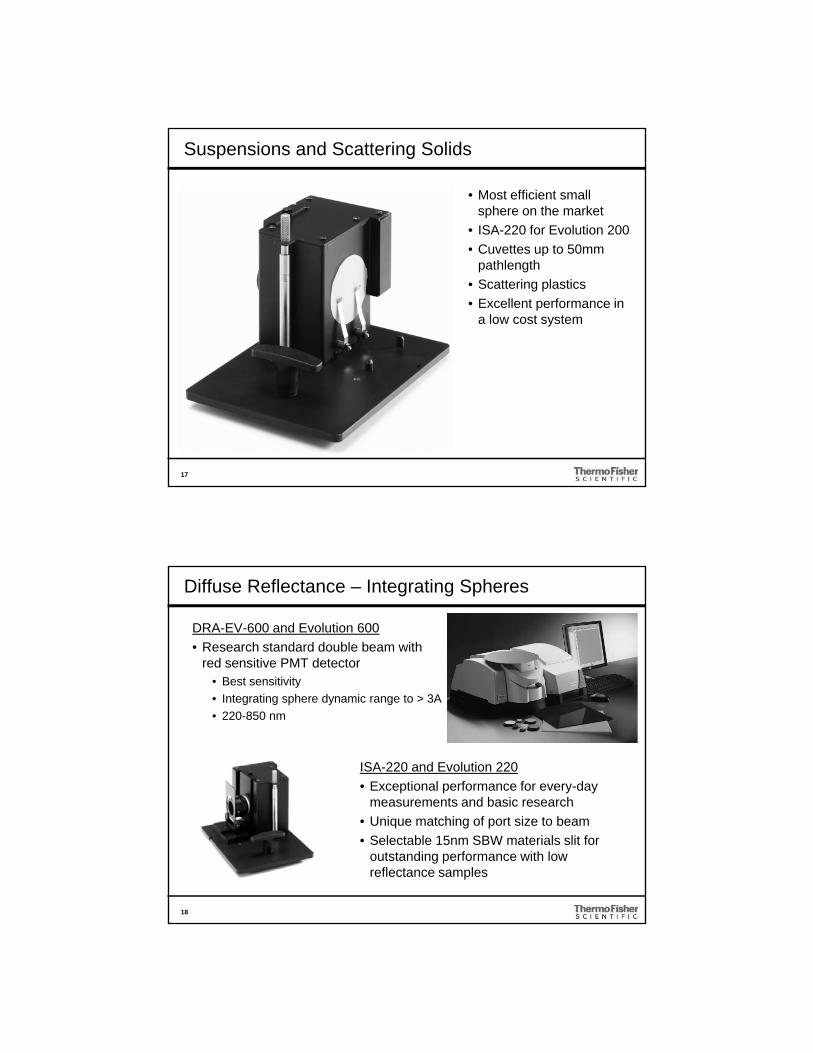
Suspensions and Scattering Solids
• Most efficient small sphere on the market
• ISA-220 for Evolution 200
• Cuvettes up to 50mm• Cuvettes up to 50mm pathlength
• Scattering plastics
• Excellent performance in a low cost system
17
Diffuse Reflectance – Integrating Spheres
DRA-EV-600 and Evolution 600
• Research standard double beam with red sensitive PMT detector
• Best sensitivityBest sensitivity
• Integrating sphere dynamic range to > 3A
• 220-850 nm
ISA-220 and Evolution 220
• Exceptional performance for every-day measurements and basic research
18
measurements and basic research
• Unique matching of port size to beam
• Selectable 15nm SBW materials slit for outstanding performance with low reflectance samples

Small Volume Powder Measurements
• The Praying Mantis DRA uses Al optics and can measure down to 190nm
• Ideal for band gap studies at very short and volumes
• Small sample cup holds 0.021 cm3
• Large sample cup holds
19
Large sample cup holds 0.236 cm3
Band-gap Measurement on Semiconductor Powders
20

Oxidation Reaction MonitoringProf. Huifang Xu, University of Wisconsin – Madison
Fe(III)-based Nano-plate Sample Band Gap of Metal Complex
These featuresnot visible insolution spectra
21
Partially Reduced Reaction Product
Evolution 300/600 Praying Mantis Catalysis Systems
• UV-Vis Reflectance studies
• Coking• Build-up of carbon on the
surface
• Reduction of the surface
• Electronic structure of the surface of the catalyst
22
Same Praying Mantis accessory used for UV-Vis and FTIROnly change the baseplate and optical windows!
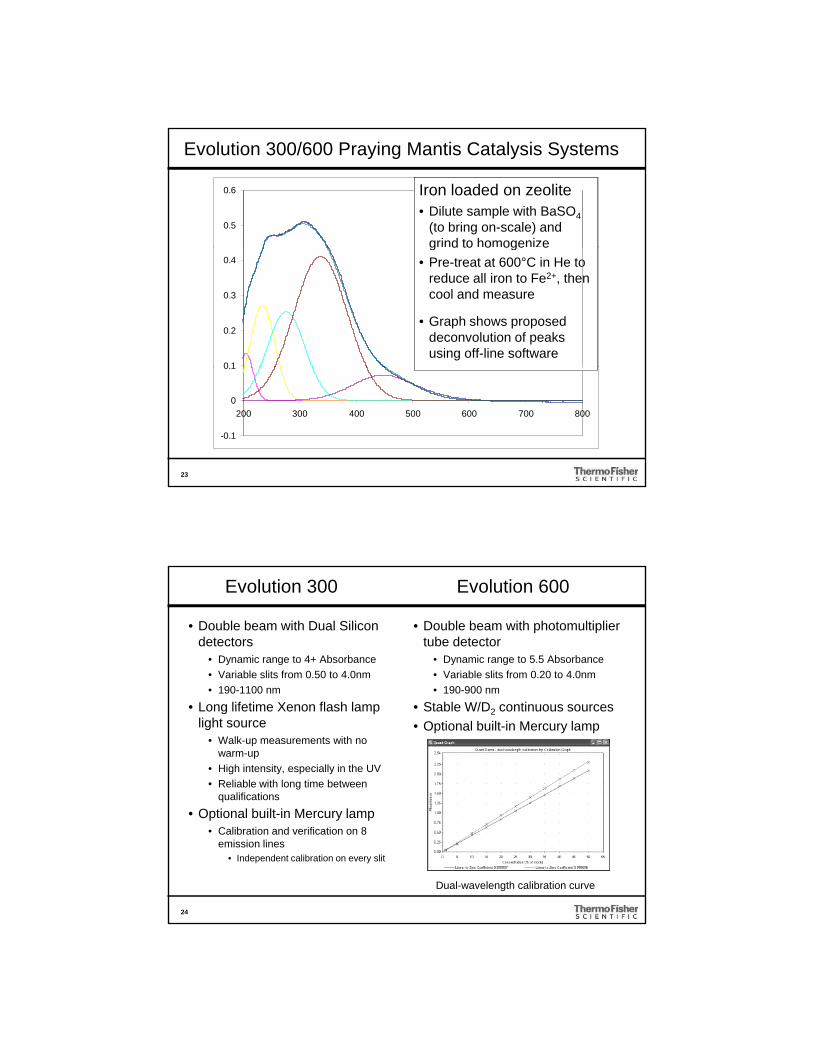
Evolution 300/600 Praying Mantis Catalysis Systems
0.5
0.6
S4 1:3
1. Peak
Iron loaded on zeolite• Dilute sample with BaSO4
(to bring on-scale) and grind to homogenize
0 1
0.2
0.3
0.4 2. Peak
3. Peak
5. Peak
4. Peak
Summe
g d to o oge e
• Pre-treat at 600°C in He to reduce all iron to Fe2+, then cool and measure
• Graph shows proposed deconvolution of peaks using off-line software
23
-0.1
0
0.1
200 300 400 500 600 700 800
Evolution 300 Evolution 600
• Double beam with Dual Silicon detectors
• Dynamic range to 4+ Absorbance
• Variable slits from 0.50 to 4.0nm
• Double beam with photomultiplier tube detector
• Dynamic range to 5.5 Absorbance
• Variable slits from 0.20 to 4.0nm
• 190-1100 nm
• Long lifetime Xenon flash lamp light source
• Walk-up measurements with no warm-up
• High intensity, especially in the UV
• Reliable with long time between qualifications
• 190-900 nm
• Stable W/D2 continuous sources
• Optional built-in Mercury lamp
24
• Optional built-in Mercury lamp• Calibration and verification on 8
emission lines• Independent calibration on every slit
Dual-wavelength calibration curve
Evolution Array UV-Vis Spectrometer
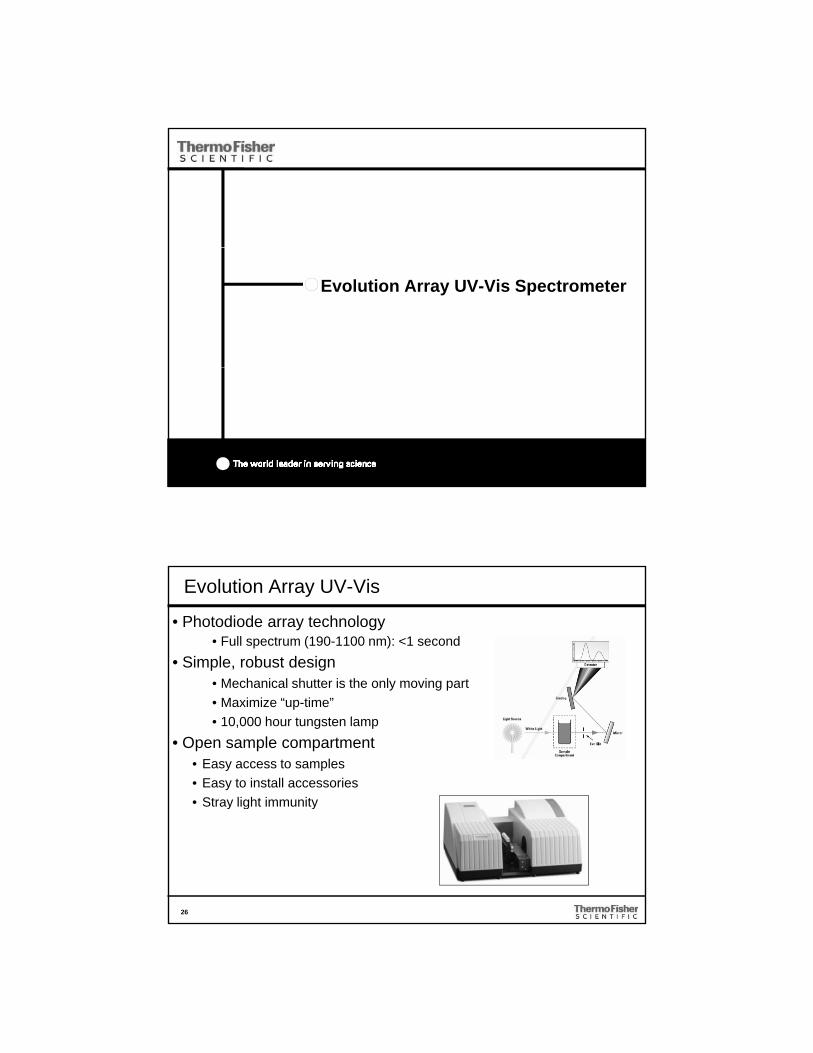
Evolution Array UV-Vis
• Photodiode array technology• Full spectrum (190-1100 nm): <1 second
• Simple, robust design• Mechanical shutter is the only moving partMechanical shutter is the only moving part
• Maximize “up-time”
• 10,000 hour tungsten lamp
• Open sample compartment• Easy access to samples
• Easy to install accessories
• Stray light immunity
26
Stray light immunity

Full-Spectrum Analysis
Full-Spectrum on Every Sample, Every Time
• Never need to recollect data because you chose the wrong wavelength• Change analysis wavelength AFTER data is collectedg y g
• Improved troubleshooting of out-of-specification samples• Failing samples must be investigated to determine the cause• Spectrum holds more information than a single
wavelength measurement
• Analytical Method Development
27
Evolution 200 Series UV-Vis Spectrophotometers
Evolution 201, 220 and Evolution 260Bio

Evolution 200 Series
• New Double beam long lifetime Xenon system with Dual Silicon detectors• Fast scanning double beam at 6000 nm/min
• Fast Kinetics at 100 data points/sec
• AFBG technology- Application Focused Beam Geometry• Match resolution to the application
• Local control option with color touch screen
• Optional Mercury lamp• Wavelength calibration and verification
• New generation INSIGHT software
N i C i d U E i (CUE)
29
• New generation Customized User Environment (CUE)• Create dedicated application analyzers using local
language prompts
• Patent pending
INSIGHT and CUE: A Revolution in Software
• Re-defined applications layered so the commonly used tasks are straightforward
• Intuitive graphics and setup “wizards” guide user through traditional UV-Vis applications –Redefining Traditional UV-Vis Applications in QA/QC
30
• CUE creates completely customized interface – giving you the simplicity of a dedicated analyzer for your measurements

What is CUE?
• Customized User Environment software
• A tool for customizing the user interface to run routine methods through the creation of scripts
• Script = set of actions that tells the software what to do and how to do it using a workflow diagram
• Automates and simplifies
31
• Automates and simplifies analyses by transforming multi-step workflows into one easy-to-follow method
Cue in Action
32

Summary
• Quantitative measurement solutions for all sample types
• High sensitivity measurements and straightforward software for QA/QC
• High performance reflectance accessories for the optics industry
• Access to band-gap information in semiconductor materials
• FT-IR like convenience and speed for full spectrum analysis with the Evolution Array spectrophotometer
33
y y p p
• High specificity in fluorescence measurements on any sample


